Review

Critical Assessment of Feed-In Tariffs and Solar Photovoltaic Development in Vietnam

by
Hang Thi-Thuy Le
1,2,
Eleonora Riva Sanseverino
1,*,
Dinh-Quang Nguyen
2,
Maria Luisa Di Silvestre
1,
Salvatore Favuzza
1 and
Manh-Hai Pham
3
1
Department of Engineering, University of Palermo, 90128 Palermo, Italy
2
Institute of Energy Science, Vietnam Academy of Science and Technology, Hanoi 11307, Vietnam
3
Faculty of Electrical Engineering, Electric Power University, Ministry of Industry and Trade, Hanoi 11917, Vietnam
*
Author to whom correspondence should be addressed.
Energies 2022, 15(2), 556; https://doi.org/10.3390/en15020556
Submission received: 17 November 2021 / Revised: 14 December 2021 / Accepted: 4 January 2022 / Published: 13 January 2022
(This article belongs to the Collection Women's Research in Smart Energy Systems)

Abstract

:
Vietnam became the world’s third largest market for solar photovoltaic energy in 2020. Especially after the Vietnamese government issued feed-in tariffs for grid-connected solar photovoltaic systems, the installed capacity of solar photovoltaic applications exploded in 2019. From studies carried out in the relevant literature, it can be said that support policies are highly important for the initial development of the renewable energy industry in most countries. This is especially true in emerging countries such as Vietnam. This paper reviews the feed-in tariffs issued and deployed in different regions of Vietnam for grid-connected solar photovoltaic applications. Moreover, the paper takes a closer look at the costs of electricity production from these systems in relation to the feed-in tariffs issued in Vietnam. The results show that the gap between the levelized cost of electricity and the feed-in tariff for solar photovoltaic electricity is relatively high, particularly in regions with a lower irradiation potential.

Graphical Abstract

1. Introduction

In recent years, solar photovoltaic (PV) energy has grown rapidly and strongly among renewable energy sources (RES) worldwide [1,2,3]. Demand for solar PV is increasing and expanding in many countries around the world, including residential and commercial applications. By 2020, the worldwide installed capacity of solar PV reached 760 GWp, with major growth in the three markets of China, the United States, and Vietnam; see Figure 1 and Figure 2 [2,3,4]. Despite the pandemic of Coronavirus disease 2019 (COVID-19), solar power has continued growing sharply, with 140 MW new capacity added in 2020. In some countries, solar PV plays an important role in meeting domestic electricity demand with a coverage of 9.4% in Italy, 10.5% in Germany, 9.8% in Chile, 9.9% in Australia, 8.5% in Japan, and over 8% in Vietnam.
Vietnam is an emerging country for solar PV installation, but it made a spectacular breakthrough in 2019 with a growth jump of 45 times compared to the total installed capacity in 2018, and by 2.3 times in 2020 [3,4]. Similar to other countries, Vietnam is interested in solar PV mainly to meet the current increased electricity demand of up to 10% per year, as well as to ensure energy security and meet the criteria of reducing emissions.
Promoting the development of RES, including solar PV, is necessary in the current context of severe global climate change and the requirement for energy security and sustainable development [5]. This is also in line with the spirit of the Kyoto Protocol in 1997, which is to limit or reduce greenhouse gas (GHG) emissions in human activities of production, transportation, and consumption of energy [6]. Accordingly, the issues of improving energy efficiency and promoting and increasing use of RES were mentioned. Limiting and reducing emissions in energy production, transportation, and distribution is also an important element in the Kyoto Protocol. In addition, the shift from fossil fuels to RES to cut indirect emissions is also well suited to the targets negotiated in the United Nations Framework Convention on Climate Change at at the 21st meeting of the Conference of the Parties (COP21) and the 26th meeting of the Conference of the Parties (COP26) [7,8].
Furthermore, the competitiveness of solar PV in terms of levelized cost of electricity (LCOE) is also a driving force behind investment in plants installations. In 2020, the LCOE of solar PV fell the most among RES; see Figure 3 [9,10]. Specifically, the global weighted-average LCOE of solar PV in 2020 had decreased by 85% compared to 2010 and by 7% compared to 2019. The country-level weighted-average LCOE of utility-scale solar PV declined between 72% and 87% between 2010 and 2020, depending on the country. In Vietnam, the world’s third-largest market for solar PV, this weighted-average LCOE declined by 58% between 2016 and 2020.
The costs of solar PV modules and their associated installation have been significantly reduced, along with the increase of capacity factors year on year; see Figure 4 [9,10]. Specifically, the global weighted-average total installed costs decreased by nearly 81% between 2010 and 2020, while the global weighted-average capacity factors for solar PV increased from 14% in 2010 to 16% in 2020. Total installation costs have fallen significantly across all major markets between 2010 and 2020, to only 596 USD/kW in China (reduced by 84%), 781 USD/kW in Italy (reduced by 85%), 1101 USD/kW in the United States (reduced by 77%) and 700 USD/kW in Germany (reduced by 81%). In Vietnam, the weighted-average total installation cost has reached 949 USD/kW, reduced by 58% between 2016 and 2020.
The total installed cost for solar PV relates to various factors, including costs of PV modules and balance of system (BoS) [10,11]. By 2020, the global weighted-average cost of solar PV modules had declined by around 91% compared to 2010, while the BoS costs are different for each country [9,10]. These BoS costs are particularly tied to the support policy in each country, including limiting administrative barriers of licensing or connectivity, or minimizing individual costs.
Today, with a sharp reduction in the cost of power generation from RES, especially utility-scale solar PV, new renewable plants can fully compete with conventional power plants [11,12]. Furthermore, the issues of reducing air pollution, limiting carbon emissions, and contributing to climate change mitigation are also advantages of RES power plants [13]. However, in the early stages of RES development, the difference in economic and technical conditions between RES and conventional fuels in the host countries is often quite large [4,14,15,16,17]. Therefore, it is not easy for RES to replace current conventional fuel sources.
In such a context, the role of governments has been very important in bridging the gap between conventional fuels and RES through supporting policies and related financial tools. Many incentive policies have been introduced, but currently, the most prominent mechanism is still the feed-in tariff (FIT) [2,3,18,19]. The FIT is an effective mechanism to encourage the development of RES and increase their competitiveness with fossil fuels [20,21]. This mechanism obliges electricity utilities to purchase electricity generated from RES in their service area at a tariff determined by the public authority and guaranteed for a specified period. These tariffs vary between RESs and between countries depending on available public resources and socio-economic conditions. The documents [22,23,24] have shown that different FIT structures greatly influence the development of RES and underline the important role of government in setting goals and foundations for RES deployment.
FIT mechanisms were also the most popular mechanism contributing to the large growth of solar PV in Europe during 2008–2012 [16], China during 2011–2016 [17], Japan during 2012–2017 [25,26], and Vietnam in 2019–2020 [4]. Over time, these mechanisms increase the reliability of investments and help to find a stable foothold for solar PV in particular and RES in general.
In Germany, one of the top countries of solar PV, the first law of the Electricity Feed-in Act for green electricity entered into force in 1991 [2,27]. The law required grid companies to connect all renewable power plants and give them a guaranteed FIT for 20 years. However, it was not until 2000, when the FIT price was concretized and no longer tied to the current electricity price [28], that solar power really prospered [27,28,29]. The 100,000-roofs scheme under the new act was also deployed with low-interest loans in 2001–2003. The success of the scheme plus the adjusted FIT prices led to the rapid development of solar PV in Germany during the 2000s.
In Italy, the FIT mechanism was changed five times between 2005 and 2012 under the name “Conto Energia”, before being decommissioned in 2013 [30]. The first FIT mechanism was issued in 2005, but it was not until 2007, under the second FIT mechanism, that solar PV plants really exploded, especially at the end of 2010. The incentives for solar PV plants increasing while the cost of solar power plummeted was one of the main drivers of this boom. However, weak management and confusion in the transition between the second FIT and the third FIT led to great chaos in solar PV deployment in 2010–2011 and affected support policies of solar PV later in Italy. It can be said that the Italian government has not succeeded in establishing a control system for the FIT mechanisms for solar PV, and thus caused troubles for the solar PV market in 2006–2013.
In Japan, by 2011, electricity from solar PV was negligible, at below 1% of the total electricity production [25]. The Japanese government did not really pay attention to RES development until the Fukushima nuclear plant disaster in March 2011. By the end of 2011, the Japanese government introduced the Innovative Energy Environment Strategy [31] with the goal of increasing the contribution of renewable sources, and the Act on Purchase of Renewable Energy Sourced Electricity by Electric Utilities [25,32] with an FIT scheme for renewable electricity. In 2012, the first tariff for solar PV was 53 UScents/kWh, more than double the price offered in Germany at the same time. As a result, solar PV in Japan has increased at a galloping pace. By 2017, the total installed capacity of solar PV in Japan reached 49 GW, fulfilling the expected target until 2030 [26].
In Vietnam, the world’s third-largest market for solar PV today, solar PV was just 100 MWp of the total installed capacity and less than 1% of total electricity production in 2018 [33,34,35]. The FIT mechanism for solar PV in Vietnam started in 2017 and was continuously adjusted in the years 2019–2020 [36,37,38]. The promulgation of FIT mechanisms over time helped solar PV in Vietnam grow strongly in 2019 and 2020 [3,4]. Nevertheless, Vietnam has also encountered problems similar to Italy in controlling FIT mechanisms and confusion in the transition between FIT mechanisms [39,40,41,42]. This has led to uneven and unsustainable development of solar PV applications across the country [4,42,43,44]. Therefore, studying the impacts of policies for solar PV at this time is necessary for the sustainable development of solar PV in the long term in Vietnam.
So far, there have been a number of studies on solar PV development under existing policies and instruments of the Vietnamese government. Khuong et al. [45] studied a method of evaluating the potential and cost-effectiveness of solar PV for emerging economies especially rooftop solar (RTS). Lan et al. [46] reviewed the existing FIT policies for Vietnam’s major renewable sources and some of their limitations, including policies for hydropower, wind power, solar PV, and biomass. Shem et al. [47] presented recommendations on policy and mechanism reforms to promote low carbon development in Vietnam, including changing the use of fossil fuels to renewable sources. Nguyen et al. [48] reviewed the international LCOE for RES and the costs of RES in Vietnam with data from 2017 and earlier, including wind power, solar power, hydropower, biomass, and geothermal. Phap et al. [49] studied the technical potential of RTS in Hanoi and evaluated its payback ability under Vietnam’s current policies. Riva Sanseverino et al. [4] reviewed solar potential and challenges in the deployment of solar PV in the early stage in Vietnam.
None of the analyzed papers examined the effectiveness of existing policy mechanisms, especially the FIT mechanisms, in the investment and deployment of solar PV in different regions of Vietnam.
To the best of our knowledge, this is the first paper to address this question while identifying the characteristics and consistency of the FIT mechanisms and related support policies for solar PV in Vietnam. The paper has summarized the policies and regulations related to solar PV of the Vietnamese government from the 2000s up to now, as well as the process of developing them in practice. Furthermore, the paper has considered the LCOE of solar PV in various regions and compared it with existing FIT mechanisms. Finally, recommendations for future policy for solar PV development are another important outcome of this study.

2. Policy Development for Solar PV in Vietnam

In Vietnam, the solar potential is up to 300 GW, even higher than that in Germany and Japan [50,51]. However, in 2018, the total installed capacity of solar PV was extremely low compared to its potential, with only 100 MWp and electrical generation from solar PV accounting for less than 1% of total electricity production; see Figure 5 [33,34,35]. The main energy sources for electricity generation came from coal, oil, and hydropower. However, these energy sources are forecasted to be exhausted in the next 10 years, having limited exploitation capacity or being almost fully exploited [34,52].
In 2007, the Vietnamese government enacted the first development strategy for RES, including solar PV, but there are no specific targets for each renewable energy source in this document [53,54,55,56]. Therefore, it was not attractive enough for local and international investors.
In 2011, specific targets for installed capacity and power output of solar PV were first outlined in the Seventh Power Development Plan (PDP7) [54] and then amended in 2016 under the revised PDP7 [57]; see Figure 6. Accordingly, the total capacity of solar PV is expected to reach 850 MWp, 4000 MWp, and 12,000 MWp in 2020, 2025, and 2030, respectively accounting for 0.5%, 1.6%, and 3.3% of the total electricity output.
In 2015, the first government-level document on a development strategy specifically for renewable energy (REDS) was issued [56]; see Figure 7. In REDS, the specific targets for electricity production from solar PV were planned to be up to 1.4 billion kWh, 35.4 billion kWh, and 210 billion kWh, accounting for 0.5%, 6%, and 20% in 2020, 2030, and 2050, respectively. In addition, other measures proposed in REDS to implement the objectives of the strategy include: credits for RES; exemptions on import duties on certain equipment, materials, and products that cannot be produced locally; exemptions and reductions of corporate income tax and/or land use costs.
The FIT in Vietnam was first introduced in June 2011, but it was only for wind power, not solar power [58]. Six years later, mechanisms for solar PV were first officially enacted; they were enacted in 2017, 2019, and 2020; see Table 1 [36,37,38]. Accordingly, in 2017, this mechanism imposed an obligation for the grid operators, herein Vietnam Electricity (EVN) Group, to purchase electricity generated from solar power plants (SPP) at the FIT of 9.35 UScents/kWh for the next 20 years. In 2019, the FIT price for RTS systems continued to be supplemented and amended with the same promotion of SPP. In early 2020, the latest FITs for grid-connected solar PV applications were issued with more options, including a floating SPP, a ground SPP, and an RTS in a range from 7 UScents/kWh to 8.4 UScents/kWh. For Ninh Thuan province only, the grid-connected solar PV projects below 2000 MWp included in the development plan could enjoy a FIT of 9.35 UScents/kWh for all levels.
Based on the promulgated supporting policies and instruments, schemes on grid development using RES have also been implemented. Specifically, the program to supply electricity to rural areas, mountainous areas, and islands in the period of 2013–2020 [55] focuses on low-income households in remote areas. It encourages the implementation of rural electricity investment projects from RES in cases where they cannot be connected to the grid. In fact, most projects under this program are non-profit and funded by governments or corporations [59].
Furthermore, the RTS promotion program was launched in 2019 by the Ministry of Industry and Trade (MoIT) [60]. Accordingly, 100,000 RTS systems (equivalent to 1000 MWp) would be installed and operated in whole country until 2025 under the REDS. The development and completion of policies and regulations to support the development of rooftop solar PV is also another result of the program.
Finally, taxes on land use and leasing for solar PV projects would be waived or partially reduced depending on the project category [36,37,38,61,62,63]. Parts for solar PV power plants purchased from other countries would also be exempt from taxes on imported goods. Exemptions and reductions of corporate income tax are also implemented in accordance with the current law.

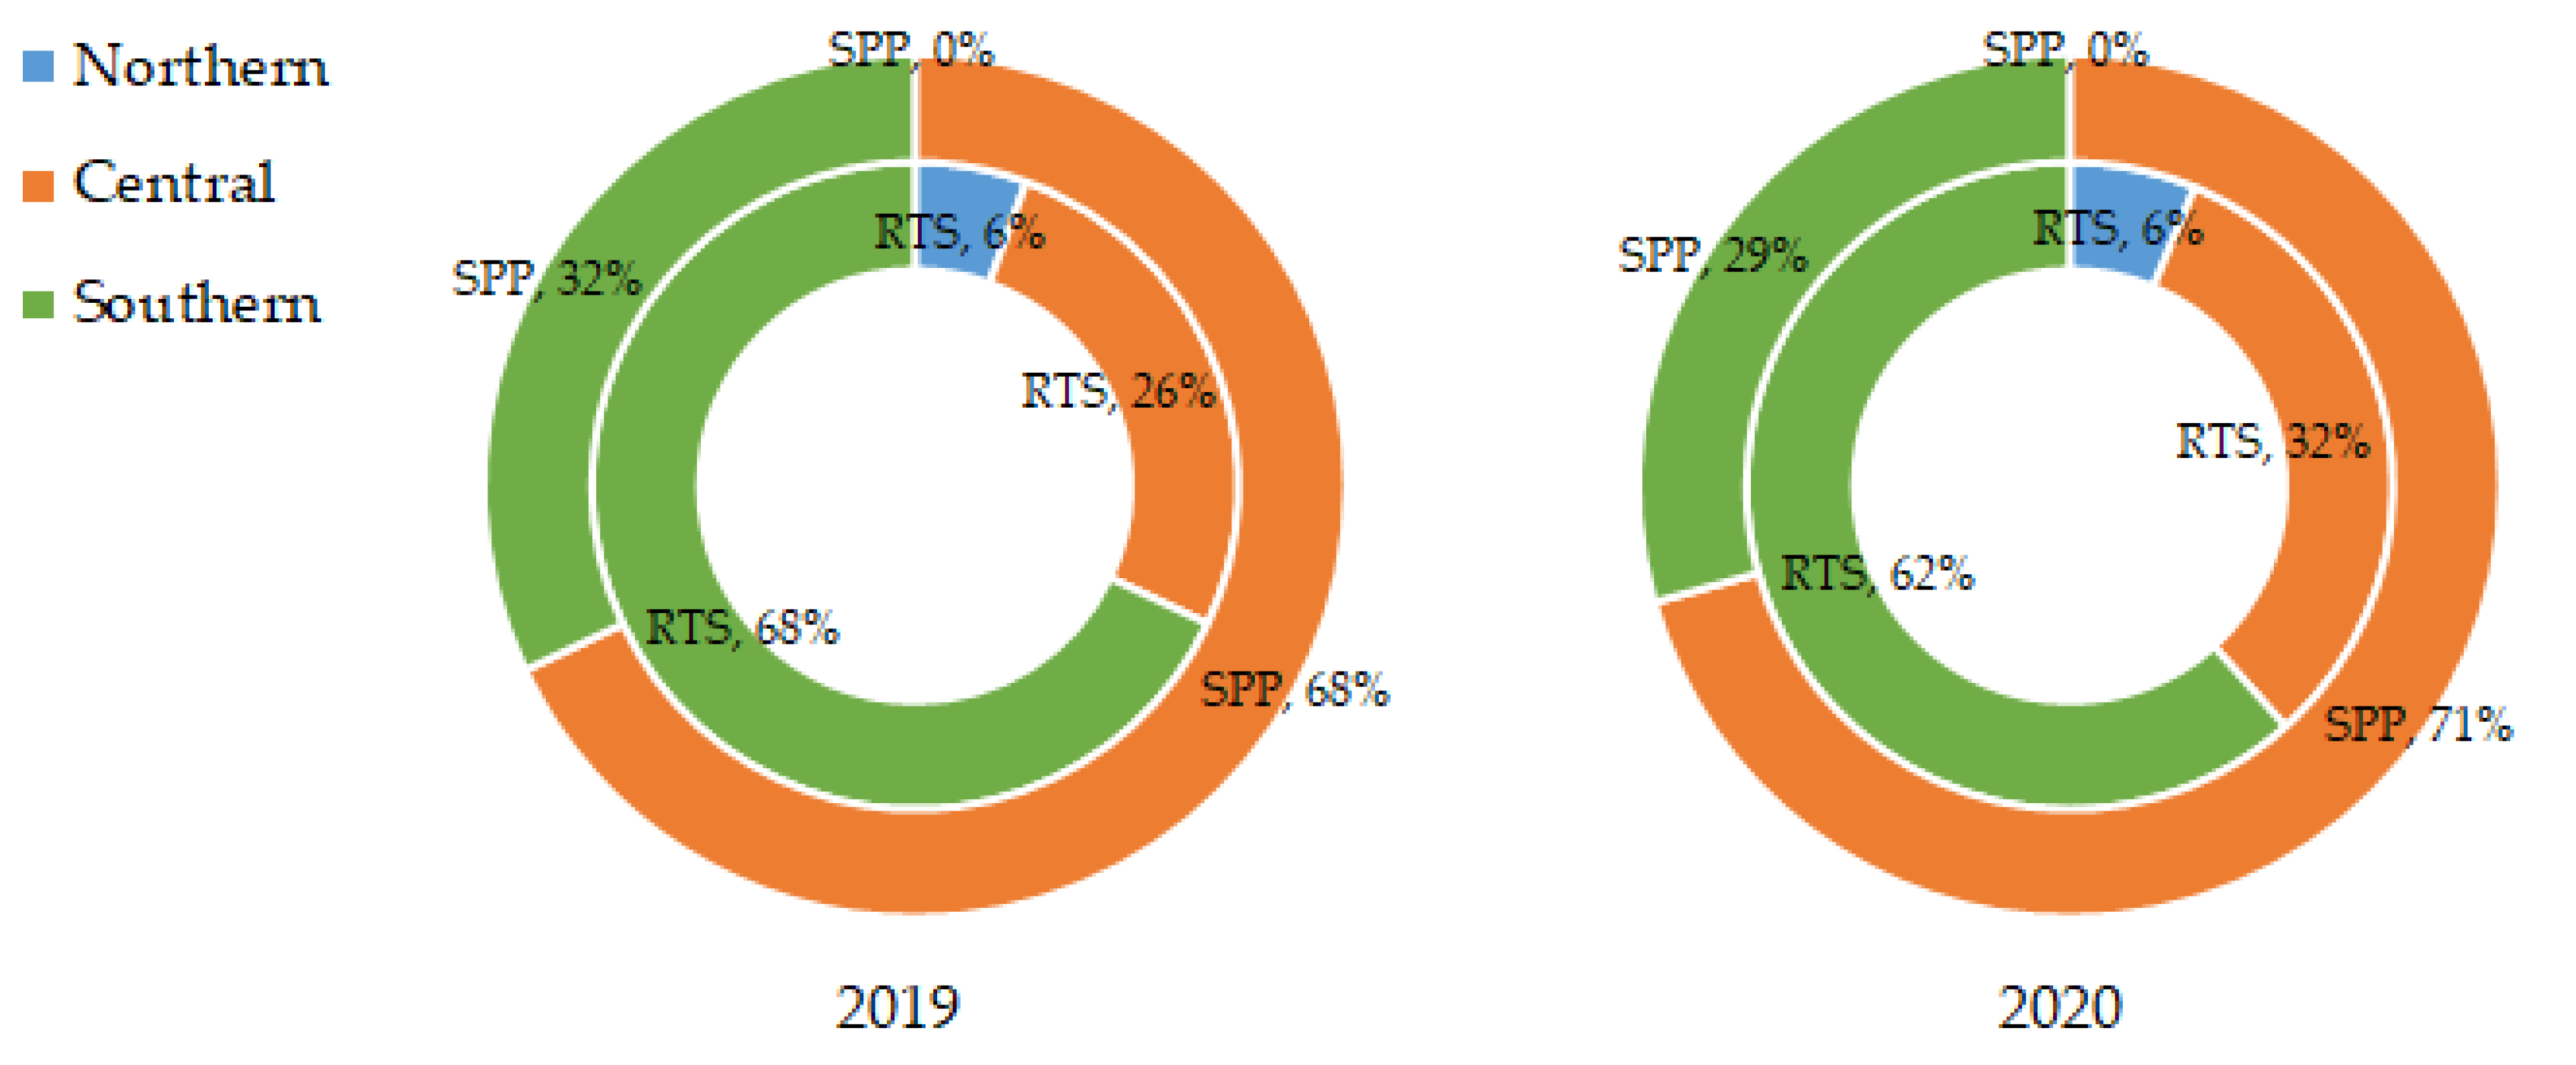
3. Results of the FIT Deployment for Solar PV in the Current Years

The issuance of FIT mechanisms and accompanying incentives has facilitated the rapid growth of solar PV in Vietnam in 2019–2020, with a total installed capacity of around 16 GWp, far exceeding the target for solar PV in 2020 under the revised PDP7; see Figure 8 [2,3,4].
While the growth of solar PV in 2019 was driven by a large amount of installed capacity coming from SPP, most of the increase in 2020 was in RTS; see Figure 9 [43,44,64,65]. The total installed capacity of new RTS in 2020 was 9.3 GWp in comparison with 0.4 GWp in 2019, but total installed capacity of new SPP was less than half of 2019, with around 1.8 GWp. The difference in the FIT support mechanism between 2019 and 2020 is believed to have affected the deployment of these types of solar power applications [36,37,38]. At the end of the FIT mechanisms, the deployment of solar PV applications was rushed and almost chaotic, with more than 4 GWp SPP installed in May and June 2019, and around 6.7 GW RTS connected in December 2020.
Moreover, the deployment of solar PV applications was uneven across the country; see Figure 10 [43,44,64,65]. Most of the deployment of these solar PV applications was concentrated in the south and central regions. Specifically, in 2019, the total installed capacity of new RTS and SPP was 26% and 68% in the central region, and 68% and 32% in the south region, respectively. The new installed capacity in the north region was the lowest with 6% RTS and no SPP. In 2020, although there was a change in the percentage of installed capacity of RTS and SPP in each region, the total installed capacity of solar PV applications in the north was still the lowest. The total installed capacity of new RTS and SPP accounted for about 32% and 70%, respectively, in the central region, and 62% and 29% in the south region. In 2020, the installed capacity of new SPP is mainly located in the south-central region due to the special incentives of the FIT mechanism for Ninh Thuan province [38].
The results achieved have helped Vietnam to enter the world’s top 10 for solar PV today [2,3,4]. However, data on the deployment of solar PV applications and their locations showed a very low percentage of RTS and SPP present in the North region. The RTS systems are deployed mainly in densely populated areas with good solar potential such as in the south region, and SPPs are mainly distributed in the central region, specifically the south-central region.

4. Challenges and Opportunities in Deploying the FITs

It is recognized that the total installed capacity of solar PV applications in the north of Vietnam is the lowest and the other two regions share most of the market share in RTS and SPP. One of the biggest reasons is the difference in the average global horizontal irradiation (GHI) potential between regions [66]. Moreover, the disparity in LCOE between the above regions is also a major barrier to the deployment of solar PV applications, including both SPP and RTS [45,67]. The mismatch between the LCOE and the FIT price has also significantly affected the deployment of solar PV in each region [36,37,38].

4.1. Unsustainable FIT Mechanism

The FIT prices for solar PV in Vietnam today are fixed and only for grid-connected applications [36,37,38]. The FIT mechanism here is determined based on the global weighted-average LCOE of a solar PV at the time of issuance and is guaranteed for 20 years thereafter.
The first FIT mechanism in 2017 and its revision in 2019 was issued and applied to all the different grid-connected applications of solar PV throughout the territory [36,37]. This mechanism has contributed to promoting the boom of SPP in Vietnam in 2019, especially in the central region [43,44]. However, the mechanism did not promote the development of RTS applications in Vietnam due to the mismatch between FIT price and the LCOE for RTS at that time.
The second FIT mechanism was issued in mid-2020 and covered different solar PV applications in more detail, including floating SPP, ground SPP, and RTS systems [38]. The FIT price adjustment in favor of the RTS has brought the total new RTS installed capacity in 2020 to double the total solar PV installed capacity of 2019 [64,65]. Nevertheless, the deployment of RTS is mainly concentrated in the south region, which has good solar potential and a dense population [66].
The simplicity of the FIT mechanisms has made solar PV underdeveloped in the low-potential areas in the north, and out of control in the high-potential areas in the south-central and the south regions due to the successive explosion of SPP and RTS in 2019 and 2020. This has caused instability and uncertainty in the solar PV market in Vietnam today and possible consequences in the future.
The Vietnamese government is planning to move from the FIT mechanism to a competitive bidding mechanism, including competitive bidding based on substations, floating solar power parks, and ground solar parks [42,68]. This is a bold step, but it needs to be carefully studied and consultations made with other countries with a good background in solar PV.
Many countries around the world have used the FIT mechanism to support RES development, including solar PV. The effectiveness of FIT depends on many factors and the different views of policy-makers [23]. The variation of FIT mechanisms depends on the conditions of the host country, including limitations in terms of budget availability, installed capacity, installation costs, contract capacity, contract duration, and/or installation location [1].
In Germany, the FIT price is adjusted monthly and annually based on feedback from the market growth, corresponding discount, and actual installation status [1,29]. In Greece, the FITs for solar PV were adjusted annually according to the rise of inflation and electricity prices [27]. In Australia, the FIT prices for solar PV were different in various states or territories, and designed based on the LCOE of solar PV in each state or territory [69]. In Thailand, the FITs are adjusted each year and determined based on the project purpose, installed capacity, operating time, and location [70]. In Italy, the FIT price was issued and then adjusted in subsequent years, depending on the installation capacity, used typology, and solar PV technology [30,71]. In Slovakia, the FIT is fixed and consisted two components: an electricity price and an additional payment of a difference between the electricity price and the tariff on renewables [72]. In Turkey, fixed FITs were applied for ten years for RES between 2005 and 2015, including solar PV [1,73].
It can be observed that some countries applied FIT mechanisms depending on the market and some did not. The market-dependent FIT policies are directly proportional to changes in the background economy, while the market-independent FIT policies are the opposite [24]. Market-dependent FIT policies enable investors to ensure their actual profits. The FIT price would be adjusted annually or even monthly, and may change in all or part to account for fluctuations in inflation or an increase in fuel prices. The latter model, such as the case of market-independent FIT, could diminish investment returns over time in the case of inflation, but tends to generate enough profits to attract investors when considering innovative technologies and cuts of the future cost of electricity production from RES. In addition, the market-independent FIT provides long-term security for investors through relatively high tariffs and is fixed for a long time, as well as guaranteed of government mechanisms and policies [74].
In fact, the current market-dependent FIT mechanism is preferred by governments due to the minimization of deviations occurring in the electricity market [2,75]. Meanwhile, the market-independent FIT mechanism is often chosen by investors because of the safety of the investment and the certainty of the cash flow generated [24,76].
In the early stages, most governments choose a market-independent FIT mechanism in order to promote the development of RES, including solar PV. In addition, monitoring of the FIT mechanism by governments is essential. This support mechanism requires continuous supervision in order to precisely adjust and ensure the effectiveness of this system [19,77]. A well-designed FIT enables cost savings and maximizes output for producers of RES without compromising the market price of electricity [78,79]. However, in some cases, improper design or careless modification of these policies could impact negatively on the development of solar PV, even causing new plant construction projects to be canceled, creating insecurity for investors and leading to the loss many jobs [80].

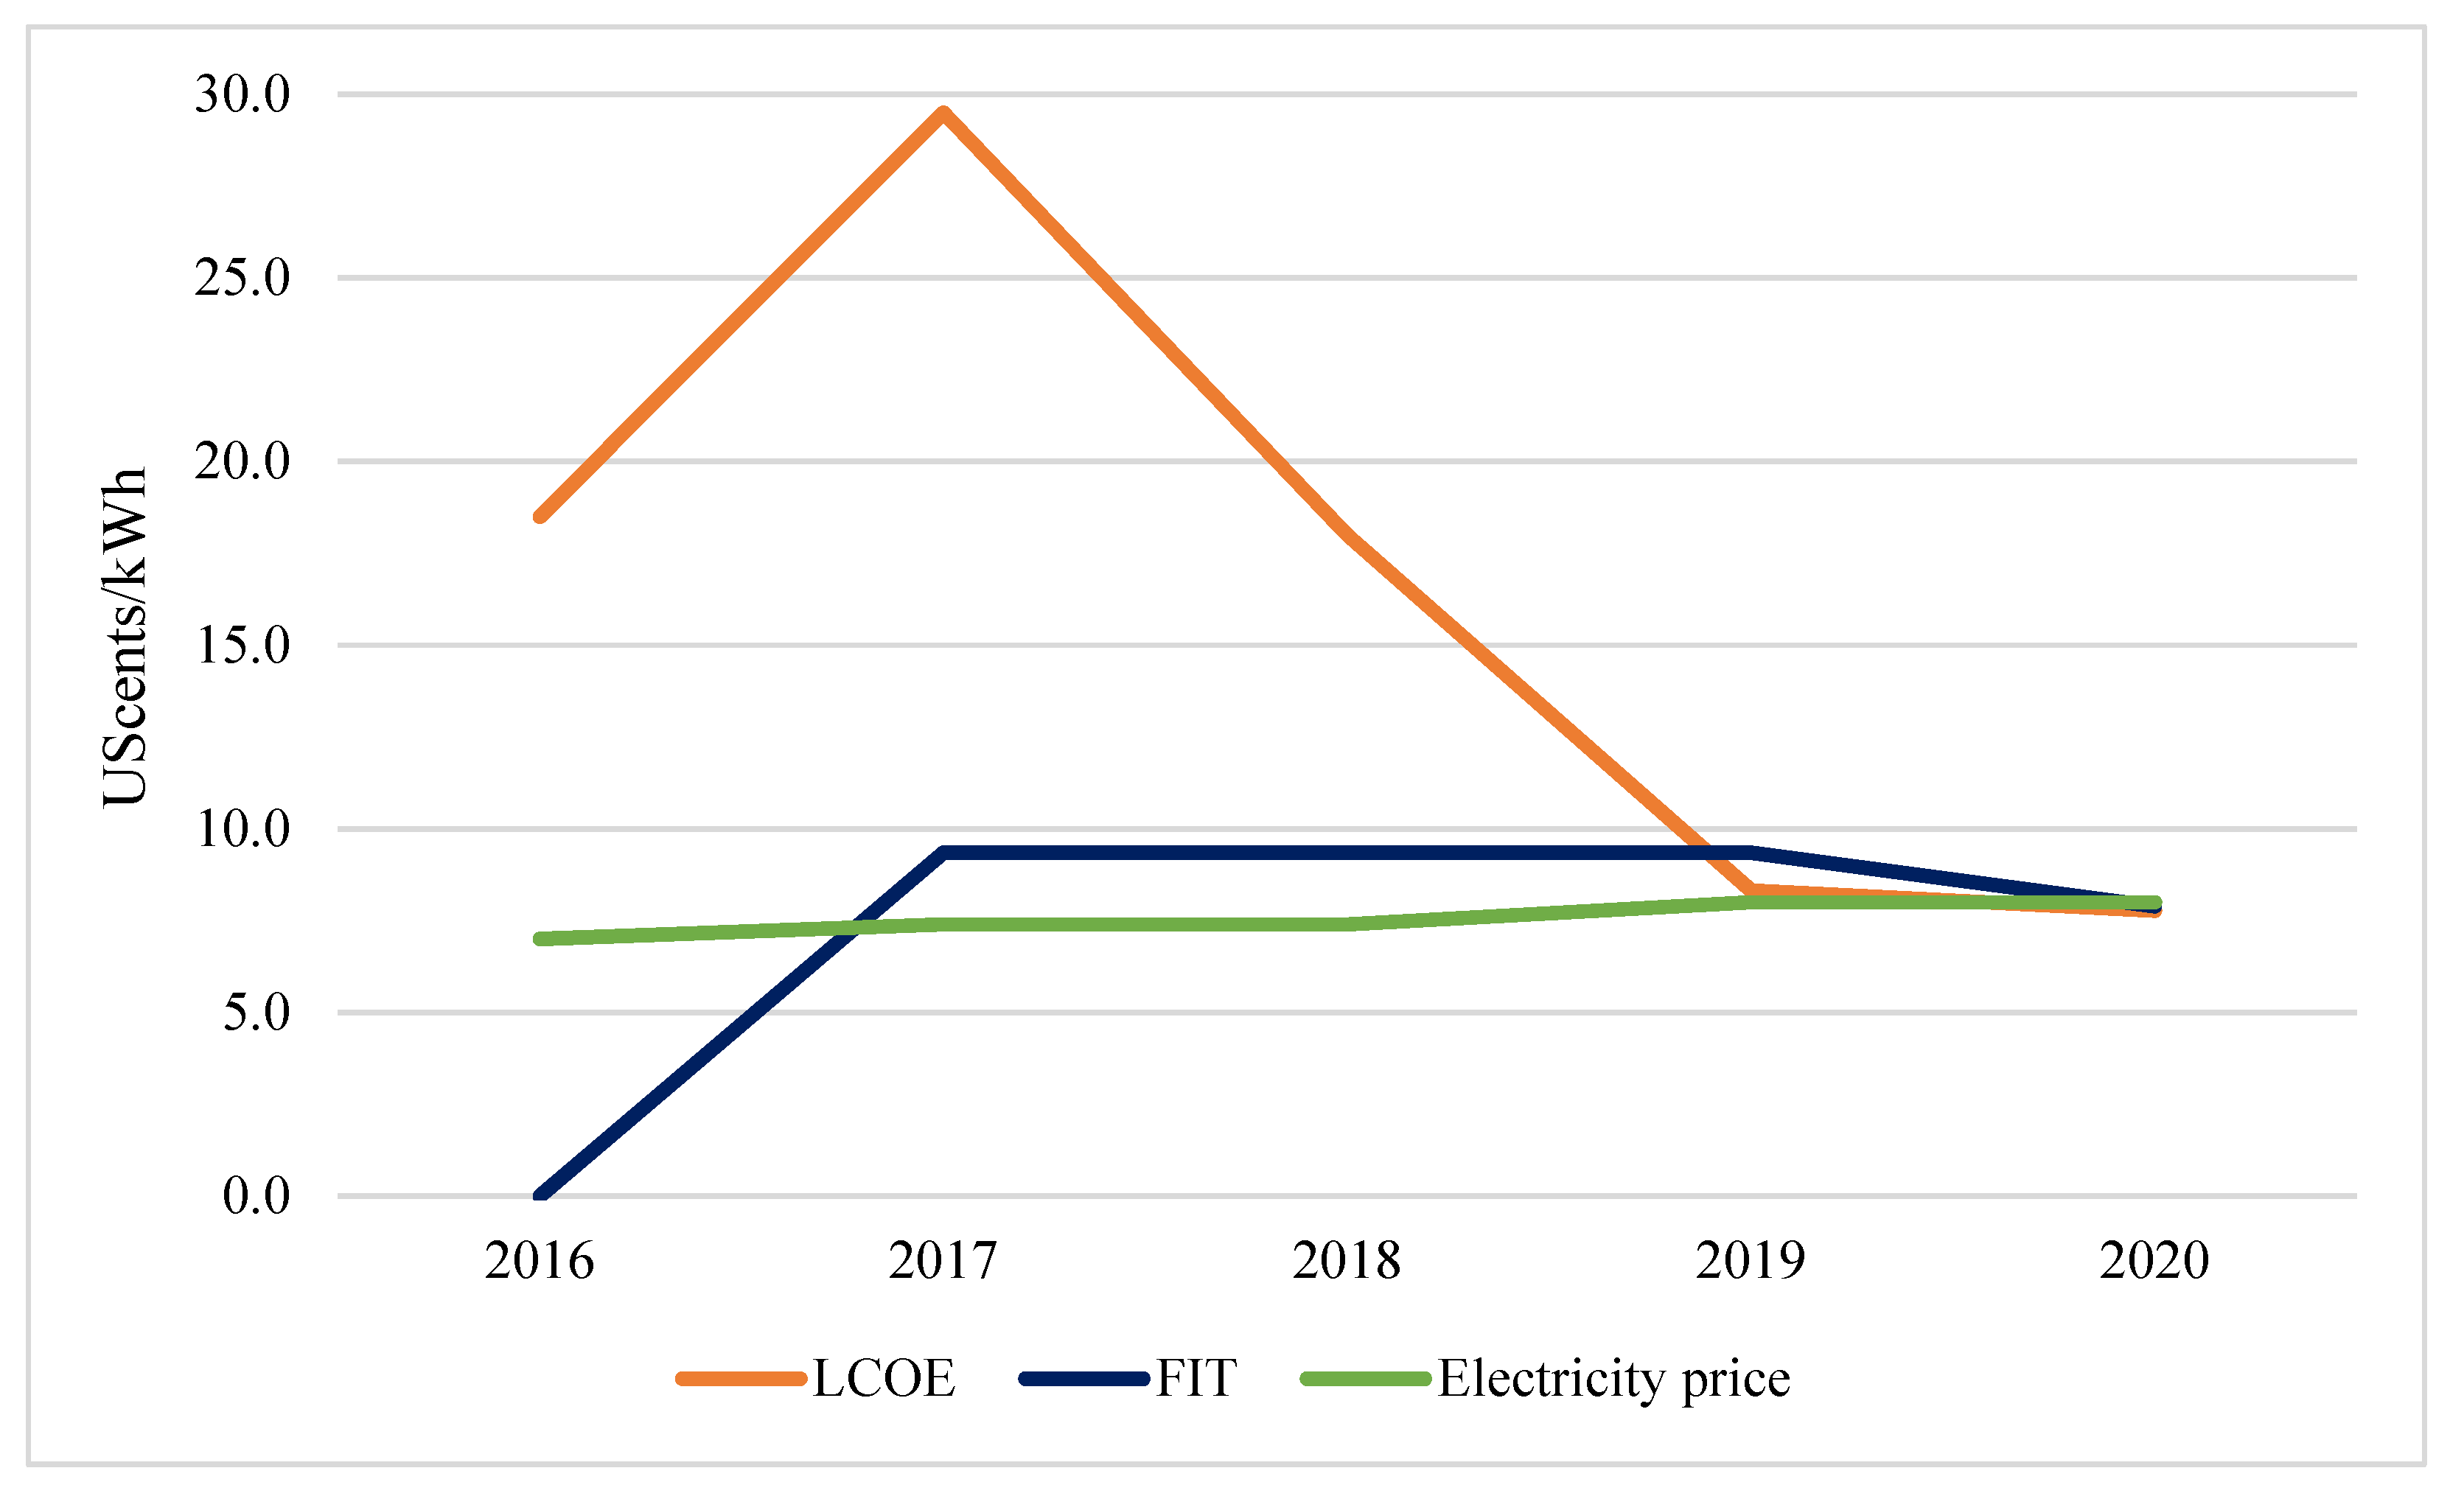
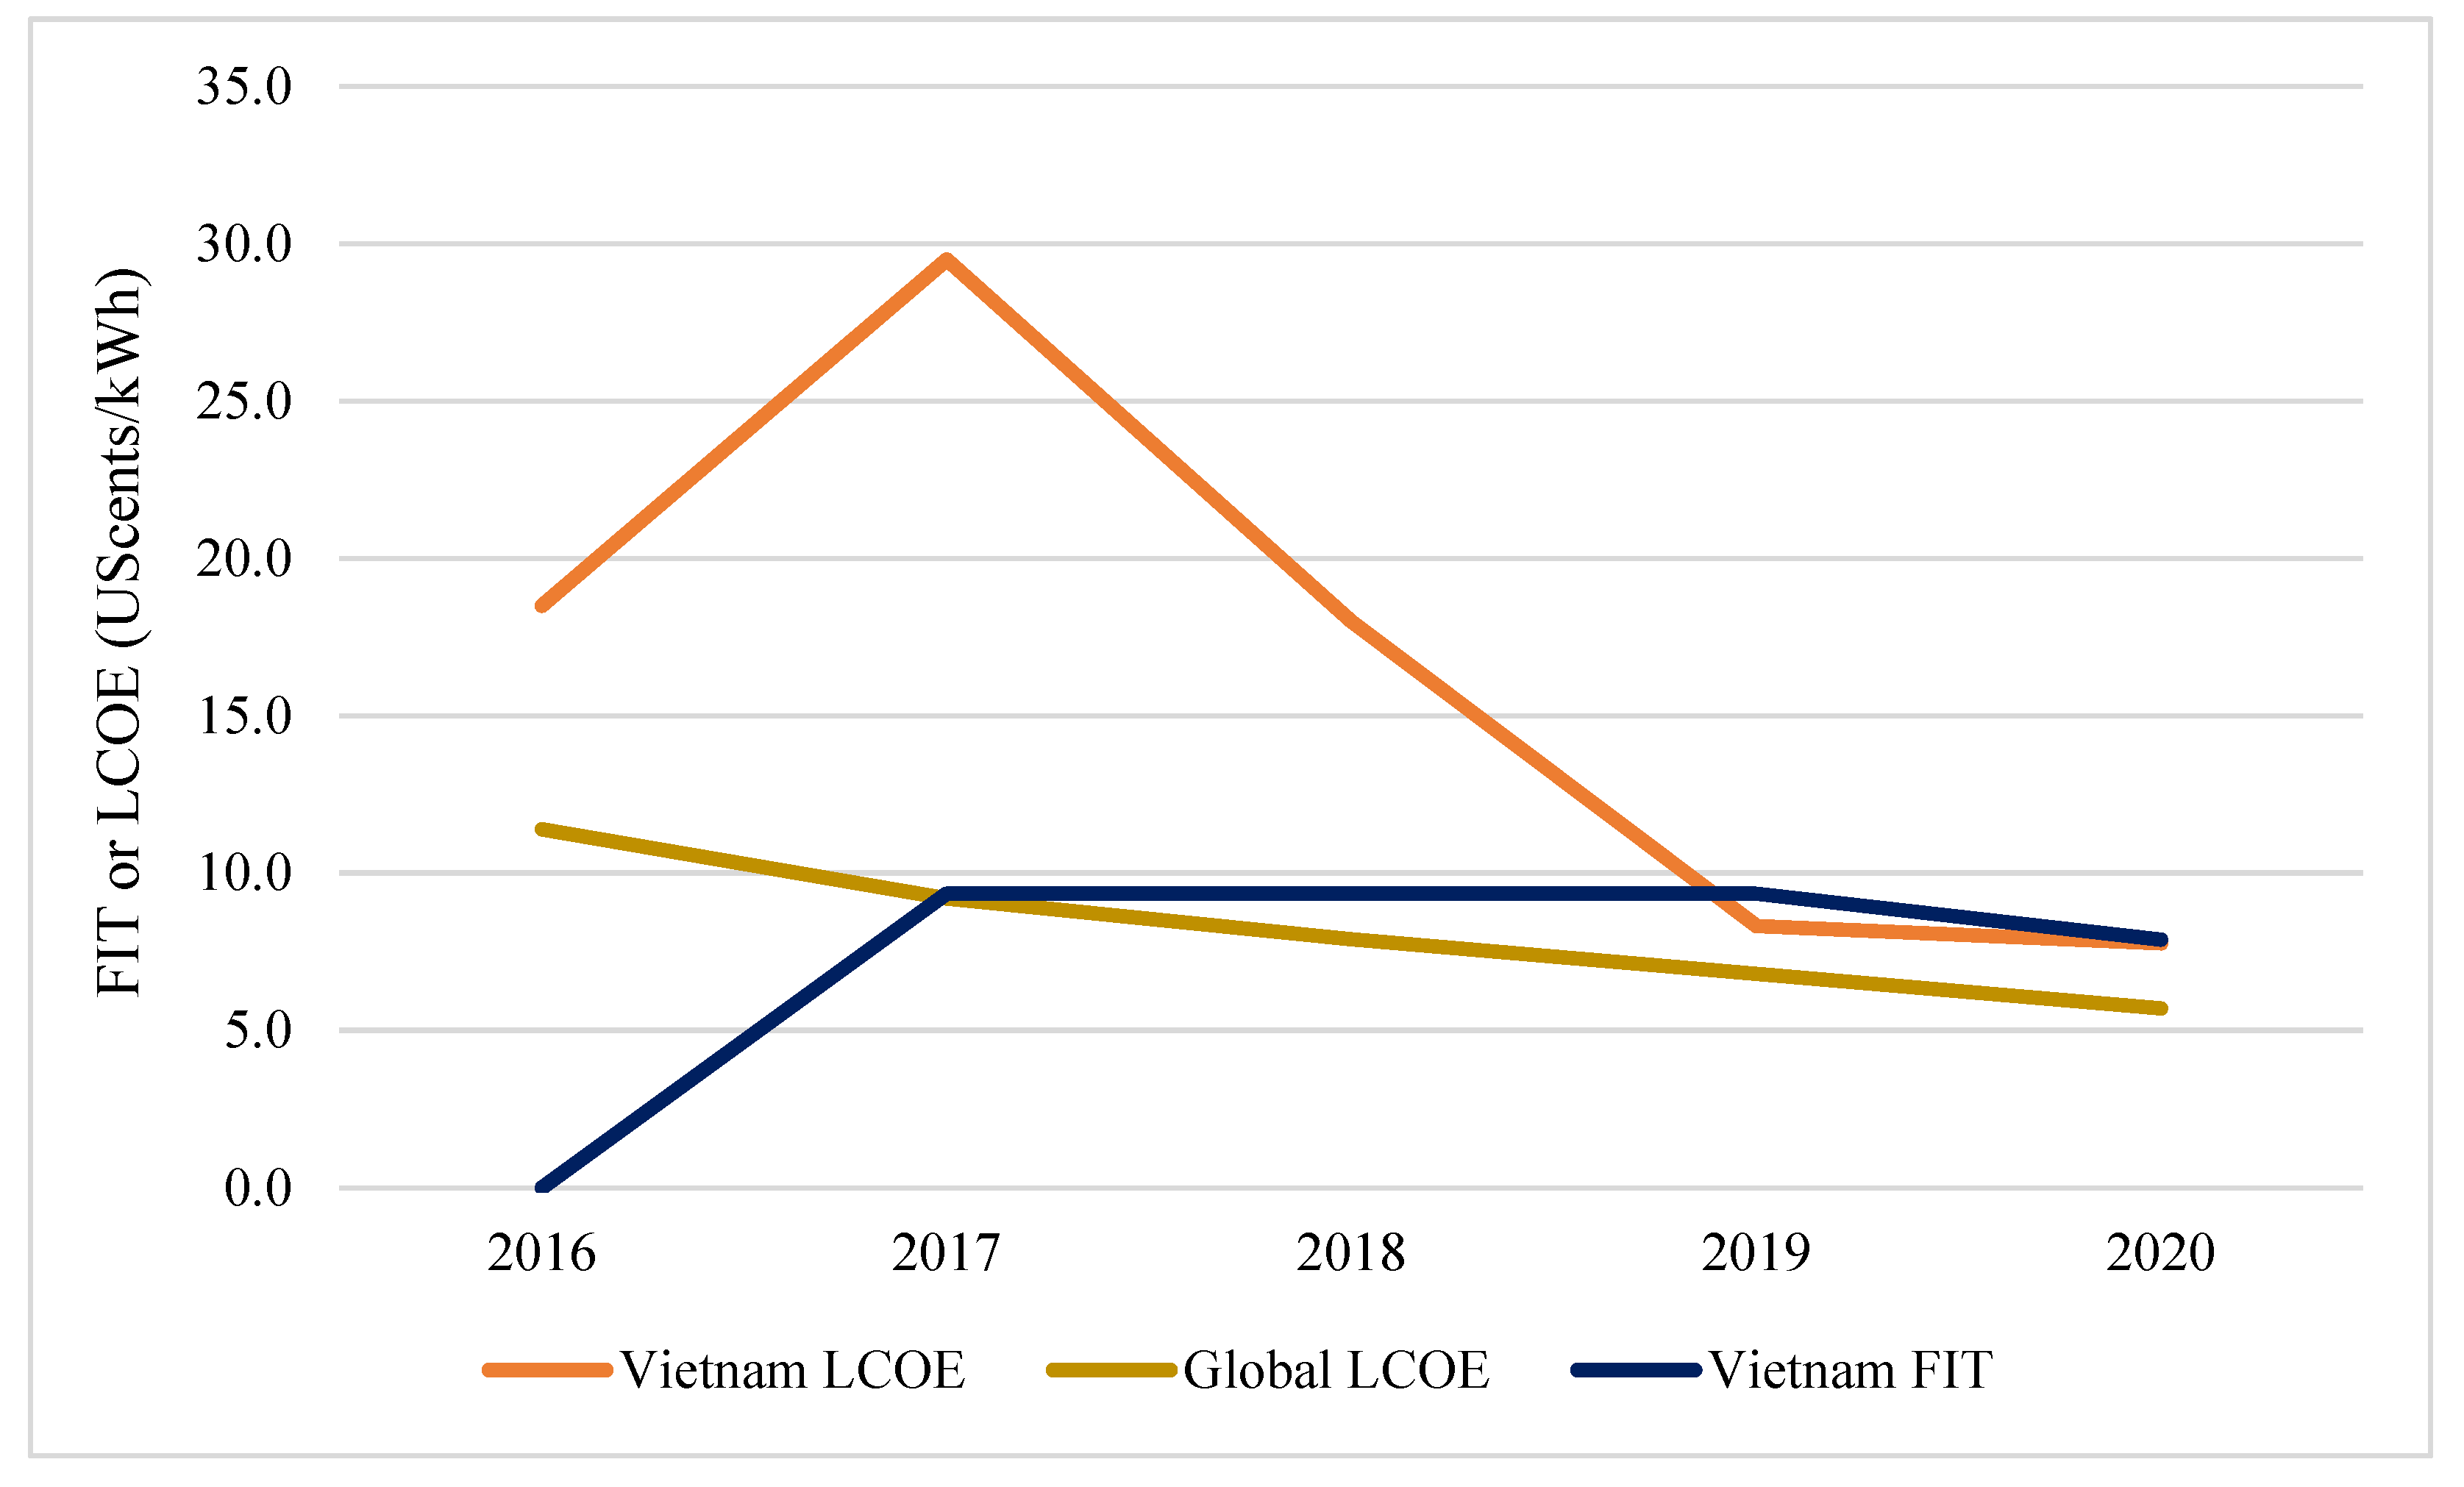
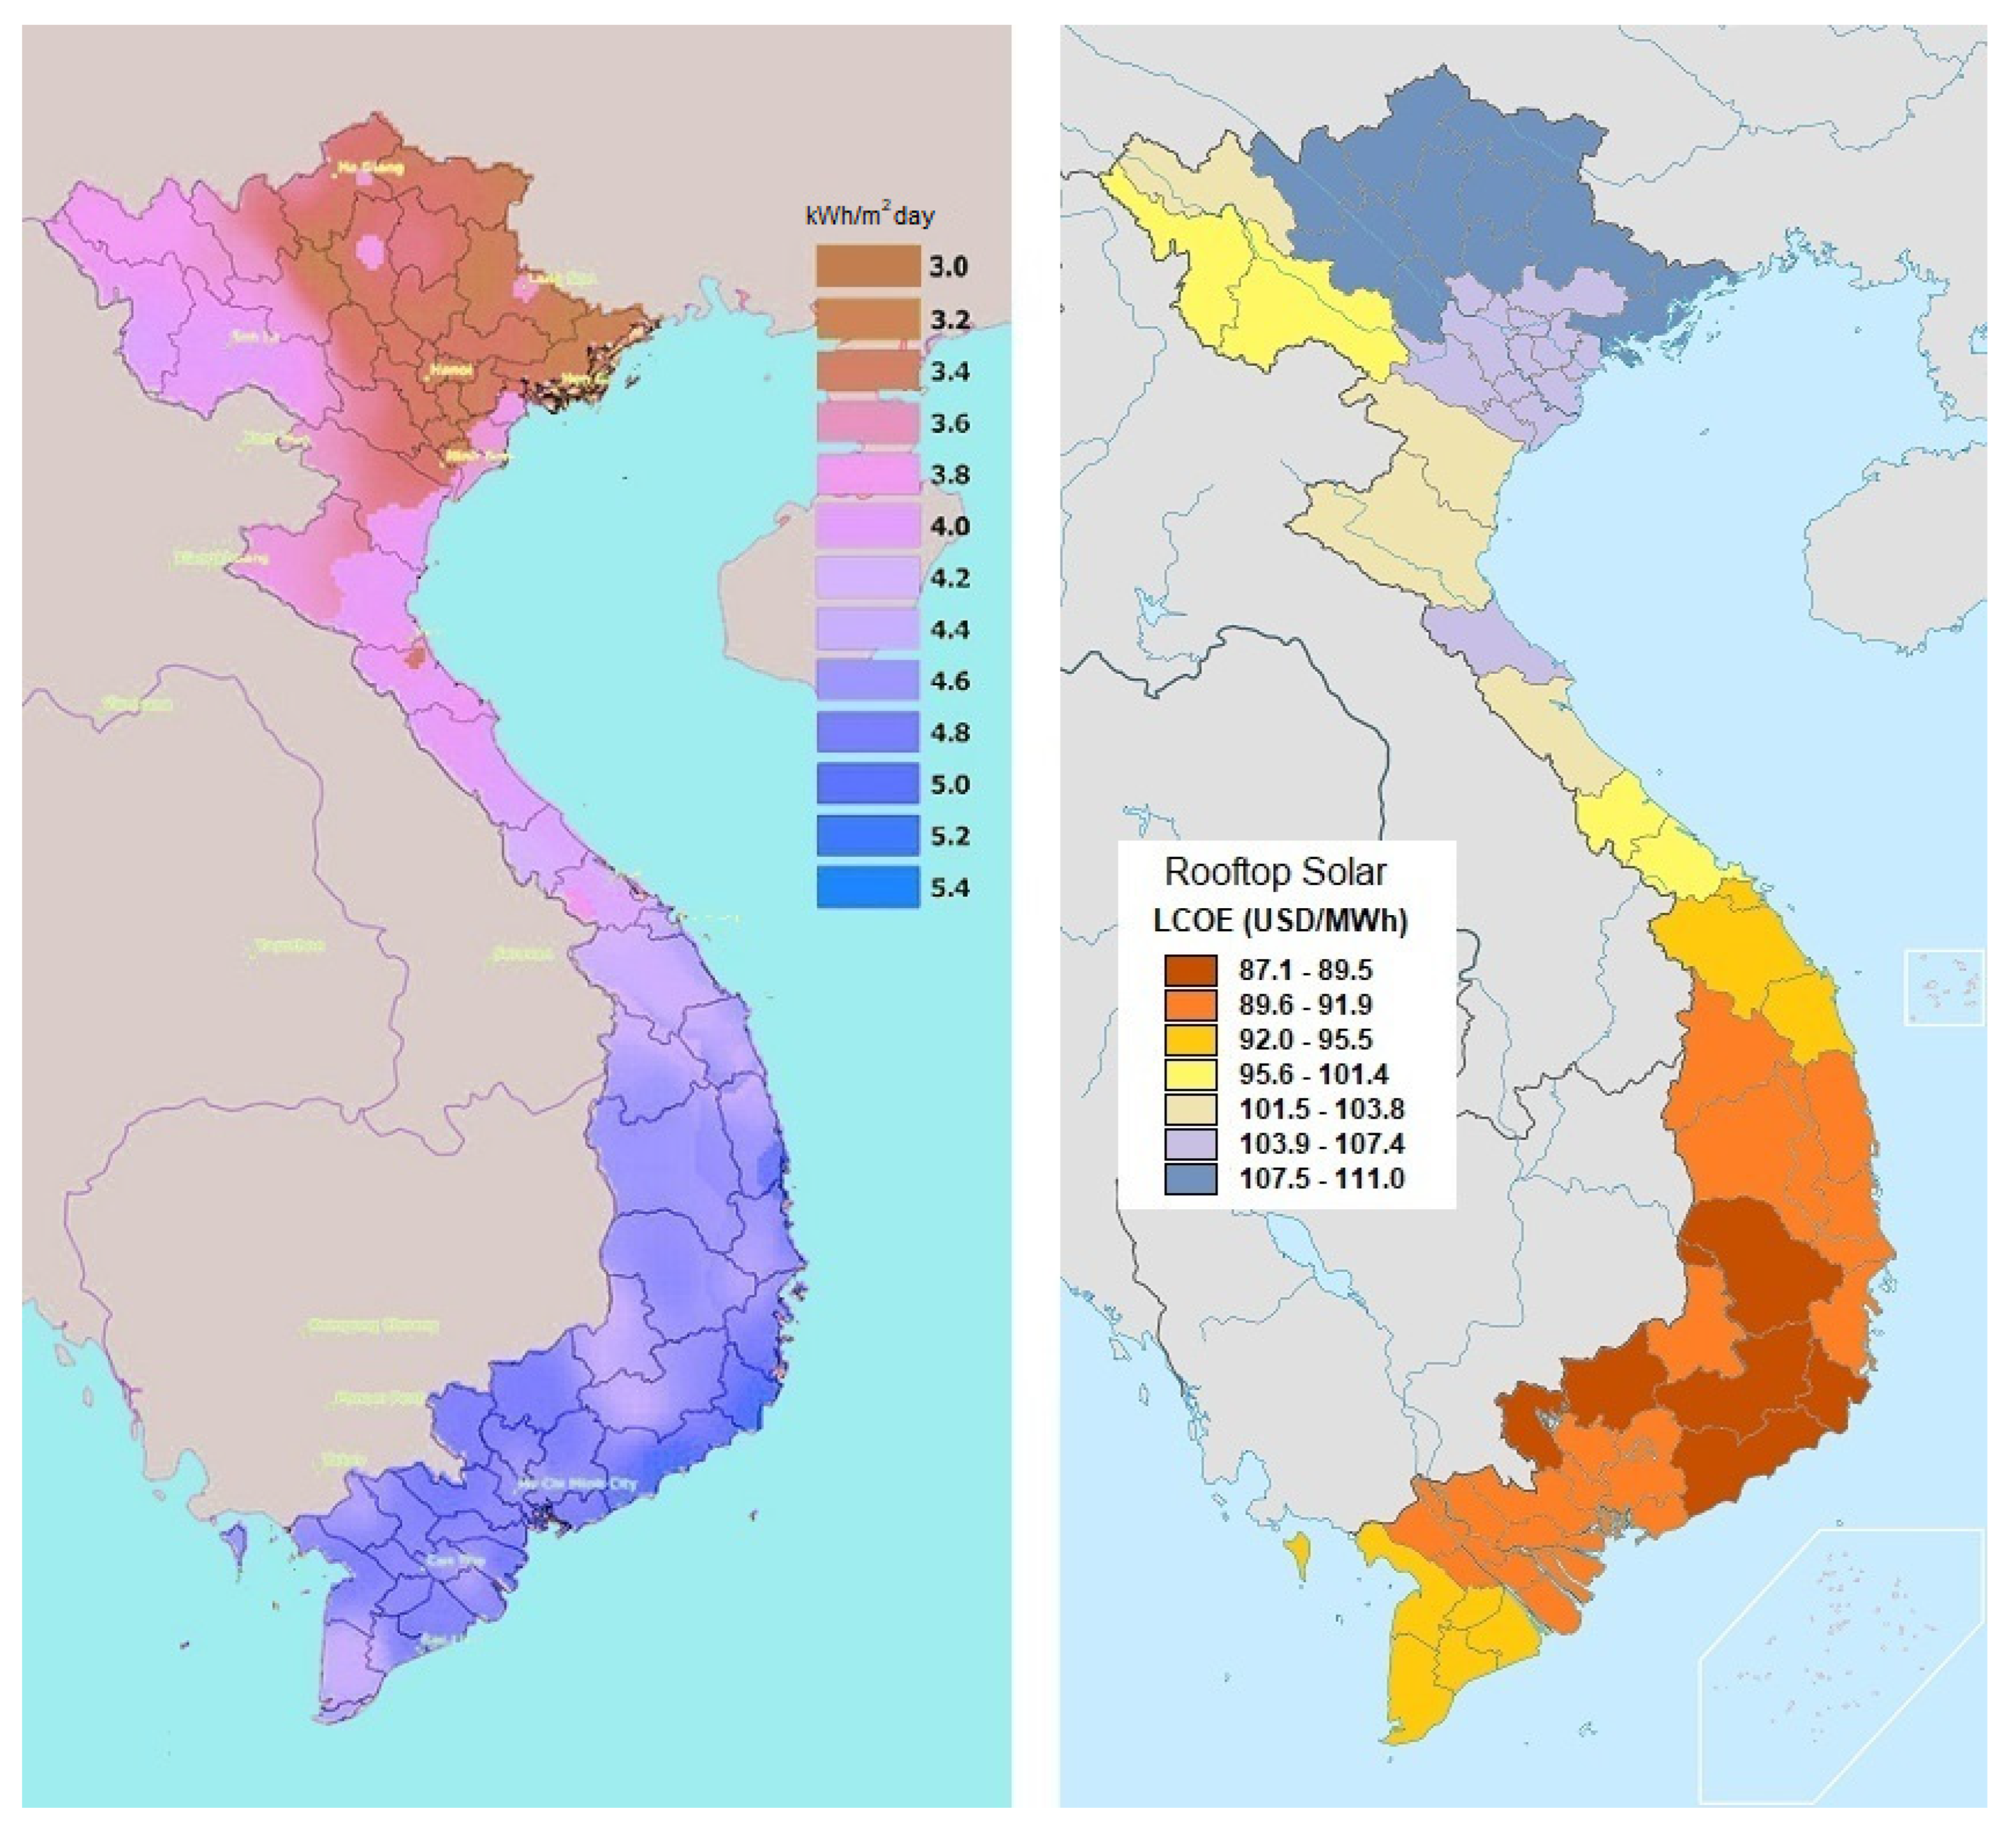
4.2. Relatively High Levelized Cost of Electricity

In Vietnam, the first FIT mechanism was issued in 2017, but by 2018, the total installed capacity of grid-connected solar PV was still very low, just over 100 MWp. One of the main reasons for this is that the gap between the FIT and LCOE prices in 2017 was quite large; see Figure 11 [4,9,10]. The LCOE at that time was three times larger than the offered FIT price. By 2019, the weighted-average LCOE for solar PV in Vietnam was closer to the global weighted-average LCOE. Therefore, the FIT prices were in line with the LCOE in 2019, and this continued in 2020.
However, the deployment of solar PV applications in Vietnam has been rushed and uneven across the country [43,44,64,65].
It is recognized that the total installed capacity of solar PV applications in northern Vietnam is currently the lowest and most of them are RTS systems. One of the largest reasons is that the average global horizontal radiation (GHI) potential in this region is lower than in the other two regions [66]. Moreover, the high LCOE is also a big barrier to the deployment of solar PV here, including both SPP and RTS; see Figure 12 and Figure 13 [45,67]. The LCOE ranges from 12 to 14 UScents/kWh for SPP, and from 10 to 11 UScents/kWh for RTS, depending on each area. The variation of the LCOE in different areas of the north also reflects the quality of solar resources of each area. The LCOE being higher than the proposed FIT price led to negligible deployment of solar PV.
In the central region, the total installed capacity of solar PV applications is around 4 GWp in 2019 and 1.2 GWp in 2020 [43,44,64,65]. The solar potential is good and large land banks are advantages for SPP development here [66]. However, the LCOE for PV is different depending on the area for both SPP and RTS; see Figure 12 and Figure 13 [45,67]. The LCOE ranges between 7 and 11 UScents/kWh for SPP and between 8 and 10 UScents/kWh for RTS, the LCOE is higher in the north-central region than in the south-central. As a result, applications of SPP boomed here in 2019, especially in the south-central area [4,42,81]. In contrast, the development of RTS here is limited due to the low number of available roofs and the distance between the FIT and the LCOE not being as attractive as in the south region [45,49].
The total installed capacity of solar PV in the south region was about 2 GWp in 2019 and 6.3 GWp in 2020 [43,44,64,65]. In contrast to the central region, the share of RTS here is the highest in the country, with nearly 70% of the total installed capacity. The solar potential is quite good and relatively uniform across the areas [66]. The LCOE for both SPP and RTS also fluctuates little throughout the region, between 7 and 9 UScents/kWh; see Figure 12 and Figure 13 [45,67]. The uniform distribution of both solar potential and LCOE are good conditions for solar PV development here. The high availability of rooftops and the speed of urbanization are good conditions for RTS deployment here [45,49,82]. Nevertheless, the high population density and the need for space for other economic sectors are constraints on the development of SPP in the south region [68].
Therefore, the development of FIT mechanisms based on solar potential and LCOE by type of technology and installation location is one of the key factors in stable and sustainable development for the solar PV industry in Vietnam today.
Solar PV in Vietnam is developing much slower than other countries with the same solar potential, such as Germany, Japan, Italy, Spain, or Thailand [4,10,83]. The high LCOE has made Vietnam lose opportunities to develop solar PV earlier. The high LCOE in Vietnam is due to the fact that Vietnam’s solar PV industry depends heavily on foreign organizations, from technology and engineering to project development capability [4]. The current situation of solar PV in Vietnam is similar to that of China before 2011 [17]. At that time, China was completely dependent on Europe, from technology and production capacity to consumer markets for solar PV products. Although Chinese PV cell output has been at the top of the world since 2007, the domestic PV market has been largely undeveloped, with a total installed capacity of only 140 MW. Thereafter, the Chinese government made efforts to improve this situation by enacting policies to attract investment in solar power generation, as well as building project development capacity for domestic technical teams. As a result, today China is the dominant global player in the PV supply chain, which is a key factor making the weighted-average LCOE in China among the lowest in the world [9,10,84].

4.3. Disadvantages on Electricity Price

Vietnam’s electricity retail price is adjusted annually according to regulations for different periods. In the period 2016–2020, the adjustment of the annual average retail electricity price stayed in the range 6.9–8.2 UScents/kWh [85,86,87]. This is a pretty good price compared to the FIT and weighted-average LCOE for solar PV in Vietnam in 2019–2020; see Figure 14 [9,10,36,37,85,86,87]. However, this electricity price has not created leverage for the sustainable development of PV electricity and RES electricity in Vietnam. Moreover, the regulated electricity price frame also has not truly reflected the current penetration of RES.
In August 2020, the government of Vietnam approved a scheme of competitive retail power market model design [88]. Accordingly, the competitive electricity retail market would consist of two segments: competition in electricity wholesale and competition in electricity retail. Customers could choose to buy electricity from many retailers instead of just buying electricity from EVN, as is currently the case. However, this scheme will only be completed after 2024.
In fact, one of the incentives to develop renewable energy is the market price of electricity. The high electricity price is one of the favorable conditions for developing solar PV in many countries, such as Germany, Italy, Spain, or the United Kingdom [1,2]. On the contrary, low electricity prices leave consumers and investors with no incentive to invest in solar PV because the time to recover the capital is too long [89]. Many countries have good solar potential such as Egypt, Qatar, Iran, Algeria, Saudi Arabia, Trinidad and Tobago, and Malaysia, but the development of solar PV has not been considered an option due to low electricity price. The electricity in these countries is mainly generated from fossil fuels and its price is subsidized by the government [11]. Subsidies can be an effective policy tool to improve economic efficiency in case of market failure, but can also undermine the competitiveness of potential advanced energy sources and affect system costs.
The application of appropriate electricity price policies for each renewable source can also promote the development of RES [90]. However, increases in electricity prices must also be carefully considered to avoid a situation that only ensures profits for foreign investors and places a burden on the bills of Vietnamese citizens, as was the case with solar PV development in Italy [30].

4.4. Policy Inconsistencies

The current policy mechanism for solar PV electricity is inconsistent. The old FIT mechanism has been expired since mid-2019 [36,37]. However, the new FIT mechanism was only issued in mid-2020 and takes effect after nearly a year with a very short duration, about half a year [38]. The new FIT prices were adjusted down compared to the old FIT price. These FIT prices could create many difficulties and challenges for the deployment of solar PV in the north and north-central regions due to the failure to offset the LCOE costs in these areas [45,67]. In addition, the special priority given to Ninh Thuan in the new FIT mechanism could exacerbate the overload status in the grid transmission here [4,42].
The unexpected policy change is a risk to investors and creates challenges in attracting capital [27,91]. In other words, the consistency of policies also makes FIT effective. The compatibility between the new FIT mechanism and the old FIT mechanism could positively affect the development of RES, and vice versa. Policy risks can make a difference in the efficiency of RES policies [23,91]. In Canada, good FITs in 2009 created a huge increase of RES. However, the subsidies were cut sharply in 2010, leading to the loss of the RES community’s confidence in the government. In Spain, the abrupt changes in the government’s policy in 2009 caused great uncertainty in the whole RES community. The cancellation of the national funding program and the suspension of FIT made banks and project developers hesitant to invest further in the RES industry. This happened after a boom year of total installations in 2008 when international project developers flocked to Spain to build projects. In Greece, the introduction of a good FIT scheme and an attractive financing framework for investors led to the strong development of solar PV in 2006. By 2007, changes in the legal framework and the complexity of licensing procedures annoyed investors and subsequently slowed the growth of solar PV there. In Italy, the confused and ambiguous energy policy of the government from the second to the third and fourth Conto Energia created great confusion for operators of solar PV [30]. This was the cause of the collapse of the solar PV market there in 2013 and 2014.
In contrast, in Germany, the main strength of the supporting policies is long-term security for investors, without sudden negative changes in the past. Lawmakers acted quickly and decisively to reduce potential risks in policy development at critical points. This is the core of what makes Germany a great success in today’s solar PV. In Australia, strong and regionally appropriate FIT policies have also led to a robust and uniform development of solar PV across the country [69]. As a result, today Australia has one of the top 10 installed solar PV capacities in the world.
It can be said that minimizing risk in policy design is particularly important because of its impact on the financial costs of renewable energy projects, as well as its role in setting the stage for the implementation of renewable energy at a large-scale [23,27,91]. Policies should be tailored to the specific conditions and goals of each country. The associated cost trends should be carefully considered. Furthermore, implementation policies should prioritize long-term stability to attract investment.

5. Conclusions

This paper reviewed the current status of solar PV with the respective adjustments of the FIT mechanism in Vietnam. The government has set a strategic target for developing renewable energy, with a solar PV output target of 1.4 billion kWh by 2020. The revised PDP7 also sets the total installed solar PV capacity by 2020 to be 850 MWp. However, until 2018, the total installed capacity of solar PV was only 106 MWp. This implies the need to set appropriate tariffs for future solar PV development.
The dependence on foreign organizations for technology, engineering, and project development capabilities has made the LCOE of solar PV in Vietnam always high compared to many other countries. Waiting for the global weighted-average LCOE index decrease in order to achieve a similar explosive development of solar PV, such as what happened in 2019, is a passive and unsustainable way of developing the solar PV industry in Vietnam. Despite the government’s subsequent policy adjustments, they are only short-term political interventions. In this regard, the deployment of large-scale projects often responds more quickly to changes in support policies. In the context of FIT policy changes, however, the number of new SPP projects in 2020 has decreased sharply compared to 2019. Investors have focused on the development of a small-scale RTS systems in order to more carefully consider the effects of the newly enacted policies and capital preservation.
In Vietnam, the FIT price is fixed and based on the global average LCOE of solar PV without taking into account the domestic LCOE situation. In addition, the modality of FIT pricing is limited, with no clear distinctions of the applied technology, capacity size, or project location. This has led to the unbalanced development of solar PV projects throughout the territory of Vietnam today. The out-of-control boom of SPP and RTS projects in the south-central and south regions has clearly reflected the impact of the FIT mechanism on the solar PV sector in Vietnam.
The electricity retail price is adjusted annually, but it has not truly been used to leverage sustainable development of PV electricity in Vietnam. The regulated electricity price framework has not yet reflected the current penetration of solar PV as well as RES in Vietnam’s power system. This competitive retail electricity market is still in the plan until 2024. The existing subsidy policy can be an effective tool, but affects investments in solar PV as well as RES installations due to long payback times and costly government budgets.
In the future, the government should build a solar PV roadmap based on the cost trend of demand, technology type, installed capacity, and/or project location. The roadmap should provide vision, target identification, and identify specific actions, especially the stability of policy frameworks. Policy changes should be made in a deliberate and predictable manner. The process of developing and implementing a roadmap is also important and needs to involve stakeholders.
The availability of the power system for solar PV should also be considered in order to ensure the sustainability of future solar PV development. The government should have other support policies to ensure the injection of electricity from solar PV into the power system, including incentives and support for transmission line development and energy storage systems. These policies should be built on the basis of the exploitation potential of solar energy and the absorbance capacity of the grid for solar PV in each region.
Reducing investment risks appears to be important for solar PV deployment, as it provides a safe environment for investors and will allow for sustainable development of the solar PV industry in the future. Policymakers and regulators are responsible for identifying and implementing relevant regulations and market designs that are conducive to investment while maintaining efficiency by providing a satisfying compensation for policy risk. For large-scale solar PV projects, it is possible to organize competitive auctions or offer premium FIT schemes for long-term power purchase agreements with time-based energy pricing.
Policymakers should ask for assistance from international organizations, especially in countries with developed solar industries, and international solar alliances, as well as banks and multilateral and bilateral development agencies.

Author Contributions

Conceptualization, E.R.S. and D.-Q.N.; Validation, M.L.D.S. and S.F.; Resources, M.L.D.S. and S.F.; Data curation, H.T.-T.L. and M.-H.P.; Writing—original draft preparation, H.T.-T.L.; Writing—review and editing, E.R.S. and H.T.-T.L.; Visualization, H.T.-T.L. and M.-H.P.; Supervision, E.R.S. and D.-Q.N.; Project administration, E.R.S. All authors have read and agreed to the published version of the manuscript.

Funding

This research was funded by the project “Design and installation of a grid connected microgrid 100 kWp PV plant and study solutions for developing solar generation in Vietnam to 2030, taking into account greenhouse gas emission reduction”. Code NĐT.80.ITA/20.

Institutional Review Board Statement

Not applicable.

Informed Consent Statement

Not applicable.

Data Availability Statement

The data supporting the reported results can be found at the links in the references below.

Acknowledgments

The authors especially thank the Department of Engineering—University of Palermo, the Institute of Energy Science—Vietnam Academy of Science and Technology, and Nguyen Quang Ninh—Institute of Energy Science for providing funding and for facilitating the work carried out for this study.

Conflicts of Interest

The authors declare no conflict of interest.

References

  1. Jäger-Waldau, A. PV Status Report 2019; Publications Office of the European Union: Luxembourg, 2019; ISBN 978-92-76-12608-9.
  2. REN21. Renewables 2020. Global Status Report; REN21 Secretariat: Paris, France, 2020; ISBN 978-3-9818911-7-1. [Google Scholar]
  3. REN21. Renewables 2021. Global Status Report; REN21 Secretariat: Paris, France, 2021; ISBN 9783948393038. [Google Scholar]
  4. Riva Sanseverino, E.; Le Thi Thuy, H.; Pham, M.-H.; Di Silvestre, M.L.; Nguyen Quang, N.; Favuzza, S. Review of Potential and Actual Penetration of Solar Power in Vietnam. Energies 2020, 13, 2529. [Google Scholar] [CrossRef]
  5. Tvaronaciene, M.; Slusarczyk, B. Energy Transformation towards Sustainability; Elsevier Inc.: Amsterdam, The Netherlands, 2019; ISBN 9780128176887. [Google Scholar]
  6. UN. Report of the Conference of the Parties on its Third Session, Held at Kyoto from 1 to 11 December 1997; United Nations: Kyoto, Japan, 1998.
  7. COP21. Paris Agreement under the United Nations Framework Convention on Climate Change; United Nations: Paris, France, 2015.
  8. COP26. Glasgow Agreement under the United Nations Framework Convention on Climate Change; United Nations: Glasgow, Scotland, 2021.
  9. IRENA. Renewable Power Generation Costs in 2020; International Renewable Energy Agency: Abu Dhabi, United Arab Emirates, 2021; ISBN 978-92-9260-348-9. [Google Scholar]
  10. IRENA. Renewable Power Generation Costs in 2019; International Renewable Energy Agency: Abu Dhabi, United Arab Emirates, 2020; ISBN 9789292602444. [Google Scholar]
  11. Taylor, B.Y.M. Energy Subsidies: Evolution in the Global Energy Transformation to 2050; International Renewable Energy Agency: Abu Dhabi, United Arab Emirates, 2020; ISBN 9789292601256. [Google Scholar]
  12. Lazard Lazard’s Levelized Cost of Energy Analysis—Version 14.0. Available online: https://www.lazard.com/perspective/levelized-cost-of-energy-and-levelized-cost-of-storage-2020/ (accessed on 19 October 2020).
  13. Gray, M.; Ljungwaldh, S.; Watson, L.; Kok, I. Powering Down Coal—Navigating the Economic and Financial Risks in the Last Years of Coal Power; Carbon Tracker Initiative: London, UK, 2018. [Google Scholar]
  14. Perez-Arriaga, I.J.; Batlle, C. Impacts of Intermittent Renewables on Electricity Generation System Operation. Econ. Energy Environ. Policy 2012, 1, 3–18. [Google Scholar] [CrossRef] [Green Version]
  15. Hart, E.K.; Stoutenburg, E.D.; Jacobson, M.Z. The Potential of Intermittent Renewables to Meet Electric Power Demand: Current Methods and Emerging Analytical Techniques. Proc. IEEE 2012, 100, 322–334. [Google Scholar] [CrossRef]
  16. Milanés-Montero, P.; Arroyo-Farrona, A.; Pérez-Calderón, E. Assessment of the Influence of Feed-In Tariffs on the Profitability of European Photovoltaic Companies. Sustainability 2018, 10, 3427. [Google Scholar] [CrossRef] [Green Version]
  17. Ye, L.-C.; Rodrigues, J.F.D.; Lin, H.X. Analysis of feed-in tariff policies for solar photovoltaic in China 2011–2016. Appl. Energy 2017, 203, 496–505. [Google Scholar] [CrossRef]
  18. Dusonchet, L.; Telaretti, E. Economic analysis of different supporting policies for the production of electrical energy by solar photovoltaics in eastern European Union countries. Energy Policy 2010, 38, 4011–4020. [Google Scholar] [CrossRef]
  19. Dusonchet, L.; Telaretti, E. Economic analysis of different supporting policies for the production of electrical energy by solar photovoltaics in western European Union countries. Energy Policy 2010, 38, 3297–3308. [Google Scholar] [CrossRef]
  20. Abolhosseini, S.; Heshmati, A. The main support mechanisms to finance renewable energy development. Renew. Sustain. Energy Rev. 2014, 40, 876–885. [Google Scholar] [CrossRef] [Green Version]
  21. Johnstone, N.; Haščič, I.; Popp, D. Renewable Energy Policies and Technological Innovation: Evidence Based on Patent Counts. Environ. Resour. Econ. 2010, 45, 133–155. [Google Scholar] [CrossRef]
  22. Haas, R.; Panzer, C.; Resch, G.; Ragwitz, M.; Reece, G.; Held, A. A historical review of promotion strategies for electricity from renewable energy sources in EU countries. Renew. Sustain. Energy Rev. 2011, 15, 1003–1034. [Google Scholar] [CrossRef]
  23. Lüthi, S.; Wüstenhagen, R. The price of policy risk—Empirical insights from choice experiments with European photovoltaic project developers. Energy Econ. 2012, 34, 1001–1011. [Google Scholar] [CrossRef] [Green Version]
  24. Couture, T.; Gagnon, Y. An analysis of feed-in tariff remuneration models: Implications for renewable energy investment. Energy Policy 2010, 38, 955–965. [Google Scholar] [CrossRef]
  25. Muhammad-Sukki, F.; Abu-Bakar, S.H.; Munir, A.B.; Mohd Yasin, S.H.; Ramirez-Iniguez, R.; McMeekin, S.G.; Stewart, B.G.; Sarmah, N.; Mallick, T.K.; Abdul Rahim, R.; et al. Feed-in tariff for solar photovoltaic: The rise of Japan. Renew. Energy 2014, 68, 636–643. [Google Scholar] [CrossRef]
  26. Arias, J. Solar Energy, Energy Storage and Virtual Power Plants in Japan—Potential Opportunities of Collaboration between Japanese and European Firms; EU-Japan Centre for Industrial Cooperation: Tokyo, Japan, 2018. [Google Scholar]
  27. Lüthi, S. Effective deployment of photovoltaics in the Mediterranean countries: Balancing policy risk and return. Solar Energy 2010, 84, 1059–1071. [Google Scholar] [CrossRef]
  28. FMENCNS. Act on Granting Priority to Renewable Energy Sources (Renewable Energy Sources Act, Germany, 2000). Solar Energy 2001, 70, 489–504. [Google Scholar] [CrossRef]
  29. Grau, T. Responsive feed-in tariff adjustment to dynamic technology development. Energy Econ. 2014, 44, 36–46. [Google Scholar] [CrossRef]
  30. Di Dio, V.; Favuzza, S.; La Cascia, D.; Massaro, F.; Zizzo, G. Critical assessment of support for the evolution of photovoltaics and feed-in tariff(s) in Italy. Sustain. Energy Technol. Assess. 2015, 9, 95–104. [Google Scholar] [CrossRef]
  31. Homma, T.; Akimoto, K. Analysis of Japan’s energy and environment strategy after the Fukushima nuclear plant accident. Energy Policy 2013, 62, 1216–1225. [Google Scholar] [CrossRef]
  32. METI. Act on Purchase of Renewable Energy Sourced Electricity by Electric Utilities; Japan Ministry of Economy Trade and Industry: Tokyo, Japan, 2011.
  33. CEERP. BP Statistical Review of World Energy 2019; BP International Limited: London, UK, 2019. [Google Scholar]
  34. EREA&DEA. Vietnam Energy Outlook Report 2019; Vietnam Ministry of Industry and Trade: Hanoi, Vietnam, 2019.
  35. Zissler, R. Renewable Energy to Replace Coal Power in Southeast Asia. Pragmatism to Deliver a Sustainable Bright Future; Renewable Energy Institute: Tokyo, Japan, 2019. [Google Scholar]
  36. Prime Minister. Decision 02/2019/QD-TTg on Amendments and Supplements to Certain Articles of Decision No. 11/2017/QD-TTG on the Mechanism for Encouragement of Development of Solar Power in Vietnam; Vietnam Government: Hanoi, Vietnam, 2019.
  37. Prime Minister. Decision 11/2017/QD-TTg on Mechanism for Encouragement of the Development of Solar Power Projects in Vietnam; Vietnam Government: Hanoi, Vietnam, 2017.
  38. Prime Minister. Decision 13/2020/QD-TTg on Mechanism for Encouragement of the Development of Solar Power in Vietnam; Vietnam Government: Hanoi, Vietnam, 2020.
  39. VGO. Notice 402/TB-VPCP of Prime Minister’s Conclusions on the Draft of Solar Power Promotion Mechanism in Vietnam, Applied from July 1, 2019, Following Decision 11/2017/QD-TTg; Vietnam Goverment Office: Hanoi, Vietnam, 2019.
  40. MoIT. Dispatch 9608/BCT-DL on Suspension of Proposal and Agreement for Solar Power Projects under FIT Price Mechanism; Vietnam Ministry of Industry and Trade: Hanoi, Vietnam, 2019.
  41. MoIT. Dispatch 89/BCT-DL on on Implementation of Agreements with Rooftop Solar Power; Vietnam Ministry of Industry and Trade: Hanoi, Vietnam, 2020.
  42. MoIT. Proposal 10170/TTr-BCT of a New Draft Decision on the Mechanism for Developing Solar Power Projects in Vietnam; Vietnam Ministry of Industry and Trade: Hanoi, Vietnam, 2019.
  43. VEPG. Vietnam Factsheet on Rooftop Solar Development 2019; Viet Nam Energy Partnership Group: Hanoi, Vietnam, 2019. [Google Scholar]
  44. EVN. Press Release on Capacity Release of Renewable Energy Sources of Vietnam Electricity. Available online: https://www.evn.com.vn/d6/news/Den-3062019-Tren-4460-MW-dien-mat-troi-da-hoa-luoi-6-12-23925.aspx (accessed on 10 September 2020).
  45. Minh Khuong, P.; McKenna, R.; Fichtner, W. A Cost-Effective and Transferable Methodology for Rooftop PV Potential Assessment in Developing Countries. Energies 2020, 13, 2501. [Google Scholar] [CrossRef]
  46. Lan, T.T.; Techato, K.; Jirakiattikul, S. The challenge of feed-in-tariff (FIT) policies applied to the development of electricity from sustainable resources—Lessons for Vietnam. Int. Energy J. 2019, 19, 199–212. [Google Scholar]
  47. Shem, C.; Simsek, Y.; Hutfilter, U.F.; Urmee, T. Potentials and opportunities for low carbon energy transition in Vietnam: A policy analysis. Energy Policy 2019, 134, 110818. [Google Scholar] [CrossRef]
  48. Nguyen, P.A.; Abbott, M.; Nguyen, T.L.T. The development and cost of renewable energy resources in Vietnam. Util. Policy 2019, 57, 59–66. [Google Scholar] [CrossRef]
  49. Phap, V.M.; Thu Huong, N.T.; Hanh, P.T.; Van Duy, P.; Van Binh, D. Assessment of rooftop solar power technical potential in Hanoi city, Vietnam. J. Build. Eng. 2020, 32, 101528. [Google Scholar] [CrossRef]
  50. MoIT&DEA. Vietnam Energy Outlook 2017; Danish Energy Agency: Hanoi, Vietnam, 2017.
  51. WB Group. Solar Resource Maps for More Than 200 Countries on the World. Available online: https://solargis.com/maps-and-gis-data/download (accessed on 8 May 2021).
  52. IEA. Southeast Asia Energy Outlook 2017; OECD: Bangkok, Thailand, 2017; ISBN 9789264285576. [Google Scholar]
  53. Prime Minister. Decision 1855/QD-TTg of Approving Vietnam’s National Energy Development Strategy up to 2020, with Vision to 2050; Vietnam Government: Hanoi, Vietnam, 2007.
  54. Prime Minister. Decision 1208/QD-TTg Dated 21 July 2011 of Approving the National Master Plan for Power Development in the 2011–2020 Period, with Considerations to 2030; Vietnam Government: Hanoi, Vietnam, 2011.
  55. Prime Minister. Decision 2081/QD-TTg of Approving the Program on Electricity Supply in Rural, Mountainous and Island Areas in Period of 2013–2020; Vietnam Government: Hanoi, Vietnam, 2013.
  56. Prime Minister. Decision 2068/QD-TTg of Approving the Viet Nam’s Renewable Energy Development Strategy up to 2030 with an Outlook to 2050; Vietnam Government: Hanoi, Vietnam, 2015.
  57. Prime Minister. Decision 428/QD-TTg of Approval of the Revised National Power Development Master Plan for the 2011–2020 Period with the vision to 2030; Vietnam Government: Hanoi, Vietnam, 2016.
  58. Prime Minister. Decision 37/2011/QD-TTg on the Mechanism Supporting the Development of wind Power Project in Vietnam; Vietnam Government: Hanoi, Vietnam, 2011.
  59. Sinh, T.D.; Long, N.H.; Dung, N.T.M. Report on Rural Electrification Policies and Supporting Mechanisms for Off-Grid Community; Green Innovation and Development Centre: Hanoi, Vietnam, 2017. [Google Scholar]
  60. MoIT. Decision 2023/QD-BCT of Approving the Program to Promote the Development of Rooftop Solar Power in Vietnam in Period of 2019–2025; Vietnam Ministry of Industry and Trade: Hanoi, Vietnam, 2019.
  61. MoIT. Circular 16/2017/TT-BCT on Project Development and Model Power Purchase Agreements Applied to Solar Power Projects; Vietnam Ministry of Industry and Trade: Hanoi, Vietnam, 2017.
  62. MoIT. Circular 18/2020/TT-BCT on Project Development and Model Power Purchase Agreements Applied to Solar Power Projects; Vietnam Ministry of Industry and Trade: Hanoi, Vietnam, 2020.
  63. MoIT. Circular 05/2019/TT-BCT of Amendments to Circular 16/2017/TT-BCT on Development of Solar Power Projects and Standard form Power Purchase Agreement; Vietnam Ministry of Industry and Trade: Hanoi, Vietnam, 2019.
  64. VEPG. Vietnam Factsheet on Rooftop Solar Development 2020; Viet Nam Energy Partnership Group: Hanoi, Vietnam, 2020. [Google Scholar]
  65. EVN Press Release on Capacity Release of Renewable Energy Sources of Vietnam Electricity. Available online: https://www.evn.com.vn/d6/news/Khi-dien-mat-troi-bung-no-141-17-27530.aspx (accessed on 6 January 2021).
  66. Polo, J.; Martínez, S.; Fernandez-Peruchena, C.M.; Navarro, A.A.; Vindel, J.M.; Gastón, M.; Ramírez, L.; Soria, E.; Guisado, M.V.; Bernardos, A.; et al. Maps of Solar Resource and Potential in Vietnam; Vietnam Ministry of Industry and Trade: Hanoi, Vietnam, 2015.
  67. Lee, N.; Flores-espino, F.; Oliveira, R.; Roberts, B.; Bowen, T.; Katz, J. Exploring Renewable Energy Opportunities in Select Southeast Asian Countries: A Geospatial Analysis of the Levelized Cost of Energy of Utility-Scale Wind and Solar Photovoltaics; National Renewable Energy Laboratory: Washington, DC, USA, 2020.
  68. WB Group. Vietnam Solar Competitive Bidding Strategy and Framework; World Bank Group: Washington, DC, USA, 2019. [Google Scholar]
  69. Zahedi, A. A review on feed-in tariff in Australia, what it is now and what it should be. Renew. Sustain. Energy Rev. 2010, 14, 3252–3255. [Google Scholar] [CrossRef]
  70. Yoomak, S.; Patcharoen, T.; Ngaopitakkul, A. Performance and Economic Evaluation of Solar Rooftop Systems in Different Regions of Thailand. Sustainability 2019, 11, 6647. [Google Scholar] [CrossRef] [Green Version]
  71. Orioli, A.; Franzitta, V.; Di Gangi, A.; Foresta, F. The Recent Change in the Italian Policies for Photovoltaics: Effects on the Energy Demand Coverage of Grid-Connected PV Systems Installed in Urban Contexts. Energies 2016, 9, 944. [Google Scholar] [CrossRef] [Green Version]
  72. Brückmann, R.; Jirouš, F.; Spitzley, J.-B.; Herling, J.; Bauknecht, D. Integration of Electricity from Renewables to the Electricity Grid and to the Electricity Market—RES National Report: Slovakia; Institute for Applied Ecology: Berlin, Germany, 2012. [Google Scholar]
  73. WB Group. Turkey—Rooftop Solar PV Market Assessment: Final Report; World Bank Group: Washington, DC, USA, 2018. [Google Scholar]
  74. Ayoub, N.; Yuji, N. Governmental intervention approaches to promote renewable energies—Special emphasis on Japanese feed-in tariff. Energy Policy 2012, 43, 191–201. [Google Scholar] [CrossRef]
  75. EC. Support Schemes for Renewable Electricity in the EU, No. 408; European Commission: Brussels, Belgium, 2010; ISBN 9789279148941. [Google Scholar]
  76. Schallenberg-Rodriguez, J.; Haas, R. Fixed feed-in tariff versus premium: A review of the current Spanish system. Renew. Sustain. Energy Rev. 2012, 16, 293–305. [Google Scholar] [CrossRef]
  77. IEA. Solar Energy: Maping the Road Ahead; International Energy Agency: Paris, France, 2019. [Google Scholar]
  78. Ragwitz, M.; Winkler, J.; Klessmann, C.; Gephart, M.; Resch, G. Recent Developments of Feed-in Systems in the EU—A Research Paper for the International Feed-In Cooperation; Ministry for the Environment, Nature Conservation and Nuclear Safety (BMU): Munich, Germany, 2012. [Google Scholar]
  79. Lesser, J.A.; Su, X. Design of an economically efficient feed-in tariff structure for renewable energy development. Energy Policy 2008, 36, 981–990. [Google Scholar] [CrossRef]
  80. EPIA. Retrospective Measures at National Level and Their Impact on the Photovoltaic Sector; European Photovoltaic Industry Association: Brussels, Belgium, 2013. [Google Scholar]
  81. EREA&DEA. Detailed grid modelling of the Vietnamese power system. Background to the Vietnam Energy Outlook Report 2019; Vietnam Ministry of Industry and Trade: Hanoi, Vietnam, 2019.
  82. Singh, R.; Banerjee, R. Estimation of rooftop solar photovoltaic potential of a city. Solar Energy 2015, 115, 589–602. [Google Scholar] [CrossRef]
  83. IRENA. Renewable Energy Statistics 2019; International Renewable Energy Agency: Abu Dhabi, United Arab Emirates, 2019; ISBN 978-92-9260-033-4. [Google Scholar]
  84. IEA-PVPS. Photovoltaic Power Systems: Annual Report 2018; International Energy Agency: Fribourg, Switzerland, 2018; ISBN 978-3-906042-84-8. [Google Scholar]
  85. Prime Minister. Decision 34/2017/QD-TTg of the Price Frame of the Average Electricity Retail Price for a Period of 2016–2020; Vietnam Government: Hanoi, Vietnam, 2017.
  86. MoIT. Decision 648/QD-BCT of Adjusting the Average Electricity Retail Price and Stipulating Electricity Selling Price from 20th March 2019; Vietnam Ministry of Industry and Trade: Hanoi, Vietnam, 2019.
  87. MoIT. Decision 4495/QD-BCT of Electricity Retail Price from 1st December 2017; Vietnam Ministry of Industry and Trade: Hanoi, Vietnam, 2017.
  88. MoIT. Decision 2093/QĐ-BCT on Approved the Scheme of Competitive Retail Electricity Market Model Design; Vietnam Ministry of Industry and Trade: Hanoi, Vietnam, 2020.
  89. Martinez, R.; Hosein, P. The Impact of Low Electricity Prices on Renewable Energy Production. In Proceedings of the 2018 International Conference and Utility Exhibition on Green Energy for Sustainable Development (ICUE), Phuket, Thailand, 24–26 October 2018; pp. 1–6. [Google Scholar]
  90. Kok, G.; Shang, K.; Yucel, S. Impact of Electricity Pricing Policy on Renewable Energy Investments and Carbon Emissions. SSRN Electron. J. 2014, 64, 1–48. [Google Scholar] [CrossRef]
  91. White, W.; Lunnan, A.; Nybakk, E.; Kulisic, B. The role of governments in renewable energy: The importance of policy consistency. Biomass Bioenergy 2013, 57, 97–105. [Google Scholar] [CrossRef]
Figure 1. Total global installed capacity of solar PV in 2010–2020. (Adapted from Refs. [2,3]).
Energies 15 00556 g001
Figure 2. Total installed capacity of solar PV in top countries by 2020. (Adapted from Refs. [2,3,4]).
Energies 15 00556 g002
Figure 3. Global weighted-average LCOE of solar PV in 2010 and 2020. (Adapted from Refs. [9,10]).
Energies 15 00556 g003
Figure 4. Global weighted-average installed costs and capacity factors of Solar PV in 2010–2020. (Adapted from Refs. [9,10]).
Energies 15 00556 g004
Figure 5. Types of electricity generation in Vietnam in 2018. (Adapted from Refs. [33,34,35]).
Energies 15 00556 g005
Figure 6. Targets for electricity output by fuels under revised PDP7. (Adapted with Refs. [54,57]).
Energies 15 00556 g006
Figure 7. Targets for electricity production by renewables under REDS in Vietnam. (Adapted from Ref. [56]).
Energies 15 00556 g007
Figure 8. Total installed capacity of Solar PV by 2020 and planning under revised PDP7. (Adapted from Refs. [2,3,4]).
Energies 15 00556 g008
Figure 9. Share of total installed capacity of new SPP and RTS in 2019 and 2020. (Adapted from Refs. [43,44,64,65]).
Energies 15 00556 g009
Figure 10. Share of new RTS and SPP according to region in 2019 and 2020. (Adapted from Refs. [43,44,64,65]).
Energies 15 00556 g010
Figure 11. Weighted-average LCOE/FIT in Vietnam and LCOE of the World. (Adapted from Refs. [4,9,10]).
Energies 15 00556 g011
Figure 12. Solar potential and LCOE for SPP in Vietnam in 2019–2020. (Adapted from Refs. [66,67]).
Energies 15 00556 g012
Figure 13. Solar potential and LCOE for RTS in Vietnam in 2019–2020. (Adapted from Refs. [45,66]).
Energies 15 00556 g013
Figure 14. Electricity price and weighted-average LCOE and FIT of solar PV in Vietnam. (Adapted from Refs. [9,10,36,37,85,86,87]).
Energies 15 00556 g014
Table 1. The FIT for grid-connected solar PV in 2017–2020. (Adapted from Refs. [36,37,38]).
YearRTS
(UScents/kWh)
SPP (UScents/kWh)Tariff Duration (Years)Max. Cap (MWp)Others
FloatingGround
2017 9.359.3520
20199.359.359.3520
20208.387.697.0920<1 (RTS)
9.359.359.3520<2000Ninh Thuan
Publisher’s Note: MDPI stays neutral with regard to jurisdictional claims in published maps and institutional affiliations.

