1. Introduction
The objective of this study is to develop a microscopic energy consumption model of hydrogen fuel cell vehicles (HFCVs) that can accommodate real-time connected automated vehicle (CAV) transportation applications. Based on a recent United States Environmental Protection Agency (US EPA) report, a typical internal combustion engine passenger vehicle emits about 4.6 metric tons of carbon dioxide per year [
1]. Many governments and vehicle manufacturers around the world are promoting the development and support of alternative fuel vehicles, which do not use traditional petroleum fuels, to address these environmental concerns. The HFCV is an alternative fuel vehicle that relies on hydrogen fuel for vehicle power.
An HFCV is an electric car since it uses an electric powertrain. Similar to a battery electric vehicle (BEV), HFCVs utilize electric motors for propulsion as opposed to more “traditional” internal combustion engine vehicles (ICEVs). The fuel cell generates electricity to power the vehicle and charges a battery. Fuel cells in the HFCV generate electricity through a chemical reaction process that utilizes oxygen and a fuel source of compressed hydrogen gas.
A major benefit of HFCVs compared to BEVs is the refueling time. BEVs can take from 20 min to overnight to recharge, depending on the charger type and battery size. Level 1 chargers, typical home outlet chargers (110 volts) in the US, take 17–20 h to charge a 100-mile-range car battery. Level 2 chargers that use a 240-volt outlet reduce the charging time to 4–5 h for the same range. If a BEV can handle a fast charging outlet, the charging time can be less than 30 min to charge up to 80% of full range using DC fast charging stations. However, for an HFCV, the fueling time is similar to gasoline or diesel vehicles. The fueling time of HFCVs is approximately 5 min or less to fully refuel a tank of hydrogen [
2].
A typical HFCV has a battery pack that stores energy generated from regenerative braking. It also provides supplemental power to the electric traction motor similar to hybrid electric vehicles (HEVs). The HFCV battery can also power auxiliary loads and reduce engine idling when fuel cells are not used. Although an HFCV can be designed as a plug-in hybrid hydrogen vehicle that can charge the battery, most HFCVs do not have a charging function and use a smaller battery compared to a BEV battery. The driving range of BEVs is determined by the size of the battery. An HFCV’s driving range, as well as the amount of power and energy consumed for the vehicle’s operations, is instead determined by the hydrogen fuel tank size.
The energy consumption patterns of different vehicles, including ICEVs and BEVs, are significantly different with regard to driving cycles. A previous study found that ICEVs are more fuel-efficient in high-speed freeway operational conditions, while BEVs are more energy efficient on low-speed arterial trips. Furthermore, the study found that a test ICEV had similar fuel consumption rates on a Freeway G cycle and a Local cycle but that BEV’s energy consumption rates on these two cycles were significantly different due to the BEV’s regenerative braking system [
3,
4]. We expect that HFCVs will have a different energy consumption pattern due to their regenerative braking system.
The proposed fuel consumption model estimates an HFCV’s instantaneous energy consumption using vehicle operational input variables, including the vehicle’s instantaneous speed, acceleration, and roadway grade, which can be easily obtained from stand-alone Global Positioning System (GPS) loggers or various smartphone applications. The proposed model fills a void in the state-of-the-art given that it develops a simple model that can be applied in smartphone applications and microscopic traffic simulators.
The remainder of the paper is organized as follows: the next section reports the state-of-the art of HFCV energy consumption modeling efforts. Subsequently, the paper describes the HFCV fuel consumption data that were utilized for this study. The next sections explain the proposed model development and the validation results. Finally, the conclusions of the study are summarized.
2. Literature Review
Acar and Dincer investigated the role of hydrogen as a sustainable transportation fuel to reduce transportation emissions [
5]. The study compared ICEVs, HEVs, BEVs, biofuel vehicles, HFCVs, and hydrogen-fueled ICE vehicles for their CO
2 and SO
2 emissions, social cost of carbon, energy and exergy efficiencies, fuel consumption, fuel price, and driving range. The study concluded that fuel cell vehicles have the highest average performance ranking for a sustainable transportation option and emphasized that hydrogen should be produced from renewable energy and material resources with zero or minimal emissions at high efficiencies in order to become a truly sustainable and clean fuel. Kurtz et al. reviewed transportation hydrogen infrastructure performance and reliability [
6]. The study investigated the engineering and deployment of modern hydrogen infrastructure, including the costs, benefits, and operational considerations, as well as technical difficulties for the expansion of hydrogen infrastructure. The study identified the low reliability, high maintenance costs, and limited availability of modern hydrogen stations as the major technical hurdles to large-scale hydrogen system commercialization. The study recommended that to achieve the economic and sustainability goals for more widespread hydrogen-fueled transportation, the industry must overcome near-term hydrogen infrastructure challenges by supporting hydrogen stations with low cost, high reliability, and high availability.
Li et al. evaluated a Kriging-based bi-objective constrained optimization (KBCO) algorithm for the fuel economy of HFCVs [
7]. An HFCV has a complex electro-mechanical and hydraulic control system that includes a number of control parameters. The study developed a KBCO algorithm that can be used for the parameter optimization of HFCV control to improve HFCV performance. The study utilized the automotive simulation platform ADVISOR (ADvanced VehIcle SimulatOR) that was created by the US Department of Energy’s National Renewable Energy Laboratory [
8,
9] to perform simulation analysis of an HFCV. The study claimed that the proposed algorithm is effective in solving constrained optimization problems for the energy control strategy of hydrogen fuel cells and battery, and minimizing the hydrogen consumption under the constraints of velocity, accelerating performance, and battery charge state.
Xu et al. developed a dynamic model for fuel cell electric vehicles to improve both energy efficiency and system durability [
10]. The study defined a multi-objective optimization problem for the fuel cell electric vehicle control system and adapted a quasi-optimal solution using a two-loop framework based on a dynamic programming algorithm and the Pareto optimal principle. The study tested the algorithm on a fuel cell city bus, finding the optimum battery capacity and a fuel cell maximal net output for the fuel economy and system durability of that bus.
Kaya and Hames also investigated control strategies for HFCVs to save energy [
11]. The study considered two different control strategies developed on HFCVs and compared them with the state machine control strategy. Additionally, the study examined system efficiency, fuel consumption, lifespan of vehicle technology, and vehicle performance by working with different HFCV control mechanisms. The study claimed that the proposed control strategies could be easily applied to different HFCVs with minor changes due to the simplicity of their structure and parameters. Shusheng et al. analyzed the basic structure of an onboard hydrogen-producing fuel cell electric vehicle and tested a hybrid drive model and a pure fuel cell drive model on the ADVISOR simulation platform [
12]. The study found that fuel cells and lithium batteries work in a highly efficient manner but the output power of fuel cells has smaller fluctuations, improving energy utilization efficiency and extending the service life of the fuel cell in the hybrid drive model.
Caux et al. investigated energy management strategies for a hybrid fuel cell vehicle [
13]. The study proposed an energy management model that solves a combinatorial optimization problem for the storage element and discretization of the space of the fuel cell to improve the quality of decisions for the energy management system. The approach replicates the operation of the HFCV energy chain to provide an optimal solution for hydrogen consumption. Simulation studies found that the proposed energy management strategies could significantly improve the solution quality and computational time compared to other approaches.
A previous study demonstrated that a fuel/energy model was developed with a special interest in measuring fuel/energy consumption for transportation planning, transportation impact assessments, vehicle technology evaluations, traffic simulation models, and specific control conditions [
14]. In order to be utilized for real-time CAV transportation applications, there are several requirements for an ideal fuel/energy consumption model. Rakha et al. recommended four major criteria: real-time computation, accuracy, model structure, and model calibration simplicity [
15]. The model should have a simple structure that does not require resource-demanding computations and which can be used for real-time computations using instantaneous vehicle operational data. In addition, the model should provide reasonable accuracy with the fewest input variables and should be applicable for general vehicle populations. In this paper, we attempt to develop an HFCV energy model that can accommodate these requirements.
A number of studies developed and investigated the power management models of HFCVs to improve the energy consumption and efficiencies of the fuel cell system. However, there is little previous research on HFCV energy consumption models that can be implemented into transportation applications, while a number of such energy consumption models are available for ICEVs, BEVs, and HEVs. This study develops an energy consumption model that can be utilized in various transportation applications.
The contribution of the study is to develop a microscopic energy consumption model for HFCVs to quantify their energy impacts on real-time CAV transportation applications within traffic simulation models. Unlike previous work, the HFCV energy consumption model uses the vehicle’s instantaneous speed, acceleration, and roadway grade data as input variables, given that they can be easily obtained from stand-alone GPS loggers or various smartphone applications. Because of its simplicity, the model can be easily integrated within microscopic traffic simulation models and in-vehicle and smartphone applications to quantify HFCV energy consumption.
3. Hydrogen Energy Consumption Data
This study utilized a test dataset that was collected in a controlled laboratory environment at the Argonne National Laboratory. The test vehicle, a 2017 Toyota Mirai, includes a 114 kW hydrogen fuel cell stack and 1.6 kWh nickel–metal hydride battery to control the allocation of energy between the fuel cell electric and the battery power paths. The hydrogen storage of the test vehicle is 10,000 psi, 5 kg of H
2. The study used public data that are available on the Downloadable Dynamometer Database (
https://www.anl.gov/es/downloadable-dynamometer-database, access data: 4 November 2021). The data were collected by the Fuel Cell Technologies Office at the US Department of Energy (US DOE), and tested in collaboration with Transport Canada’s Innovation Centre. This study utilized the 10-hertz energy consumption data of the 2017 Toyota Mirai to develop an HFCV energy consumption model.
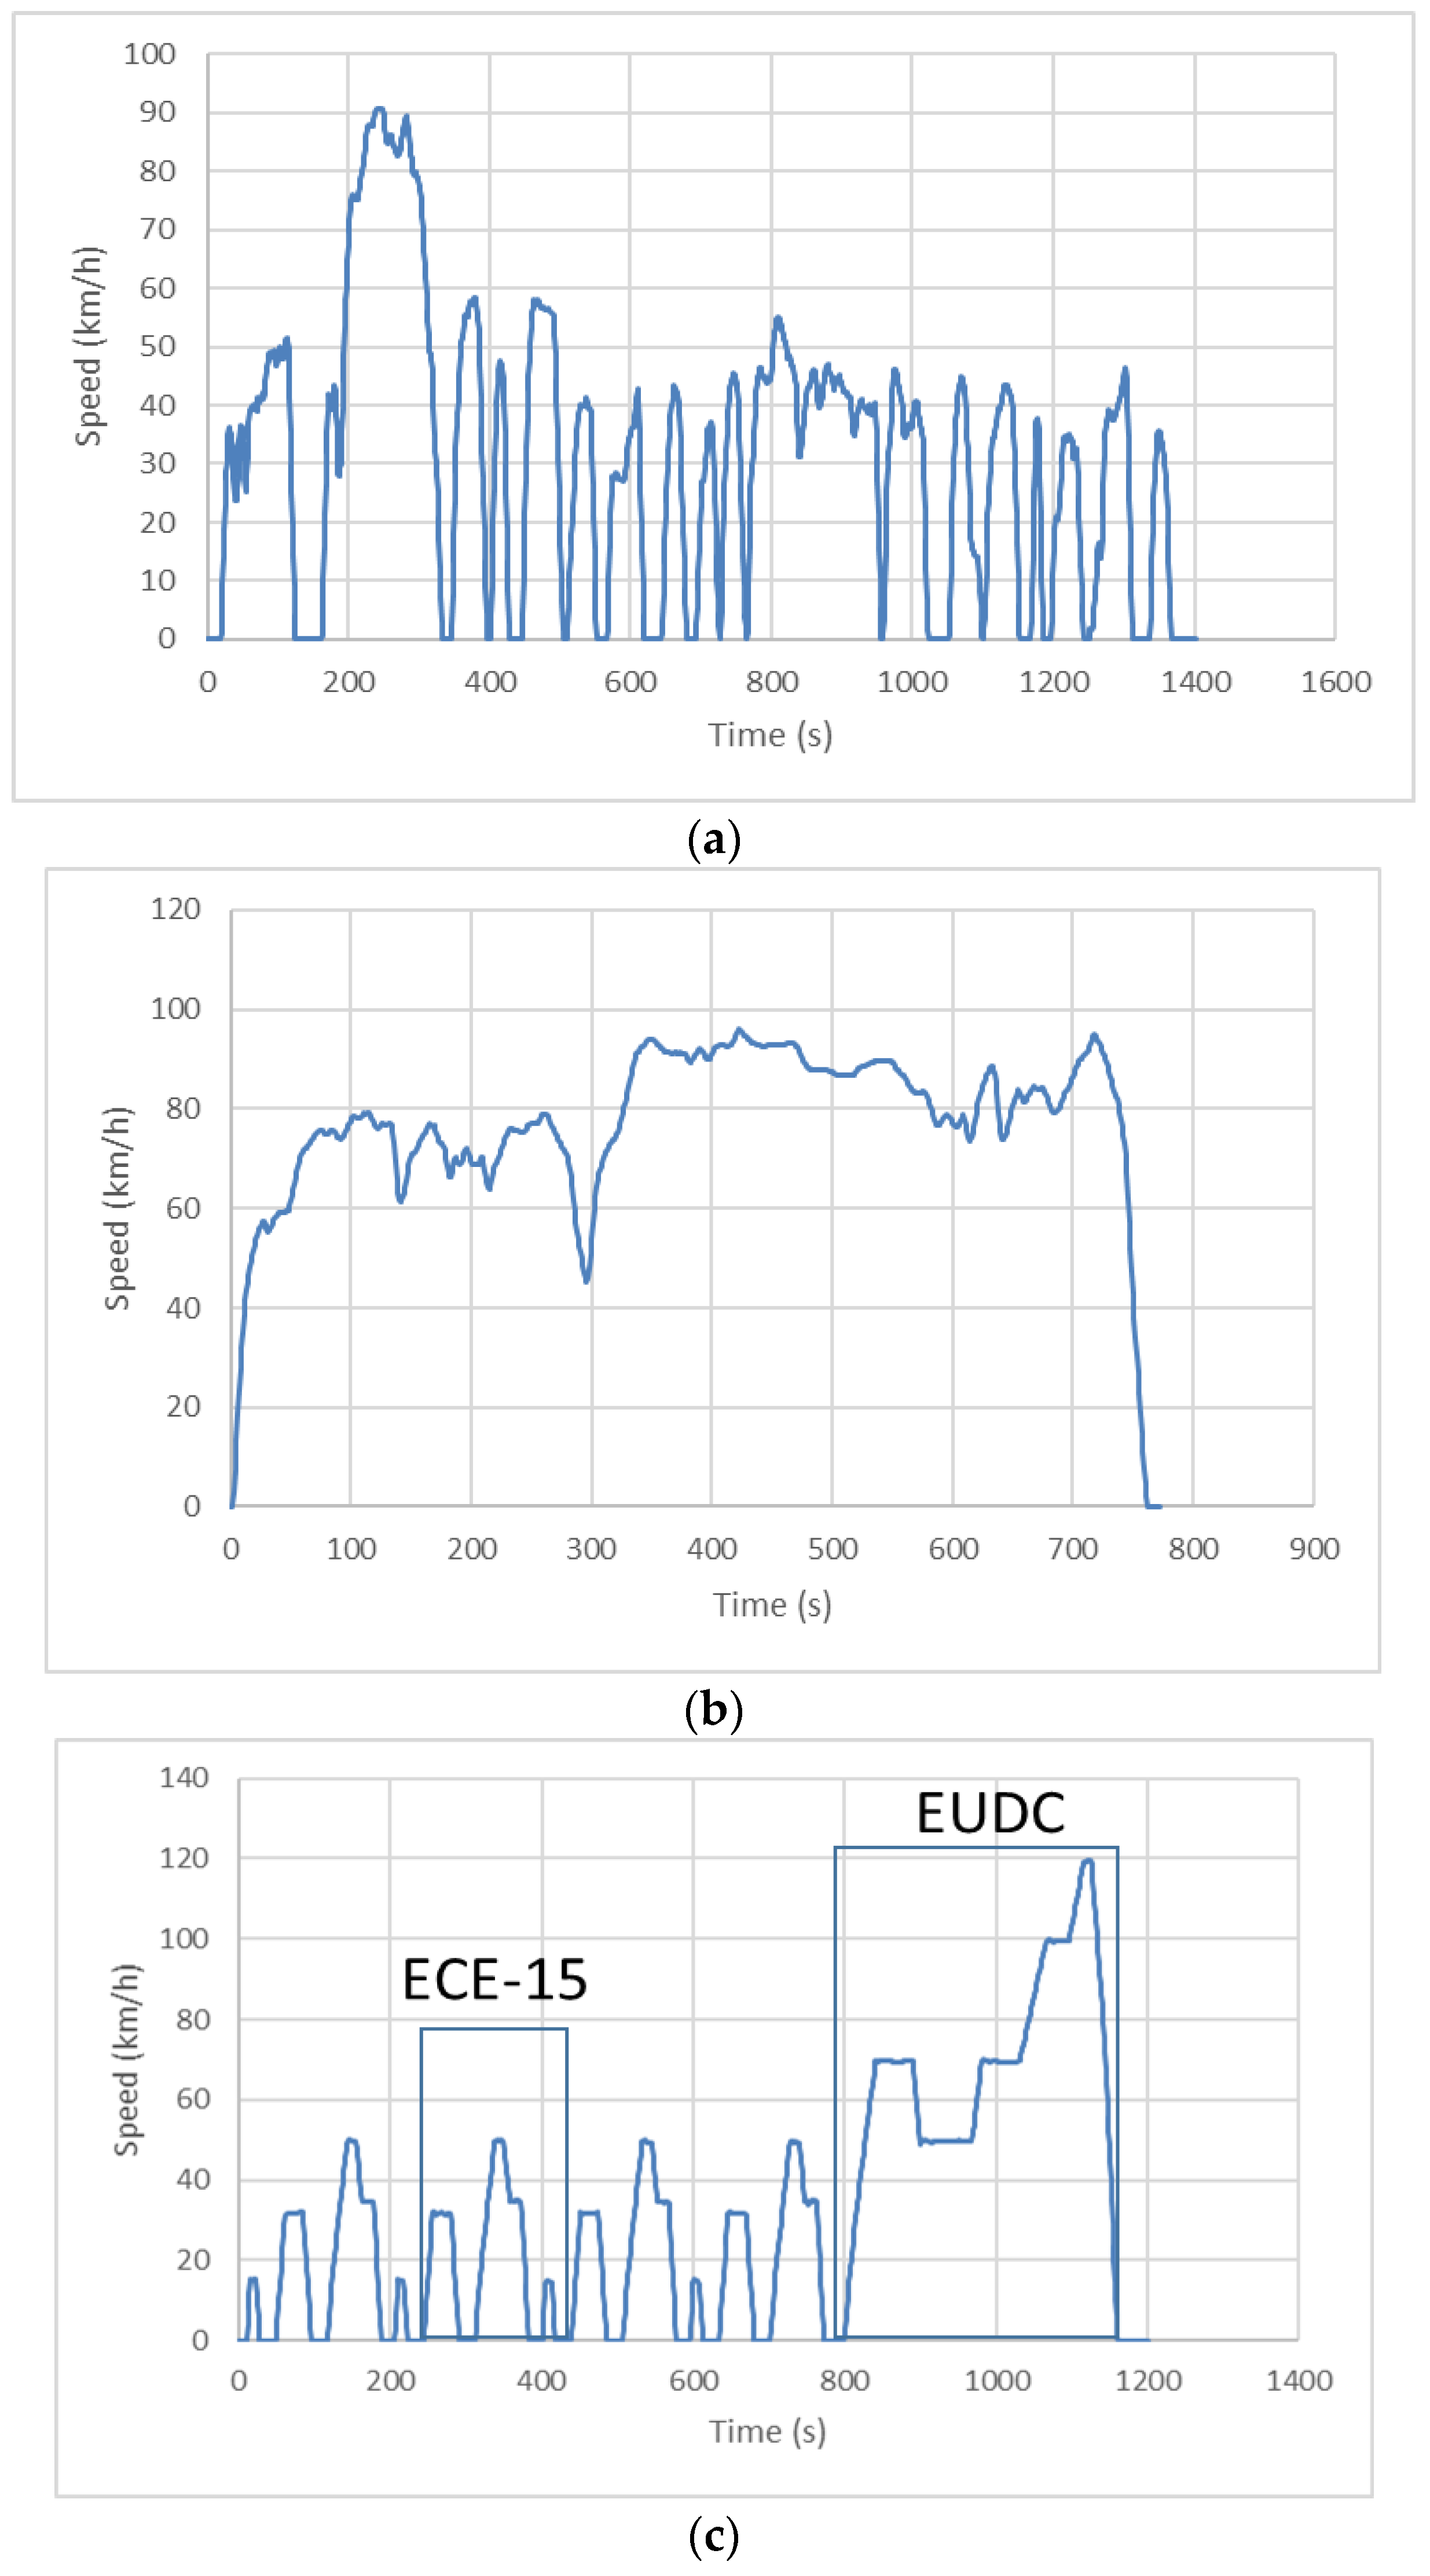
We utilized three driving data cycles, including the Urban Dynamometer Driving Schedule (UDDS), the Highway Fuel Economy Test (HWFET), and the New European Driving Cycle (NEDC).
Table 1 shows the driving characteristics of the three driving cycles. The UDDS (also called LA-4 cycle) simulates an urban route with frequent stops. The driving cycle is typically used for light duty vehicle testing. The HWFET was developed by the US EPA to simulate highway driving conditions for light duty vehicles. NEDC was developed to represent the typical usage of a car in Europe. The driving cycle consists of four repeated ECE-15 urban driving cycles (UDC) and one extra-urban driving cycle (EUDC). The cycle was designed to assess the emission levels of car engines and fuel economy in passenger cars. However, NEDC is also used to estimate the electric power consumption and driving range of HEVs and BEVs. This study utilized the data collected with hot-stabilized conditions without using air condition and used neither cold-start data nor the data collected under hot and cold weather conditions.
Figure 1 shows the speed profiles of the three driving cycles. The study utilized two repeated driving cycle data of the Highway cycle and NEDC cycle.
4. HFCV Energy Consumption Modeling
It is difficult to estimate the energy consumption of HFCVs due to the complexity of their fuel cell and battery components. The powertrain of an HFCV includes a fuel cell stack, a battery pack, a power electronic controller, an electric traction motor, and a DC/DC converter [
16]. The fuel cell stack is an assembly of individual fuel cells that use hydrogen and oxygen to produce electricity. The battery pack is a battery that stores energy generated from regenerative braking and provides supplemental power to the electric traction motor. The power electronics controller manages the flow of electrical energy delivered by the fuel cell and the traction battery, controlling the speed of the electric traction motor and the torque it produces. The electric traction motor drives the vehicle’s wheels using power from the fuel cell and the battery pack. The DC/DC converter converts higher-voltage DC power from the traction battery pack to the lower-voltage DC power needed to run vehicle accessories and recharge the auxiliary battery.
Figure 2 illustrates the relationship between an HFCV’s vehicle speed and energy consumption. As illustrated in the figure, the vehicle’s energy consumption rates and fuel cell power consumption are significantly affected by vehicle speed. The figure demonstrates that the power generated by the fuel cell is significantly higher than the power generated by the battery. It also demonstrates that the battery provides limited supplemental power to the electric traction motor.
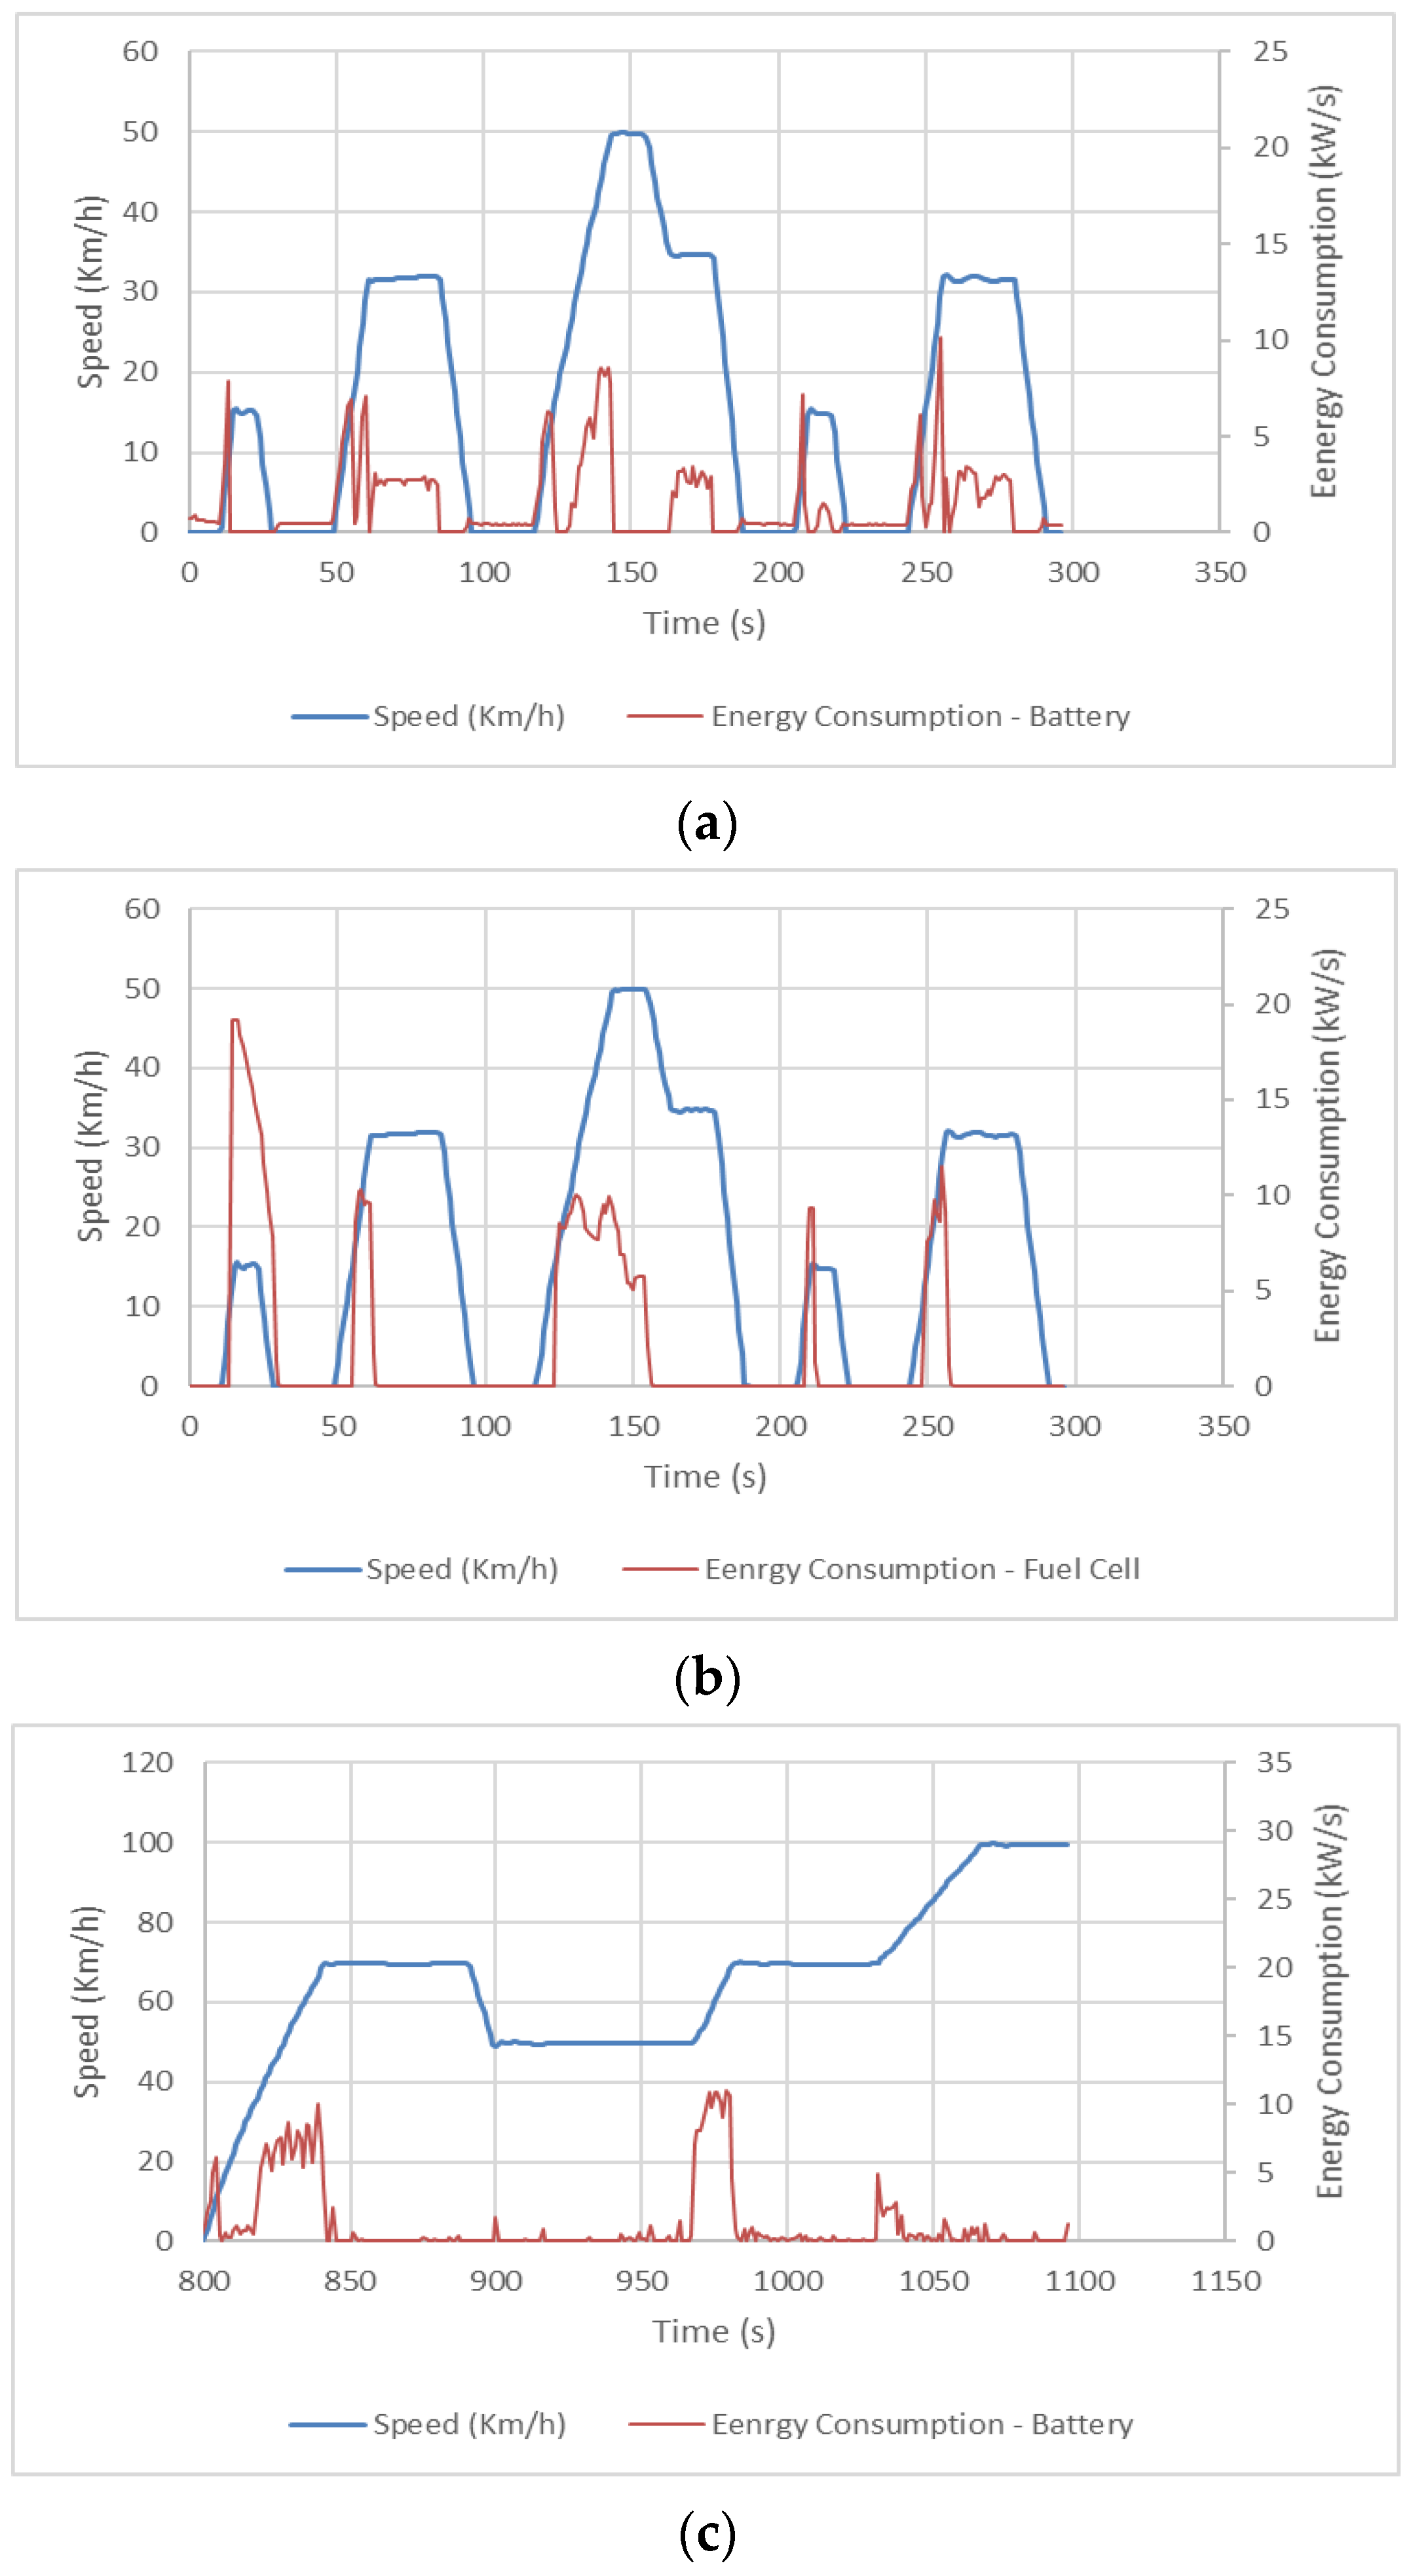
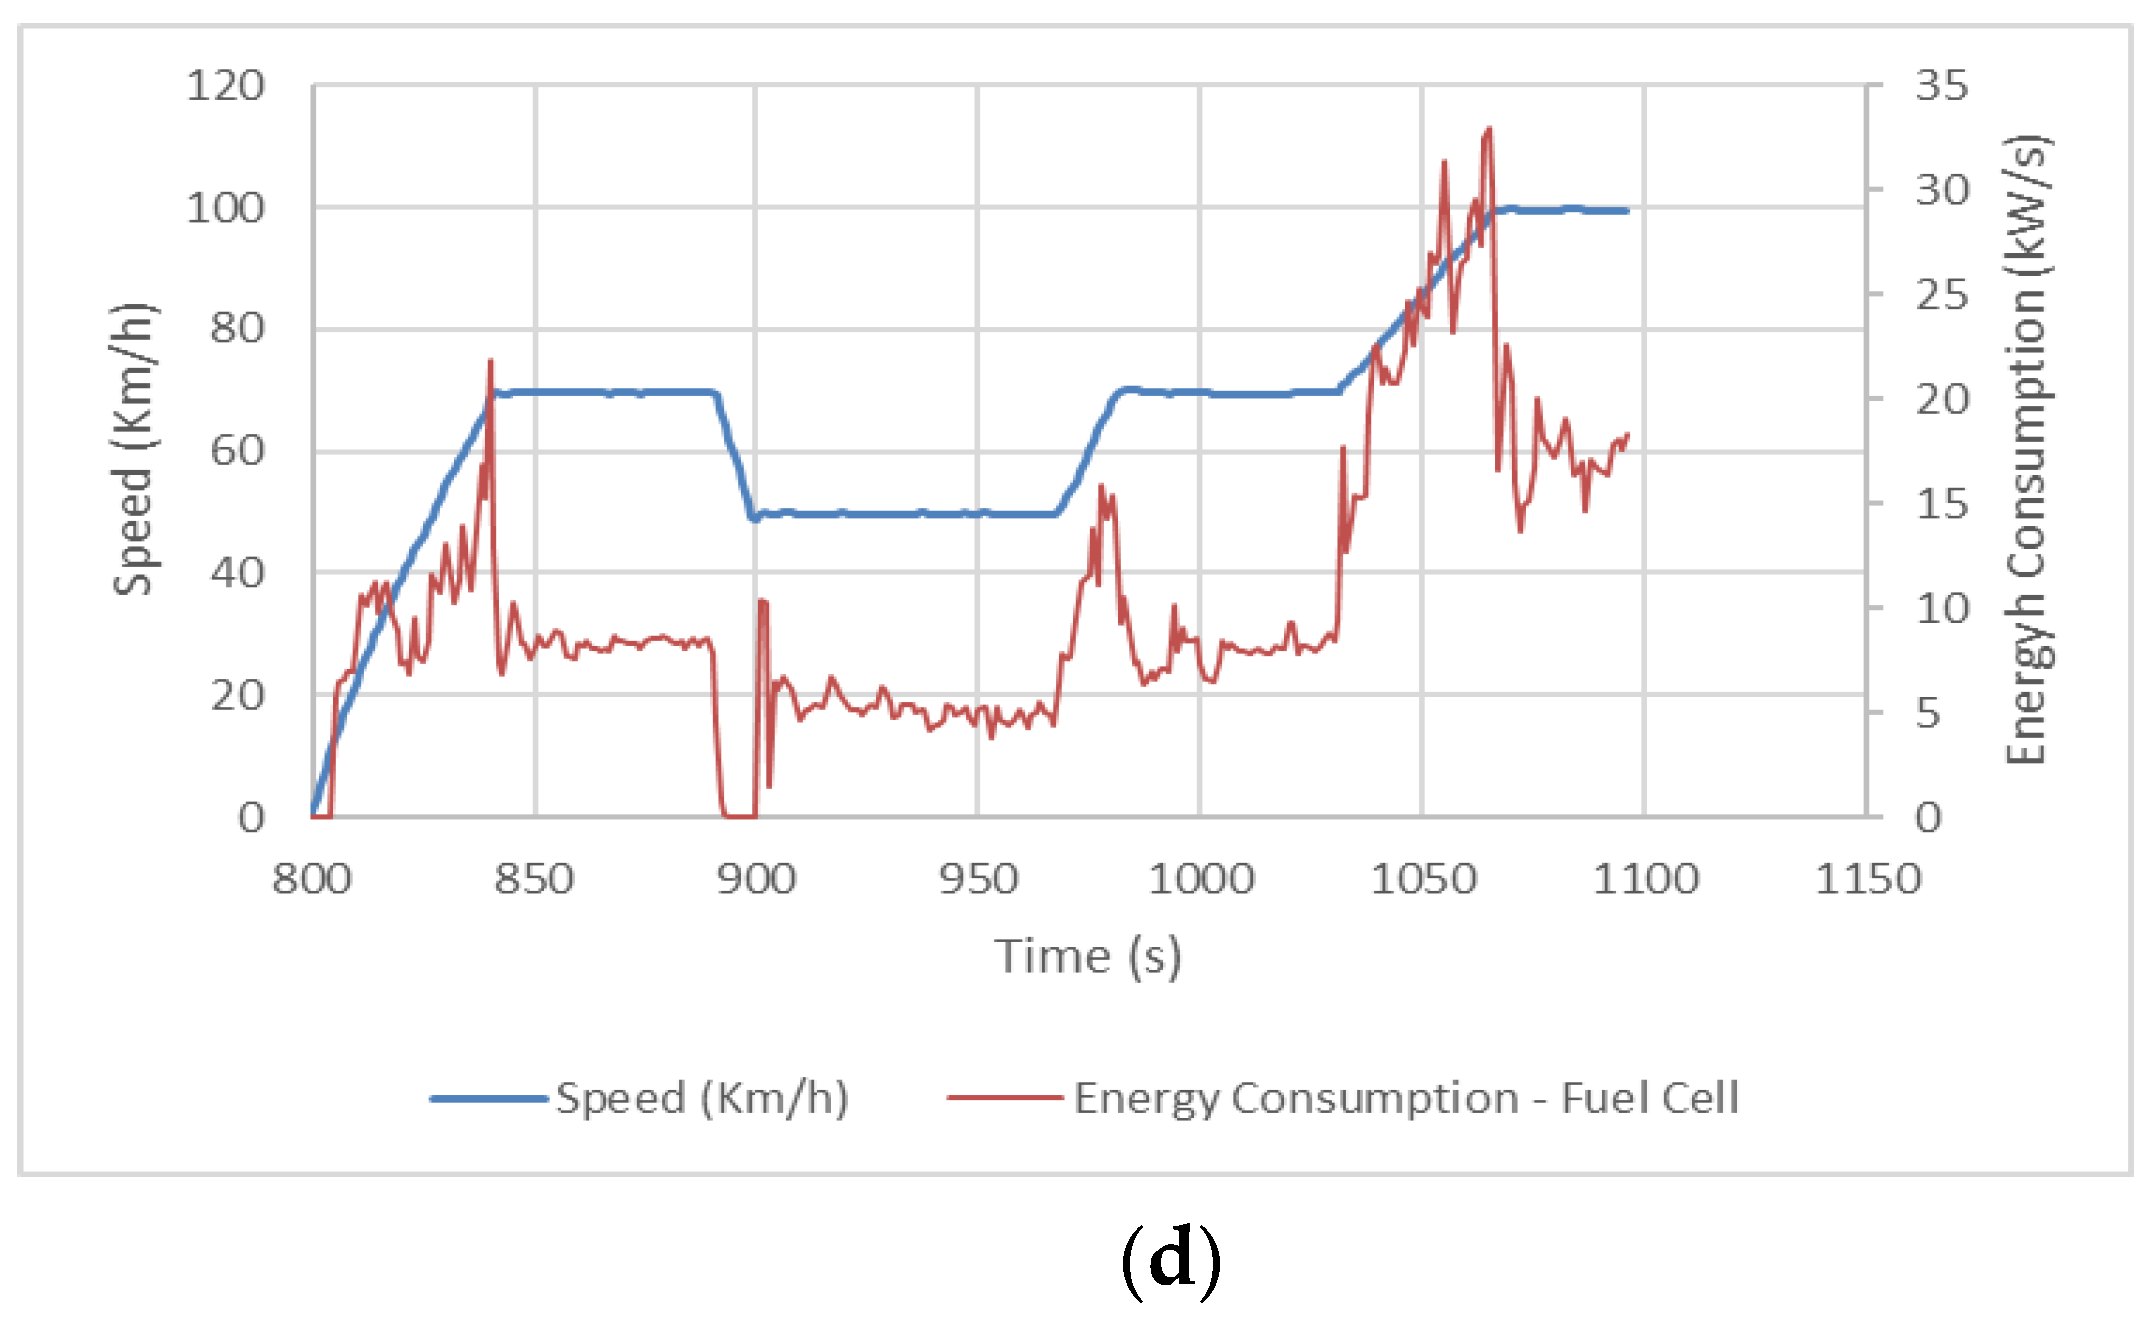
Figure 3 illustrates the battery and the fuel cell power consumption for a low-speed section and a high-speed section of the NEDC cycle.
Figure 3a,b demonstrate that the vehicle is mostly powered by the battery during idling and low-speed conditions and the fuel cell powers the motor only during acceleration events.
Figure 3c,d demonstrate that the vehicle utilizes the battery as supplemental power during acceleration events and the fuel cell provides the main power to the electric motor on the high-speed section. The figure demonstrates that the HFCV uses the battery mode when significant vehicle power is not required, as shown in the low-speed case.
Vehicle fuel/energy consumption rates are typically derived from a relationship between instantaneous fuel/energy consumption rates and instantaneous measurements of various explanatory variables such as vehicle power, force (or tractive effort), acceleration, speed, and/or roadway conditions.
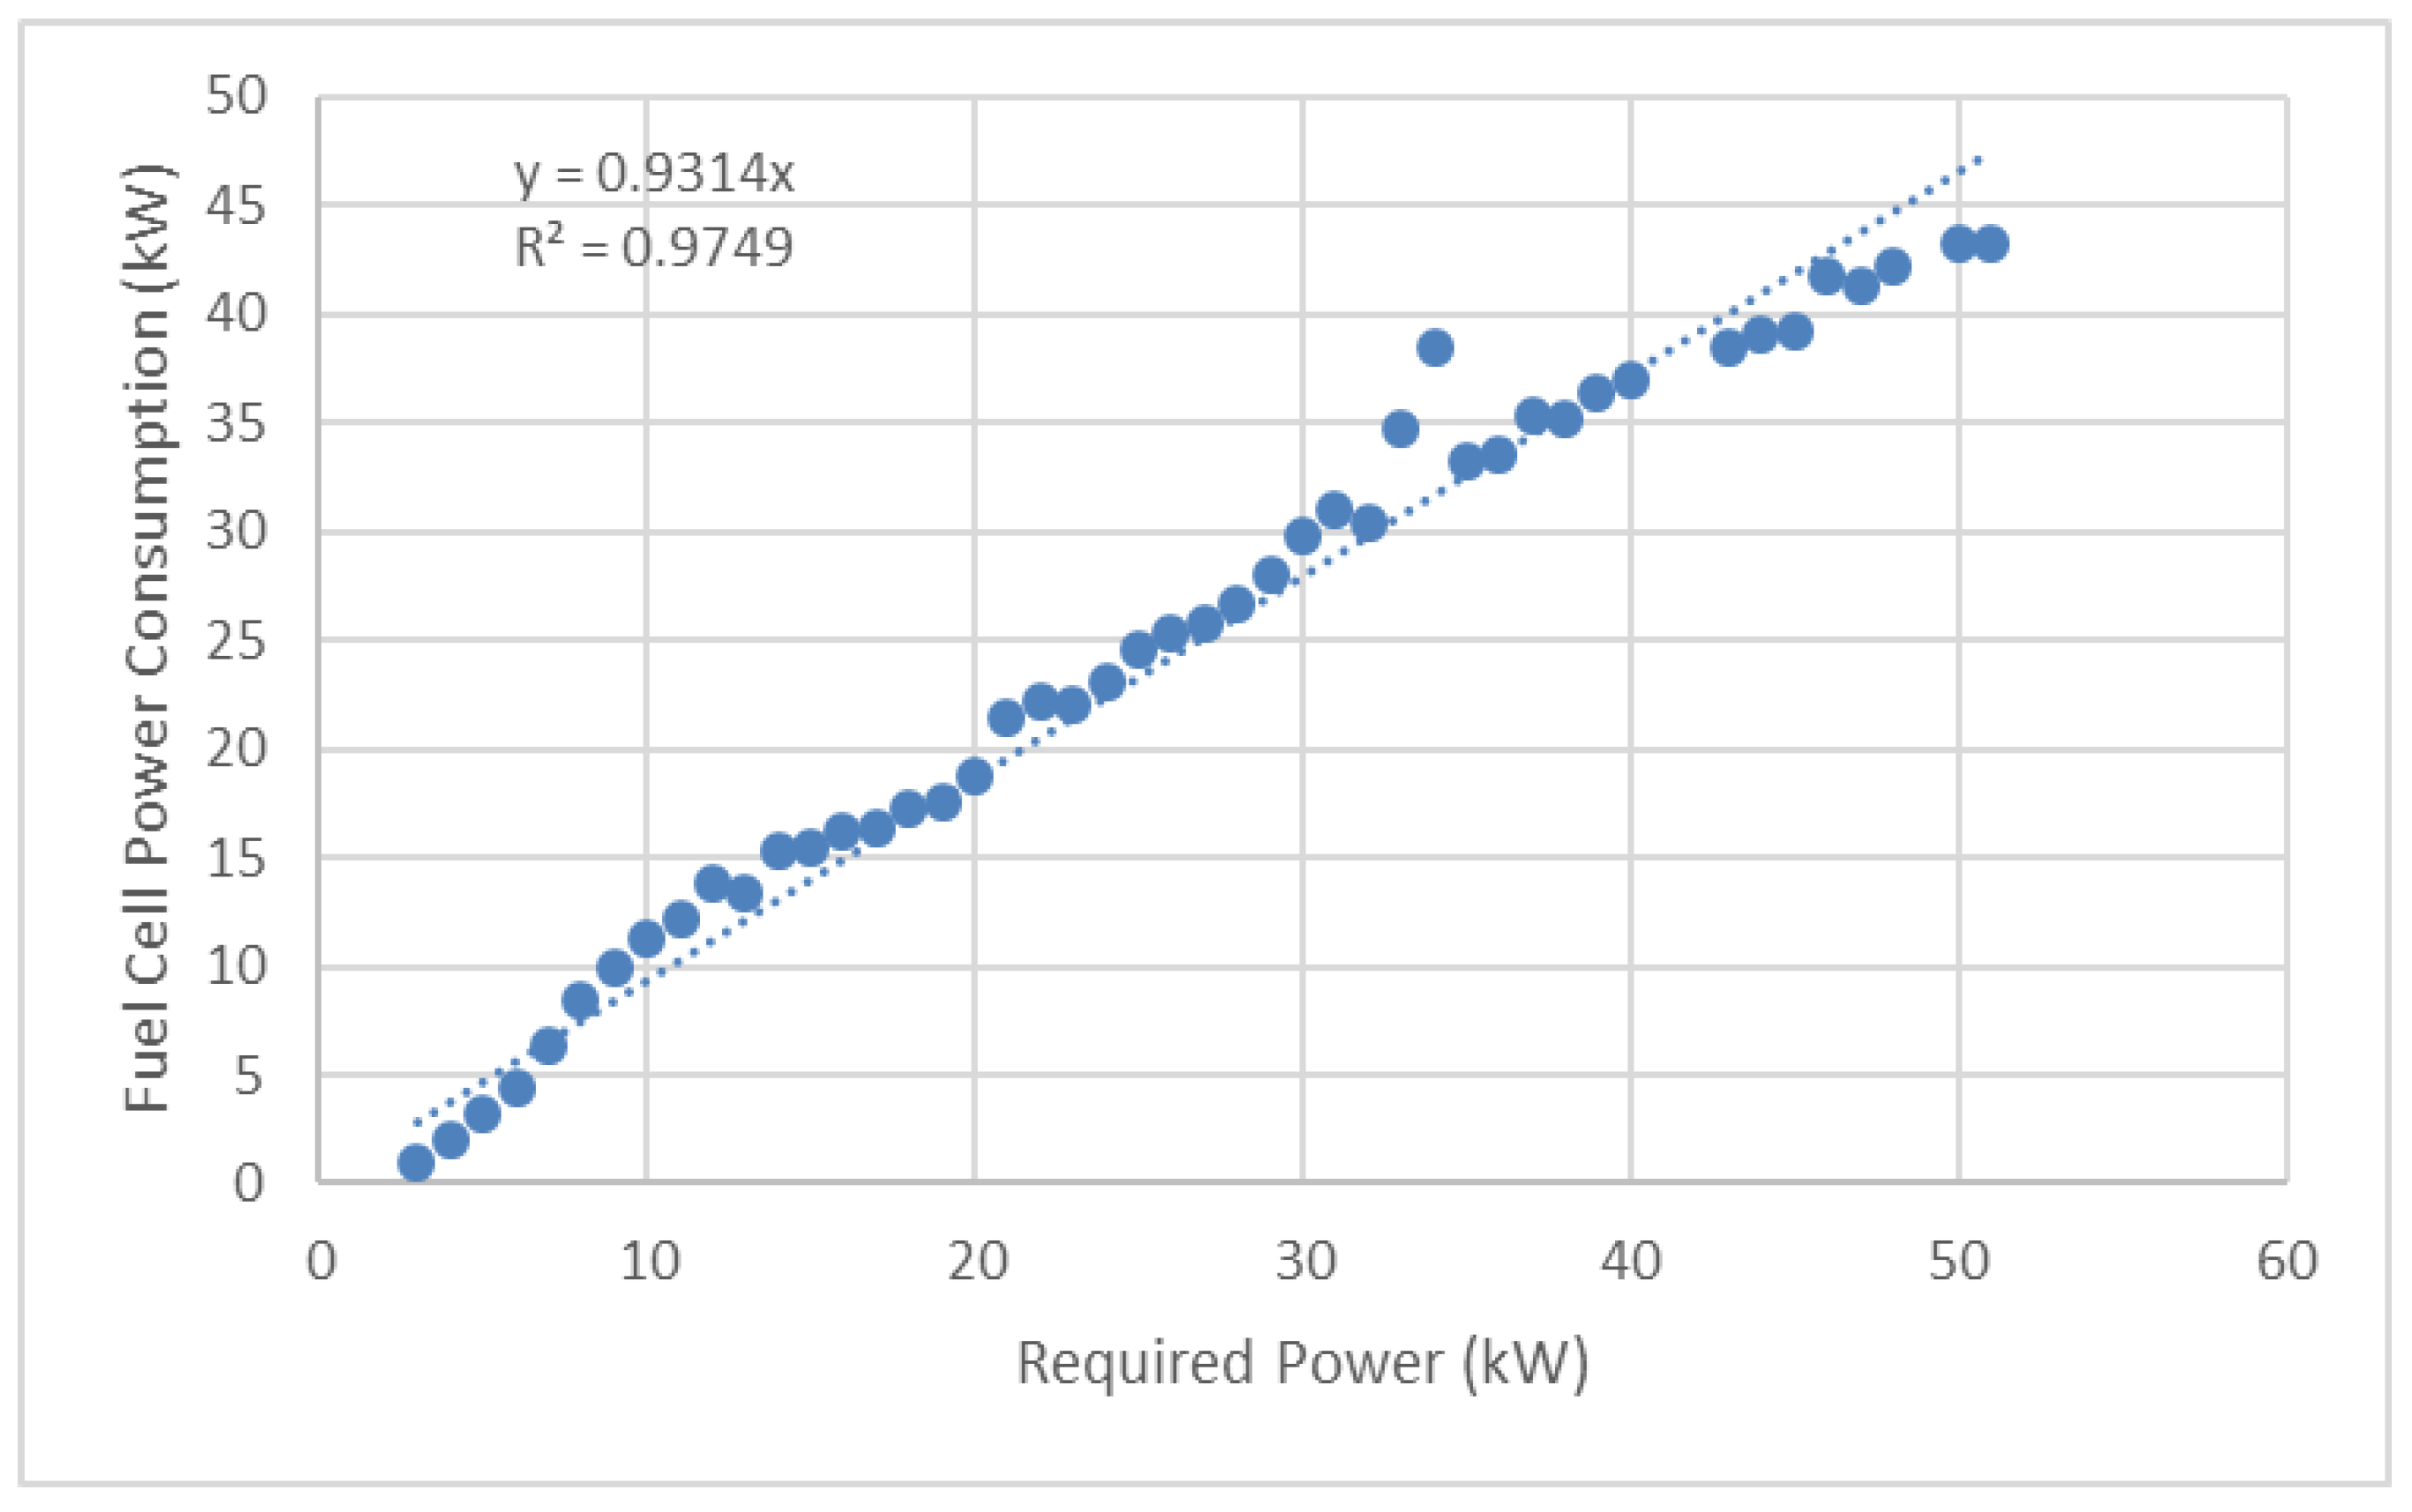
Figure 4 illustrates the relationship between fuel cell energy consumption and the power at the wheels from the Toyota Mirai data.
Figure 4 and
Figure 5 demonstrate that the vehicle power at the wheels is highly correlated with the fuel cell power consumption.
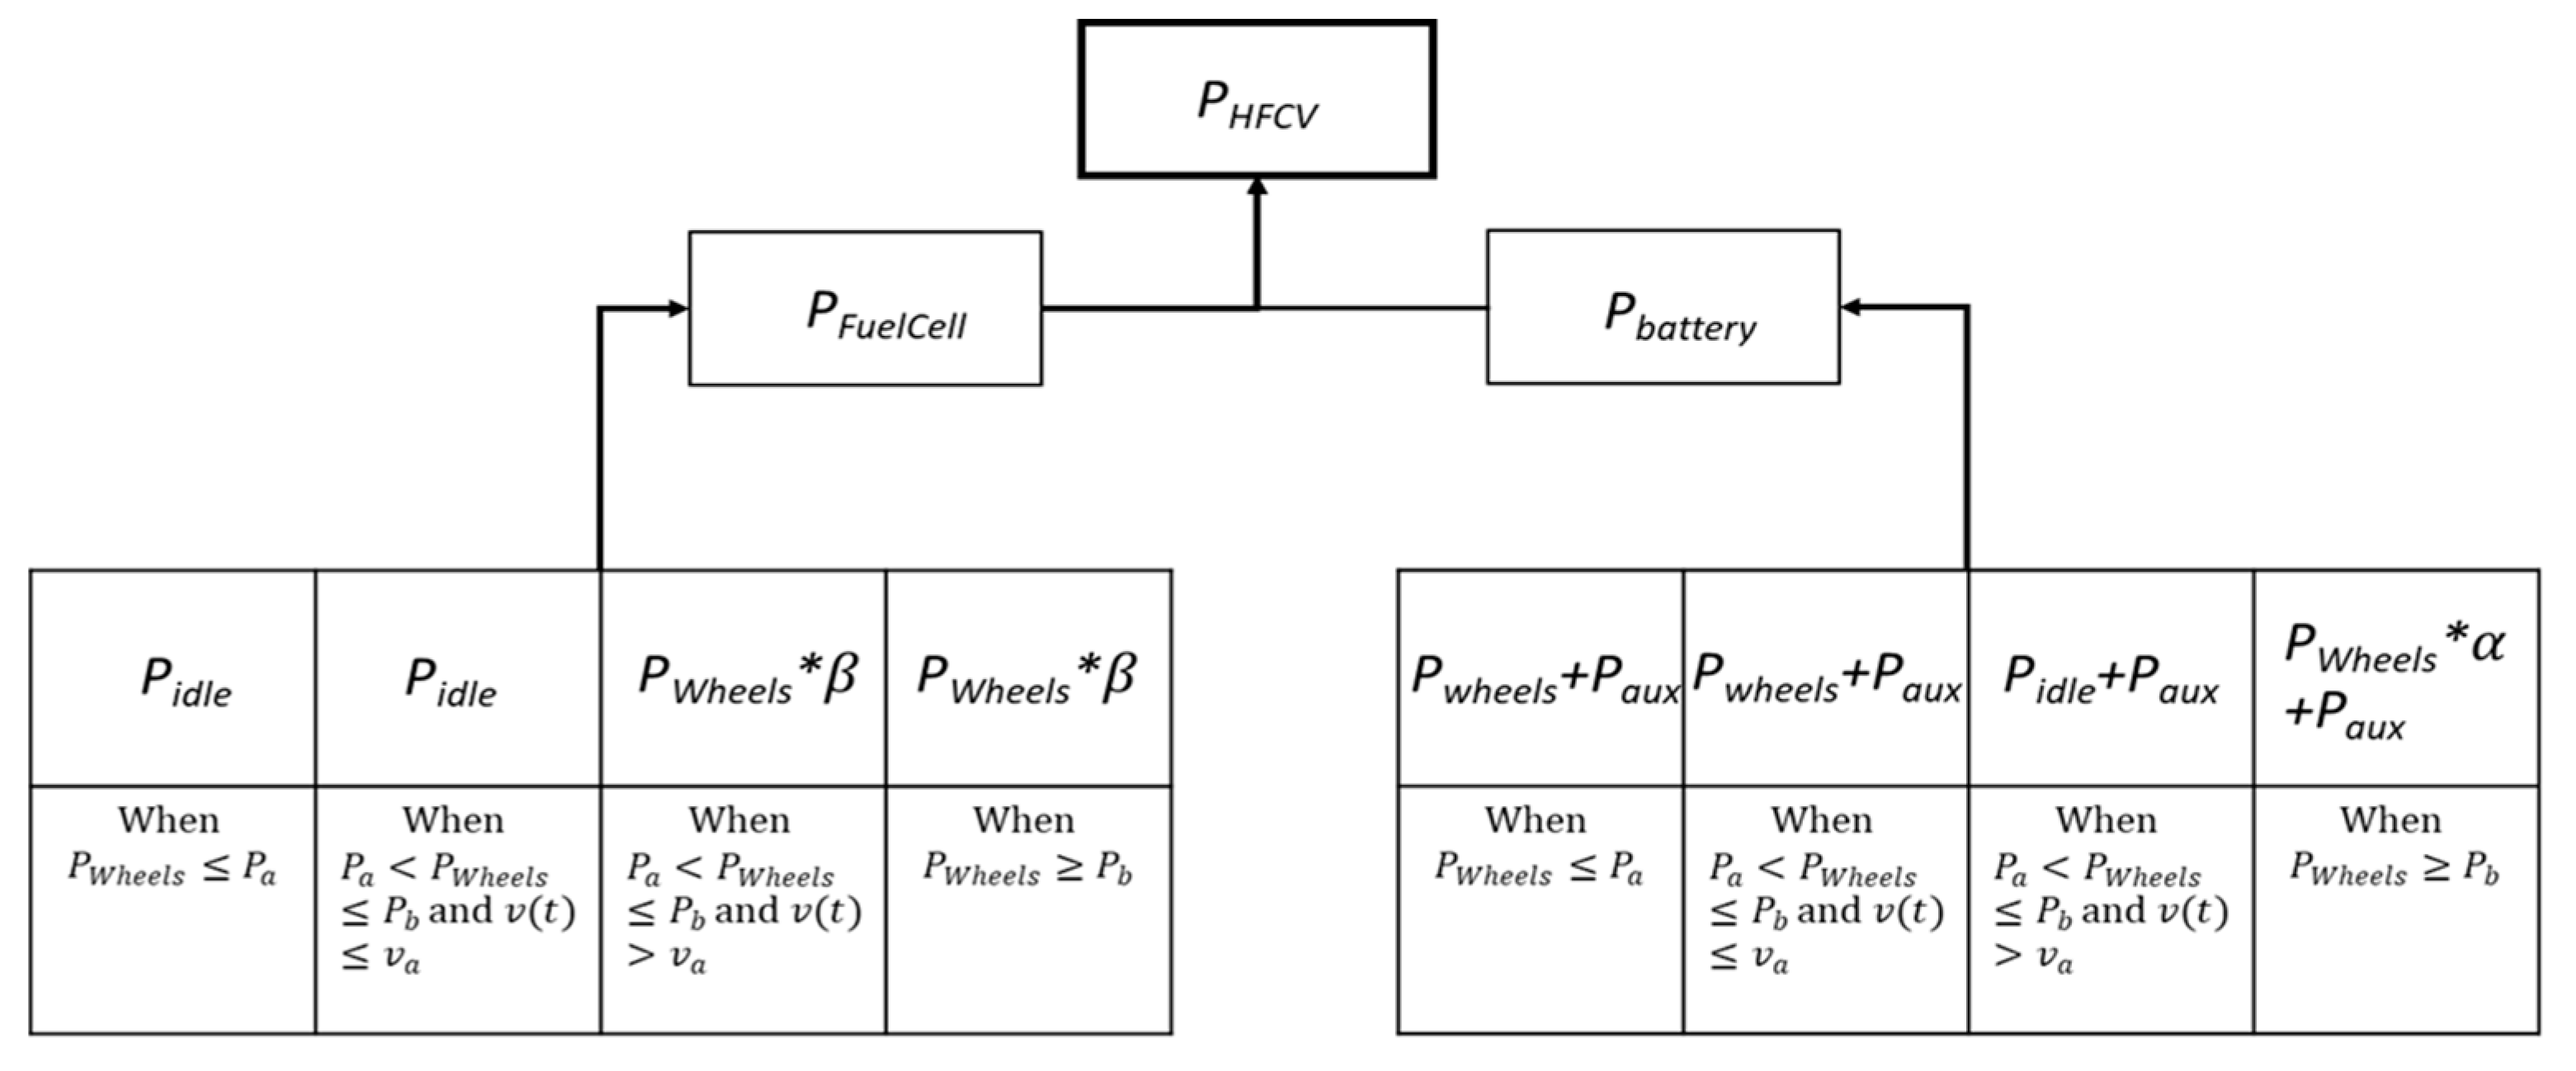
This study found the following HFCV energy consumption behaviors. First, vehicle speed and power affects FHCV energy consumption; second, when the vehicle power (
Pwheels) is lower than a specific value (
Pa), the HFCV utilizes the battery mode; third, when the speed is lower than a specific speed (
va) and the power at the wheels is between
Pa and
Pb, the HFCV is operated in battery mode; fourth, the HFCV utilizes only the fuel cell mode when the speed is greater than a battery mode speed (
va) and the power at the wheels is between
Pa and
Pb; and fifth, the HFCV utilizes both the fuel cell and battery modes when the power (
Pwheels) is greater than a specific power (
Pb). The power at the wheels (
Pwheels) is computed using Equation (1). The proposed HFCV energy consumption model is formulated in Equations (2)–(5).
The proposed model is general and is applied to the 2017 Toyota Mirai for illustration purposes. Here,
m is the vehicle mass (
kg for the curb weight of the test Toyota Mirai),
is the acceleration of the vehicle in m/s
2 after ensuring that the vehicle speed is converted to m/s (
takes negative values when the vehicle decelerates),
m/s
2 is the gravitational acceleration,
is the road grade,
and
are the rolling resistance parameters that vary as a function of the road surface type, road condition, and vehicle tire type. The typical values of vehicle coefficients are reported in.
kg/m
3 is the air mass energy density of hydrogen which is equal to 33.6 kWh of usable energy per kg,
m
2 is the frontal area of the vehicle,
is the aerodynamic drag coefficient of the vehicle (taken to be 0.28), and
is the vehicle speed in km/h [
17,
18,
19].
is the power consumed by the auxiliary system. The energy produced by the fuel cell (
is computed, given the power at the wheels, assuming a vehicle efficiency of
β = 93% considering a driveline efficiency and the electric motor efficiency. The energy produced from the battery (
is computed, assuming an efficiency of α = 20%. This parameter was calibrated using the HFCV battery energy consumption data.
PHFCV(
t) is the instantaneous total power exerted in kilowatts. Statistical analysis found that
va is 32 km/h,
Pa is 2.5 kW, and
Pb is 5 kW for the specific test vehicle. In this study, we assume the vehicle weight is a constant variable. A significant vehicle mass change can affect the energy consumption. The proposed model estimates the vehicle’s energy consumption (EC) (kWh) over a time step
(Equation (5)), the instantaneous power consumed (kW), and hydrogen consumed (kg); the hydrogen storage of the test Toyota Mirai is 5 kg. The modeling diagram is presented in
Figure 5.
5. Model Validation
The model validation results demonstrate that the proposed model estimates fuel cell energy consumption with reasonable accuracy for three representative driving cycles. In particular, the model estimates the energy consumption with errors of 13.88%, 0.61%, and −3.45% for the UDDS, Highway, and NEDC cycles, respectively, as demonstrated in
Table 2. We found that the model overestimates the fuel cell energy consumption for the UDDS cycle. We also found that the model slightly underestimates the fuel cell energy consumption for the NEDC cycle when both driving cycles have similar average speeds (31.5 km/h for UDDS and 33.35 km/h for NEDC). It seems the model was calibrated for high speed and aggressive driving conditions, which reduced overall model accuracy. The results showed that the overall model accuracy combining all urban and freeway driving cycles is 0.86%.
The study also found that the proposed model estimates the total fuel cell and battery energy consumption with errors of −3.21%, 9.36%, and −3.64% for the three driving cycles: UDDS, Highway, and NEDC cycles, respectively. The results demonstrate that the proposed model accurately estimates the energy consumptions with errors of 2.17% compared to experimental data for the total energy consumption.
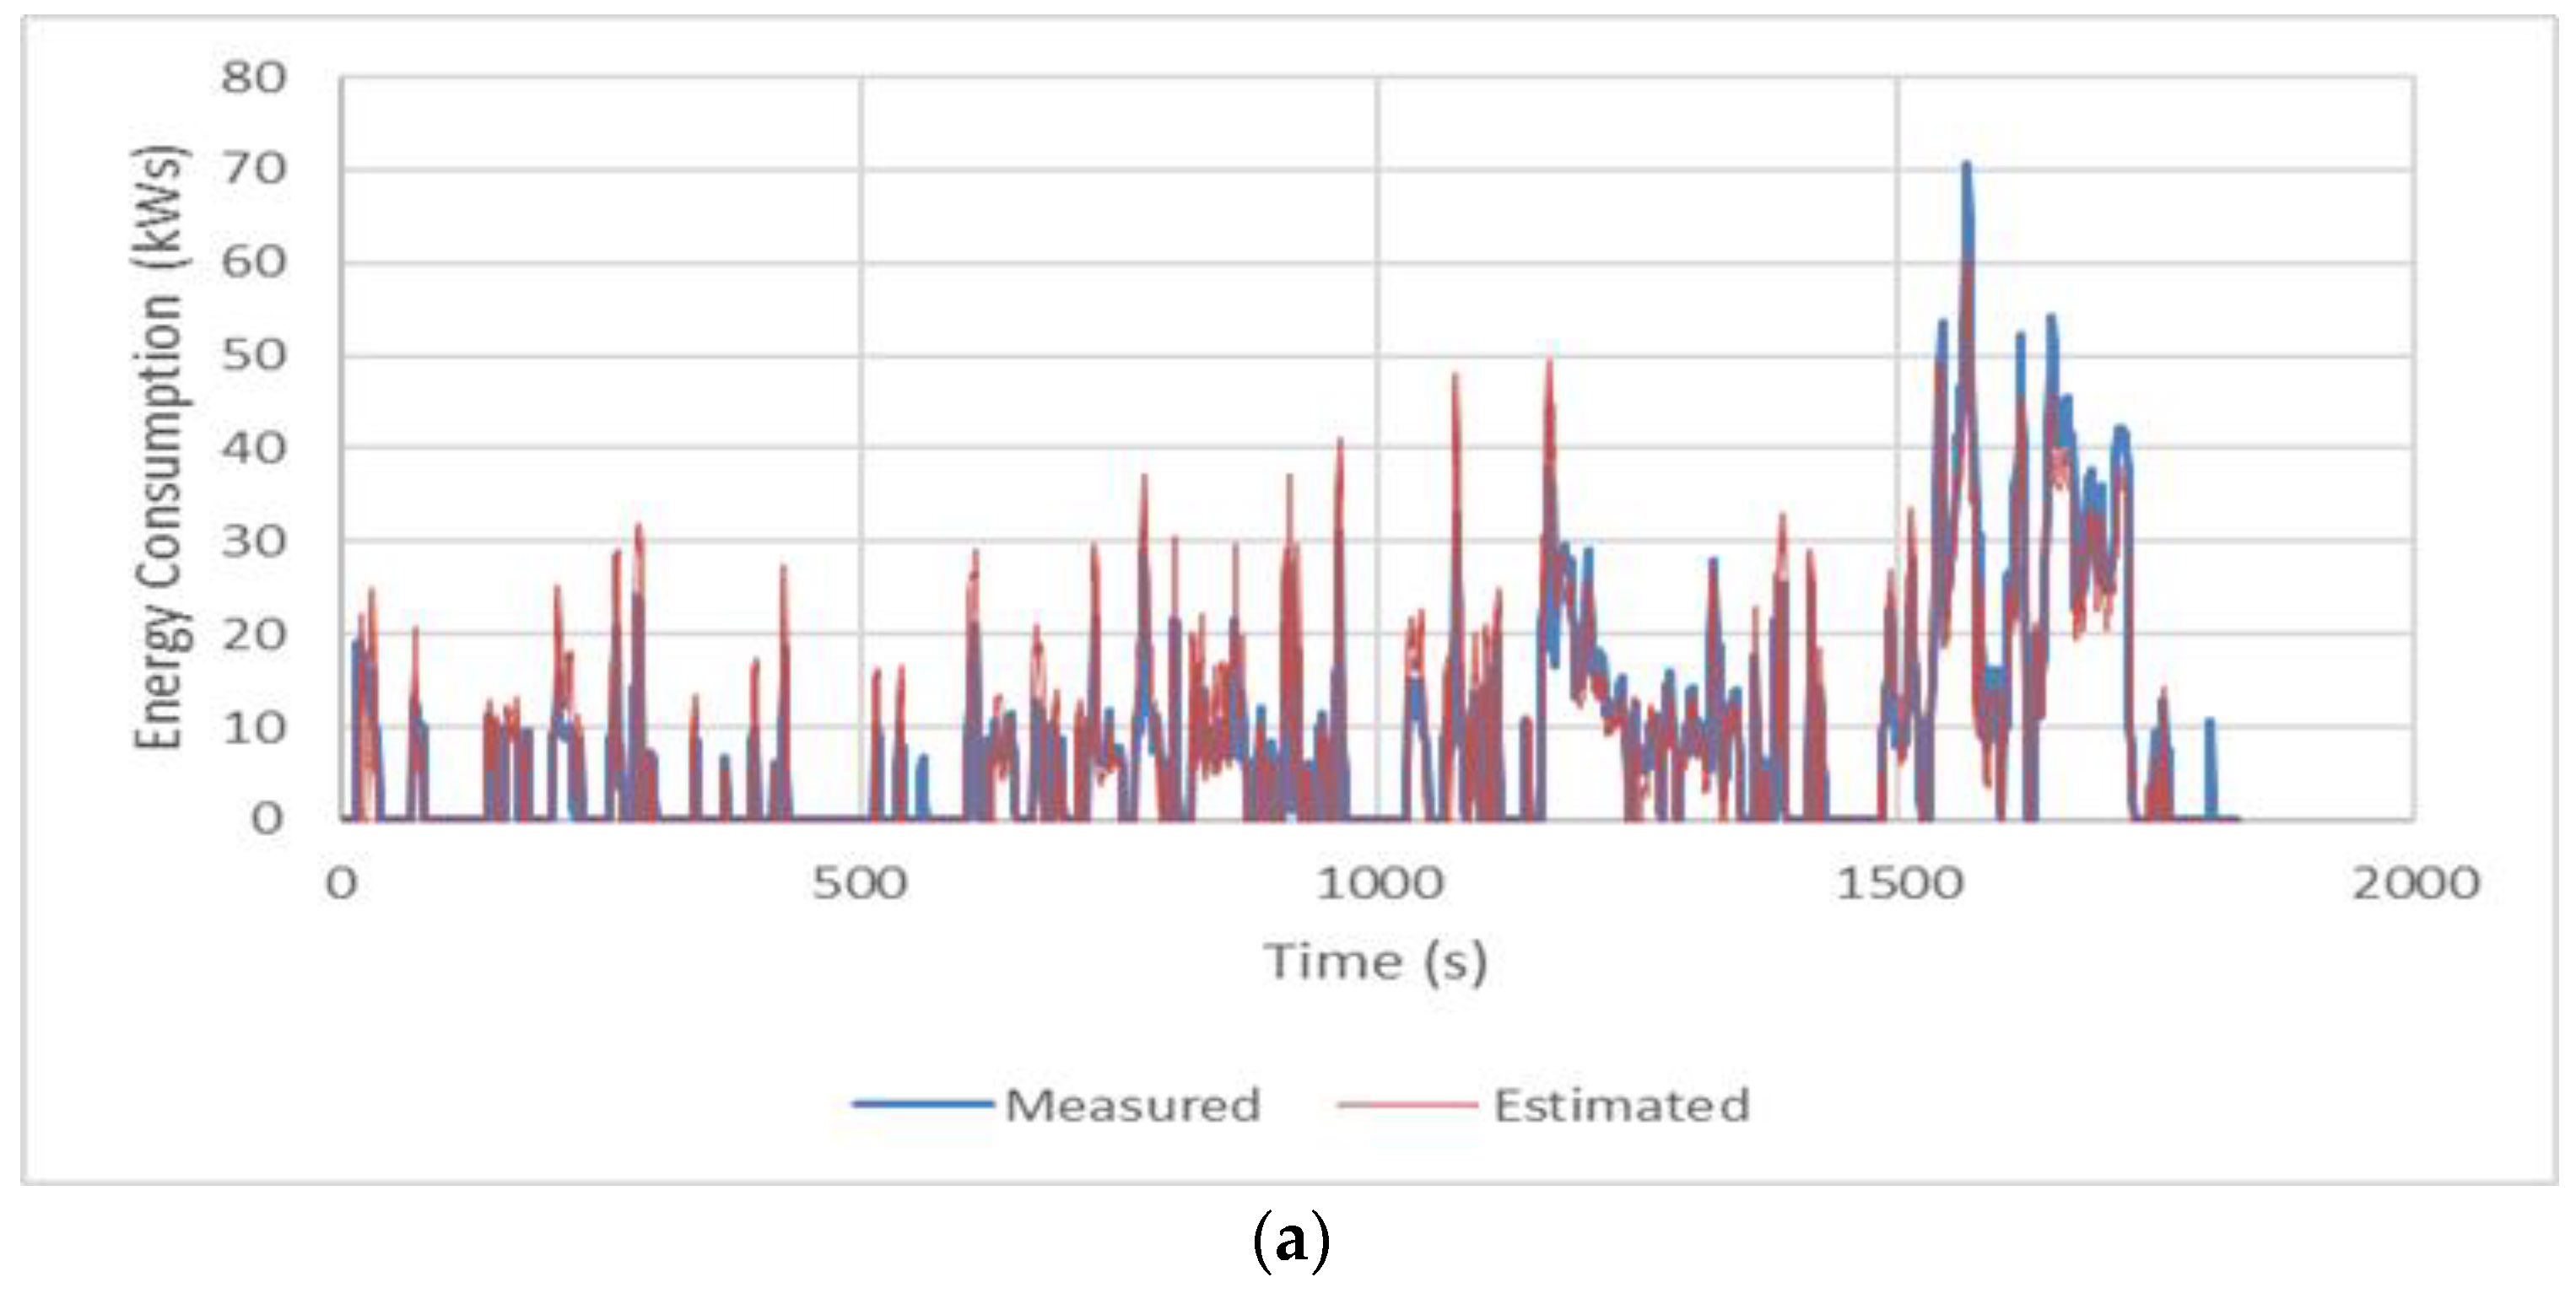
Figure 6 illustrates the instantaneous fuel cell energy consumption rate and total energy consumption rate, including both fuel cell and battery energy consumption for the NEDC driving cycle compared to the test vehicle’s measured instantaneous energy consumption rate. Superimposed on the figures are the proposed model’s estimates of vehicle energy consumption rates based on instantaneous power and vehicle speed. As illustrated in the figure, the predicted power consumption generally follows the peaks and valleys of the measured vehicle energy consumption. The results clearly demonstrate a good agreement between the instantaneous energy consumption estimates and laboratory measurements. The proposed model slightly overestimates or underestimates some fuel consumption rates for the NEDC. In particular, the proposed model underestimates fuel consumption rates in the first section of the driving cycle and at time 1110 s. While the proposed model simplifies the conditional battery mode, the battery mode also depends on the battery’s state of charge (SOC). The research team will further investigate the impacts of SOC to improve the accuracy of the energy consumption model. The test vehicle data do not include SOC data. In general, the model predictions follow the laboratory-collected fuel measurements of the NEDC cycle with high correlation coefficients (0.942 for fuel cell estimation, 0.975 for total energy consumption). The figure illustrates that, in general, the model’s predictions follow the fuel measurements, demonstrating the applicability of the model for assessing the effects of transportation projects, including eco-driving and real-time CAV applications.
The study validated the proposed model against an independent dataset. We utilized worldwide harmonized light vehicles test procedures (WLTPs) data that was collected at the Argonne National Laboratory, using the same test vehicle: a 2017 Toyota Mirai. The WLTP is a chassis dynamometer test driving cycle for the determination of emissions and fuel consumption from light-duty vehicles, including ICEVs, HEVs, and BEVs. The worldwide harmonized light vehicles test cycles (WLTC) and WLTP are sometimes used interchangeably. The WLTC cycle is part of the WLTP cycle. The cycle was developed to replace NEDC to better match the laboratory estimates of fuel/energy consumption and emissions with on-road driving conditions. The WLTP is also used for vehicle certification in Japan. The WLTP cycle includes four subsections: low speed, medium speed, high speed, and extra-high speed to represent real-world driving conditions. A detailed description of the cycle characteristics is presented in
Table 3.
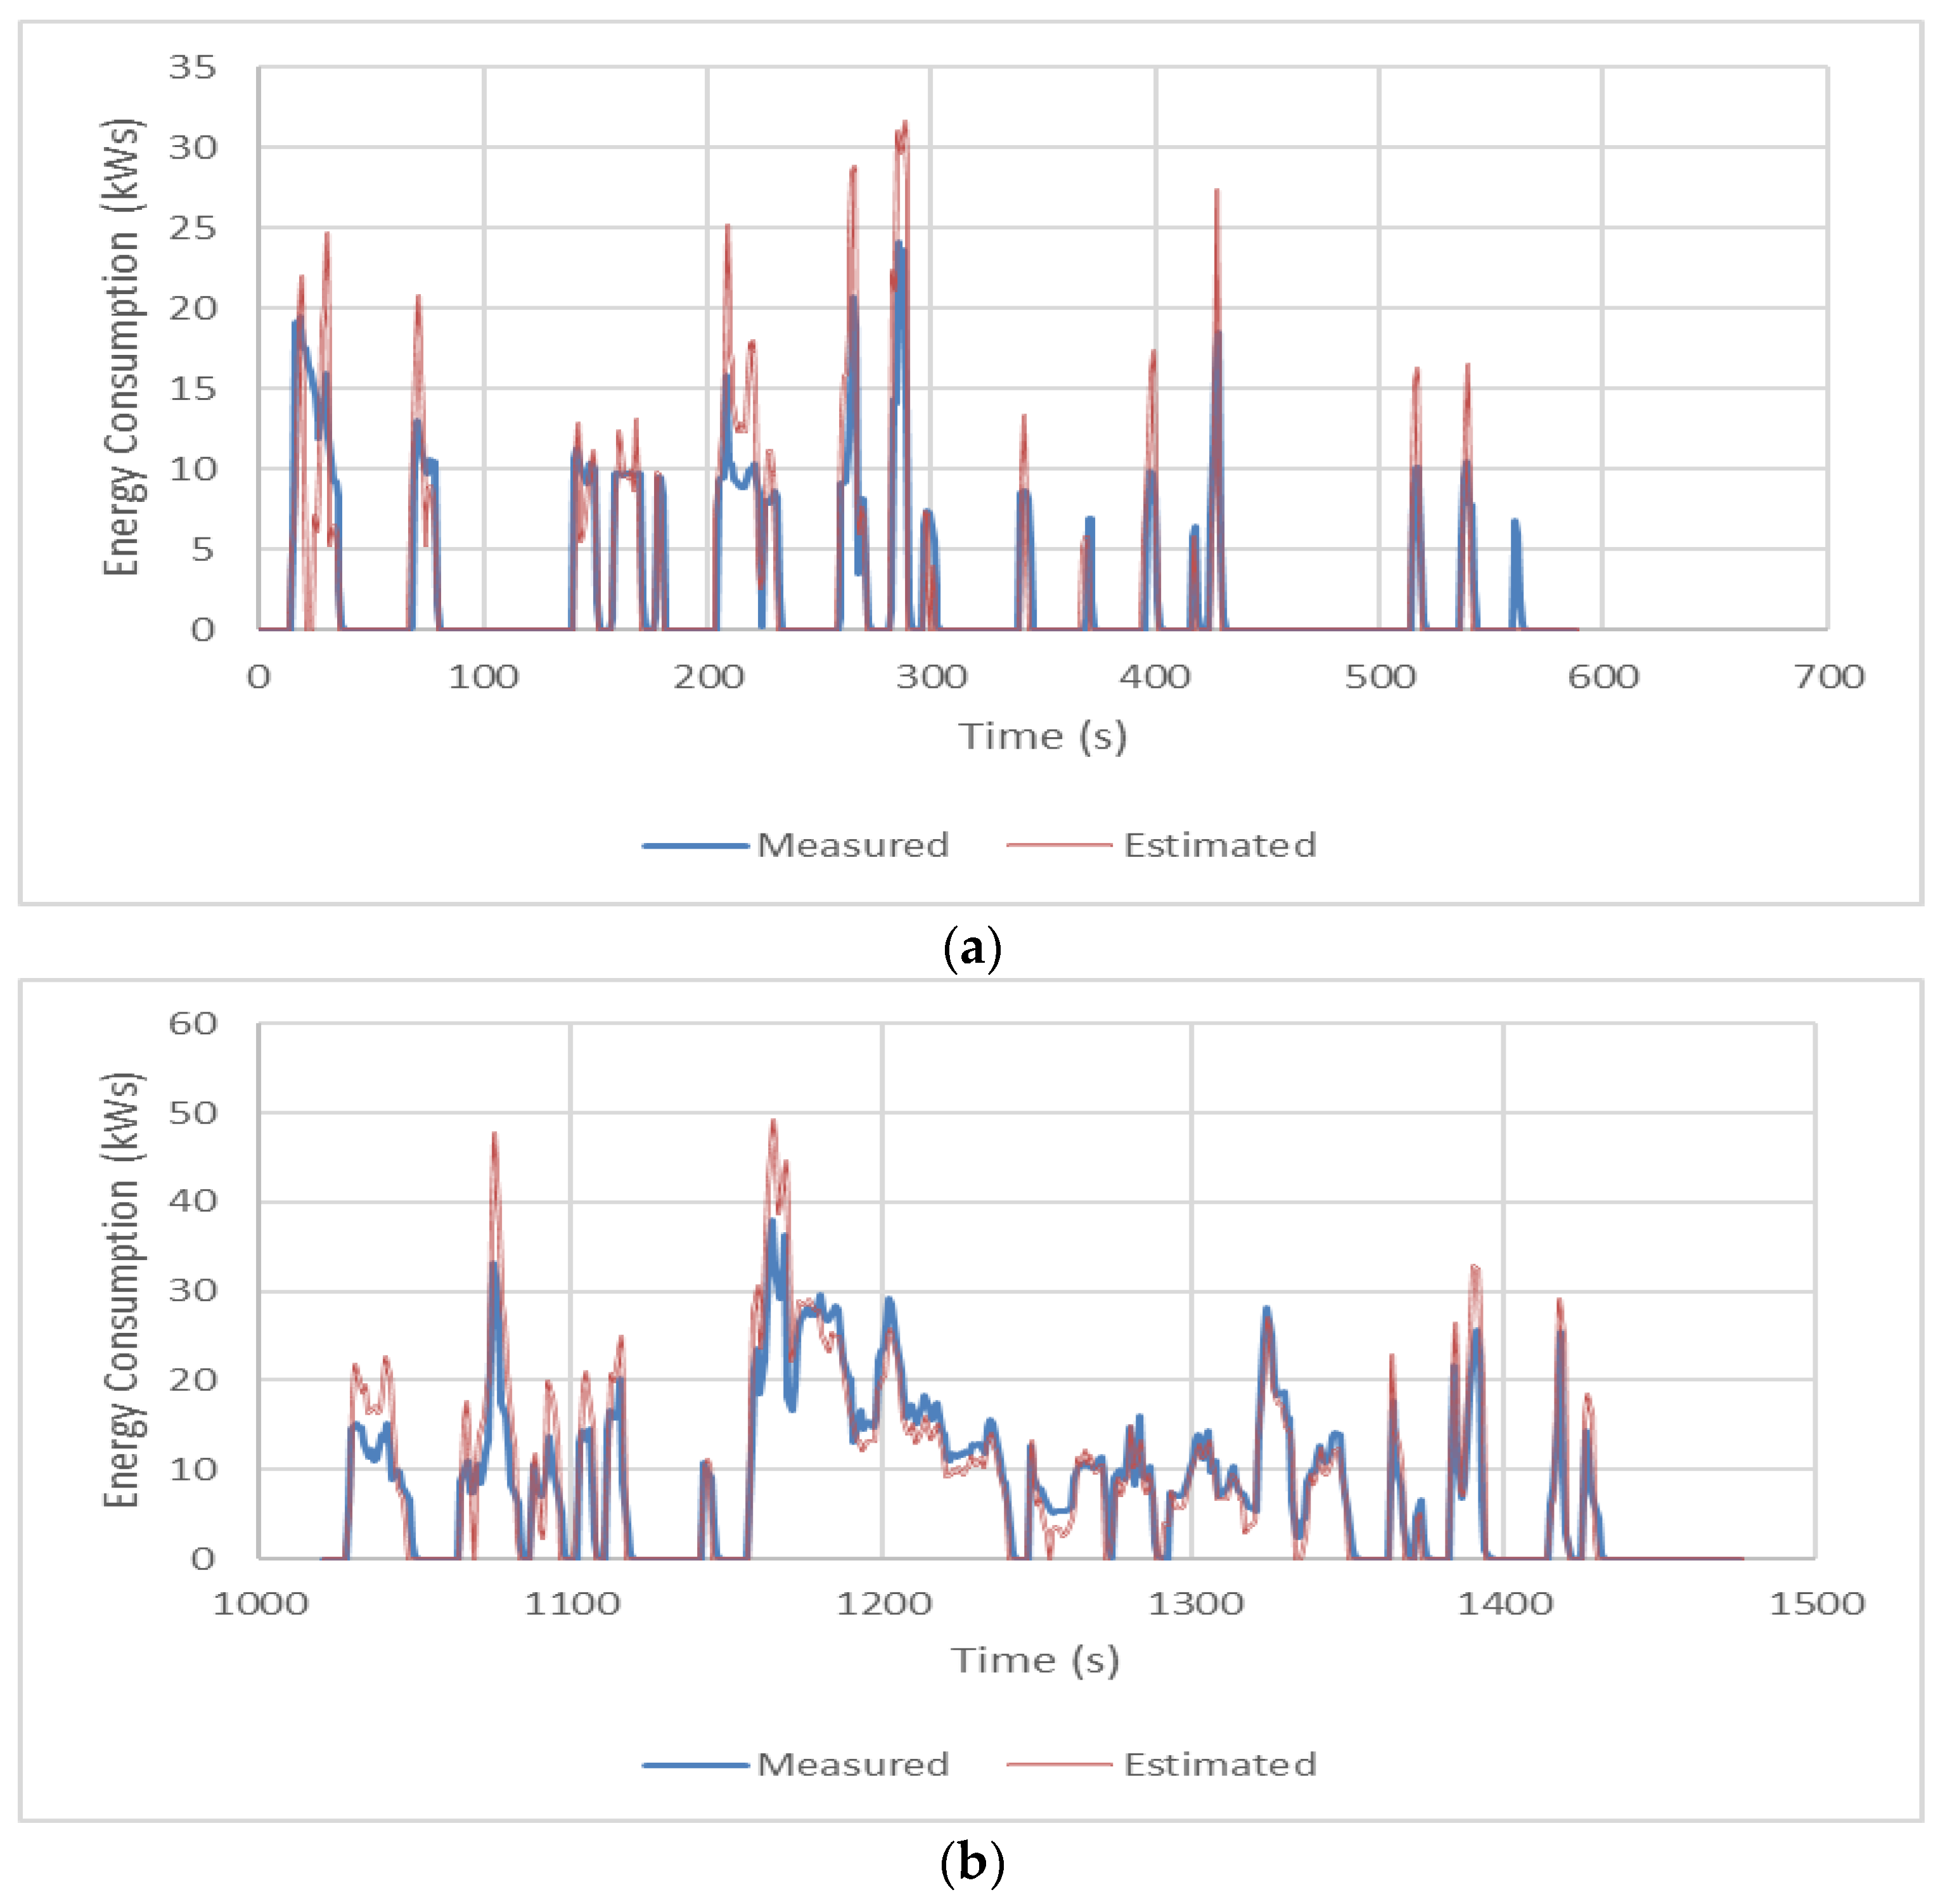
Figure 7 compares the estimated energy consumption rates of HFCV and the laboratory-collected data of WLTP cycle. The proposed model predicted that the fuel cell model estimated 3.98 kWh while the test vehicle consumed 3.91 kWh in the laboratory, which represents a 1.9% error rate. For the total energy consumption, the model predicted 4.92 kWh and the test vehicle consumed 4.87 kWh, which is a 1.0% error rate. A second-by-second analysis of the fuel cell estimation and the total energy consumption is illustrated in
Figure 7b. The figure demonstrates that the proposed model accurately estimates the fuel cell energy consumption and the total energy consumption for the WLTC trip compared to the test vehicle’s measured energy consumption rate.
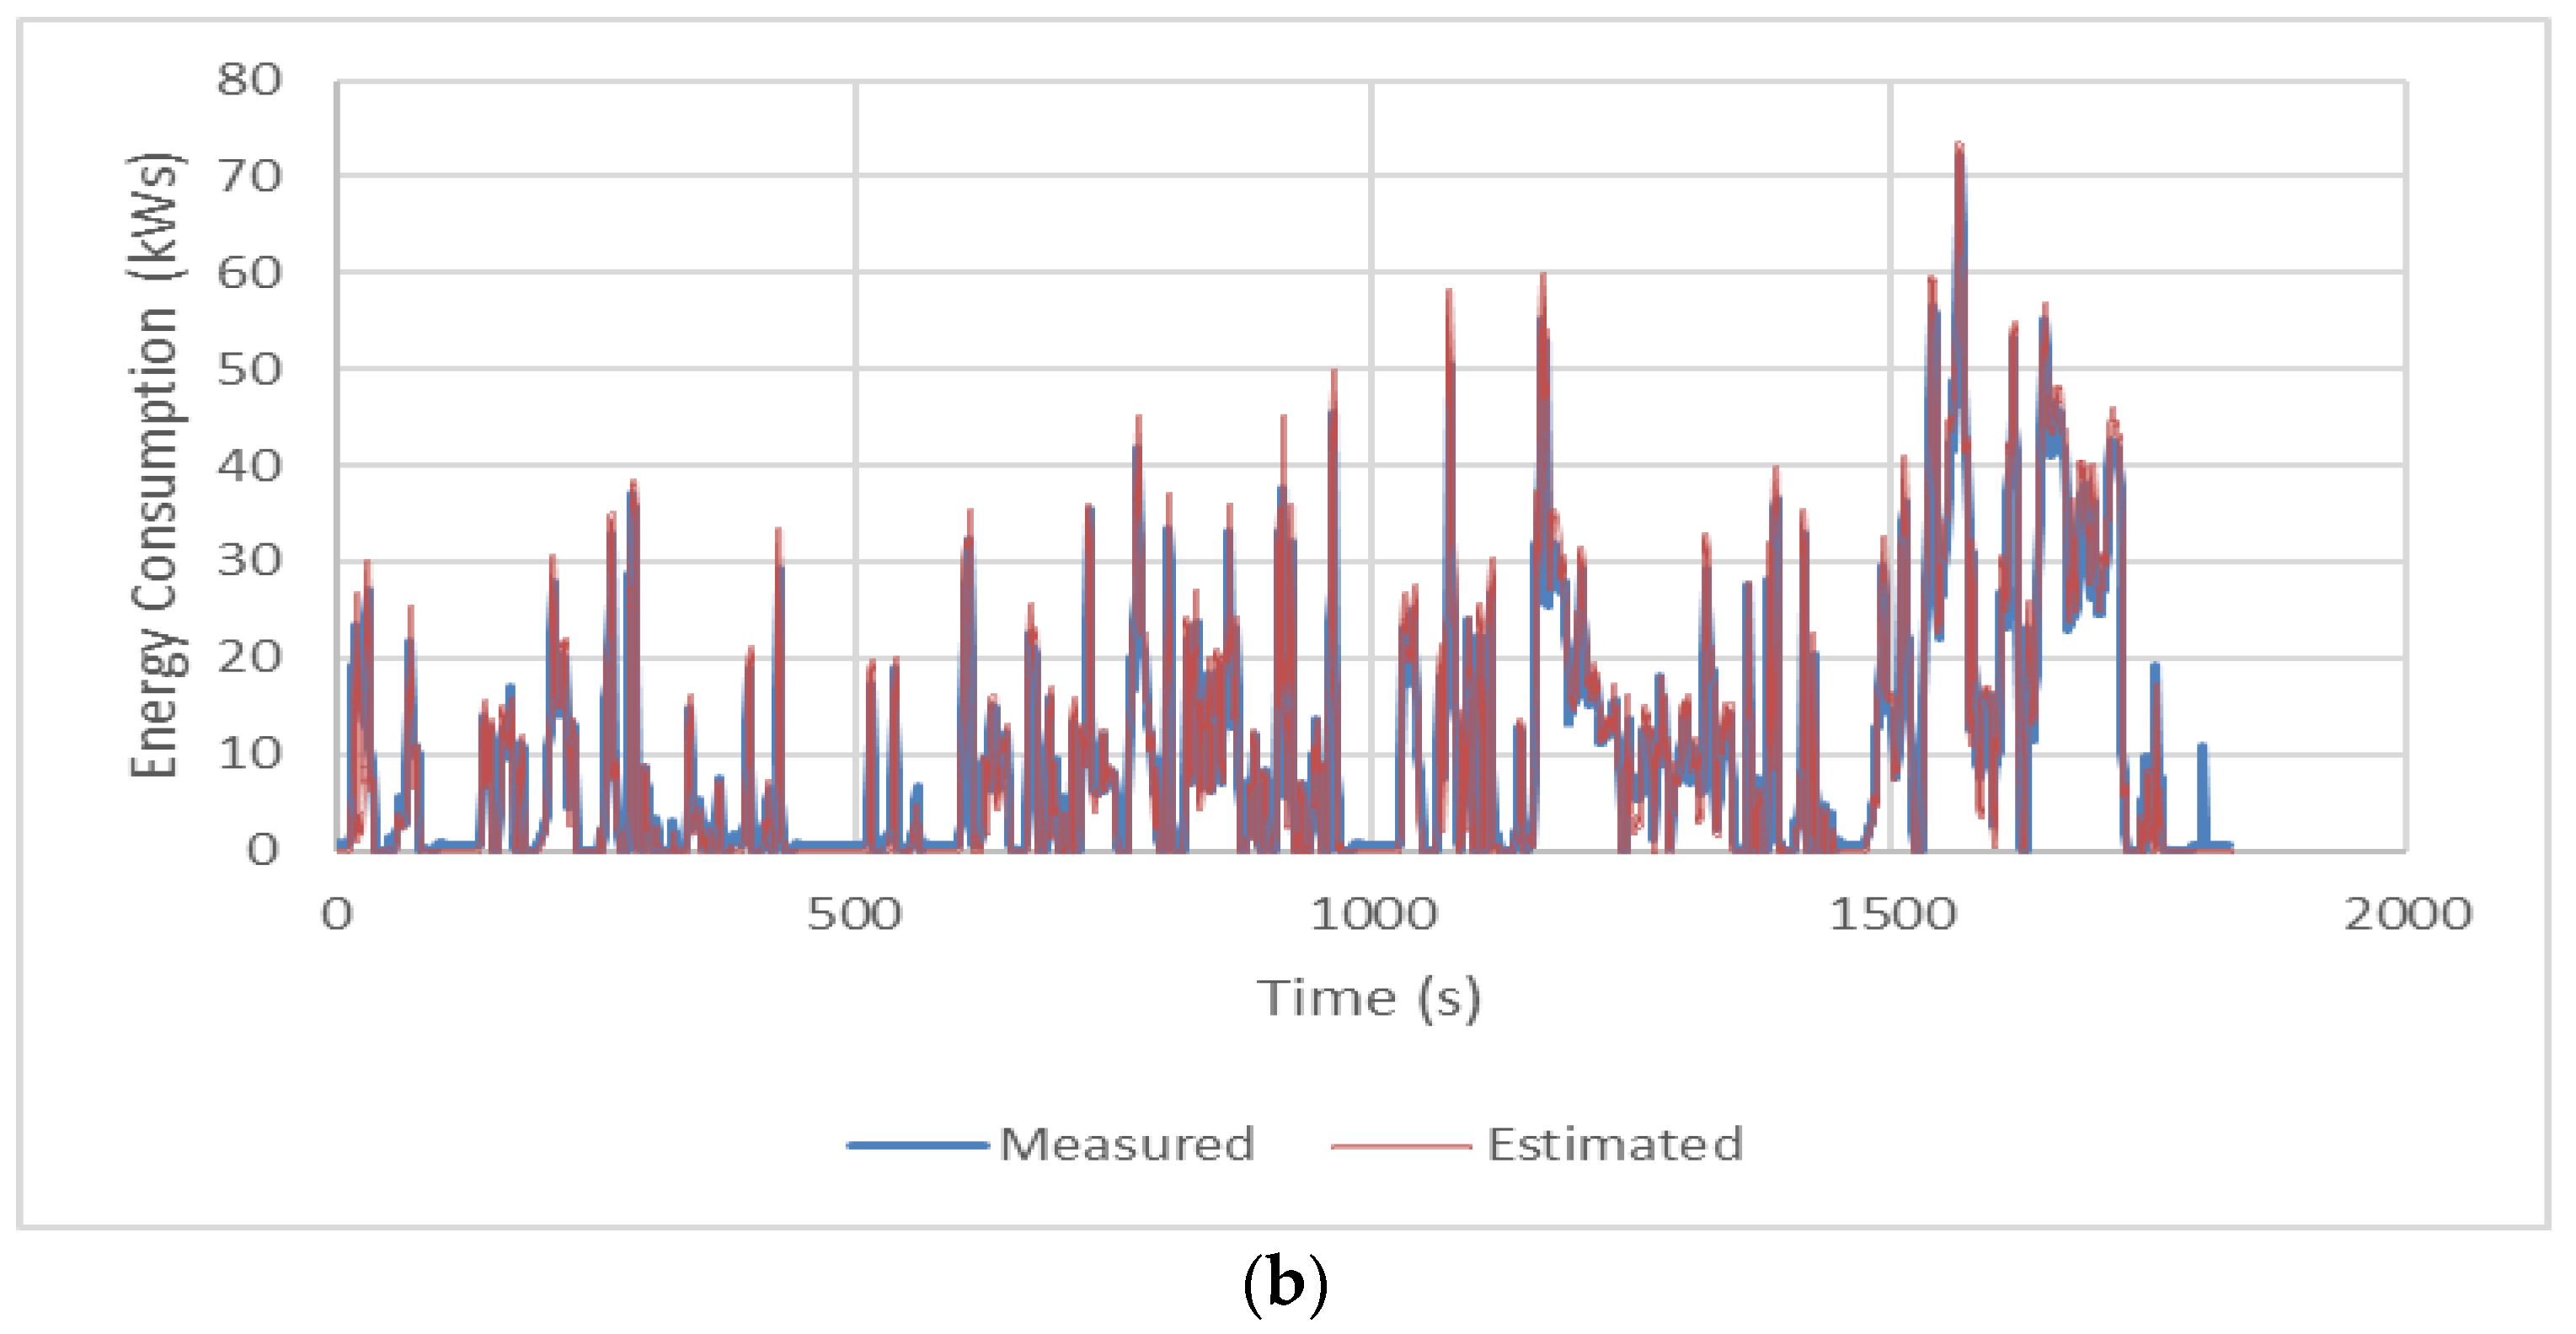
Figure 8 illustrates the detailed instantaneous model prediction results for low-speed and high-speed sections. The figure illustrates that the HFCV energy model estimates accurately follow the laboratory-collected data for both low- and high-speed sections. In particular, the model estimated 0.41 kWh for the low-speed section and 1.05 kWh for the high-speed section, and the test vehicle consumed 0.45 kWh for the low-speed section and 1.09 kWh for the high-speed section from the fuel cell, which represent 7.9% and 4.7% errors, respectively. The results demonstrate that the proposed model can effectively estimate the HFCV energy consumption on both low- and high-speed sections.
6. Conclusions
This study developed a simple HFCV energy consumption model that can be implemented in CAV and smartphone applications and/or traffic simulation software. A number of studies investigated the power management models of HFCVs. However, only a few studies have focused on microscopic HFCV energy consumption models that can be implemented in CAV, smartphone, and transportation applications, while a number of such energy consumption models are available for ICEVs, BEVs, and HEVs.
The proposed HFCV energy model utilizes instantaneous vehicle speed, acceleration, and roadway grade as input variables to compute instantaneous hydrogen vehicle energy consumption and total energy consumption rates. The results demonstrate that the model estimates are generally consistent with empirical data. Specifically, the model estimates are within 0.86% and 2.17% of the empirically observed data for the fuel cell and the total energy consumption estimates, respectively. Furthermore, the study validated the proposed model against independent data and found that the model accurately estimated the energy consumption, producing an error of 1.9% and 1.0% relative to empirical data for the fuel cell and the total energy estimation, respectively. The results provide the opportunity for transportation engineers, policy makers, automakers, and environmental engineers to quantify the energy consumption effects of transportation projects, real-time CAV applications, and can be incorporated in microscopic traffic simulation models.
In terms of future work, we recommend a further study to investigate the optimum parameters for other HFCVs. The current model does not consider the impacts of the battery’s SOC, given that this information was not provided in the empirical data currently available. We suspect that the battery mode energy consumption depends on the battery’s SOC and, thus, recommend investigating the impact of the battery’s SOC and incorporating it in the model to enhance the model accuracy.


