Review

Solar Energy Production in India and Commonly Used Technologies—An Overview

1
Motilal Nehru National Institute of Technology Allahabad, Prayagraj 211004, India
2
Department of Population Health and Reproduction, University of California-Davis, Davis, CA 95616, USA
3
Energy Systems Laboratory, Energy Systems and Environment Directorate, Idaho National Laboratory, 750 MK Simpson Blvd., Idaho Falls, ID 83415, USA
*
Author to whom correspondence should be addressed.
Energies 2022, 15(2), 500; https://doi.org/10.3390/en15020500
Submission received: 22 November 2021 / Revised: 18 December 2021 / Accepted: 4 January 2022 / Published: 11 January 2022
(This article belongs to the Topic Solar Thermal Energy and Photovoltaic Systems)

Abstract

:
This review uses a more holistic approach to provide comprehensive information and up-to-date knowledge on solar energy development in India and scientific and technological advancement. This review describes the types of solar photovoltaic (PV) systems, existing solar technologies, and the structure of PV systems. Substantial emphasis has been given to understanding the potential impacts of COVID-19 on the solar energy installed capacity. In addition, we evaluated the prospects of solar energy and the revival of growth in solar energy installation post-COVID-19. Further, we described the challenges caused by transitions and cloud enhancement on smaller and larger PV systems on the solar power amended grid-system. While the review is focused on evaluating the solar energy growth in India, we used a broader approach to compare the existing solar technologies available across the world. The need for recycling waste from solar energy systems has been emphasized. Improved PV cell efficiencies and trends in cost reductions have been provided to understand the overall growth of solar-based energy production. Further, to understand the existing technologies used in PV cell production, we have reviewed monocrystalline and polycrystalline cell structures and their limitations. In terms of solar energy production and the application of various solar technologies, we have used the latest available literature to cover stand-alone PV and on-grid PV systems. More than 5000 trillion kWh/year solar energy incidents over India are estimated, with most parts receiving 4–7 kWh/m2. Currently, energy consumption in India is about 1.13 trillion kWh/year, and production is about 1.38 trillion kWh/year, which indicates production capacities are slightly higher than actual demand. Out of a total of 100 GW of installed renewable energy capacity, the existing solar capacity in India is about 40 GW. Over the past ten years, the solar energy production capacity has increased by over 24,000%. By 2030, the total renewable energy capacity is expected to be 450 GW, and solar energy is likely to play a crucial role (over 60%). In the wake of the increased emphasis on solar energy and the substantial impacts of COVID-19 on solar energy installations, this review provides the most updated and comprehensive information on the current solar energy systems, available technologies, growth potential, prospect of solar energy, and need for growth in the solar waste recycling industry. We expect the analysis and evaluation of technologies provided here will add to the existing literature to benefit stakeholders, scientists, and policymakers.

1. Introduction

To meet the growing energy demand and reduce the dependence on coal-based energy production, India has allocated many resources to enhance solar energy production [1,2]. While, in 2010, the solar energy installed capacity was 0.16 gigawatt (GW), currently (in 2021), it has reached 40.1 GW, which is an increase of 24,962.5% (Figure 1A) [1,3]. In terms of the major solar power systems, India currently has the installed capacity to produce 3 GW/year of solar cells and 10 GW/year of Solar PV modules (a PV module consisting of many solar cells) [1]. As per the Paris climate agreement, India needs to achieve 100 GW electricity generation capacity by 2022. This growth in solar-based energy generation indicates that solar power systems can substantially help to reduce India’s energy crisis in the future [2]. India has over 250–300 sunshine days in various parts of India, with continuous solar radiation of 200 MW/km2, equivalent to 5000 trillion kWh per year [3,4,5]. Many hilly areas in India receive a relatively higher amount of solar insolation, which can be converted into electricity by installing photovoltaic (PV) modules in roof buildings [6,7]. An increase in solar-based energy production in India can also help in tackling environmental problems caused by coal-based energy production [7]. Currently, India is among the top 10 solar energy-producing countries [8]. With the abundance of solar power and significant environmental benefits, a substantial increase in solar-based energy production is expected in India and other countries [1,3,4,5].
Solar energy production in any area is driven by solar insolation, weather, temperature, solar shadings, type of technology, and pollution, such as dust. Solar technologies are evolving rapidly to improve the existing designs of various solar energy conversion systems. Recent technical advancements in photovoltaic cells resulted in cost reduction and improved economics, which helped disseminate solar energy systems in multiple countries, particularly in poorer countries, where the cost of the photovoltaic system was one major hindering factor in the past. In 2019, the top 10 countries with the highest solar energy system installation were China, the USA, Japan, Germany, India, Italy, Australia, Vietnam, the Republic of Korea, and the United Kingdom (Figure 1B) [7,8,9]. While China, which has an installed capacity of 254,354 MW, is ranked at the top, the installed capacity in the USA is 75,571 MW (29% of the installed capacity of China). The installed capacity of China is about equal to the total (together) solar energy installed capacities of the USA (75,571 MW), Japan (68,665 MW), Germany (53,783 MW), and India (39,211 MW) [9]. In 2018, the world’s total photovoltaic capacity was 505 GW. This was a significant increment considering the world’s total installed capacity of only 15 GW in 2008 (Figure 1C). This is attributed to higher demand in Europe, the USA, and many emerging markets [10]. In 2018, the total installed capacity in operation worldwide was enough to produce 640 TWh of electricity per year, equal to 2.4% of annual global electricity generation [9]. The total world’s installed capacity in 2019 was 627 GW (Figure 1D). In 2019, the solar PV market was increased by 115 GW. The same year, the global market (not including China) grew by 44% [9,10]. In 2019, around 22 countries had sufficient solar energy capacity in operation to meet at least 3% of their electric demand, and 12 countries had sufficient solar energy capacity to meet at least 5% of demand [11]. While analyzing the trends of solar energy production, the overall objective of this study is to understand solar energy production in India and how it compares to other countries in the world and understand the technologies, which are widely used for solar energy production. The specific objectives are to (1) assess the growth in solar energy production in India; (2) describe solar energy systems and compare the existing technologies; and (3) discuss the key technologies, fundamentals, limitations, and future potential of solar energy. This study is novel in many aspects. First, it explores the impacts of COVID-19 on the growth of solar energy installed capacity and provides the most updated information on the growth of solar energy installed capacity. The post-COVID-19 trajectory of solar energy installation capacity has been evaluated. Second, it provides a comprehensive review of the existing solar cell technologies, their limitations, adaptations in various regions, and the scope of the solar cell recycling industry. Third, it described the irradiance transitions, cloud enhancement phenomenon, partial shading, and mismatch losses that affect the PV power system and power quality. Due to our holistic approach to this review and in-depth discussions of solar energy fundamentals, the study will effectively educate stakeholders to understand risks and support the decision-making processes for solar energy installations.

2. Solar Energy Technologies and Systems

In principle, we have sufficient sunlight to meet the global energy demand. For example, the earth’s surface receives enough sunshine in an hour and a half to handle the entire world’s energy consumption. Existing solar technologies convert sunlight into electrical energy through solar cells or a concentrator to convert solar radiation into heat energy. These solar technologies are categorized into the following two main types: (1) concentrated solar system (thermal); and (2) photovoltaic cells. Sunlight, solar radiation, is radiant energy (electromagnetic) from the sun, which provides light and heat. The amount of solar radiation in a location depends on many factors, including geographic locations, landscape, and weather. With the help of solar energy technologies, solar radiation can be captured and converted into useful forms of energy, such as heat/thermal, by using a concentrator, and electricity by using photovoltaic cells or solar cells.

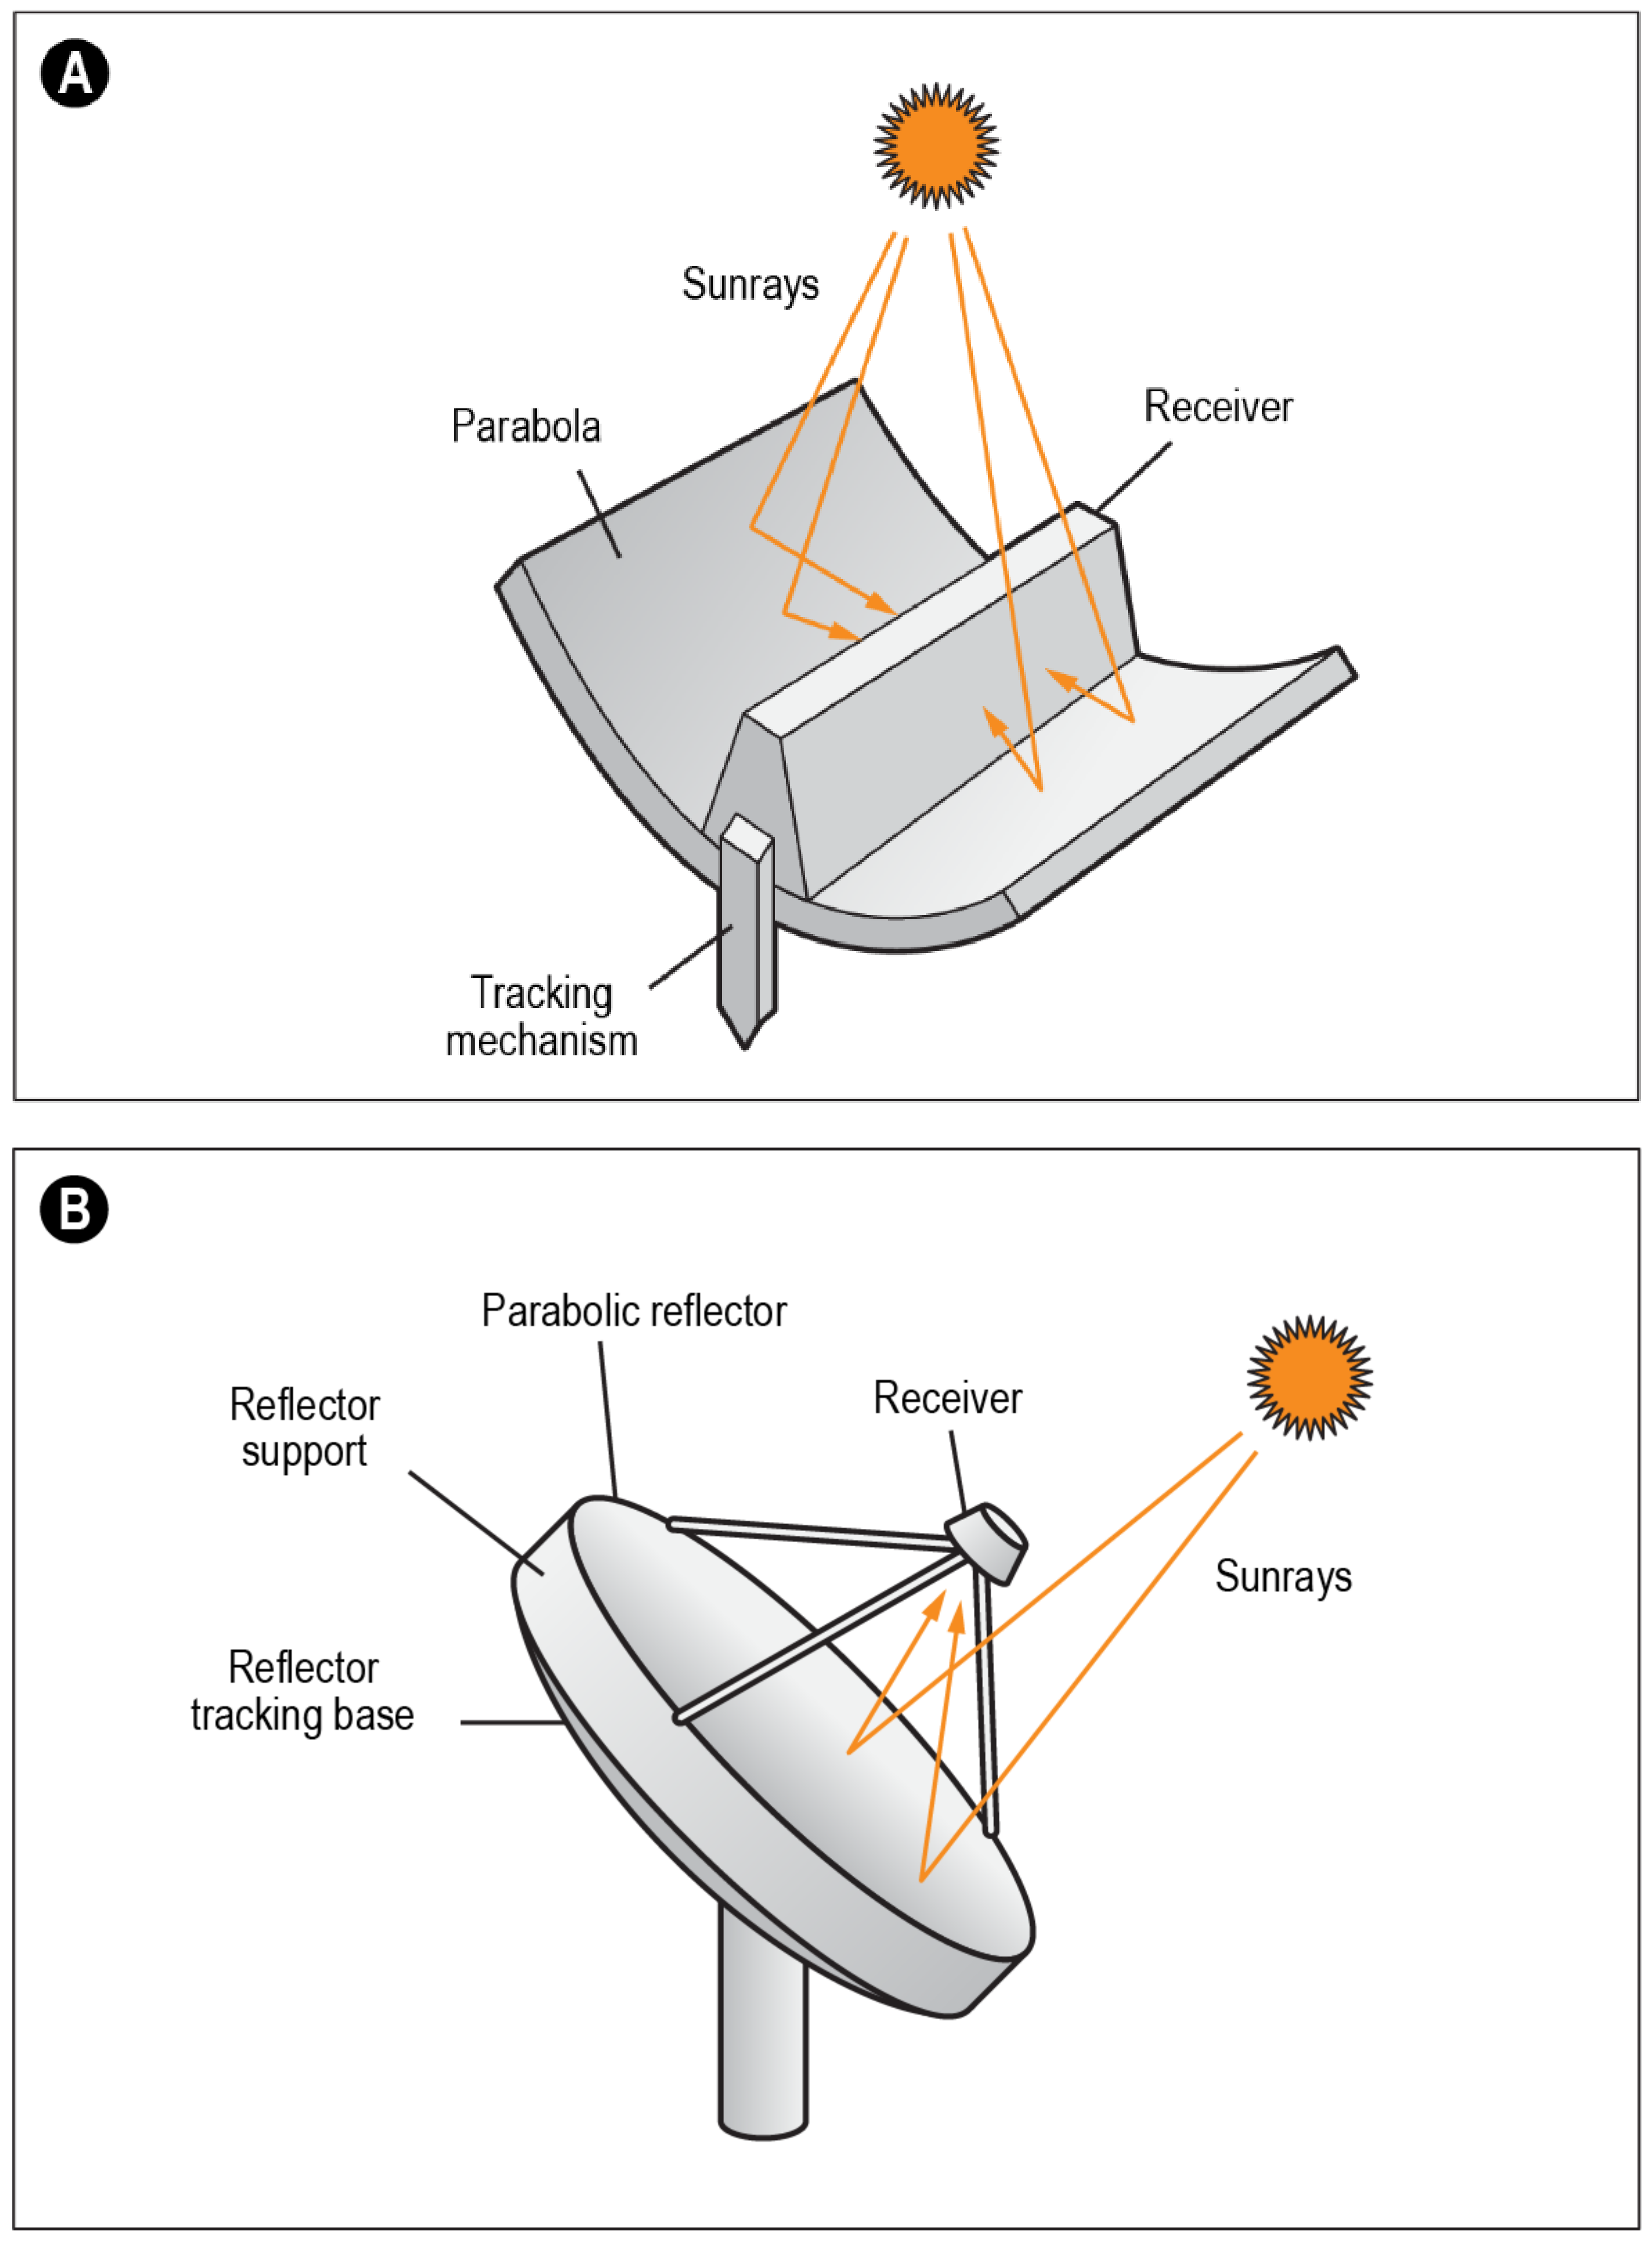
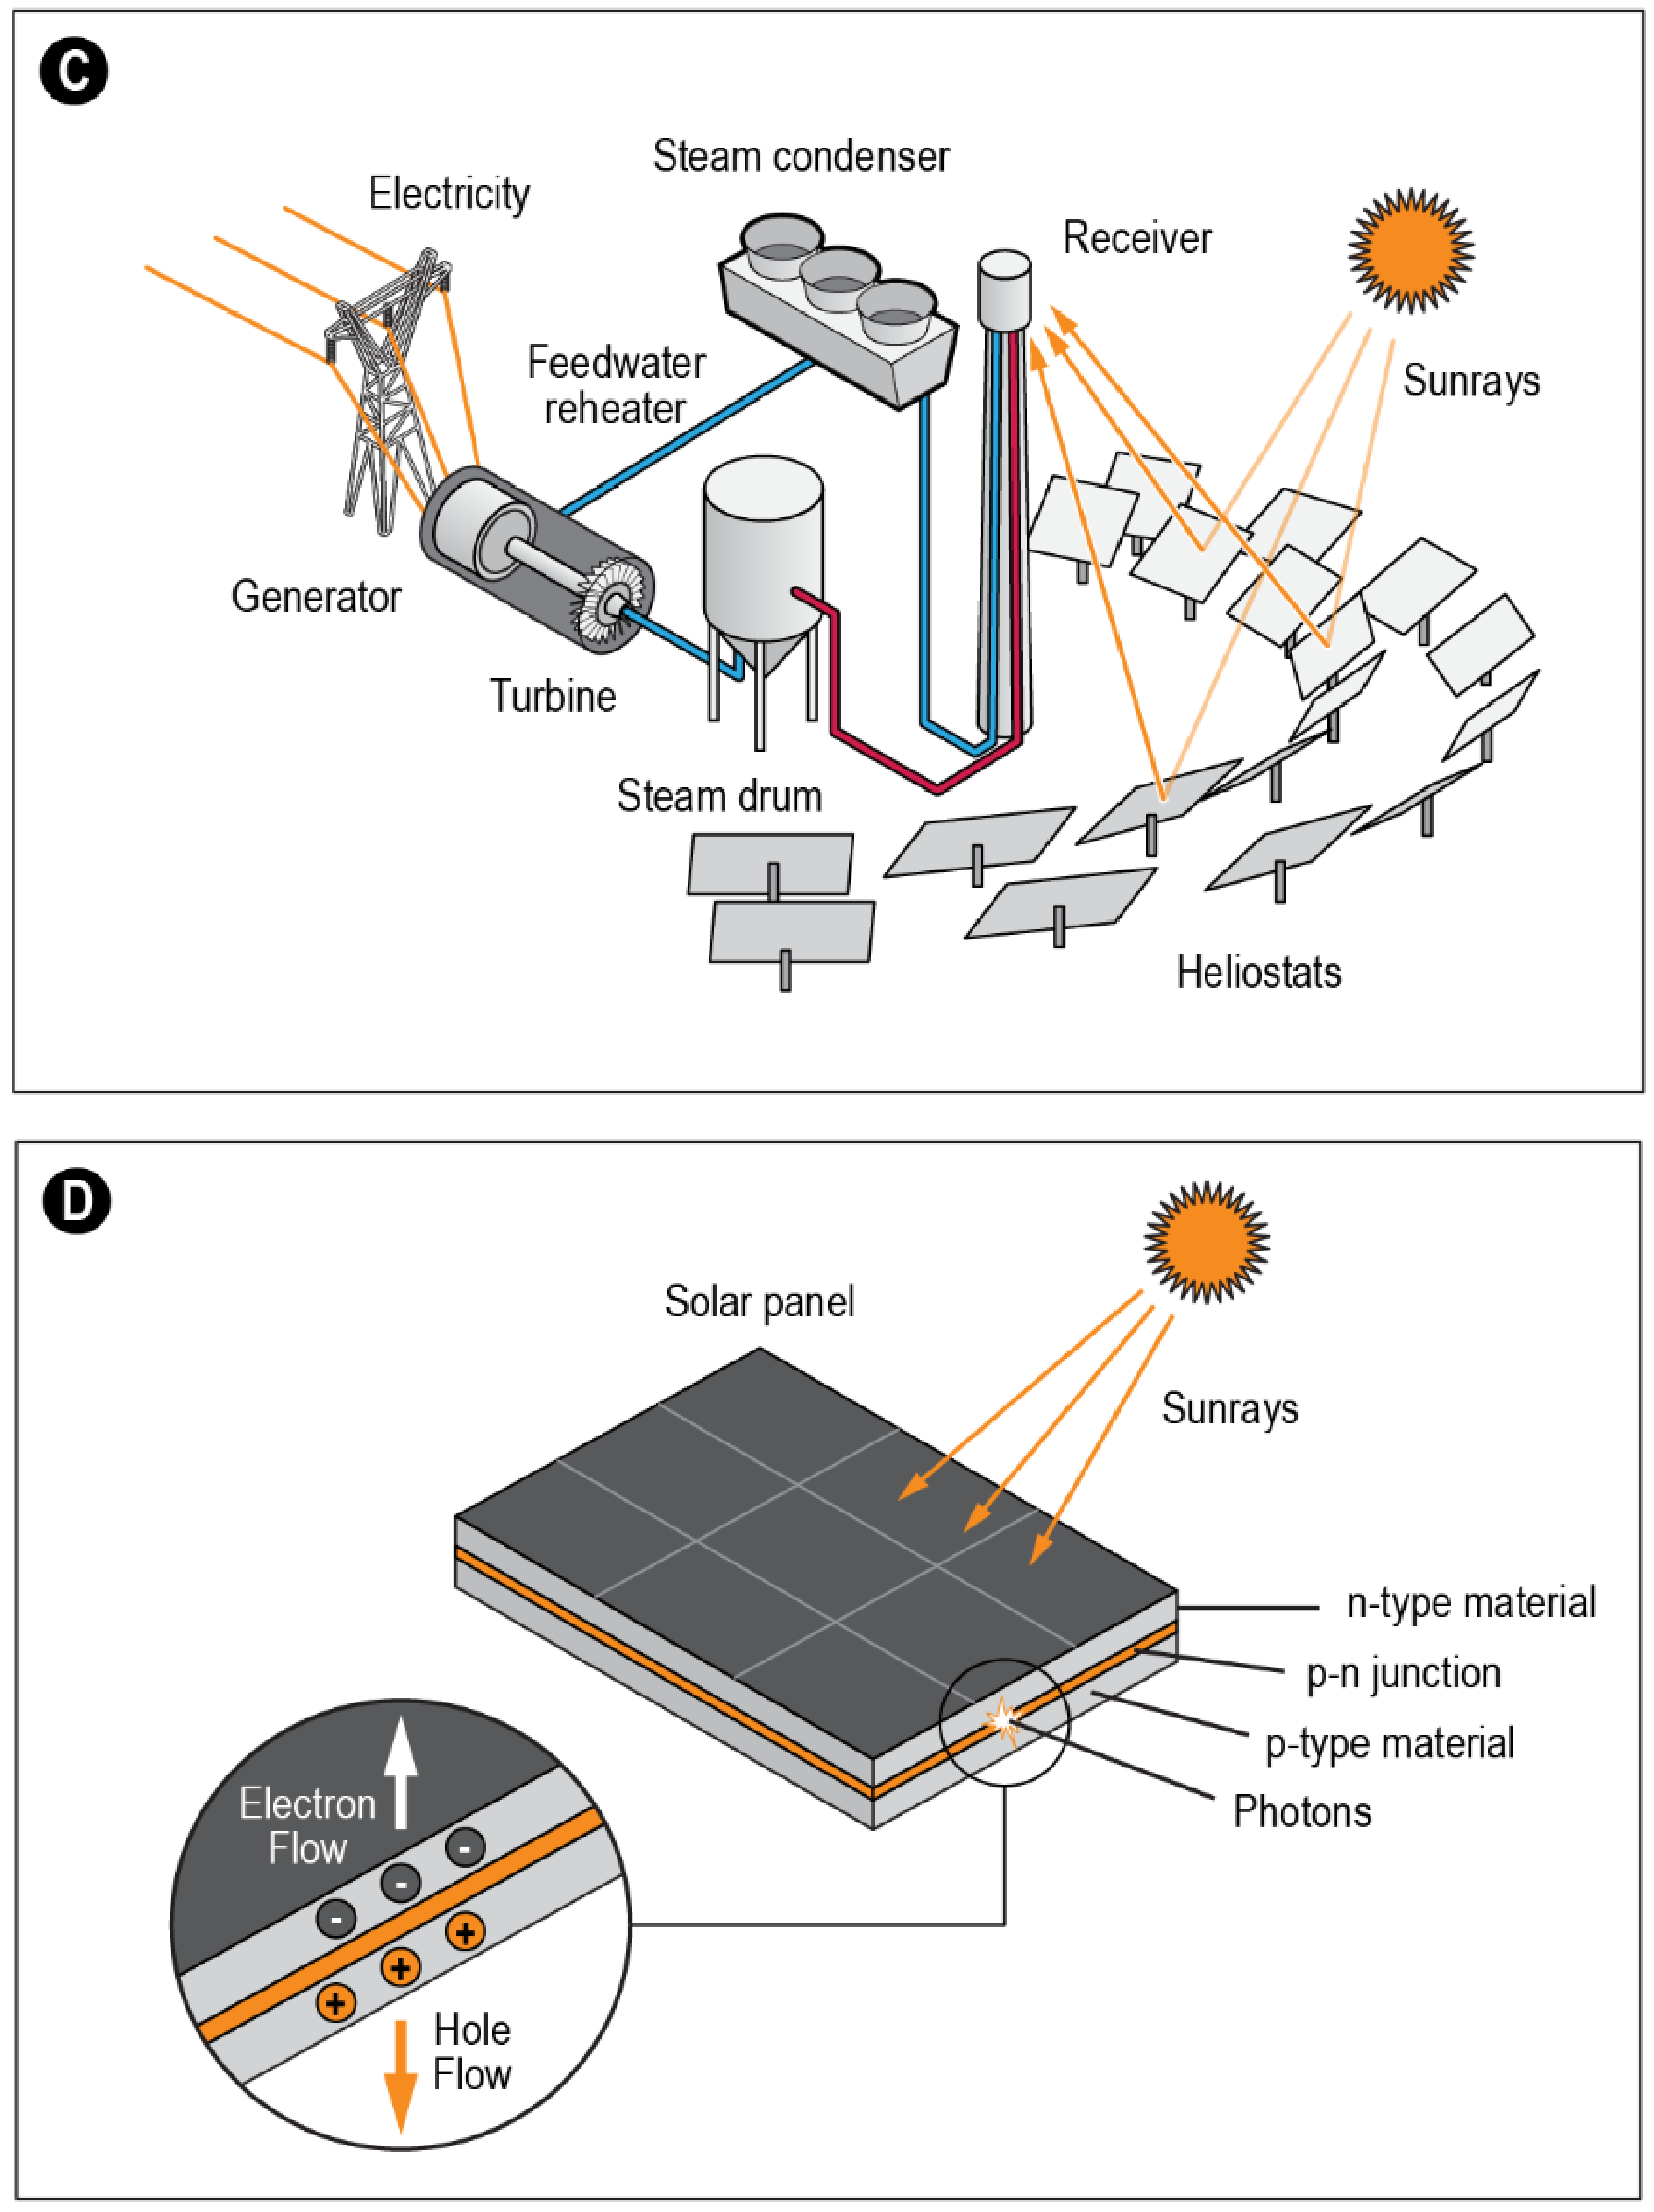
2.1. Concentrated Solar Power

In the past several decades, multiple technologies have been used in India to convert sunshine into energy, which can be used for various purposes. For example, the parabolic trough collector (PTC) (Figure 2A), where the temperature of the absorber tube can be increased to 350–600 °C [12]. In the PTC, the molten salt is used as a high-temperature heat transfer fluid to increase the system’s efficiency [13]. The PTC is considered the best concentrated solar collector technique for electricity generation and heat application [14]. For now, PTC has become a mature technology and is available worldwide for generating thermal energy [15]. The typical cost of concentrating solar power plants is relatively higher than other renewable energy-based electricity generation [16]. For example, the capital cost of a concentrating solar power system is about USD 3200–7300/kW, compared to solar PV (utility-scale), which costs USD 950–1250/kW [16]. Multiple types of PTC systems have been developed, and particular focus has been given to increase the aperture diameter of the PTC for improving thermal performance. A range of aperture areas from 128 to 1048 m2 have been used in the existing PTC-based plants [16]. Currently, PTC technology dominates the concentrated solar power (CSP) system. More than 90% of the CSP plants use PTC technology in India [17]. The trough system comprises a highly polished glass or aluminum surface with 85–95% high reflectivity. The radiation on the mirror surface is reflected in the absorber tube placed at the focal axis [17]. The CSP receiver is made of aluminum (Figure 2A) and is collated with a selective surface to improve absorptivity and minimize emissivity [18]. The overall efficiency of the PTC depends on both the optical and thermal efficiency of a PTC [17]. The first PTC plants were installed in the USA in 1984. Spain is the leading country with 2225 MW of installed capacity based on the PTC system, followed by 1361 MW in the USA [19]. By 2020, the world’s photovoltaic power system capacity increased to 633 GW, while the solar thermal power generation capacity is relatively small (only 6.8 GW until 2020) [20,21]. Currently, Spain has the highest number of CSP plants (over 50), followed by the USA (over 40) and China (over 20), and India (less than 15) [22].
Besides parabolic trough concentrators, parabolic-dish-based CSP plants convert solar energy into thermal energy and electricity (Figure 2B) [23,24,25,26,27,28,29,30,31,32]. A parabolic dish can increase the temperature of a fluid up to 750 °C. In a parabolic dish system, the receiver is at the focal point, and the receiver is attached to the turbine and generator, which is used for converting heat into electricity [23]. The capacity of the parabolic dish system can vary between 0.01 and 0.4 MW. The thermal efficiency of the parabolic dish system is about 25 and 30%, higher than the trough system. This is because the mirror in the parabolic dish is always pointed at the sun [24].
A solar power tower (SPT) is another technology used for electricity generation (Figure 2C). In this method, thousands of mirrors (heliostats) are placed around a tower, where sunlight is concentrated to heat the working fluid. Then, by using a heat exchanger, heat is converted to electricity. Each mirror has a sun tracking system, which helps keep the sunlight focused on the tower throughout the day. The power tower is considered efficient and cost effective and has better energy storage capabilities than other CSP technologies [25]. In the SPT system, fluid heat transfer plays a crucial role, and several types of fluid, such as MgCl-KCl with S-CO cycles, have been proposed [26]. The fluid temperature can reach 960–1500 °C depending on the month of the year and sunshine availability [27]. The SPT system is one of the efficient CSP technologies, which aims to collect the sunbeams on a central collector using heliostats (thousands of mirrors) [28]. The largest SPT system is the Ivanpah Solar Power Facility in the USA, which uses 173,000 collectors with an installed maximum capacity of 392 MW. Currently, no known plants based on SPT technology exist in India. The largest SPT plants are in the USA, followed by Morocco (7400 collectors with an installed capacity of 150 MW) and Israel (50,600 collectors with an installed capacity of 121 MW) [29,30,31].

2.2. Solar Cell

Solar cells, also known as photovoltaic (PV) cells (Figure 2D), consist of semiconductor material. The semi-word in a semiconductor is further clarified as a material that can conduct electricity better than an insulator but lower than a metal conductor [32]. Light energy is absorbed in semiconductors when exposed to light, and semiconductors transfer light energy to negatively charged particles (electrons) in the material. This increased energy permits the electrons to flow through the material as an electrical current. The efficiency of a PV cell (i.e., a ratio of the solar cell energy output to input energy from the sun) is determined as the amount of electrical power coming out of the PV cell compared to the energy coming in as light [32,33]. Many factors influence solar cell efficiencies, including wavelength, temperature, reflection, and recombination (i.e., charge carrier that includes negatively charged electron, and hole as the absence of an electron) [34]. Solar cells perform better at a low temperature, minimum reflection, and increased photons with the right energy to separate electrons from their atomic bonds to produce charge carriers and electric current [34,35]. In a solar cell, the photovoltaic effect is a process that produces an electric current (Figure 2D), and these cells are composed of two different semiconductors (p-type and n-type). These semiconductors are joined to form a p-n junction [35,36,37]. In order to work for a cell, the p-type silicon (i.e., conductor) is produced by adding atoms such as boron or gallium, and the n-type silicon is made by adding atoms that have one more electron in their outer level than silicon does [38].
For the n-type layer, material such as phosphorous is used because phosphorus has five electrons in the outer layer, and in the p-type layer, boron has one less electron in their outer layer. In a solar cell, p-type silicon is placed near n-type silicon to form the depletion zone (Figure 2E). The depletion zone is created because an n-type layer has an excess of electrons, and a p-type layer has an excess of positively charged holes that allow the transfer of electrons from n-type to p-type. In the depletion zone, electrons fill the holes (Figure 2E). In a scenario when all the holes in the p-layer are filled, it contains negative ions. The n-type layer, where electrons were initially located, now has positively charged ions. These oppositely charged ions in n-type and p-type layers produce an internal electric field [38]. A simple comparison between CSP technologies and solar cells is shown in Table 1.

2.3. Solar Cell Module, Panel, and Array

In terms of solar-based energy technology, wafer-based technology is the leader. The majority of solar cells are made based on this technology. The wafer-based technology produces crystalline solar cells (monocrystalline and polycrystalline silicon). In the production of solar cells, monocrystalline silicon is sliced from large single crystals grown in a highly controlled environment. Compared to polycrystalline, the monocrystalline silicon solar cells are the most popular and oldest technology made from thin silicon wafers, which provide a 4–8% higher power output for the same size module. In addition, polycrystalline is composed of several small, low-grade silicon crystals that reduce the cost and efficiency compared to monocrystalline silicon. In terms of technology, polycrystalline silicon is considered the key technology in manufacturing conventional silicon-based solar cells. In 2006, more than half of the global supply of PV cells was based on polycrystalline solar cells.
The solar cell is a single basic unit in designing the solar module and panel. It is a semiconductor device that converts sunlight into direct current. Solar cells are used for producing a solar module, which has many solar cells (Figure 2F) [39,40]. Several solar cells are combined in an electrically series and parallel manner to manufacture a solar module based on the voltage and current requirement [39].
The module is a critical element of the PV System and is made by sealing the cells completely by lamination, which protects them from rain and dirt [40]. The array of PV modules is formed by connecting the modules in a series and parallel manner [41]. A solar module is a single solar panel, an assembly of connected solar cells. In general, a solar module consists of an assembly of 6 × 10 solar cells and can produce energy from 100 to 365 Watts DC [42].
Solar panels include a single solar module or more solar modules to produce the desired DC electricity. A solar array can have many solar modules and panels [43]. As a general rule, 5–10 solar panels may be needed for a home, consuming 500–1000 kWh per month. In 2019, the production of solar modules worldwide reached 140 gigawatts, which is significantly higher than 238 megawatts in 2000 [44].
Many large-sized solar plants (with capacities of >2000 MW) are recently installed in India and worldwide [43,44,45,46,47,48,49]. The top 12 most prominent projects are shown in Table 1. In 2020–2021, the two most significant solar projects were installed in China and India, with a combined capacity of 4245 MW (Table 1). Currently, there are more than eight projects worldwide, which produce more than 1000 MW. Four of the 12 most significant solar projects are in India (Table 2), which shows India’s substantial emphasis on solar energy production.

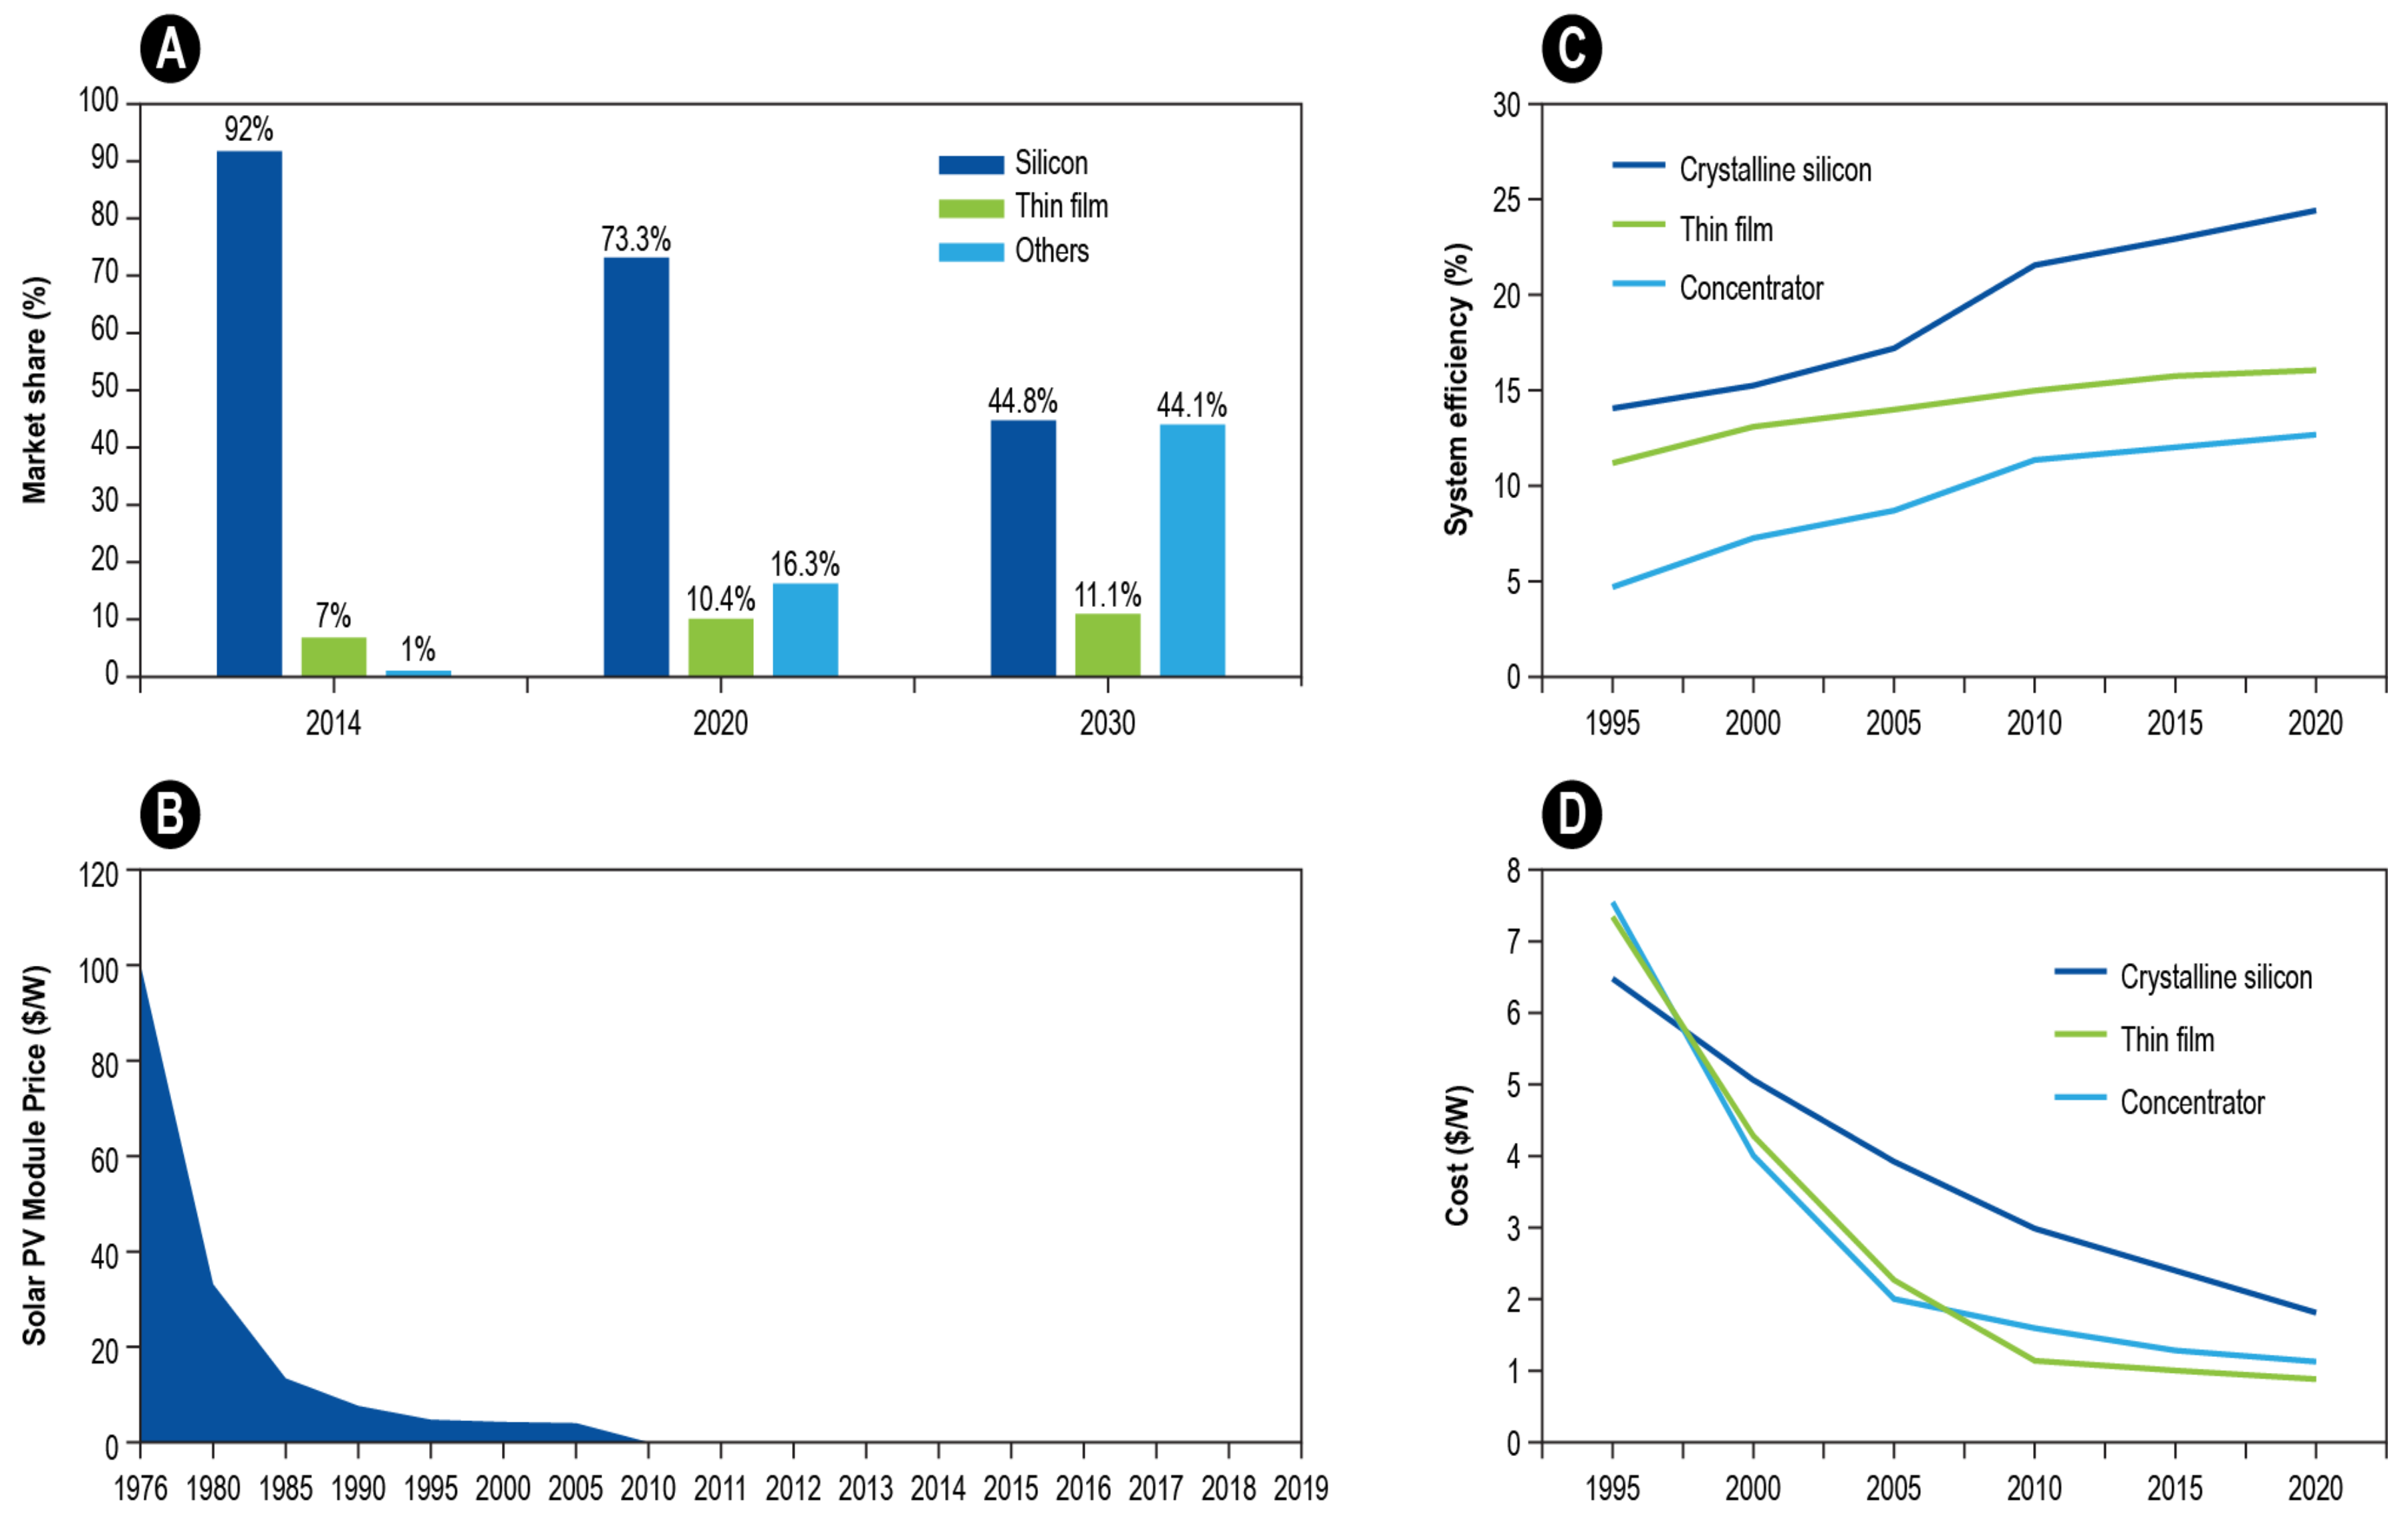
2.4. Photovoltaic Systems, Efficiency, and Cost

In terms of solar energy production, growth in photovoltaic cell production is favorable. However, improvement is expected considering the price, efficiency, and cost. The market share for various types of solar cells is shown in Figure 3A, which shows that silicon-based solar cells dominate the market. In 2014, over 90% of the market share was accounted for by silicon-based solar panels. Around 5–7% of the market was accounted for by Cadmium telluride (CdTE)-based technology, and 1% was accounted for by other materials such as dye-sensitizes, concentrator photovoltaics (CPV), and organic hybrids [63,64,65]. Currently, silicon-based solar cells in the market are about 73%, and CdTE based cells are about 10% (Figure 3A). In terms of cost, substantial reductions in solar module prices have been witnessed over the past four decades (Figure 3B) [66,67]. For example, the cost of a solar module in 1976 was about USD 106/Watt, which was reduced to USD 0.38/watt in 2019 (Figure 3B). The more than 99% reduction in the cost can be associated with increased production and manufacturing technologies’ improvement.
The efficiency of solar cells increases over time (Figure 3C) [67], and expectations are that solar cell efficiency will continue to increase with advancements in manufacturing and material development technologies. In 1950–1960, solar cell efficiencies were 5–10%, and many solar cells are currently available with 15–20% efficiency [67]. Over time, the cell efficiencies of each solar energy system have been increased regardless of the crystalline silicon, thin-film, and concentrator systems (Figure 3C). Currently, the concentrator system is considered to have the highest efficient (efficiency was around 25% in 2020). The capital costs for the three different PV systems (i.e., crystalline silicon, thin-film, and concentrator) are shown in Figure 3D.

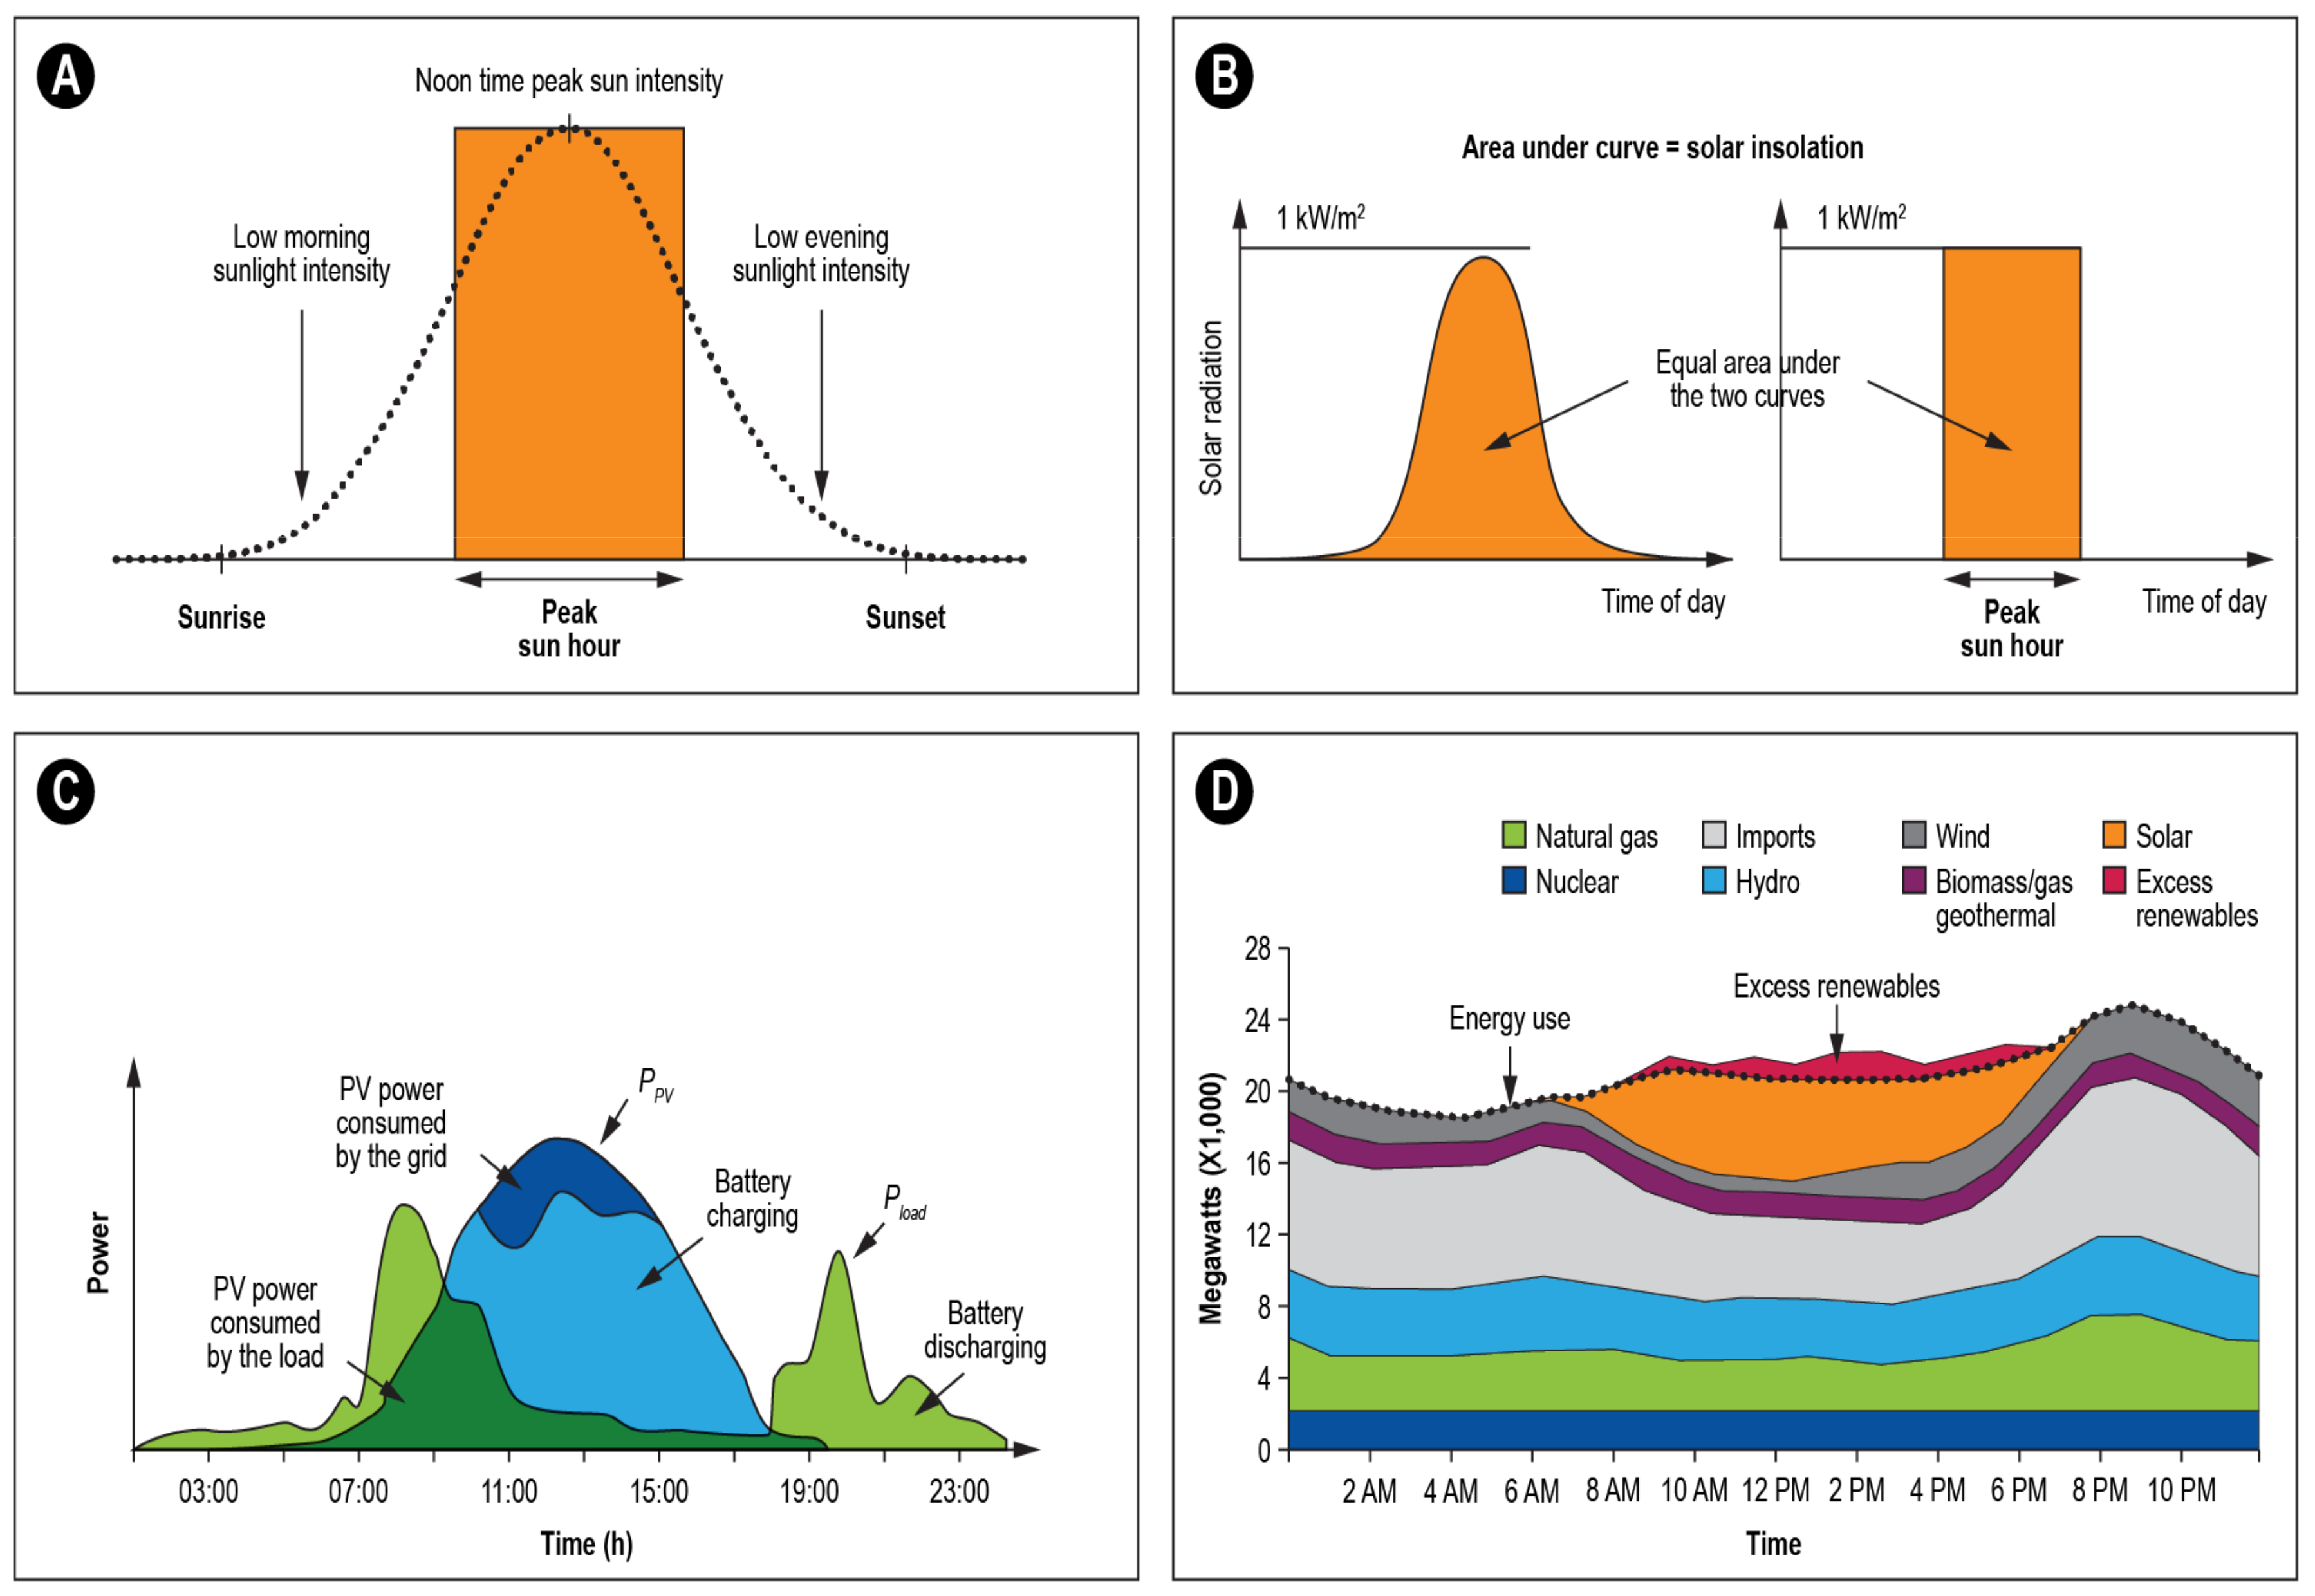
3. Diurnal Changes in Sunlight Intensity and Solar Energy Production

The sunlight intensity, which influences solar energy production and changes within a day, climate, and weather, influence solar cells and solar energy production. During a normal day, the insolation is the maximum at noon, when the sun is at its highest point (Figure 4A) [68]. A location’s average daily solar radiation provides sufficient information to design the system and its basic solar energy system capacities. Peak sun hours, often used in solar energy system installation, are defined as the average daily solar insolation (kWh/m2/day) (Figure 4B). The peak sun hours are numerically equal to the average daily solar insolation [69]. The figure indicates the area under the curve equal to the solar insolation defined by peak sun hours (Figure 4B).
A typical daily profile of a residential unit with an installed PV generation unit and load demand is shown in Figure 4C. This profile shows the low demand in the midday and early afternoon hours while increasing production simultaneously. During the evening, high demand occurs with low energy production in the solar energy system. Therefore, the energy storage system such as the battery plays a crucial role in storing excess power during peak production time and supplies the energy during peak demand time (Figure 4C) [70]. In certain situations, when renewable and non-renewable energy sources are connected through the grid, the excess renewable powers can be generated (Figure 4D), and tackling those extreme production requires planning and balancing between renewable and non-renewable energy sources. While energy production from sunshine can often be unpredictable due to the weather and cloud, the energy production from non-renewable sources such as power plants operated with natural gas is relatively more predictable [71,72,73].

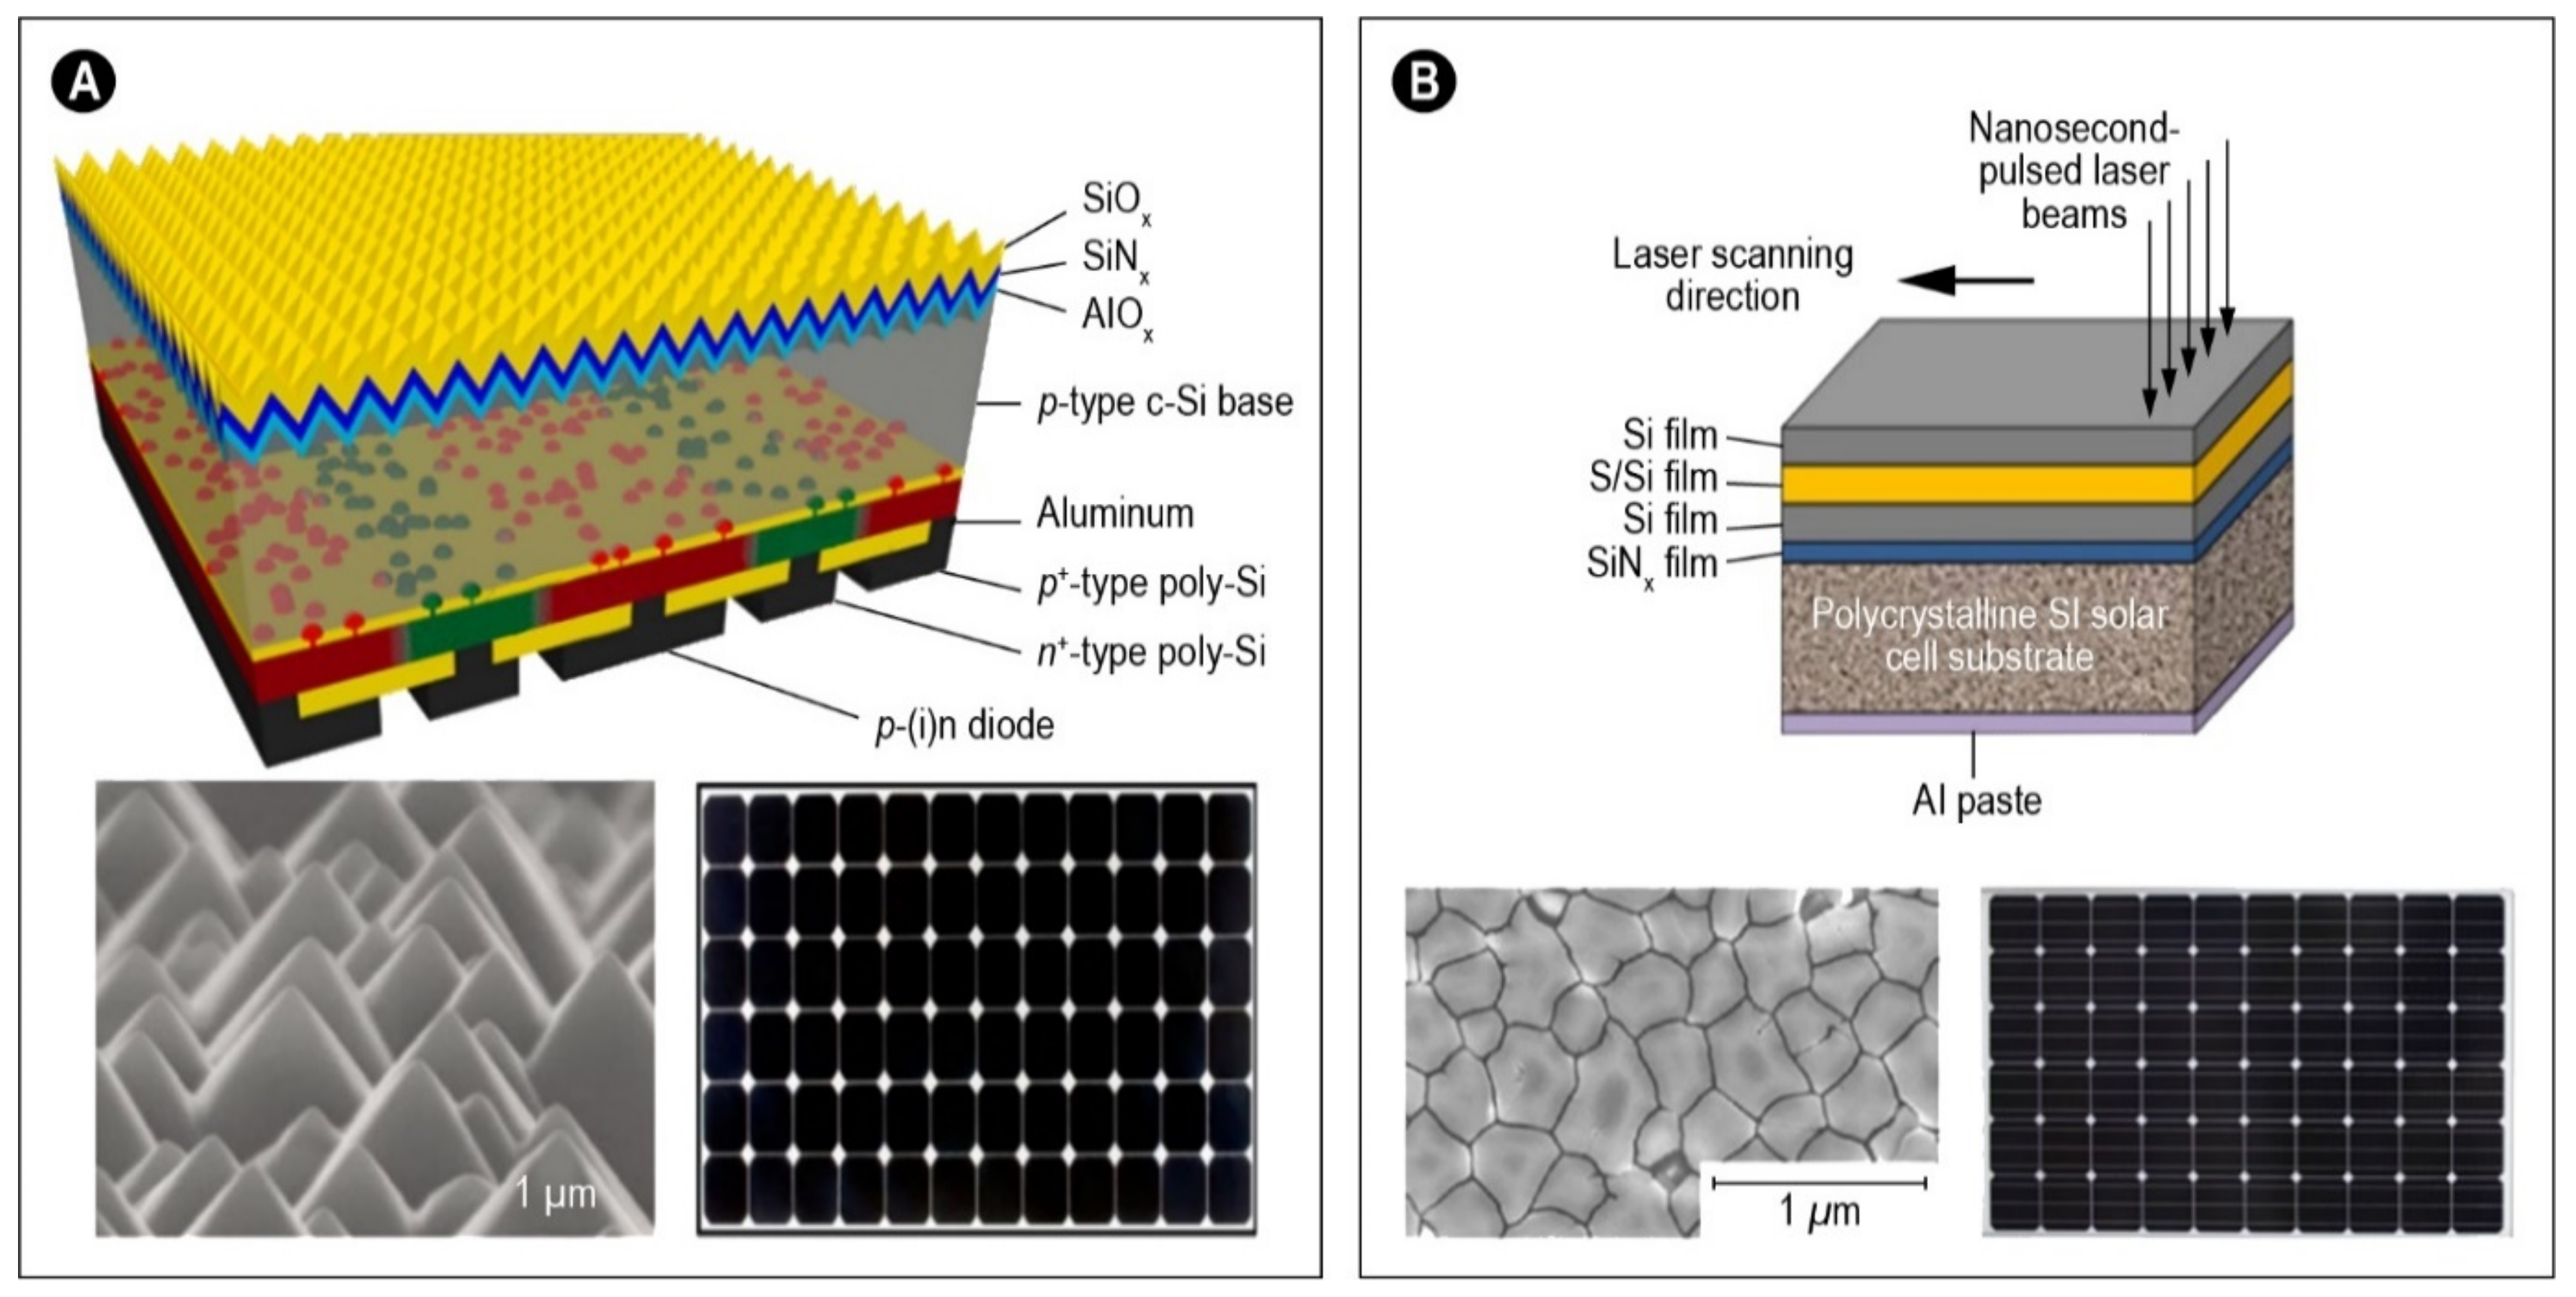
4. Monocrystalline and Polycrystalline Solar Photovoltaic Systems

Both monocrystalline and polycrystalline-based solar photovoltaic systems are used worldwide (Figure 5) [74,75,76,77,78]. Monocrystalline solar cells (Figure 5A) are made from a cylindrical silicon ingot grown from a single crystal of high purity, and subsequently, the cylindrical ingot is sliced into wafers forming cells [79]. Monocrystalline cells have a pyramid pattern that facilitates a relatively larger surface area to collect energy from the sun. Due to improved efficiencies, monocrystalline solar cells produce more electricity. The solar panels made of monocrystalline cells are often used in residential and commercial applications. Currently, the efficiency of monocrystalline cells varies between 13 and 19% [80]. Polycrystalline solar cells comprise several crystals of silicon [81] (Figure 5B). Polycrystalline solar panels are considered more eco-friendly but have a lower heat tolerance than monocrystalline cells. Polycrystalline solar panels are used in large solar farms to convert solar power into electricity. The key ingredient used in polycrystalline solar cell formation is silica sand, i.e., silicon dioxide (SiO2). The major difference between monocrystalline and polycrystalline is that, after the purification of the silicon, pulling the ingot produces homogeneous cylindrical crystals for monocrystalline. However, for polycrystalline cells, the silicon is left to cool and fragment, and subsequently, these fragments are melted and formed in cubic-shaped growth crucibles [82]. Polycrystalline solar cells are relatively cheaper, and the production process is simpler, but it also shows a lower efficiency of 9–14% [80,83]. Many minute crystals exist in a poly-Si, giving the material a typical metal flake effect [84]. The future trend shows that monocrystalline solar modules will dominate the market because of their effectiveness, solid design, and durability [85].

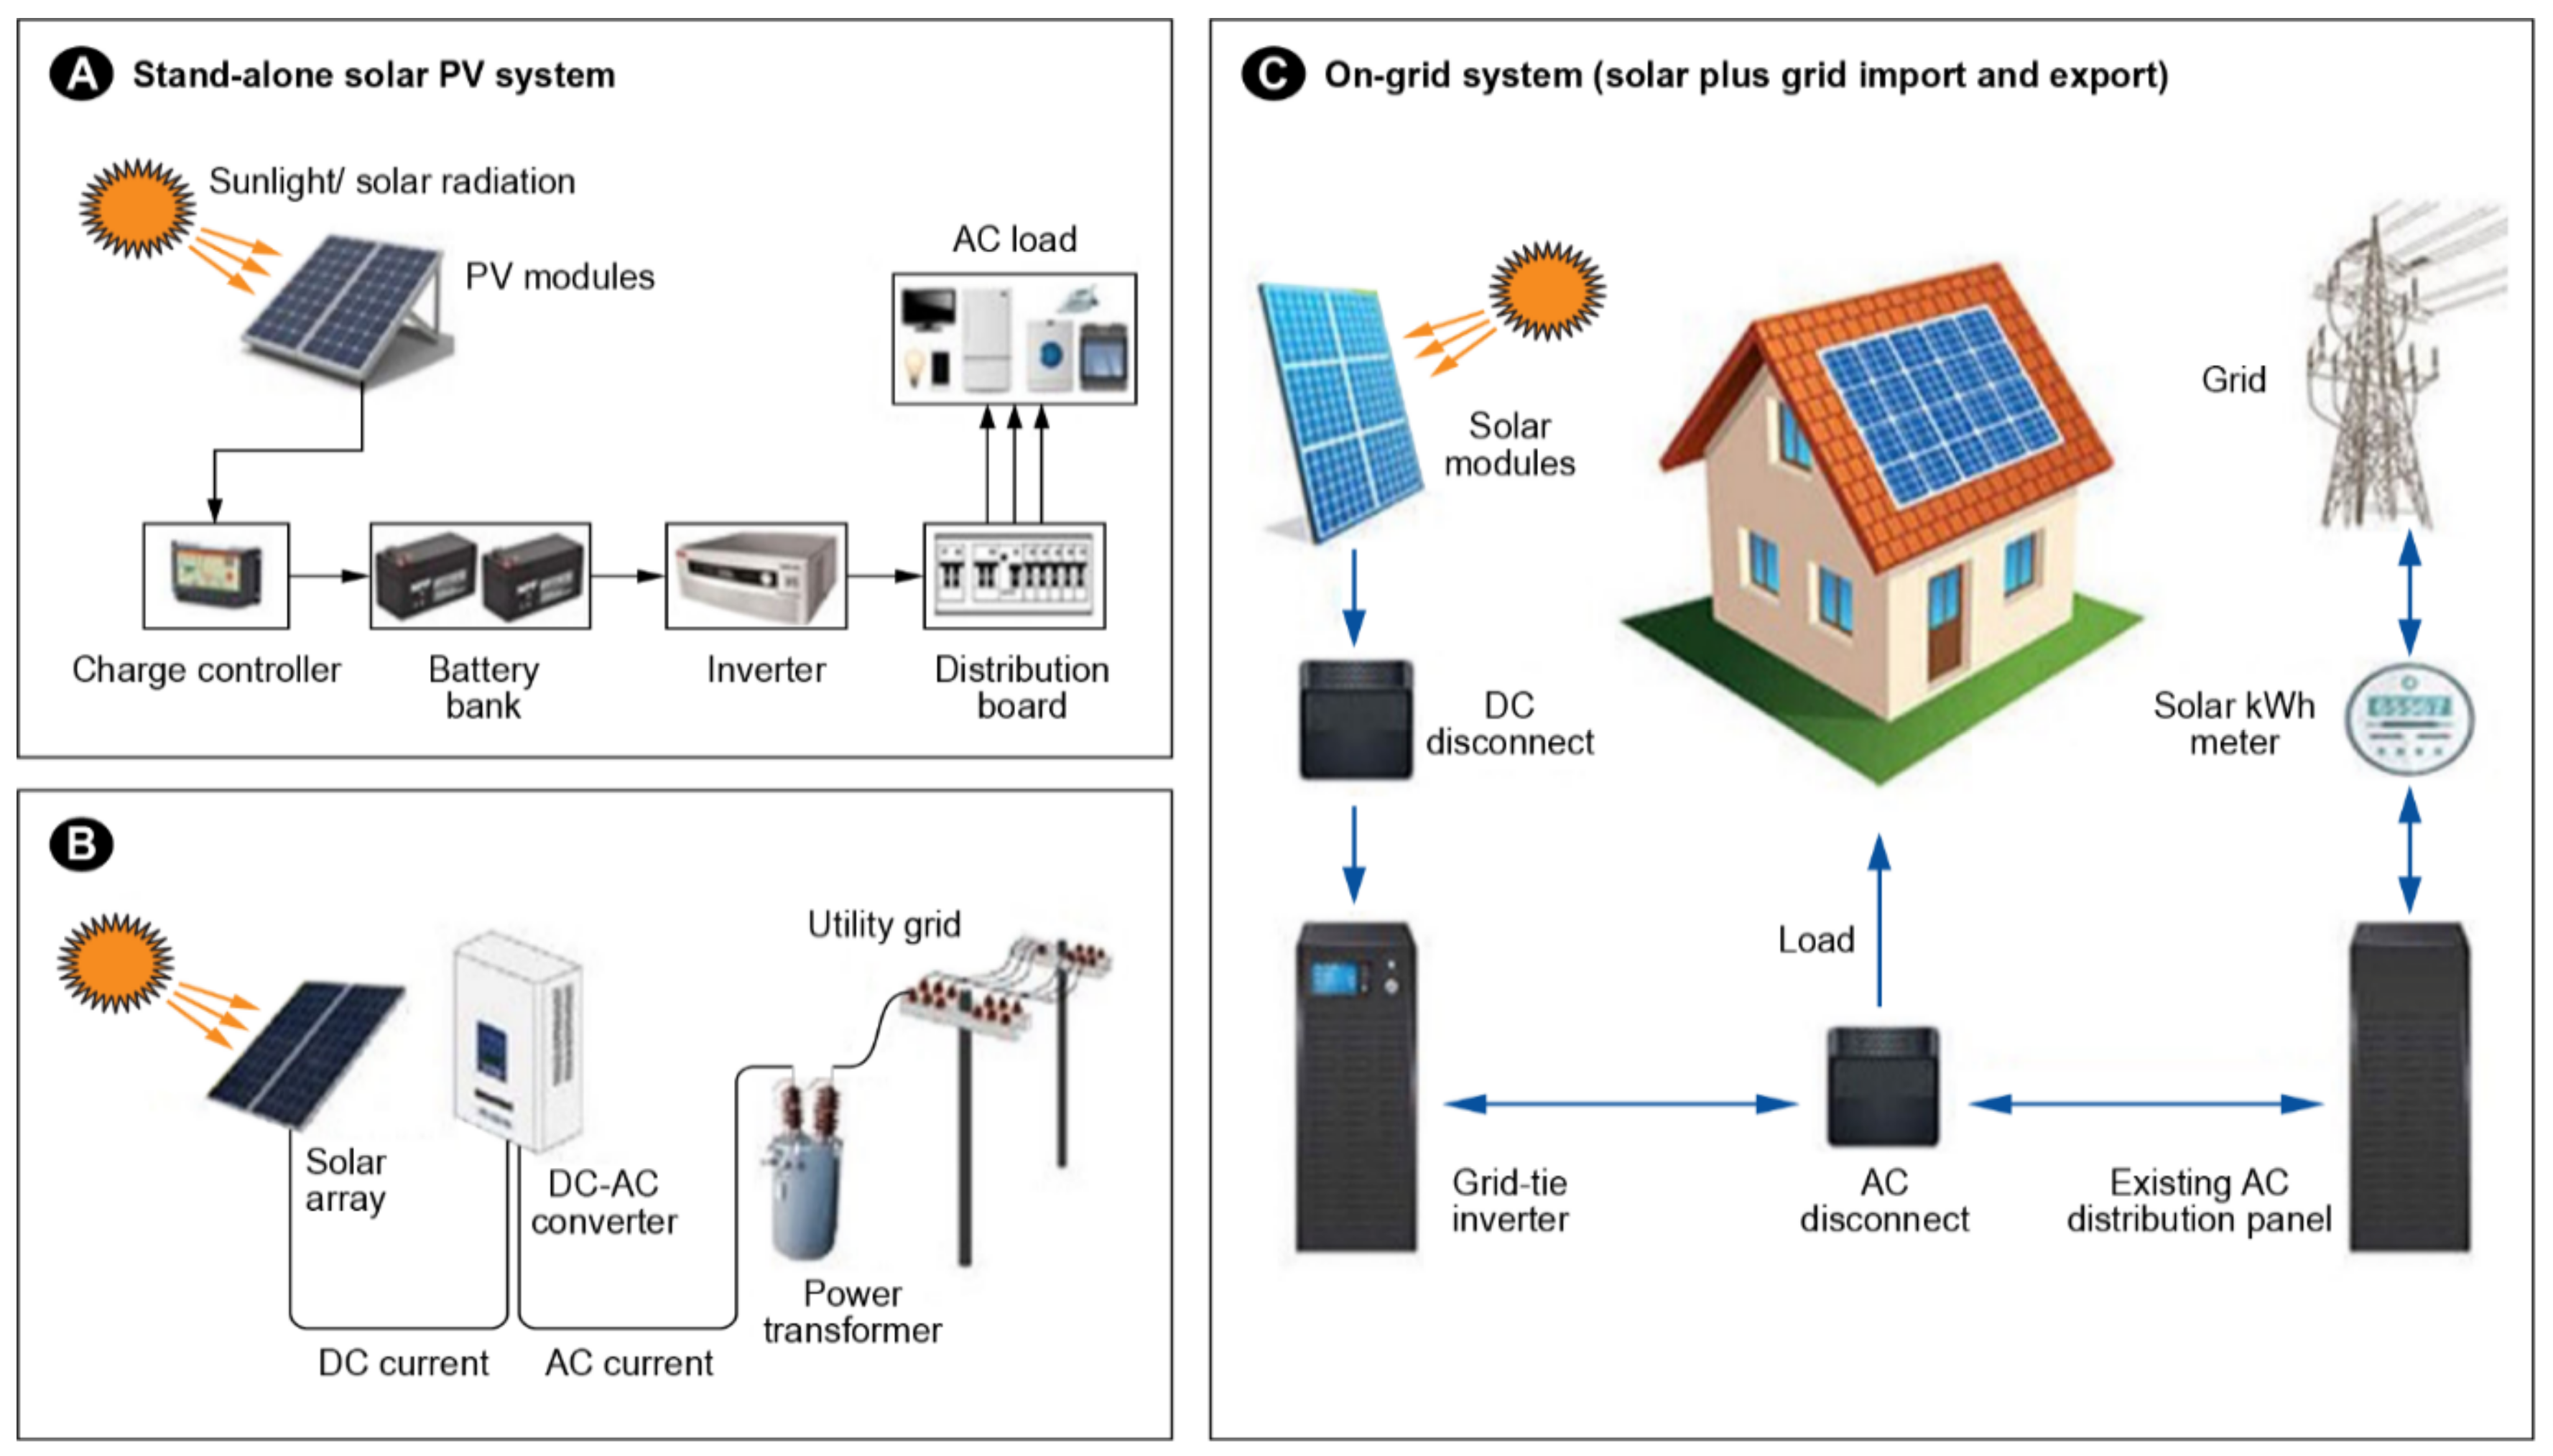
5. Single Unit and Utility Grid Solar Power Systems

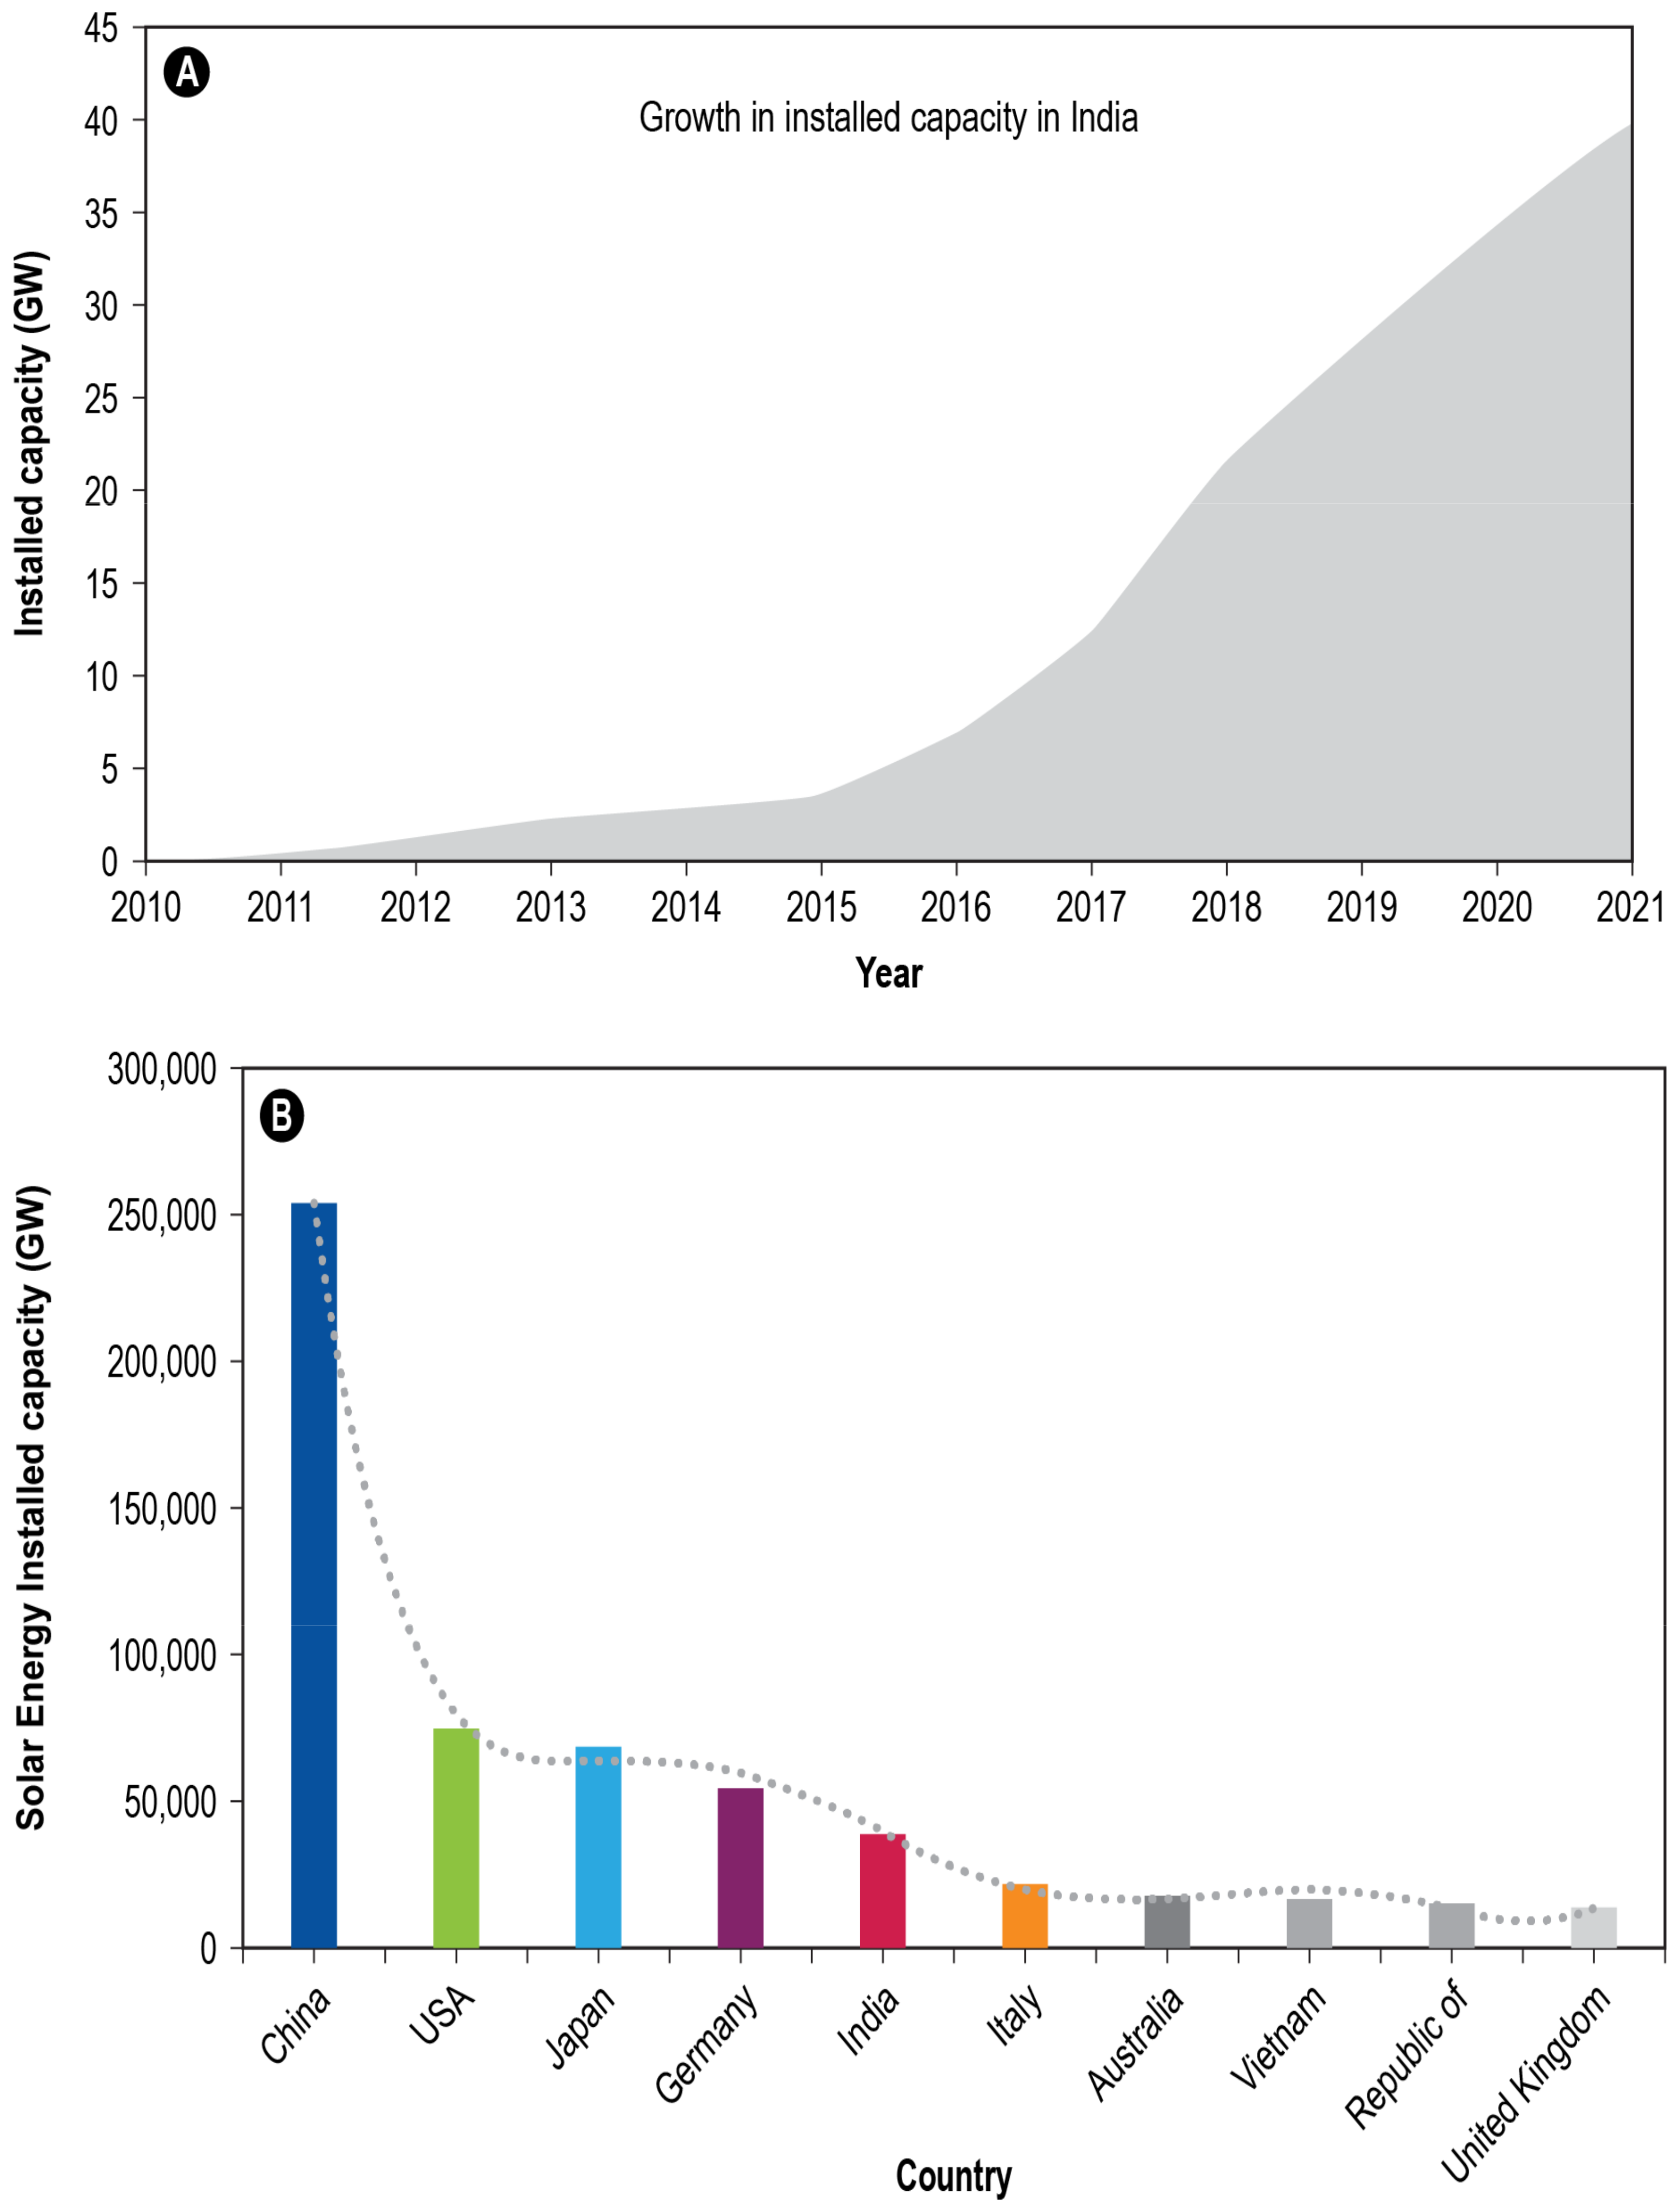
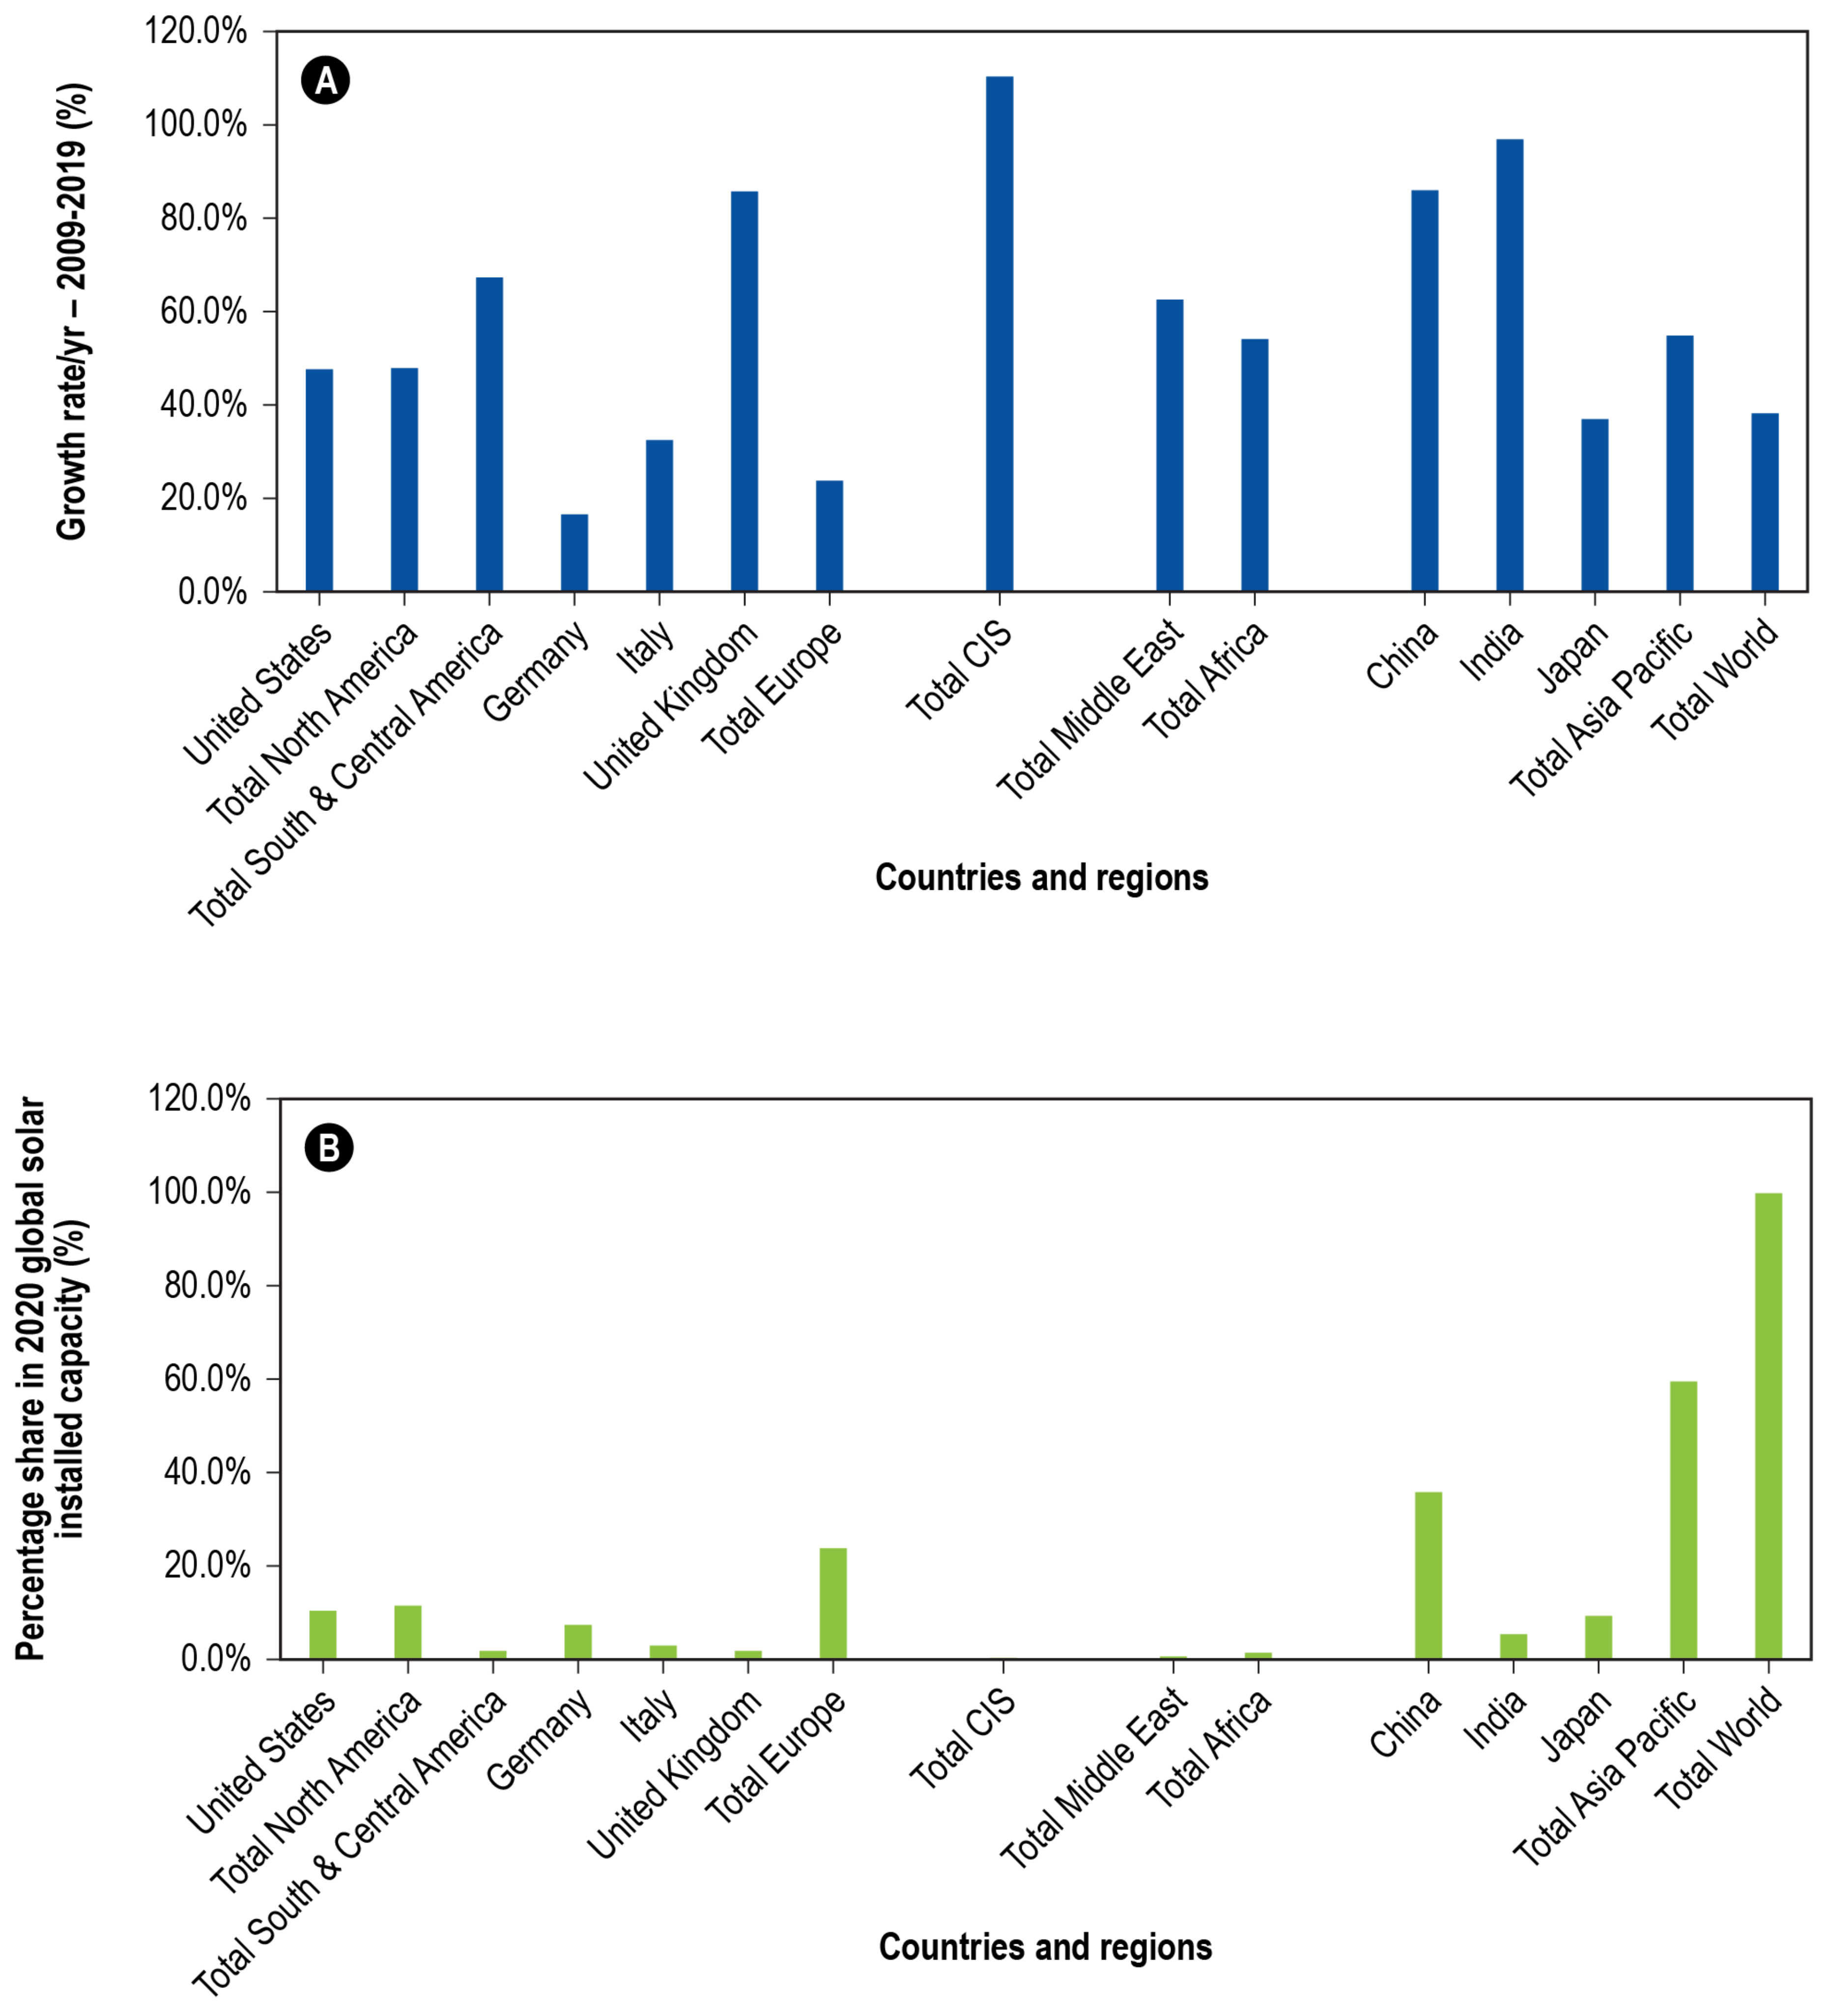
5.1. PV Power Production System and Growth

A significant amount of non-renewable electricity demands can be met through solar energy. PV power plants are designed by constructing blocks, which include a PV generator, a transformer, and an inverter. The PV power plant’s inverter is related to the power generator. Multiple solar modules and panels can be fitted depending on the power requirement (Figure 6) [86,87,88,89]. For example, stand-alone systems are popular in residential units isolated from the grid (Figure 6A). Solar panels charge the batteries with the help of the charge controller. Subsequently, inverters are used to supply the loads. The size of the stand-alone system varies according to the available solar radiations and load conditions. These systems are often useful for small housing and business communities in rural and urban areas [86]. A large stand-alone solar PV power system can supply DC and AC loads [90]. Rooftop on-grid Solar PV systems are used in houses and connected with the batteries for storage. This type of system can also be connected with the grid. In general, it involves a hybrid inverter that supplies AC power from the battery and can supply AC power to the grid.
A solar power generator is used for the instantaneous power injection in a grid-tied system. These systems do not require the battery to store the energy (Figure 6B). Instead, the direct current (DC) power generated from the solar array is converted to alternating current (AC) using inverters before injecting it into the grid. In a grid-connected solar power system, when batteries are connected, the grid acts as a buffer (i.e., oversupply of PV is transmitted to the grid. During the under-supply of PV, power can be received from the grid (Figure 6B,C). Based on the International Renewable Energy Agency, the global grid-connected solar capacity was 580.1 GW in 2019, and 3.4 GW was from off-grid PVs [91]. In 2019, the ground-mounted solar system installed capacity was 27,930 MW, the rooftop solar power system was 2141 MW, and the off-grid system was 919 MW [92]. Currently, the majority of the electrical power of the power grid is obtained from non-conventional sources. A relative comparison among various power sources (thermal power, hydroelectric power, nuclear power, and solar power) is shown in Table 3, which is common in grid-based electricity supplies. In many aspects, the solar power system is superior to other forms of energy.
The growth rate in the installed capacity of solar energy between 2009 and 2019 is shown in Figure 7A. Over the past decade, a substantial increase in the installed capacity of solar power has been seen on each continent (Figure 7B). A categorical distribution of the installed capacity is indicated in Table 4. The results showed that the growth rate in India and China was the highest, 97.1 and 85.9%, respectively. In the global share of installed capacity, China contributed 35.9%, and the USA contributed 11.7%, which is the largest contribution among any country.
Among various regions, Asia Pacific contributed 59.7%, followed by Europe, which contributed 23.70%, indicating substantial infrastructure has been built in the Asia Pacific and Europe over the past decade for solar-based energy production. Currently, the cost of solar energy is reducing with the advancement of technologies and increased production. The massive cost reductions in the last decade are a significant reason for solar renewable energy rapidly transforming the global electricity mix [93]. Besides solar energy, the cost of electricity from onshore wind and solar PV is cheaper than the new and some existing fossil fuel plants. According to the IEA [93], renewables are the most affordable way to meet the growing energy demand in many countries. However, the decrease in the cost of renewables such as wind and solar will not protect the renewable energy projects from challenges that prevent them from expanding [93], and additional safeguards may be needed.

5.2. Scope of Solar Module Recycling

The industries involved in solar cell production are some of the fastest-growing industries, and growth in solar cell production is enormous. For example, countries such as Sweden have witnessed a growth in installed capacity of 70% in 2018–2019. Growth in India for installing the solar energy system has been more than 90% over the past few decades. Solar PVs have an average 25-year life span, and soon many developed solar cells and panels will reach the end of their life in India and across the world, and methods capable of recycling solar cells will be crucial [94,95]. Several advances have recently been made to optimize solar geometry, including determining and optimizing factors such as heat gain, shading, and daylight penetration potential [96]; however, research in recycling solar cells has been slow. Temperature, precipitation, wind, and sunshine substantially impact solar energy production. Currently, the feedforward neural network model [96] and advanced technologies are used to optimize solar geometry to enhance solar energy production efficiencies under various settings. While an improvement in solar cell efficiencies is certainly needed considering the demand for the solar energy system, strategies to identify solar cell waste management are equally important. With a large amount of solar cell production, there will also be significant solar cell waste generation. This necessitates additional research to identify cost-effective recycling methods for improving sustainability in solar energy production. Attempts such as developing organic solar cells are promising for improving the recycling of solar cell wastes [96,97]. Currently, only a few solar cell recycling facilities are in existence across the world, including India, and often recycling is cost prohibitive. The solar cell and panel waste at the end of life pose substantial environmental risks. Public health and industries involved in solar cell recycling will witness substantial growth as this is a newly emerging field [98,99,100,101]. Cost-effective methods for recycling solar cells are yet to be discovered to minimize the associated risks. Efforts from various government agencies will play a crucial role in paving the way to recycling solar cells.

5.3. Reviving Solar Industry Post COVID-19 and Future Prospects

The challenges such as government policies, age-old infrastructure, lack of a proper battery storage system, and the ever-changing market scenario may limit the wider adoption of solar energy worldwide. The National Solar Mission in India targets 100 GW of solar electricity capacity by 2022 with 40 GW as Roof Top Photovoltaic Cells [102], which suggests that solar energy production will be more decentralized. This requires substantial additional planning to install and recycle solar cells. Currently, a substantial demand for solar energy-based agricultural equipment is seen. For example, more than 1.3 lakh off-grid solar pumps are installed in the country, and considerable growth in installing such a system is expected [103]. Grid-connected solar energy systems are likely to promote sustainable agriculture. Further, adaptations of solar windows and solar streetlights can reduce the dependency on conventional energy sources [104]. Considering the current trends, China will likely remain the largest PV market, and expansion will continue in the United States and India with ongoing policy support at the federal and state levels [105]. Due to the recent COVID-19 pandemic, a significant decline in new solar PV capacity has been observed in India, which was expected to recover in 2021. India is estimated to obtain 14 GW of newly installed PV capacity in 2021, about 280% more than in 2020. Between January and September 2021, India completed 8.21 GW of new solar capacity installation. Of the 14 GW solar power in India in 2021, around 11 GW is expected to come from utility-scale projects, and 3 GW will come from distributed generation [106]. Similar to India, many other countries have experienced a decline in solar PV installation in 2020 due to COVID-related delays (supply chain issues, labor, and material availability). However, the PV market was projected to recover rapidly in 2021 and maintain its growth in the coming years [105]. In recent years, developments in solar energy generation in Brazil and Vietnam have been reported, mainly driven by robust policies supporting distributed and decentralized solar PV applications [105].
It was anticipated that overall, at a global scale, solar PV electricity generation would increase by 145 TWh in 2021, which is approximately 18% new additions, and PV electricity generation would approach 1000 TWh in 2021 [105]. Recurrence in the growth of PV-based electricity generation, and long-term trends, indicate that the recent pandemic may not have substantial negative impacts on the Paris Agreement. The growth of the renewable energy sector indicates that the emission targets are likely to be met. COVID-19 may influence energy consumption patterns (i.e., travel, residential and commercial energy uses). However, one of the significant impacts of COVID-19 will be on the economic capacity of a country to devote resources to meet the goals of the Paris Agreement and willingness to meet their existing Paris emission pledges. COVID-19 may impact the national commitments to action [107]. According to the International Energy Agency, solar energy is one of the cleanest and cheapest energy sources. Solar power offers the most affordable electricity and has enormous potential to meet global energy demands [108].
In India, many entities such as Adani Solar, Premier Energies, Vikram Solar, Waaree, and others manufacture high-output modules ranging from 500 to over 600 W. There are efforts to manufacture 640 W monocrystal modules by 2023, which would be a significant achievement [109]. By 2022, India plans to add two million off-grid pumps for irrigation, which will enhance sustainability in agriculture in terms of energy uses [110]. India’s households make up around 9% of India’s installed solar rooftop capacity. India’s government provides approximately 20–40% (depending on the installed capacity in residence) rooftop solar system installation subsidies. In terms of market share, the most preferred technology in the PV market is wafer-based technology. At present, more than 85% of the world PV market is currently based on wafer-based technology, which produces crystalline solar cells (monocrystalline and polycrystalline silicon) [111]. The growth of both types of PV systems (monocrystalline and polycrystalline) is expected to be consistent in post-COVID-19 scenarios. For example, between 2021 and 2026, the global monocrystalline system market share is expected to grow by 5.7%, while the growth in the polycrystalline system market is expected to be 7.5% [112,113].
Further, attempts are being made to adapt parabolic trough systems, one of four concentrating solar power (CSP) technologies, and the most mature CSP technology. Over 500 megawatts (MW) of parabolic trough systems operate worldwide [114]. Recently, China has completed the installation of its largest 100 MW parabolic trough concentrated solar power plant, and it is connected to the grid [115]. Parabolic trough technology is currently the lowest-cost CSP option for electricity production among the various solar energy production technologies. However, considering the abundant supplies of solar power across the world, additional supports from multiple government agencies and institutions toward research and development focusing on improving the efficiencies of the solar energy, reducing the cost, and producing the technologies for recycling the solar cells after the end of life are critically important for the large-scale capability of the solar technologies worldwide.

6. Challenges in Performance Management of PV System

It is well proven that energy from the sun can be converted into various forms of energy such as electricity and heat for human purposes. One of the solar energy’s biggest challenges is the unpredictability and unavailability of solar energy all year round. Therefore, substantial efforts are needed in research to develop improved energy storage systems and efficient and cost-effective solar cells, and identify less expensive and easily available materials for solar cell manufacturing [116]. Considering solar energy is by far the largest exploitable resource, which provides more energy in less than 1 h to the earth than all forms of energy consumed by humans in one year, solar energy and the PV system has the potential to become a primary source of energy to meet our energy demands [117]. Researchers have proposed storing solar energy in the form of chemical bonds, producing oxygen from water, and obtaining a reduced fuel such as hydrogen, methane, methanol, and other hydrocarbons [117], which is yet to be explored.
Currently, most solar energy systems are based on PV cells. Power production in a PV system is affected by many factors, including irradiance, shading, and cloud cover. Both forms of clouds, such as cumuliform clouds (thick and isolated clouds) and low-altitude cumulus fractus clouds (small, fragmented clouds), affect the value of solar irradiance [118]. These clouds pose various problems in generating PV electricity by causing the change in irradiance from steep to mild [118]. Furthermore, these clouds result in various levels of shading (from thin shading to 90% shading), and the highest transitions occur around noon [119]. In addition, the edges of shadows of moving clouds impact the PV performance and power losses. In general, steep irradiance changes occur due to the shadows of fast-moving clouds, affecting solar farms (large PV systems) connected to the grids [119]. When solar farms are connected with the grid, fast fluctuations in the power fed to the grid can cause power quality, balance issues, and power losses. Small-scale solar cell units are particularly affected by the irradiance variability produced by cloud shading, and predictions of clouds passing over the PV are challenging [120].
Based on the International Energy Agency’s report, around 40% of the total installed capacity in 2017 was in the form of decentralized systems. In countries such as Germany, Australia, and Japan, the cumulative power generation values in decentralized systems were higher than the centralized PV systems. Power generation in the small-scale PV system can vary up to 80% within seconds due to shading, resulting in energy losses [121,122]. In practice, both small-scale and large-scale PV systems are affected by clouds; however, larger projects present relatively lower variability, potentially because those projects are well-studied and designed [121,123]. The output of electricity of a PV system mainly depends on the irradiance of the PV panels, and clouds can have substantial impacts on solar energy-based power generation. Not only can cloud decrease irradiance levels, but it can also increase the irradiance on PV systems.
Due to clouds, the actual irradiance can exceed the expected clear sky irradiance (up to 1.5 times), and such a phenomenon is known as clouds enhancement (CE) (i.e., the maximum power of the PV system exceeds the rated power of the inverter, which connects the PV system to the grid [123,124]. This phenomenon is also called over irradiance. The over irradiance is often caused by the strong forward scattering of sunlight [124]. These bursts of solar irradiance are possible at sea level and at high altitudes, and the forward scattering of the sunlight at a narrow-angle can boost the clear-sky irradiance by at least 60% [125]. Due to CE events, power from the PV generator can exceed the inverter’s rated power. A previous study showed that California’s largest lengths of CE events exceeding 1000 W/m2 were multiple kilometers. These results signify that even large utility-scale PV systems could substantially affect CE events [126], and optimal inverter sizing considering CE events is needed [126,127]. The impacts of mismatch and shading on PV modules affect the solar energy yield. The results showed that typical thin-film modules are less sensitive to mismatch than crystalline silicon-based PV systems [128]. Mismatch losses can be significant depending on the size and type of the PV system [129]. Compared to the smaller PV system, mismatching is a bigger issue in larger PV systems, where several PV strings are connected in parallel to increase the power [128]. In general, mismatch losses in PV systems are caused by partial shading, and the largest mismatch losses are caused by sharp shadows [130]. In large PV systems, most shading events are caused by moving clouds, which causes irradiance transitions [129,130,131]. In many developing countries, when PV systems are installed, less emphasis is given to understanding the impacts of mismatching, cloud effects, and associated power losses on the yields of PV systems. Emphasizing these factors and ensuring the availability of climate data in those countries for estimating the optimal PV size and associated accessories will improve the power quality and reduce solar energy losses.

7. Conclusions

This review study was conducted to synthesize the information on the solar energy system and provide an overview of the existing technologies, structures of PV systems, diurnal changes in irradiance behavior, and PV grid systems. We emphasize identifying the ongoing challenges in installing solar energy systems during COVID-19 and the post-COVID-19 revival of growth in solar energy installation. In addition, we described the challenges caused by transitions and cloud enhancement on a smaller and larger PV system. The review is centered around the solar energy growth in India; however, to provide a more holistic approach, we have compared the trends in the growth of solar energy across the world. The results showed that substantial resources for planning and implementing solar-based energy had been allocated in many countries over the past decade, which led to the exponential increase in solar energy production system capacity in developing and developed countries. Currently, the top 12 solar energy-producing countries have installed a solar system with a capacity of over 575 GW. In 2010, India’s solar power installed capacity was 0.16 GW, and it was 40.1 GW in 2021. This 24,962.5% increase in capacity in 10 years indicates that solar-based energy will play a crucial role in meeting India’s electricity demands. One major factor in disseminating solar photovoltaic (PV) systems worldwide was the reduced cost of solar cells. Further, an increase in the efficiency of solar cells assisted solar energy production. Currently, developing countries, including India, have enormous potential for increasing the production of solar-based energy productions. This is particularly true in rural areas, where the cost of a solar system can be less prohibitive, and financial incentives may assist in installing the stand-alone solar system and grid-connected solar system.

Author Contributions

A.P. and P.P. formed the idea and collected data with support from J.S.T. A.P. produced the first draft, and P.P. and J.S.T. critically reviewed and assisted in structuring this manuscript. All authors have read and agreed to the published version of the manuscript.

Funding

This research received no funding.

Institutional Review Board Statement

Not applicable.

Informed Consent Statement

Not applicable.

Data Availability Statement

Not applicable.

Acknowledgments

Not applicable.

Author Disclaimer

The views and opinions of the authors expressed herein do not necessarily state or reflect those of the United States government or any agency thereof. Neither the US government nor any agency thereof, nor any of their employees, makes any warranty, express or implied, or assumes any legal liability or responsibility for the accuracy, completeness, or usefulness of any information, apparatus, product, or process disclosed, or represents that is use would not infringe privately owned rights. References herein to any specific commercial product, process, or service by trade name, trademark, manufacturer, or otherwise, does not necessarily constitute or imply its endorsement, recommendation, or favoring by the US government or any agency thereof. The views and opinions of authors expressed herein do not necessarily state or reflect those of the US government or any agency thereof. Accordingly, the publisher, by accepting the article for publication, acknowledges that the U.S. government retains a nonexclusive, paid-up, irrevocable, worldwide license to publish or reproduce the published form of this manuscript or allow others to do so for U.S. government purposes.

Conflicts of Interest

The author declares no conflict of interest.

Nomenclature

Symbols Used for
PVphotovoltaic
KWhkilowatt-hour
GWGigawatts
PTCparabolic trough collector
CSPconcentrated solar power
SPTSolar power tower
CdTECadmium telluride
CPVconcentrator photovoltaics
SiO2Silicon dioxide
ACalternating current
DCdirect current

References

  1. Top 17 Solar Panel Manufacturers in India. 2021. Available online: https://www.solarfeeds.com/mag/top-solar-panel-manufacturers-in-india (accessed on 28 September 2021).
  2. Khare Saxena, A.; Saxena, S.; Sudhakar, K. Solar energy policy of India: An overview. CSEE J. Power Energy Syst. 2020, 1, 1–32. [Google Scholar] [CrossRef]
  3. Solangi, K.H.; Islam, M.R.; Saidur, R.; Rahim, N.A.; Fayaz, H. A review on global solar energy policy. Renew. Sustain. Energy Rev. 2011, 15, 2136–2149. [Google Scholar] [CrossRef]
  4. Sharma, N.K.; Tiwari, P.K.; Sood, Y.R. Solar energy in India: Strategies, policies, perspectives and future potential. Renew. Sustain. Energy Rev. 2012, 16, 933–941. [Google Scholar] [CrossRef]
  5. Irfan, M.; Zhao, Z.Y.; Ikram, M.; Gilal, N.G.; Li, H.; Rehman, A. Assessment of India’s energy dynamics: Prospects of solar energy. J. Renew. Sustain. Energy 2020, 12, 1–17. [Google Scholar] [CrossRef]
  6. Mishra, T.; Rabha, A.; Kumar, U.; Arunachalam, K.; Sridhar, V. Assessment of solar power potential in a hill state of India using remote sensing and Geographic Information System. Remote Sens. Appl. Soc. Environ. 2020, 19, 100370. [Google Scholar] [CrossRef]
  7. Dixit, S. Solar technologies and their implementations: A review. Mater. Today Proc. 2020, 28, 2137–2148. [Google Scholar] [CrossRef]
  8. Bulut, U.; Menegaki, A. Solar energy-economic growth nexus in top 10 countries with the highest installed capacity. Energy Sources Part B Econ. Plan. Policy 2020, 15, 297–310. [Google Scholar] [CrossRef]
  9. Solar Energy. Country Rankings (irena.org). Available online: https://irena.org/Statistics/View-Data-by-Topic/Capacity-and-Generation/Country-Rankings (accessed on 28 September 2021).
  10. Photovoltaic Capacity Increased to 505 GW- Evwind. Available online: https://www.evwind.es/2019/06/21/photovoltaic-cumulative-capacity-increased-approximately-25-to-at-least-505-gw/67686 (accessed on 28 September 2021).
  11. IEA PVPS, Snapshot of Global PV Markets 2020, op. cit. note 1, p. 14. Based on Cumulative Capacity in Operation at end-2019 and Assumes Close to Optimum Siting, Orientation and Long-Term Average Weather Conditions. Available online: https://www.ren21.net/gsr-2020/#target_10_5 (accessed on 12 August 2021).
  12. Jebasingh, V.K.; Herbert, G.J. A review of solar parabolic trough collector. Renew. Sustain. Energy Rev. 2016, 54, 1085–1091. [Google Scholar] [CrossRef]
  13. Jebasingh, V.K.; Divya, J.J.; Arunkumar, T. Performance study on eutectic molten salt as a high temperature working fluid in the parabolic trough collector. Int. J. Ambient Energy 2019, 1–5. [Google Scholar] [CrossRef]
  14. Jebasingh, V.K.; Divya, J.J.; Arunkumar, T. Assessment of circular and elliptical absorber tube in solar parabolic trough collector. Int. J. Ambient Energy 2019, 1–6. [Google Scholar] [CrossRef]
  15. Upadhyay, B.H.; Patel, A.J.; Ramana, P.V. A detailed review on solar parabolic trough collect. J. Ambient Energy 2019, 1–21. [Google Scholar] [CrossRef]
  16. Aseri, T.K.; Sharma, C.; Kandpal, T.C. Cost reduction potential in parabolic trough collector based CSP plants: A case study for India. Renew. Sustain. Energy Rev. 2021, 138, 110658. [Google Scholar] [CrossRef]
  17. Energy, B. Renewables 2017 Global Status Report. Renewable Energy Policy Network for the 21st Century. Paris: REN21. 2016. Available online: https://www.ren21.net/wp-content/uploads/2019/05/GSR2017_Full-Report_English.pdf (accessed on 8 November 2021).
  18. Fuqiang, W.; Ziming, C.; Jianyu, T.; Yuan, Y.; Yong, S.; Linhua, L. Progress in concentrated solar power technology with parabolic trough collector system: A comprehensive review. Renew. Sustain. Energy Rev. 2017, 79, 1314–1328. [Google Scholar] [CrossRef]
  19. Awan, A.B.; Khan, M.N.; Zubair, M.; Bellos, E. Commercial parabolic trough CSP plants: Research trends and technological advancements. Sol. Energy 2020, 211, 1422–1458. [Google Scholar] [CrossRef]
  20. Solar PACES. CSP Projects around the World. 2019. Available online: https://www.solarpaces.org/csp-technologies/csp-projects-around-the-world (accessed on 12 May 2021).
  21. IRENA, Statistics, International Renewable Energy Agency. 2020. Available online: https://www.irena.org/Statistics (accessed on 28 September 2021).
  22. Elbeh, M.B.; Sleiti, A.K. Analysis and optimization of concentrated solar power plant for application in arid climate. Energy Sci. Eng. 2021, 9, 1–14. [Google Scholar] [CrossRef]
  23. Kumar, A.; Prakash, O.; Dube, A. A review on progress of concentrated solar power in India. Renew. Sustain. Energy Rev. 2017, 79, 304–307. [Google Scholar] [CrossRef]
  24. Mills, D. Advances in solar thermal electricity technology. Sol. Energy 2004, 76, 19–31. [Google Scholar] [CrossRef]
  25. Sharma, A. A comprehensive study of solar power in India and World. Renew. Sustain. Energy Rev. 2011, 15, 1767–1776. [Google Scholar] [CrossRef]
  26. Wang, K.; Li, M.J.; Zhang, Z.D.; Min, C.H.; Li, P. Evaluation of alternative eutectic salt as heat transfer fluid for solar power tower coupling a supercritical CO2 Brayton cycle from the viewpoint of system-level analysis. J. Clean. Prod. 2021, 279, 123472. [Google Scholar] [CrossRef]
  27. Yagli, H. Examining the receiver heat loss, parametric optimization and exergy analysis of a solar power tower (SPT) system. Energy Sources Part A Recovery Util. Environ. Eff. 2020, 42, 2155–2180. [Google Scholar] [CrossRef]
  28. Hamanah, W.M.; Salem, A.; Abido, M.A.; Qwbaiban, A.M.; Habetler, T.G. Solar Power Tower Drives: A Comprehensive Survey. IEEE Access 2021. [CrossRef]
  29. Ivanpah, World’s Largest Solar Plant in California Desert. Available online: http://www.brightsourceenergy.com/ivanpah-solar-project#.YXDSEBrMKUk (accessed on 29 September 2021).
  30. Noor Ouarzazate Solar Complex, Morocco-Power Technology. Available online: https://www.power-technology.com/projects/noor-ouarzazate-solar-complex (accessed on 29 September 2021).
  31. Megalim Solar Power-The Technology—Wix.com. Available online: https://megalimsolar.wixsite.com/megalim-solar-power/the-technology (accessed on 29 September 2021).
  32. Solar Photovoltaic Cell Basics, Department of Energy. Available online: https://www.energy.gov/eere/solar/solar-photovoltaic-cell-basics (accessed on 29 September 2021).
  33. Solar Cell Efficiency-PVEducation. Available online: https://www.pveducation.org/pvcdrom/solar-cell-operation/solar-cell-efficiency (accessed on 29 September 2021).
  34. Solar Performance and Efficiency, Department of Energy. Available online: https://www.energy.gov/eere/solar/solar-performance-and-efficiency (accessed on 29 September 2021).
  35. Photovoltaic cell-Energy Education. Available online: https://energyeducation.ca/encyclopedia/Photovoltaic_cell (accessed on 29 September 2021).
  36. Stevenson, R. Slimmer solar cells. Ingenia 2014, 53, 33–37. [Google Scholar]
  37. Zhang, H.L.; Van, G.T.; Baeyens, J.; Degrève, J. Photovoltaics: Reviewing the European feed-in-tariffs and changing PV efficiencies and costs. Sci. World J. 2014, 2014. [Google Scholar] [CrossRef] [PubMed]
  38. How a Solar Cell Works-American Chemical Society How a Solar Cell Works—American Chemical Society. Available online: acs.org (accessed on 30 September 2021).
  39. Patel, M.R. Solar Photovoltaic Power System. In Wind and Solar Power Systems; CRC Press LLC.: Boca Raton, FL, USA, 1999; pp. 138–157. [Google Scholar]
  40. Cell, Modules and Arrays—FSEC Energy Research Center Cells, Modules, and Arrays. Available online: https://energyresearch.ucf.edu/consumer/solar-technologies/solar-electricity-basics/cells-modules-panels-and-arrays/ (accessed on 30 September 2021).
  41. Crabtree, G.W.; Lewis, N.S. Solar energy conversion. Phys. Today 2007, 60, 37–42. [Google Scholar] [CrossRef]
  42. Solar Module—Definition, Solar Terms, Sunrun. Available online: https://www.sunrun.com/go-solar-center/solar-terms/definition/solar-module (accessed on 30 September 2021).
  43. Solar PV Modules. Available online: https://www.solardirect.com/archives/pv/pvlist/pvlist.htm (accessed on 30 September 2021).
  44. Annual Solar Module Production Worldwide, Statista. Available online: https://www.statista.com/statistics/668764/annual-solar-module-manufacturing-globally (accessed on 30 September 2021).
  45. Top 5 Largest Solar Power Plants of the World, SolarInsure. Available online: https://www.solarinsure.com/largest-solar-power-plants (accessed on 26 September 2021).
  46. With 2245 MW of Commissioned Solar Projects, World’s Largest Solar Park is Now at Bhadla. Available online: https://mercomindia.com/world-largest-solar-park-bhadla (accessed on 26 September 2021).
  47. World’s Largest Solar Plant Goes Online in China—PV Magazine. Available online: https://www.pv-magazine.com/2020/10/01/worlds-largest-solar-plant-goes-online-in-china (accessed on 28 September 2021).
  48. Pavagada Solar Park, Karnataka. Available online: https://www.power-technology.com/projects/pavagada-solar-park-karnataka (accessed on 26 September 2021).
  49. Benban Solar Park, Egypt, World’s Biggest Solar Photovoltaic. Available online: https://www.nsenergybusiness.com/projects/benban-solar-park (accessed on 28 September 2021).
  50. The Biggest Solar Power Plants in the World—Power Technology. Available online: https://www.power-technology.com/features/the-worlds-biggest-solar-power-plants (accessed on 28 September 2021).
  51. Noor Abu Dhabi—Emirates Water and Electricity Company. Available online: https://www.ewec.ae/en/power-plants/noor-abu-dhabi (accessed on 28 September 2021).
  52. Mohammed bin Rashid Al Maktoum Solar Park. Available online: http://www.dewa.gov.ae/en/about-us/media-publications/latest-news/2019/03/mohammed-bin-rashid-al-maktoum-solar-park (accessed on 28 September 2021).
  53. World’s Largest Solar Park in Kurnool on the Cusp of Completion. Available online: https://mercomindia.com/worlds-largest-solar-park-kurnool-cusp-completion (accessed on 15 December 2021).
  54. Power Generation Begins at Kunta Ultra Mega Solar Project. Available online: https://www.business-standard.com/article/pti-stories/power-generation-begins-at-kunta-ultra-mega-solar-project-116051001059_1.html (accessed on 15 December 2021).
  55. Solar Energy Overview. Available online: https://mnre.gov.in/solar/current-status (accessed on 27 September 2021).
  56. RUMS Rewa Ultra Mega Solar Ltd. Available online: http://rumsl.mp.gov.in/rumsl-about-us/ (accessed on 26 September 2021).
  57. Kamuthi Solar Power Project. Available online: https://www.wikiwand.com/en/Kamuthi_Solar_Power_Project (accessed on 26 September 2021).
  58. Solar Power Capacity at Charanka Solar Park to Touch 790 MW. Available online: https://www.dnaindia.com/ahmedabad/report-solar-power-capacity-at-charanka-solar-park-to-touch-790-mw-2607133 (accessed on 26 September 2021).
  59. Kadapa Solar Park—CECP–EU. Available online: https://www.cecp-eu.in/resource-center/post/solar-parks-38/solar-parks/kadapa-solar-park (accessed on 15 December 2021).
  60. Welspun Solar MP Project-Neemuch. Available online: https://neemuch.nic.in/en/district-produce/welspun-solar-mp-project (accessed on 26 September 2021).
  61. Solar Photovoltaic Plant Sakri—Federal Foreign Office—The German. Available online: https://india.diplo.de/in-en/themen/sakri/1992864 (accessed on 26 September 2021).
  62. Maharashtra I—SolarArise. Available online: https://www.solararise.com/maharashtra1.html (accessed on 26 September 2021).
  63. Chowdhury, M.S.; Rahman, K.S.; Chowdhury, T.; Nuthammachot, N.; Techato, K.; Akhtaruzzaman, M.; Tiong, S.K.; Sopian, K.; Amin, N. An overview of solar photovoltaic panels’ end-of-life material recycling. Energy Strategy Rev. 2020, 27, 100431. [Google Scholar] [CrossRef]
  64. Xu, Y.; Li, J.; Tan, Q.; Peters, A.L.; Yang, C. Global status of recycling waste solar panels: A review. Waste Manag. 2018, 75, 450–458. [Google Scholar] [CrossRef]
  65. Sica, D.; Malandrino, O.; Supino, S.; Testa, M.; Lucchetti, M.C. Management of end-of-life photovoltaic panels as a step towards a circular economy. Renew. Sustain. Energy Rev. 2018, 82, 2934–2945. [Google Scholar] [CrossRef]
  66. IRENA Renewable Power Generation Costs in 2019. Available online: https://www.irena.org/publications/2020/Jun/Renewable-Power-Costs-in-2019 (accessed on 1 October 2021).
  67. Efficiency of Solar PV, Then, Now and Future Efficiency of Solar PV, Then, Now and Future—Solar Photovoltaic. Available online: lafayette.edu (accessed on 1 October 2021).
  68. Tijjani, J.; Hamza, B.; Igwenagu, S. The Effect of Humidity and Temperature on the Efficiency of Solar Power Panel Output in Dutsin-Ma Local Government Area (LGA), Nigeria. J. Asian Sci. Res. 2020, 10, 1–16. [Google Scholar] [CrossRef] [Green Version]
  69. Average Solar Radiation, PVEducation. Available online: https://www.pveducation.org/pvcdrom/properties-of-sunlight/average-solar-radiation (accessed on 1 October 2021).
  70. Sandelic, M.; Sangwongwanich, A.; Blaabjerg, F. Reliability evaluation of PV systems with integrated battery energy storage systems: Dc-coupled and ac-coupled configurations. Electronics 2019, 8, 1059. [Google Scholar] [CrossRef] [Green Version]
  71. Solar Power’s Greatest Challenge Was Discovered 10 Years Ago. It Looks Like a Duck. Available online: https://www.vox.com/energy-and-environment/2018/3/20/17128478/solar-duck-curve-nrel-researcher (accessed on 1 October 2021).
  72. What Will California Do With Too Much Solar? KQED. Available online: https://www.kqed.org/science/610026/what-will-california-do-with-too-much-solar (accessed on 1 October 2021).
  73. Go Green—California ISO. Available online: http://www.caiso.com/informed/Pages/CleanGrid/default.aspx (accessed on 1 October 2021).
  74. Hollemann, C.; Haase, F.; Rienäcker, M.; Barnscheidt, V.; Krügener, J.; Folchert, N.; Brendel, R.; Richter, S.; Großer, S.; Sauter, E.; et al. Separating the two polarities of the POLO contacts of an 26.1%-efficient IBC solar cell. Sci. Rep. 2020, 10, 1–15. [Google Scholar]
  75. Reduce of Reflection and Recombination Losses by Surface Texturization. Available online: https://www.helmholtz-berlin.de/forschung/oe/se/silizium-photovoltaik/arbeitsgebiete/heteroemittersolarzellen/oberflaechen/oberflaechen11_de.html (accessed on 1 October 2021).
  76. Beaucarne, G.; Choulat, P.; Chan, B.T.; Dekkers, H.; John, J.; Poortmans, J. Etching, texturing and surface decoupling for the next generation of Si solar cells. Photovolt. Int. 2008, 1, 66–71. [Google Scholar]
  77. Richhariya, G.; Kumar, A.; Samsher. Solar Cell Technologies, Photovoltaic Solar Energy Conversion; Gorjian, S., Shukla, A., Eds.; Academic Press: Cambridge, MA, USA, 2020; pp. 27–50. [Google Scholar]
  78. Kitahara, K.; Ishii, T.; Suzuki, J.; Bessyo, T.; Watanabe, N. Characterization of defects and stress in polycrystalline silicon thin films on glass substrates by Raman microscopy. Int. J. Spectrosc. 2011, 632139, 14. [Google Scholar] [CrossRef] [Green Version]
  79. Monocrystalline Solar Panel: Solar Cells That Have Longevity Up to 30 Years. Available online: https://economictimes.indiatimes.com/small-biz/productline/power-generation/monocrystalline-solar-panel-solar-cells-that-have-longevity-up-to-30-years/articleshow/69140542.cms?from=mdr (accessed on 2 October 2021).
  80. Russell, H.P. Solar Photovoltaic Systems. In Solar Energy, Photovoltaics and Domestic Hot Water, 1st ed.; Russell, H.P., Ed.; Academic Press: Cambridge, MA, USA, 2014; pp. 75–92. ISBN 9780124201552. [Google Scholar]
  81. Polycrystalline Solar Panels: Cheap Yet Efficient Long Lasting Solar Panels. Available online: https://economictimes.indiatimes.com/small-biz/productline/power-generation/polycrystalline-solar-panels-cheap-yet-efficient-long-lasting-solar-panels/articleshow/69130611.cms?from=mdr (accessed on 3 October 2021).
  82. Monocrystalline vs Polycrystalline Solar Panels. Available online: https://ases.org/monocrystalline-vs-polycrystalline-solar-panels (accessed on 2 October 2021).
  83. Mughal, S.; Sood, Y.R.; Jarial, R.K. A review on solar photovoltaic technology and future trends. Int. J. Sci. Res. Comput. Sci. Eng. Inf. Technol. 2018, 4, 227–235. [Google Scholar]
  84. Wen, C.; Yang, Y.J.; Ma, Y.J.; Shi, Z.Q.; Wang, Z.J.; Mo, J.; Li, T.C.; Li, X.H.; Hu, S.F.; Yang, W.B. Sulfur-hyperdoped silicon nanocrystalline layer prepared on polycrystalline silicon solar cell substrate by thin film deposition and nanosecond-pulsed laser irradiation. Appl. Surf. Sci. 2019, 476, 49–60. [Google Scholar] [CrossRef]
  85. Solar Energy Market to Reach 224 Billion With A CAGR of 20.5%—Growth Market Reports. Available online: https://www.prnewswire.com/news-releases/solar-energy-market-to-reach-224-billion-with-a-cagr-of-20-5---growth-market-reports-301272673.html (accessed on 3 October 2021).
  86. Ali, W.; Farooq, H.; Rehman, A.U.; Awais, Q.; Jamil, M.; Noman, A. Design considerations of stand-alone solar photovoltaic systems. In Proceedings of the 2018 International Conference on Computing, Electronic and Electrical Engineering (ICE Cube), Quetta, Pakistan, 12–13 November 2018; pp. 1–6. [Google Scholar]
  87. Awasthi, A.; Shukla, A.K.; Murali Manohar, S.R.; Dondariya, C.; Shukla, K.N.; Porwal, D.; Richhariya, G. Review on sun tracking technology in solar PV system. Energy Rep. 2020, 6, 392–405. [Google Scholar] [CrossRef]
  88. Martínez, R.; Bolea, Y.; Grau, A.; Martínez, H. LPV model for PV cells and fractional control of DC/DC converter for photovoltaic systems. In Proceedings of the 2011 IEEE International Symposium on Industrial Electronics, Gdansk, Poland, 27–30 June 2011; pp. 1069–1074. [Google Scholar]
  89. Apollo Power Systems Solar Rooftop Solutions, Apollo Power Pvt Ltd. Available online: apollopowersystems.com (accessed on 3 October 2021).
  90. Types of Solar PV Power Supply Systems-Learning Electrical Engineering. Available online: https://www.electricalengineeringtoolbox.com/2019/11/types-of-solar-pv-power-supply-systems.html (accessed on 3 October 2021).
  91. World Now Has 583.5 GW of Operational PV. Available online: https://www.pv-magazine.com/2020/04/06/world-now-has-583-5-gw-of-operational-pv (accessed on 3 October 2021).
  92. Physical Progress (Achievements), Ministry of New and Renewable Energy|Government of India. mnre.gov.in. Available online: https://mnre.gov.in/the-ministry/physical-progress (accessed on 14 September 2019).
  93. IEA. Renewable Energy Market Update. IEA, Paris. 2020. Available online: https://www.iea.org/reports/renewable-energy-market-update (accessed on 5 December 2021).
  94. Nekouaslazadeh, A. Recycling Waste Solar Panels (c-Si & CdTe) in Sweden [Dissertation]. 2021. Available online: http://urn.kb.se/resolve?urn=urn:nbn:se:lnu:diva-105045 (accessed on 12 August 2021).
  95. Jain, S.; Sharma, T.; Gupta, A.K. End-of-life management of solar PV waste in India: Situation analysis and proposed policy framework. Renew. Sustain. Energy Rev. 2022, 153, 111774. [Google Scholar] [CrossRef]
  96. Sciuto, G.L.; Capizzi, G.; Salvatore, C.O.C.O.; Shikler, R. Geometric shape optimization of organic solar cells for efficiency enhancement by neural networks. In Advances on Mechanics, Design Engineering and Manufacturing; Springer: Cham, Switzerland, 2017; pp. 789–796. [Google Scholar]
  97. Capizzi, G.; Lo Sciuto, G.; Napoli, C.; Shikler, R.; Woźniak, M. Optimizing the organic solar cell manufacturing process by means of AFM measurements and neural networks. Energies 2018, 11, 1221. [Google Scholar] [CrossRef] [Green Version]
  98. Tian, X.; Stranks, S.D.; You, F. Life cycle assessment of recycling strategies for perovskite photovoltaic modules. Nat. Sustain. 2021, 4, 821–829. [Google Scholar] [CrossRef]
  99. Gautam, A.; Shankar, R.; Virat, P. End-of-life solar photovoltaic e-waste assessment in India: A step towards a circular economy. Sustain. Prod. Consum. 2021, 26, 65–77. [Google Scholar] [CrossRef]
  100. Binek, A.; Petrus, M.L.; Huber, N.; Bristow, H.; Hu, Y.; Bein, T.; Docampo, P. Recycling perovskite solar cells to avoid lead waste. ACS Appl. Mater. Interfaces 2016, 8, 12881–12886. [Google Scholar] [CrossRef] [PubMed] [Green Version]
  101. Yousef, S.; Tatariants, M.; Denafas, J.; Makarevicius, V.; Lukošiūtė, S.I.; Kruopienė, J. Sustainable industrial technology for recovery of Al nanocrystals, Si micro-particles and Ag from solar cell wafer production waste. Sol. Energy Mater. Sol. Cells 2019, 191, 493–501. [Google Scholar] [CrossRef]
  102. Goel, M. Solar rooftop in India: Policies, challenges and outlook. Green Energy Environ. 2016, 1, 129–137. [Google Scholar] [CrossRef] [Green Version]
  103. Mantri, S.R.; Kasibhatla, R.S.; Chennapragada, V.K.B. Grid-connected vs. off-grid solar water pumping systems for agriculture in India: A comparative study. Energy Sources Part A Recovery Util. Environ. Eff. 2020, 1–15. [Google Scholar] [CrossRef]
  104. Sadhu, M.; Chakraborty, S.; Das, N.; Sadhu, P.K. Role of solar power in sustainable development of India. TELKOMNIKA Indones. J. Electr. Eng. 2015, 14, 34–41. [Google Scholar] [CrossRef]
  105. Global Energy Review. 2021. Available online: https://www.iea.org/reports/global-energy-review-2021/renewables (accessed on 5 December 2021).
  106. PV Magazine. 2021. Available online: https://www.pv-magazine.com/2021/10/28/india-added-8-8-gw-of-solar-in-first-nine-months-of-2021 (accessed on 5 December 2021).
  107. Reilly, J.M.; Chen, Y.H.H.; Jacoby, H.D. The COVID-19 effect on the Paris agreement. Humanit. Soc. Sci. Commun. 2021, 8, 1–4. [Google Scholar] [CrossRef]
  108. A Brief Guide on Renewable Energy. A Brief Guide to Renewables, UNFCCC. 2021. Available online: https://globalchange.mit.edu/publication/17556 (accessed on 5 December 2021).
  109. PV Magazine. 2021. Available online: https://www.pv-magazine.com/2021/09/20/indian-solar-manufacturers-go-big-on-high-output-modules (accessed on 5 December 2021).
  110. Solar Irrigation in India. 2021. Available online: https://www.downtoearth.org.in/blog/energy/solar-irrigation-can-transform-indian-agriculture-enhance-livelihoods-of-small-to-marginal-farmers-77608 (accessed on 5 December 2021).
  111. Sahoo, S.K.; Manoharan, B.; Sivakumar, N. Introduction: Why perovskite and perovskite solar cells? In Perovskite Photovoltaics; Academic Press: Cambridge, MA, USA, 2018; pp. 1–24. [Google Scholar]
  112. Global Monocrystalline Solar Cells. 2021. Available online: https://www.databridgemarketresearch.com/reports/global-monocrystalline-solar-cell-mono-si-market (accessed on 5 December 2021).
  113. Polaris. 2021. Available online: https://www.polarismarketresearch.com/industry-analysis/polysilicon-market (accessed on 5 December 2021).
  114. Parabolic trough. Energy Gov. 2021. Available online: https://www.energy.gov/eere/solar/parabolic-trough (accessed on 5 December 2021).
  115. Reve. 2021. Available online: https://www.evwind.es/2020/01/21/china-largest-100-mw-parabolic-trough-concentrated-solar-power-plant-connected-to-the-grid/73162 (accessed on 5 December 2021).
  116. Hayat, M.B.; Ali, D.; Monyake, K.C.; Alagha, L.; Ahmed, N. Solar energy—A look into power generation, challenges, and a solar-powered future. Int. J. Energy Res. 2019, 43, 1049–1067. [Google Scholar] [CrossRef]
  117. Palacios, A.; Barreneche, C.; Navarro, M.E.; Ding, Y. Thermal energy storage technologies for concentrated solar power–A review from a materials perspective. Renew. Energy 2020, 156, 1244–1265. [Google Scholar] [CrossRef]
  118. Lewis, N.S.; Nocera, D.G. Powering the planet: Chemical challenges in solar energy utilization. Proc. Natl. Acad. Sci. USA 2006, 103, 15729–15735. [Google Scholar] [CrossRef] [Green Version]
  119. Tomson, T. Transient processes of solar radiation. Theor. Appl. Climatol. 2013, 112, 403–408. [Google Scholar] [CrossRef]
  120. Tomson, T.; Hansen, M. Dynamic properties of clouds Cumulus humilis and Cumulus fractus extracted by solar radiation measurements. Theor. Appl. Climatol. 2011, 106, 171–177. [Google Scholar] [CrossRef]
  121. Lappalainen, K.; Valkealahti, S. Recognition and modeling of irradiance transitions caused by moving clouds. Sol. Energy 2015, 112, 55–67. [Google Scholar] [CrossRef]
  122. Espinosa-Gavira, M.J.; Agüera-Pérez, A.; Palomares-Salas, J.C.; González-de-la-Rosa, J.J.; Sierra-Fernández, J.M.; Florencias-Oliveros, O. Cloud motion estimation from small-scale irradiance sensor networks: General analysis and proposal of a new method. Sol. Energy 2020, 202, 276–293. [Google Scholar] [CrossRef]
  123. Scolari, E.; Sossan, F.; Paolone, M. Irradiance prediction intervals for PV stochastic generation in microgrid applications. Sol. Energy 2016, 139, 116–129. [Google Scholar] [CrossRef]
  124. Järvelä, M.; Lappalainen, K.; Valkealahti, S. Characteristics of the cloud enhancement phenomenon and PV power plants. Sol. Energy 2020, 196, 137–145. [Google Scholar] [CrossRef]
  125. Yordanov, G.H.; Saetre, T.O.; Midtgård, O.M. Extreme over irradiance events in Norway: 1.6 suns measured close to 60 N. Sol. Energy 2015, 115, 68–73. [Google Scholar]
  126. Emck, P.; Richter, M. An upper threshold of enhanced global shortwave irradiance in the troposphere derived from field measurements in tropical mountains. J. Appl. Meteorol. Climatol. 2008, 47, 2828–2845. [Google Scholar] [CrossRef]
  127. Lappalainen, K.; Kleissl, J. Analysis of the cloud enhancement phenomenon and its effects on photovoltaic generators based on cloud speed sensor measurements. J. Renew. Sustain. Energy 2020, 12, 043502. [Google Scholar] [CrossRef]
  128. Luoma, J.; Kleissl, J.; Murray, K. Optimal inverter sizing considering cloud enhancement. Sol. Energy 2012, 86, 421–429. [Google Scholar] [CrossRef]
  129. Wurster, T.S.; Schubert, M.B. Mismatch loss in photovoltaic systems. Sol. Energy 2014, 105, 505–511. [Google Scholar] [CrossRef]
  130. El-Dein, M.S.; Kazerani, M.; Salama, M.M. An optimal total cross-tied interconnection for reducing mismatch losses in photovoltaic arrays. IEEE Trans. Sustain. Energy 2012, 1, 99–107. [Google Scholar]
  131. Lappalainen, K.; Valkealahti, S. Effects of PV array layout, electrical configuration and geographic orientation on mismatch losses caused by moving clouds. Sol. Energy 2017, 144, 548–555. [Google Scholar] [CrossRef]
Figure 1. (A) growth of solar energy installed capacity in India between 2010 and 2021 [1]; (B) top ten countries with the highest installed capacity [2,3]; (C) relative growth of solar energy installed capacity among top solar energy-producing countries between 2008 and 2018 [9,10]; and (D) total change solar energy installed capacity in the world between 2009 and 2019 [9,10].
Energies 15 00500 g001aEnergies 15 00500 g001b
Figure 2. (A) Parabolic-trough solar concentrator [12,13]; (B) Parabolic dish collector [23,24]; (C) Solar power tower system [25]; (D) Schematic diagram of solar cell [32,33]; (E) A solar cell n-type and p-type layers [35,36,37]; and (F) Schematic of solar cell, module, panel, and array systems [39,40,41].
Energies 15 00500 g002aEnergies 15 00500 g002bEnergies 15 00500 g002c
Figure 3. (A) Market share of silicon and thin-film solar systems [63]; (B) Changes in crystalline solar cell price between 1976-2020 [66]; (C) Change in PV system efficiency between 1995 and 2020 [65]; and (D) change in PV system capital cost between 1995 and 2020 [67].
Energies 15 00500 g003
Figure 4. (A) Diurnal change in sun intensity [68,69] (B) Solar insulation [68,69]; (C) A typical daily profile of the PV power generation and load demand [70]; (D) Changes in renewable energy production during a day [71,72,73].
Energies 15 00500 g004
Figure 5. (A) Representative images of monocrystalline solar cell structure, scanning electron micrograph, and physical appearance of a monocrystalline solar module [74,75,76]; (B) a typical polycrystalline solar cell, scanning electron micrograph, and physical appearance of a polycrystalline solar module [77,78].
Energies 15 00500 g005
Figure 6. (A) Stand-alone solar PV system [86]; (B) Standalone/off grid PV system [87]; and (C) On-Grid system (solar + grid import and export [88,89]).
Energies 15 00500 g006
Figure 7. (A) Growth of installed capacity between 2009 and 2019; (B) Share percentage among various regions in terms of installed capacity in 2020.
Energies 15 00500 g007
Table 1. Comparison between solar cells and concentrated solar power system.
CSP TechnologiesSolar Cells
Advantages
Renewable, clean, natural energy source.Clean electricity generation without emitting greenhouse gases and environmentally friendly.
Low operating costsLow operating costs
High efficiencyRelatively low efficiency, however, low maintenance, easy installation, produce direct electricity without involving moving parts
Scalable to more than 100 MWBoth small-scale (rooftop) and large-scale can be built and easily scalable.
Disadvantages
Dependent on plentiful direct sunlightDependent on plentiful direct sunlight
Typically high construction and installation costsCost is reduced over time; however, still cost-prohibitive for many rural areas
A large amount of land is neededThe large-scale solar panel requires a substantial amount of land
Table 2. Top solar projects in the world and in India.
Top 12 Solar Power Plants in the World
S. No.Name of Solar Power PlantYear of CommissionCurrent Plant Capacity
1.Huanghe Hydropower Development Solar Park, China [46,47]20202200 MW
2.Bhadla Solar Park, Rajasthan, India [46,47] 20212045 MW
3.Pavagada Solar Park (Shakti Sthala), Karnataka, India [48]20182000 MW
4.Benban Solar Park, Benban Aswan, Egypt [49]20191800 MW
5.Tengger Desert Solar Park, China [50]20171547 MW
6.Noor Abu Dhabi, Sweinhan, Abu Dhabi, UAE [51]20191200 MW
7.Datong Solar Power Top Runner Base, China [50]20161070 MW
8.Mohammed bin Rashid Al Maktoum Solar Park, UAE [52]20201013 MW
9.Kurnool Ultra Mega Solar Park, Andhra Pradesh, India [53]20171000 MW
10.NP Kunta Ultra Mega Solar Park, Andhra Pradesh, India [54]20161000 MW
11.Longyangxia Dam Solar Park, China [50]2015850 MW
12.Villanueva Solar Project, Mexico [54]2018828 MW
Top 12 solar projects in India
1.Bhadla Solar Park, Rajasthan [46,47]20212045 MW
2.Pavagada Solar Park (Shakti Sthala), Karnataka [48]20182000 MW
3.Kurnool Ultra Mega Solar Park, Andhra Pradesh [52]20171000 MW
4.NP Kunta Ultra Mega Solar Park, Andhra Pradesh [53]2021978.5 MW
5.Rewa Ultra Mega Solar, Madhya Pradesh [55]2020750 MW
6.Kamuthi Solar Power Project, Tamil Nadu [56]2016648 MW
7.Charanka Solar Park, Gujarat [57]2012600 MW
8.Kadapa Ultra Mega Solar Park, Andhra Pradesh [58]2019250 MW
9.Welspun Solar MP Project, Madhya Pradesh [59]2014151 MW
10.Sakri Solar Plant, Maharashtra [60]2013125 MW
11.Maharashtra I Solar Plant, Maharashtra [61]201767.2 MW
12.Bitta Solar Power Plant, Gujarat [62]201140 MW
Table 3. Comparison among various sources used for grid-based electricity.
Thermal PowerHydroelectric PowerNuclear PowerSolar Power
Works on Modified Rankine Cycle.The potential energy of water is converted to kinetic energyThermonuclear fission.Sun energy is converted to electric and thermal energy
Need a large spaceNeed a large amount of waterRequires relatively less spaceRelatively large space is needed
Coal as a fuel is usedWater as a fuel is usedUranium (U235) and other radioactive metals.Sun energy
The overall efficiency
of 30–32%
The overall efficiency of 85% to 90%Efficiency is about 55%Solar panels efficiency is about 14–15%
Lower than hydroelectricVery highHighestRelatively low
Maintenance cost highMaintenance cost lowMaintenance cost very highMaintenance cost low
Transmission cost is lowTransmission cost is highTransmission cost is lowTransmission cost is low
Lifetime 30–40 yearsLifetime around 100 yearsLifetime 40–60 yearsLifetime 15–20 years
Air and soil pollutionAffects aquatic life and natural rivers and lakesRadioactive waste disposal is a big issueLess environmental pollution
Table 4. Comparison of solar energy installed capacity among countries on various continents.
Renewable Energy–Solar (Installed Capacity, Gigawatt) (Year Wise)
20102011201220132014201520162017201820192020
US2.05.28.111.816.021.733.041.451.458.973.8
Total North America2.35.79.013.117.924.436.044.957.166.782.8
Total S. and C. America0.10.20.30.50.81.82.75.27.510.815.1
Germany18.025.934.136.737.939.240.742.345.249.053.8
Italy3.613.116.818.218.618.919.319.720.120.921.6
United Kingdom0.11.01.82.95.59.611.912.813.113.313.6
Total Europe30.153.671.781.988.897.5104.7113.5124.4146.3167.8
Total CIS0.00.00.00.00.10.20.20.41.02.33.2
Total Middle East0.10.20.30.50.81.01.52.13.35.56.5
Total Africa0.20.30.30.71.61.93.04.77.18.39.5
China1.03.16.717.728.443.577.8130.8175.0204.6253.8
India0.10.61.01.43.45.49.717.927.134.939.0
Japan3.64.96.412.119.328.638.444.255.561.567.0
Total Asia Pacific7.312.119.839.161.690.6143.2213.6282.5341.0422.6
Total World40.172.0101.4135.7171.6217.5291.3384.5482.9580.8707.5
Publisher’s Note: MDPI stays neutral with regard to jurisdictional claims in published maps and institutional affiliations.

