1. Introduction
Energy demand of our society is rapidly growing together with technological development. The industry of electric vehicles, the increasing number of portable electric devices and the depleting fossil fuel supply continue to pressure the revolutionization of the power-handling capability input of the human race. Focusing on the amelioration of the renewable energy should be the most reasonable method; nevertheless, it brings immediately higher requirements for energy storage, which is one of the most difficult challenges of energy production. The physical boundaries of 21st-century batteries cause limitations to their utilization; for instance, using electric vehicles for long-distance travel may decrease convenience and freedom, such that the traveler is forced to stop to charge in case of critically low battery level. Because of their high energy density and low self-discharge, lithium-ion batteries are widely used in applications requiring light-weight batteries.
1.1. Thermal Effects
It is widely known that the performance of lithium-ion batteries slowly degrades during usage [
1]. High temperature has been identified as one of the major sources of increased ageing both during charging and discharging [
2]. Therefore, the temperature of batteries is closely monitored and controlled during their entire operation cycle (i.e., during charging and discharging) in modern battery management systems. The main role of a battery thermal management system is to keep the battery pack working in a proper temperature range. The system not only significantly affects the battery pack system performance but is also vital for the safety and stability. The advantages and disadvantages of various multi-physical battery thermal management systems are summarized in the work [
3]. Cooling is an important tool for battery thermal management, Ref. [
4] proposes a combined air and phase change material-based cooling system for lithium-ion batteries.
1.2. Optimal and Adaptive Charging
Charging is the critical operational step of a battery that can be and must be performed in an optimal way; therefore, a huge literature is available on various charging strategies and methods, see, e.g., [
5] for a review.
It is well known that fast charging is a preferred way of charging batteries, but it causes an increase in battery temperature that results in an undesired degradation of its performance and in an accelerated ageing. The authors of [
6] propose low complexity fast charging strategies for Li-ion battery cells that take into account explicit reference governors.
As the parameters and properties of a battery are changing during its lifetime due to its ageing, the charging methods need to be adapted to the ageing status of the battery. This is commonly done by using parameter estimation methods (see e.g., [
7,
8,
9]) to update the reference model parameters that are used for optimization.
An adaptive multistage constant current-constant voltage (MCCCV) strategy for charging electric vehicles in different situations is reported in [
10]. It involves the optimization of the charging current using particle swarm optimization that can satisfy the preference of users for reducing the charging time or the battery degradation.
Fuzzy logic is a widely used solution for the temperature control of battery charge. In [
11], a fuzzy logic control-based temperature feedback control method is presented for the fast charging of Li-ion batteries. The authors of [
12] also propose a fuzzy temperature control based Li-ion battery charger with state of charge estimation. Of course, fuzzy logic control is not the only approach for battery charge control in the literature. The usabilility of model predictive control is proven in [
13], where battery aging has also been taken into consideration in the control aims of a cooling controller.
A fuzzy controlled active state of charge controller is proposed in [
14], where the charging operation mode is extended with a sense operation mode in which the charge controlling fuzzy logic controller is being updated. A fuzzy charge controller is optimized using particle swarm method in the work [
15], where the fitness function of the optimization procedure depends on the charge time and the normalized discharged capacity of the battery. The performance of a temperature controlled fuzzy charge system is evaluated in [
16] and, compared to the conventional constant current-constant voltage method, the proposed charging method reduces 23.2% of the average temperature rise and increases the charge efficiency by 2.06% while maintaining similar charging time.
On the other hand, electrochemical model-based strategies, e.g., [
17], and data-driven methods e.g., [
18] are superior to the simple equivalent circuit type model (ECM) used in this work in terms of model accuracy. Of course, the parameter identification of such models needs to be more sophicticated. The authors of paper [
19] propose a cuckoo search based data driven method for the parameter estimation of pseudo two-dimensional (P2D) battery models.
1.3. Aim of Our Research
To improve the effectiveness of battery usage, this research seeks the optimal parameters for charging a battery as fast as possible without causing damage to it. In this paper we propose a genetic algorithm based optimization of a fuzzy controller that is responsible for the regulation of charging current of a battery charging system. The optimization is regarded to charging time and battery temperature increase during the charging. Of course, these two objectives are against each other, so the aim is to develop a model based flexible charging procedure in which the user can choose between performance charging and gentle charging. Note, that in order to keep the method computationally tractable, the built in battery model is an electrical circuit model.
The structure of the paper is as follows.
Section 2 presents the dynamic state space model of the battery together with the method of the estimation of its parameters that is used for the optimization and control.
Section 3 describes the fuzzy controlled battery system in details, and is followed by
Section 4 dealing with the optimization of this fuzzy controller using a genetic algorithm. In
Section 5 a simulation case study illustrates the performance and properties of the proposed optimized fuzzy battery charging controller. Finally, conclusions are drawn.
2. Modeling and Identification
The parametric lithium-ion battery model, which is an important basis of the methods to be proposed in the sequel is presented here. The model is a modified version of the one used in [
20].
2.1. Modelling Assumptions
The following assumptions were made for the battery model [
21].
The parameters are deduced from the discharge characteristics and assumed to be the same for charging.
The capacity of the battery does not change with the amplitude of the current (no Peukert effect).
The self-discharge of the battery is not represented.
The battery has no memory effect.
No ageing of the battery is assumed.
The voltage and the current can be influenced by the user or the charger device.
2.2. Parametric Battery Model
From the potential modelling methodologies the equivalent electrical circuit type was selected to construct the basic battery model. The selected model was originally developed in [
21], a detailed description of this model without the thermal effects can be found in our previous work [
8].
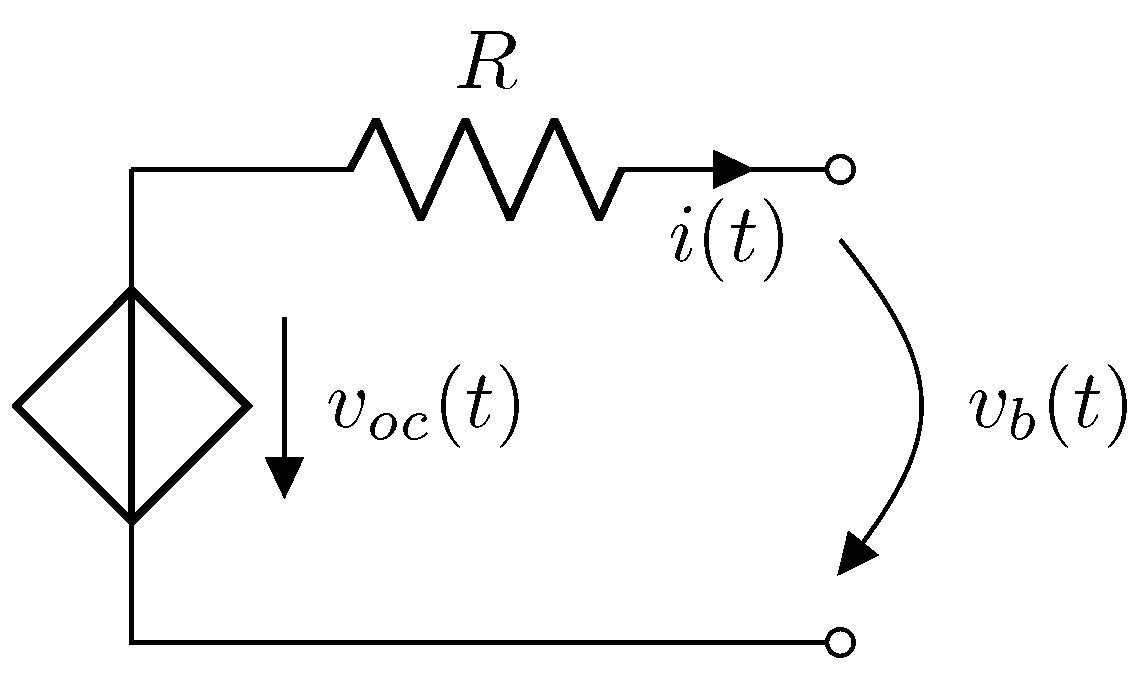
The equivalent electrical circuit of the battery can be seen in
Figure 1.
The input of the model is the battery current (
i) and the output is the battery voltage (
). The open circuit voltage (
) is represented by a controlled voltage source, and it can be different if the battery is charged or discharged before the resting phase [
22]. The open circuit voltage hysteresis can be related to the diffusion that is represented by the second term of Equation (
3).
In this work only the charge model was used because the aim of the work was to develop an optimal charging strategy for lithium-ion batteries. The model described in [
8] was modified to better approximate the behaviour of the battery that was used in the simulations. The state space model of the lithium-ion battery is obtained in the form of Equations (
1)–(
4) as follows.
Output equation:
It can be seen that the output equation is nonlinear.
The state variables have the following meaning:
q is the extracted charge of the battery, i.e., the amount of charge that was used up from the total charge stored in the battery. The initial value of q is denoted by . If the battery is fully charged, it means that that no charge was used from the total amount of charge stored in the battery, therefore . If the battery is fully discharged it means that all of the avaliable charge was used up, therefore .
is the polarization current. It can be computed by applying a low-pass filter to the battery current i, where is the time constant of the filter.
The parameters of the model have the following meaning:
is the constant potential of the electrodes (V)
is the polarization resistance ()
is the polarization coefficient (V/Ah)
Q is the battery capacity (Ah)
A is the exponential voltage (V)
B is the exponential capacity (Ah−1)
R is the internal resistance ()
The output of the model is the battery voltage that can be measured between the battery terminals. It is composed of the open circuit voltage () and the voltage drop across the internal resistance (). The open circuit voltage is the voltage of the battery when no external load is connected to it.
In battery related applications usually the State of Charge (SoC) is used as a state variable instead of the extracted capacity. The SoC is the actual amount of charge in the battery, that is usually expressed in the percentage of the nominal capacity. The SoC can be simply computed from
q with the following equation:
The SoC is 100% when a battery is fully charged and 0% when fully discharged.
2.3. Temperature Dependent Battery Model
The model parameters
depend on the ambient temperature (
) or the battery cell temperature (
). The exact temperature dependency can be described with the following equations [
23]:
The meaning of the variables are the following:
, , , , denote the parameter values at the reference temperature
is the maximum capacity temperature coefficient (Ah/K)
is the reversible voltage temperature coefficient (V/K)
is the Arrhenius rate constant for the internal resistance (K)
is the Arrhenius rate constant for the polarization resistance (K)
is the Arrhenius rate constant for the polarization coefficient (K)
The output voltage of the battery taking into accout the temperature dependency of the parameters can be written by Equation (
11).
It is often experienced that the temperature of the battery changes during the charge process. The battery cell temperature can be modelled by using the following equations [
24].
where
In the above equations the variables have the following meaning:
is the thermal time constant, cell to ambient (s)
is the thermal resistance, cell to ambient (K/W)
is the overall heat generated during charge/discharge (W)
is the power loss difference between charge and discharge (W)
Substituting
into Equation (
12) the change in the battery cell temperature can be expressed. This equation can be added to the battery model as an additional state equation. The complete battery model Equations (
1)–(
13) describes the battery operation taking into account the effect of ambient temperature and self heating.
2.4. Parameter Estimation
The aim of the parameter estimation in this work is to refine the model in parallel with the optimization of the fuzzy controller. In this section the method of parameter estimation is presented.
The temperature dependent battery model of Equations (
1)–(
11) introduced in
Section 2.2 is used for parameter estimation. The parameters to be estimated are the parameter values at the reference temperatures and the temperature coefficients. The parameter vector is given in the following form:
Parameters
A and
B in Equation (
3) can be determined from the typical discharge curve of the battery which is usually provided by the manufacturer [
23]. The parameters in the battery cell temperature Equations (
12) and (
13) (
,
,
) are not estimated, because they are not affected by the temperature.
is usually included in the battery datasheet, while the thermal time constant (
) and the thermal resistance (
) can be determined from a preliminary parameter estimation step, e.g. from the step response of the battery.
The available measured data are the measured current and voltage of the battery, the battery cell temperature and the ambient temperature. It is assumed, that the ambient temperature is constant during the experiment.
Least Squares Parameter Estimation Method
In our case a simple least squares method was chosen from the potential parameter estimation methods to estimate the ten parameters of the battery. The principle of the method is to minimize a quadratic cost function that depends on the parameter vector and measures the deviation between the measured and the estimated output of the model [
25]. In our case the cost function that characterizes the deviation between the measured and the estimated battery voltage is defined in Equation (
14).
where
is the measured value of the battery voltage at the
k-th sample,
is the output of the model in Equation (
11) when the parameters have the values in
, and
n is the total number of samples. This cost function should be minimized in order to find the estimated parameter values of the battery. Because of the nonlinear output equation (Equation (
4)) the cost function is also nonlinear and cannot be minimized analytically. Therefore, numerical optimization methods (such as simplex or gradient method) need to be used to find the local minimum of the cost function. In our case the parameters of the cost function have physical meaning, therefore their typical values and ranges can be known in advance. Utilizing this information, reasonable bounds can be defined for each parameter to restrict the search space during the optimization. Then a suitable constrained nonlinear optimization algorithm can be used to solve the parameter estimation problem.
3. The Fuzzy Controlled Battery Charging System
In order to prevent the battery temperature from being too high, cooling and/or the proper manipulation/control of the charging current is usually applied [
26]. The charging current of the battery is determined by a Fuzzy Logic Controller (FLC) described in this section.
In this work, lithium-ion batteries with 2.3 Ah capacity and 3.3 V nominal voltage were used. The proposed method described in the following sections uses a dynamical model of the battery, so if a different battery is used, only the underlying model and/or its parameters need to be changed.
The following quantities are measured or calculated during the charge cycle:
3.1. The Fuzzy Logic Controller
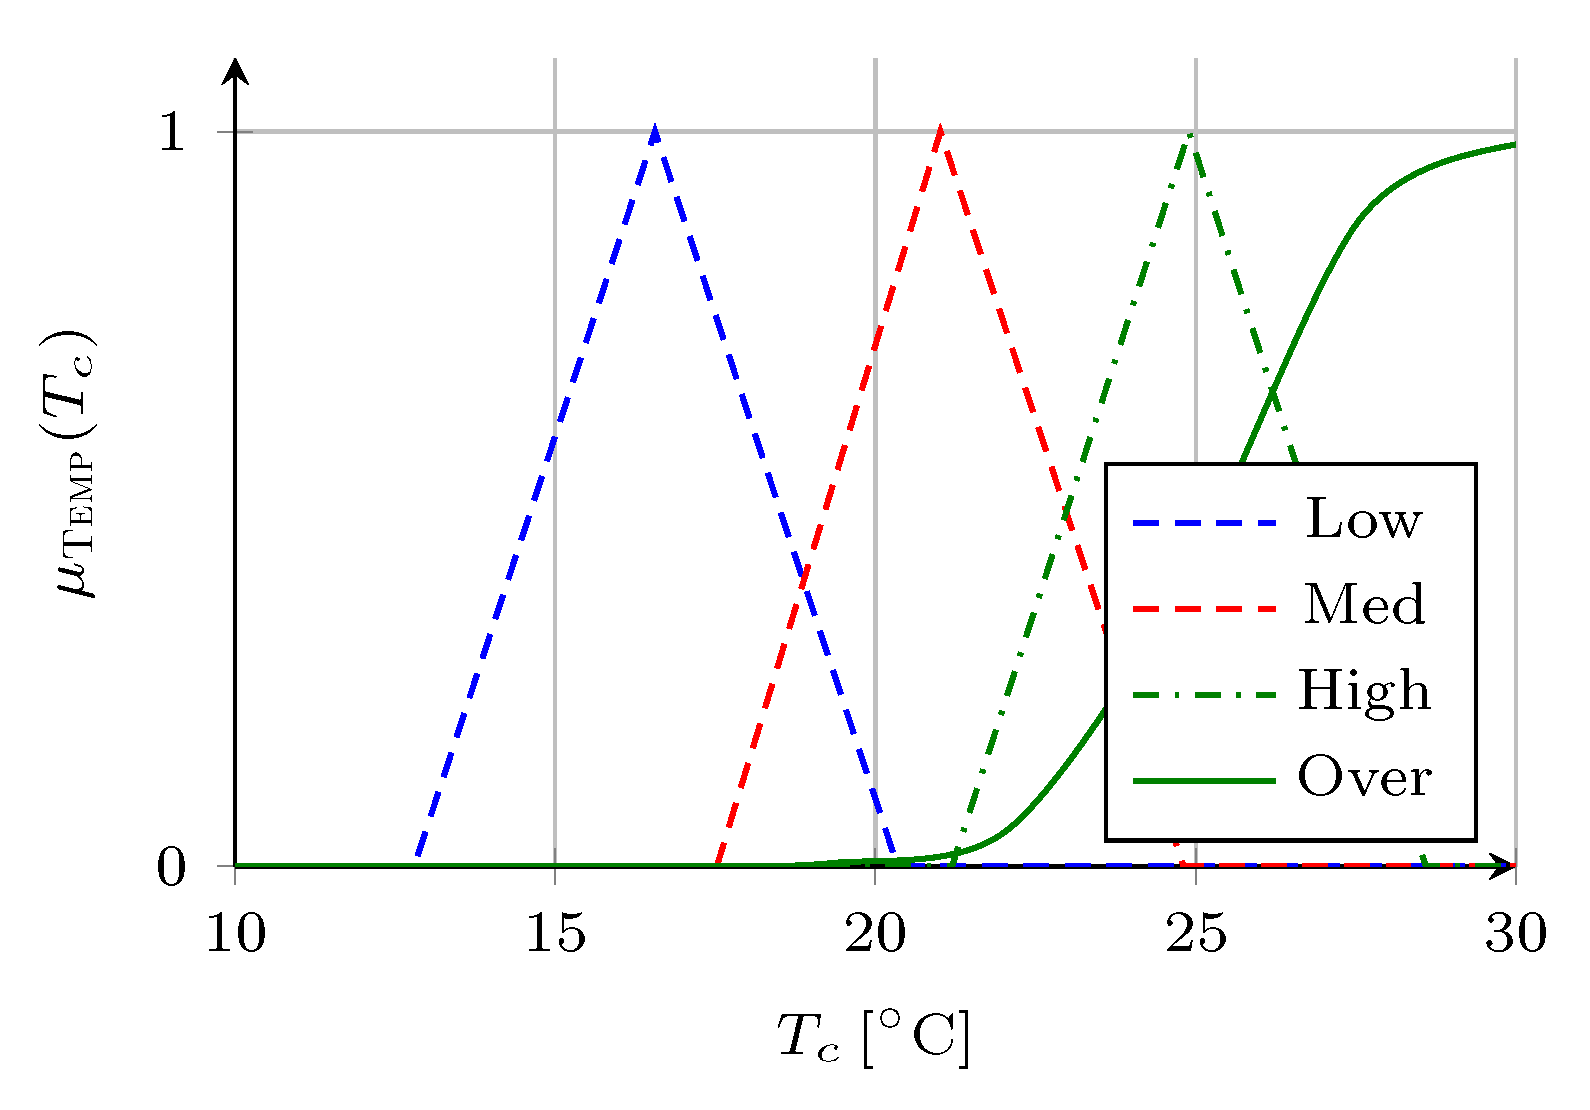
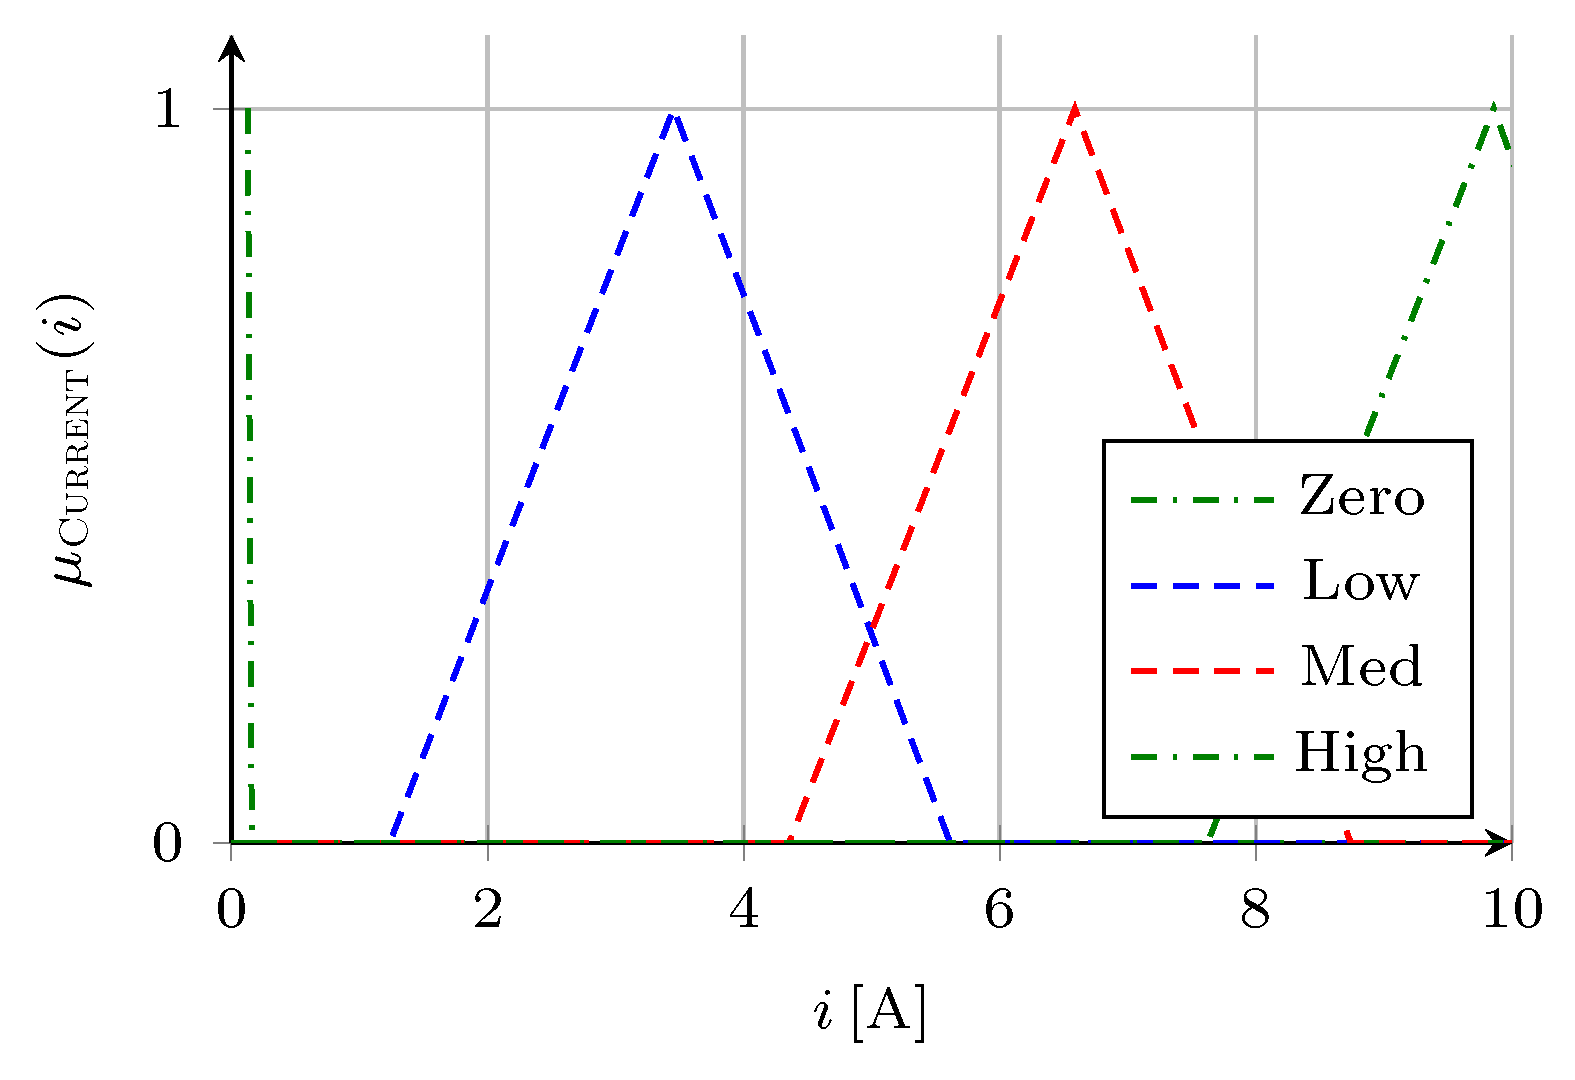
The fuzzy logic controller (FLC) is the basis of the proposed method, its parameters will be optimized using a genetic algorithm. The input linguistic variable of the fuzzy inference system (FIS) is the fuzzified version of the actual cell temperature (
Temp), while the output fuzzy variable is the charging current (
Current). The applied membership functions for the input and output variables of the FLC are depicted in
Figure 2 and
Figure 3.
The FIS is a Mamdani-type inference system [
27] with parameters collected in
Table 1.
The rule base of the FLC consists of four rules summarized in
Table 2.
The current output of the proposed FLC (defuzzified using the Centroid method) determines the actual current value i used for charging the battery.
3.2. Interface to the Genetic Algorithm (GA)
The Fuzzy Logic Controller described above serves as a basic structure for the battery charging. The optimization of the charging system is performed by the GA described in
Section 4 below.
The overall system is practically an optimizer, that finds the optimal FLC according to the objective function that will be defined later (fitness function Equation (
15)). The search space within the set of all Fuzzy Logic Controllers is restricted to the structure (variables, rule base, number of membership functions) of the fuzzy inference system. The optimization variables are the membership functions {Low, Med, High} of the linguistic variables
Temp and
Current.
4. Genetic Algorithm Based Optimization of the Fuzzy Logic Controller
The aim of the optimization is to fine tune the parameters of the Fuzzy Logic Controller presented in
Section 3.1 before. The optimization can be formalized as the minimization of a cost function by modifying the membership functions of the fuzzy variables appearing in the FLC. The optimization is realized as a genetic algorithm [
28] presented here with the following standard ingredients.
4.1. The Basic Ingredients of the Genetic Algorithm
4.1.1. The Fitness Function
The fitness function of an evolutionary genetic algorithm is responsible of the evaluation of each individual in every single generation. The fitness function
y is constructed from the charging time
, and the temperature increase
of the cell according to (
15):
where
is a tuning parameter that can be used for weighting the more important term in the fitness function (smaller
values decrease the importance of
, greater
values decrease the importance of
).
4.1.2. The Genetic Representation of the Solution Space
The individuals of the genetic algorithm are described by their chromosome.
Table 3 contains the details of the chromosome. The genes are the parameters of the membership functions applied in the FLC. The membership function “Over” of the variable
Temp (see
Figure 2) is not involved in the evolution since it is a safety bound not to be modified.
4.1.3. Model Based Simulations
The convergence of the genetic algorithm would be slow if the individuals were charge profiles of the actual real battery. In order to speed up the convergence on the real battery, the individuals of each generation are generated using simulated charging of the dynamical battery model (
1)–(
13)). In each generation the individual with the best fitness value is realized on the actual real battery, i.e., the FLC representing the individual is used during the charge.
The input-output data (
i,
) from the real charge is then being used for estimating the key parameters of the battery model (
1)–(
11). This step makes the method adaptive with respect to small changes in the battery parameters. Note, that parameter changes due to
battery aging could also be tracked by this iterative parameter estimation; however, it is not in the focus of the present work.
4.1.4. The Operation of the Ga as an Optimizer
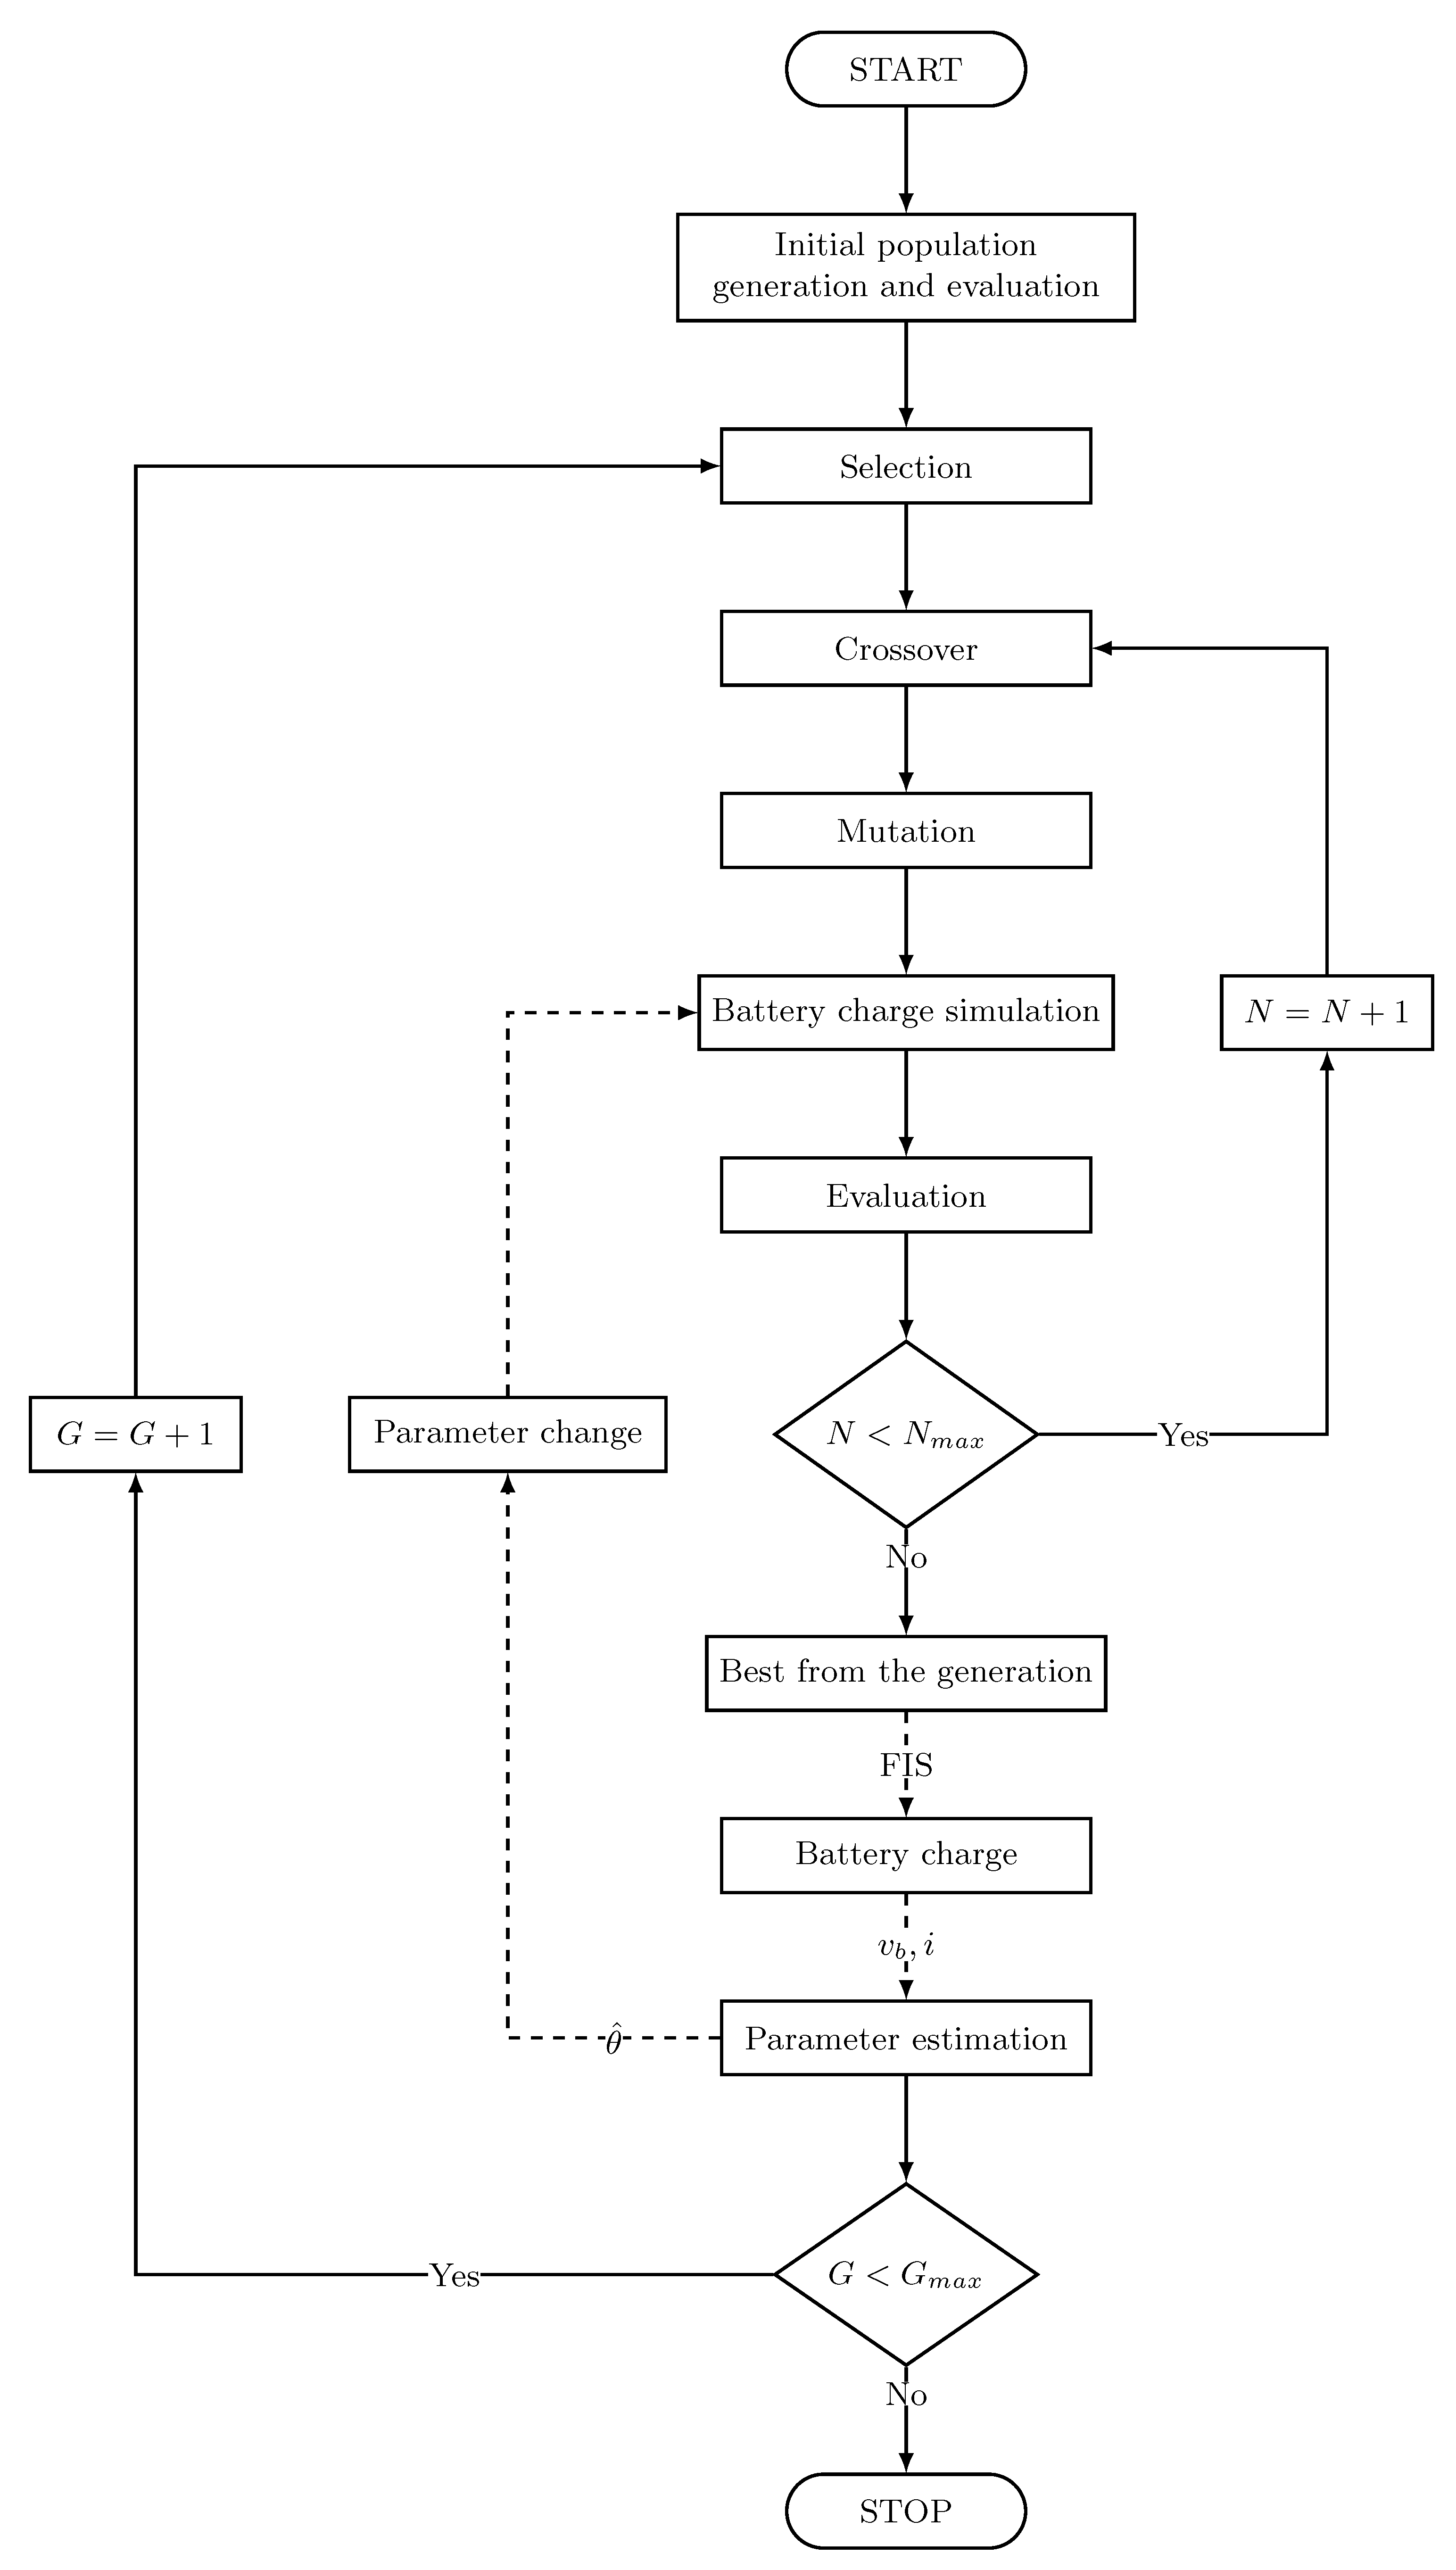
Figure 4 presents the flowchart of the proposed GA that optimizes the parameters of the FLC that is used for charging the battery.
4.2. The Structure and Parameters of the Genetic Algorithm
The initial generation contains a set of individuals derived from a mutual ancestor. The individuals of the initial population correspond to a set of differently tuned fuzzy charge controllers. The FIS-es of the fuzzy controllers differ only in the membership functions belonging to their chromosome (i.e., the ones listed in
Table 3).
4.2.1. Selection
The selection phase is to select the fittest individuals and let them pass their genes to the next generation. It is important to note, that the pool of parents involved in crossover are selected from all generations appeared so far. The parents of the next generation are selected as follows. The individuals of the pool of parents are ordered according to their fitness value and pairs are constructed from the combinations with best fitness value. (The fitness value of a pair is regarded as the sum of the members fitness value.)
In order to increase efficiency, elitism is used to provide a means for reducing the genetic drift. This method ensures that the most fitting solutions (elites) among the candidates for the selection are allowed to transmit their traits in the next generation. This strategy is capable of improving the convergence speed.
In this research, elitism does not affect the engenders of the first generation, but afterwards it reserves places for the best solutions in the following generations.
4.2.2. Crossover
Crossover is a genetic operator used to vary the chromosomes from one generation to the next. Two
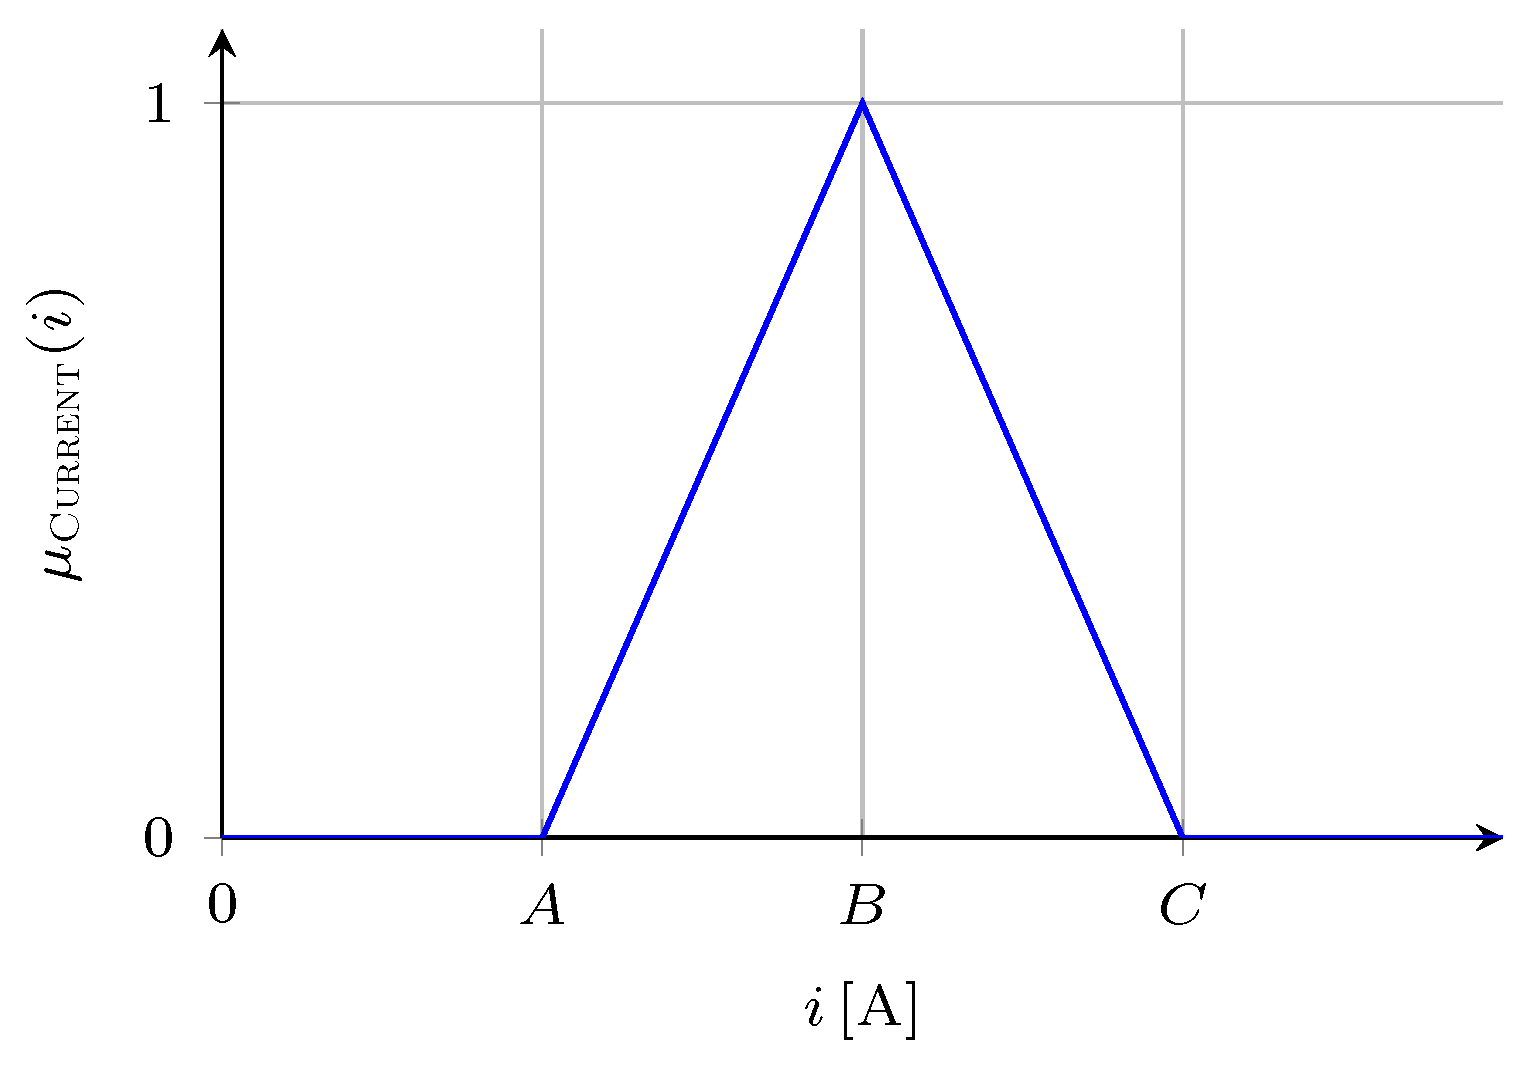
parents are picked from the mating pool to crossover in order to produce superior offspring. Each membership function involved in the evolution is of triangular shape and thus has three parameters determining its form as it is shown in
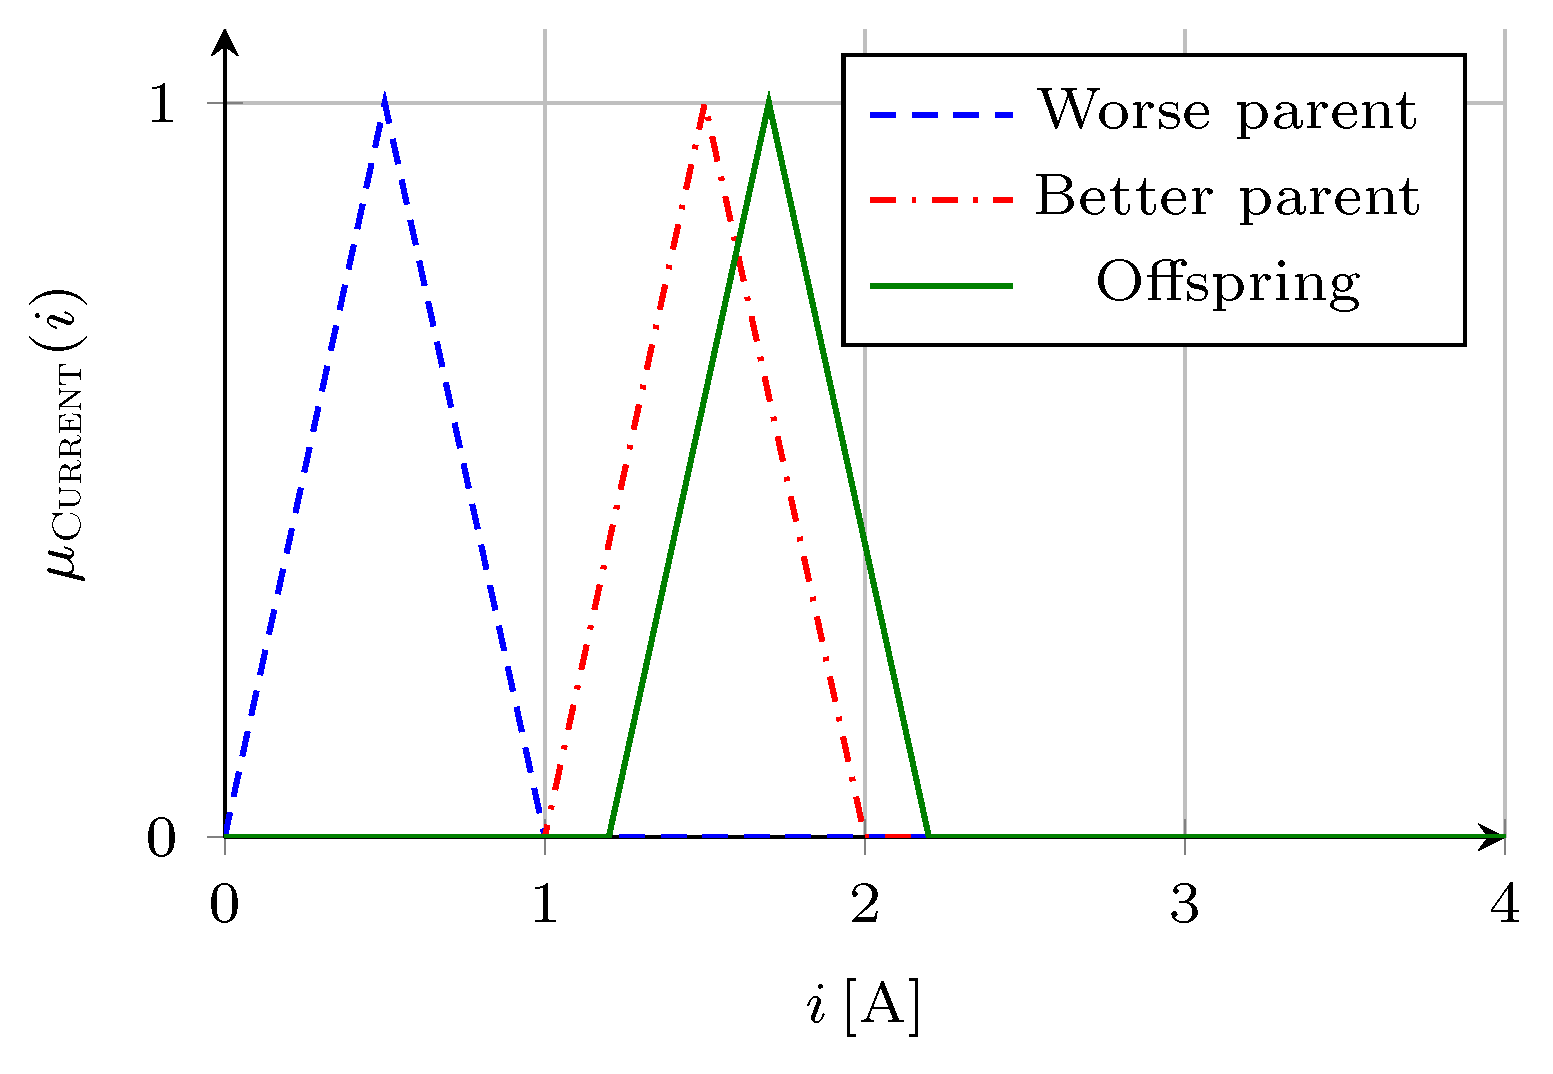
Figure 5. The membership function parameters of the parent FIS-es are going to determine the new offspring FIS. The calculation goes through each parameter of every membership function, and shifting the new functions in the direction of the better parent.
Figure 6 demonstrates the crossover operation on the fuzzy membership functions.
Denote the membership function description vector corresponding to one of the genes of the parents by
and
. Moreover, the fitness value of the two parents are
and
. The vector
of their offspring is calculated by the formula (
16) below:
4.2.3. Mutation
Mutation is a genetic operator used to maintain genetic diversity from one generation of a population to the next. It is analogous to biological mutation. In this study, the mutation was carried out using three different mutation layers. The probability of a mutation changes at different levels. The mutation ratio on the first level is calculated using
deterministic dynamic adaptation, i.e., the chance of the mutation decreases along with the generations.
The mutation operation is applied in three levels as follows
- Level 1
Mutation happens with probability .
- Level 2
This level determines which linguistic variable is involved in the mutation. A nonempty subset of the set of linguistic variables is being selected.
- Level 3
This level chooses which fuzzy set of the linguistic variable(s) selected at Level 2 is affected by the mutation. An element is selected randomly (according to uniform distribution) from the set .
4.3. Estimation of the Simulation Model Parameters
In each generation, the individual with the best fitness value is applied to the actual battery (i.e., the battery is charged operated in closed loop by the FLC with the parameters of the individual with the best fitness value).
Based on the
i,
measurements, the parameters of the battery model (
1)–(
11) are estimated in the simulation model to be used in the next generation. This
makes it possible to update the model parameters from actual measured data and thus follow the ageing process.
5. A Simulation Case Study
The properties and operation of the proposed genetic algorithm based optimization of the fuzzy controlled battery charging system has been investigated using simulation experiments.
For this purpose, models of lithium-ion batteries with 2.3 Ah capacity and 3.3 V nominal voltage were used. The nominal parameters of the selected battery can be seen in
Table 4 [
29]. The reference temperature was 25
C and the ambient temperature was set to 15
C. The initial SoC of the battery was set to 10% and the charge process was terminated when the battery reached 100% SoC.
5.1. Simulation Environment
The lithium-ion battery model and the charging operation is implemented in a simulation environment using Matlab/Simulink [
21,
24]. The charging and the fuzzy logic control system of the battery model runs simultaneously with the genetic algorithm which is responsible for optimizing the attributes of the membership functions of the fuzzy control system by manipulating the parameters that determine the behavior of the fuzzy control system.
The goal of the optimization is to find a finest charge profile for the fuzzy logic control with which it can reach accelerated charge combined with the lowest possible temperature increase; thus, the objective of the GA is defined as minimization.
Besides the tuning of the charging profile, the implementation takes care of parameter estimation using
fmincon algorithm [
30], in order to improve the battery model. The estimator function is called every time a generation is produced, calculating and setting new parameters for the battery model.
5.2. Simulation Experiments
5.2.1. Initial Population
As it was stated before, the initial population consist of pre-tuned fuzzy controllers (and simulation results). In the present case five elements are defined, their membership function parameters are listed in
Table 5, the fitness related parameters are listed in
Table 6.
5.2.2. Parameter Estimation during the Optimization
As it is apparent from
Figure 4, the proposed method has a dual nature. On one hand, the genetic algorithm gradually improves the fitness value of the modeled individuals. On the other hand, after each generation (i.e., a group of
individuals), the individual with the best fitness value is realized by the battery charge fuzzy logic controller. The input-output measurements (
i and
) of such a real charging operation are then used as an input data set for the battery parameter estimation procedure described in
Section 2. This way the proposed method re-estimates the important model parameters generation-by-generation.
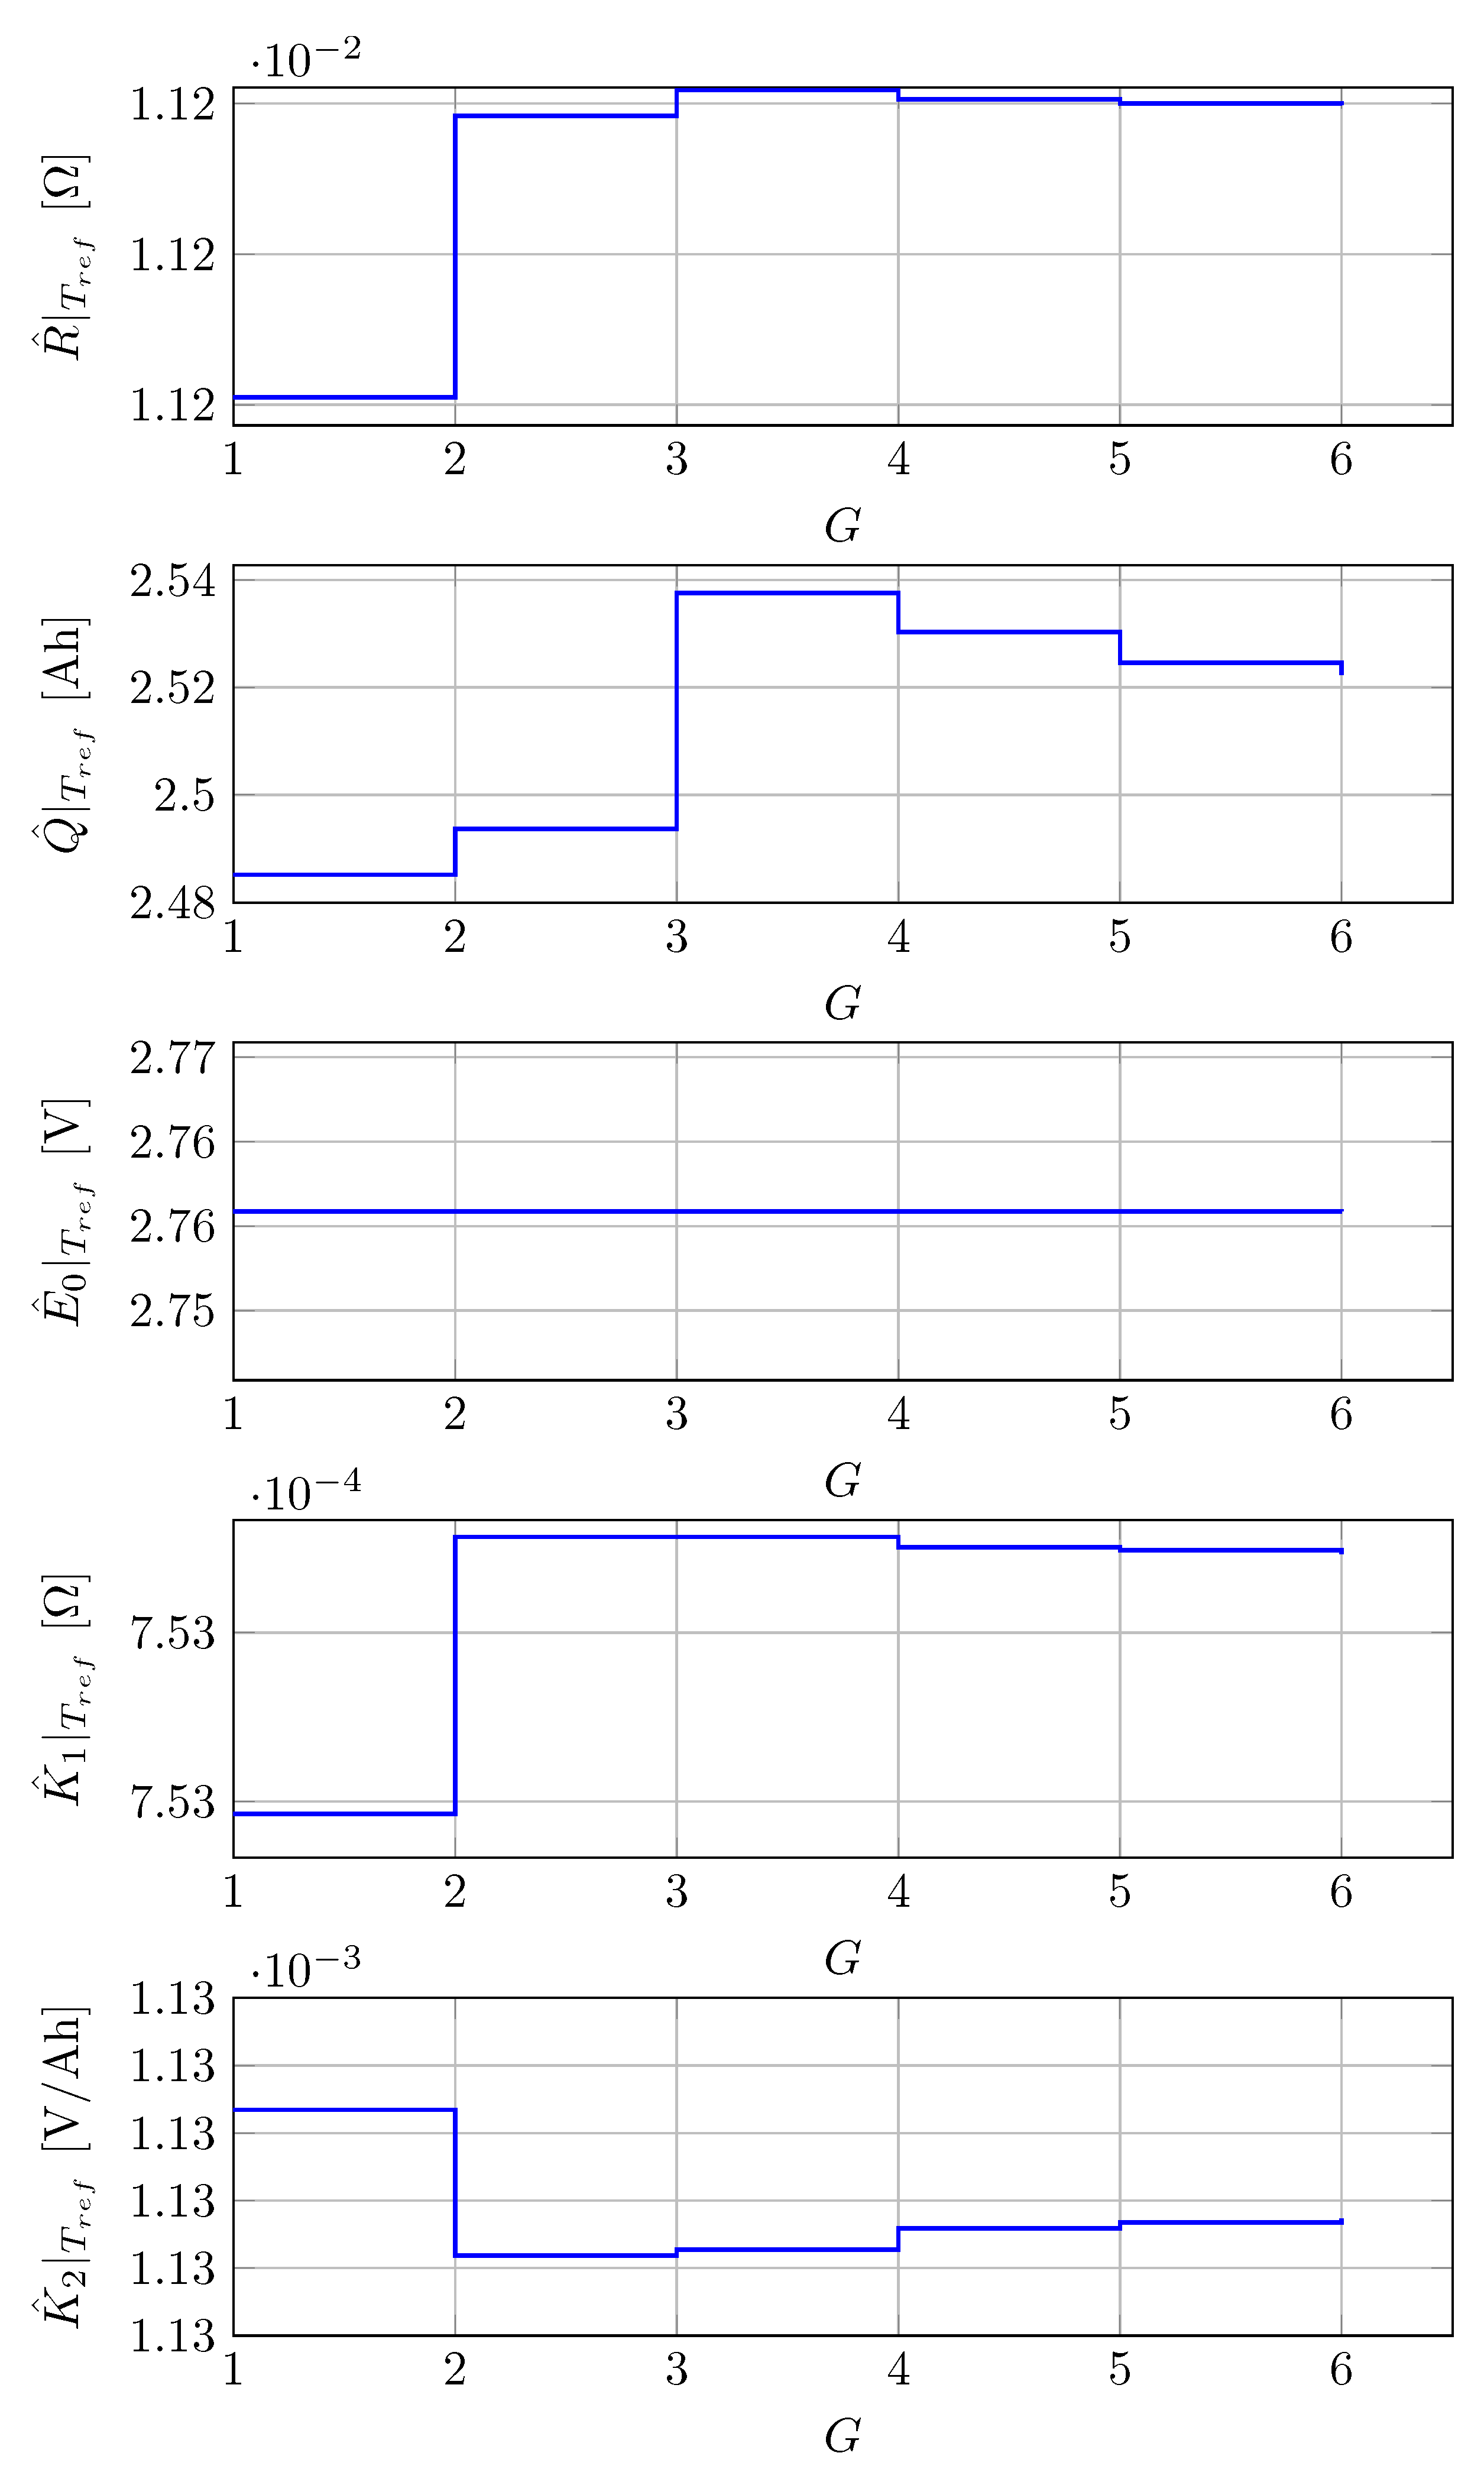
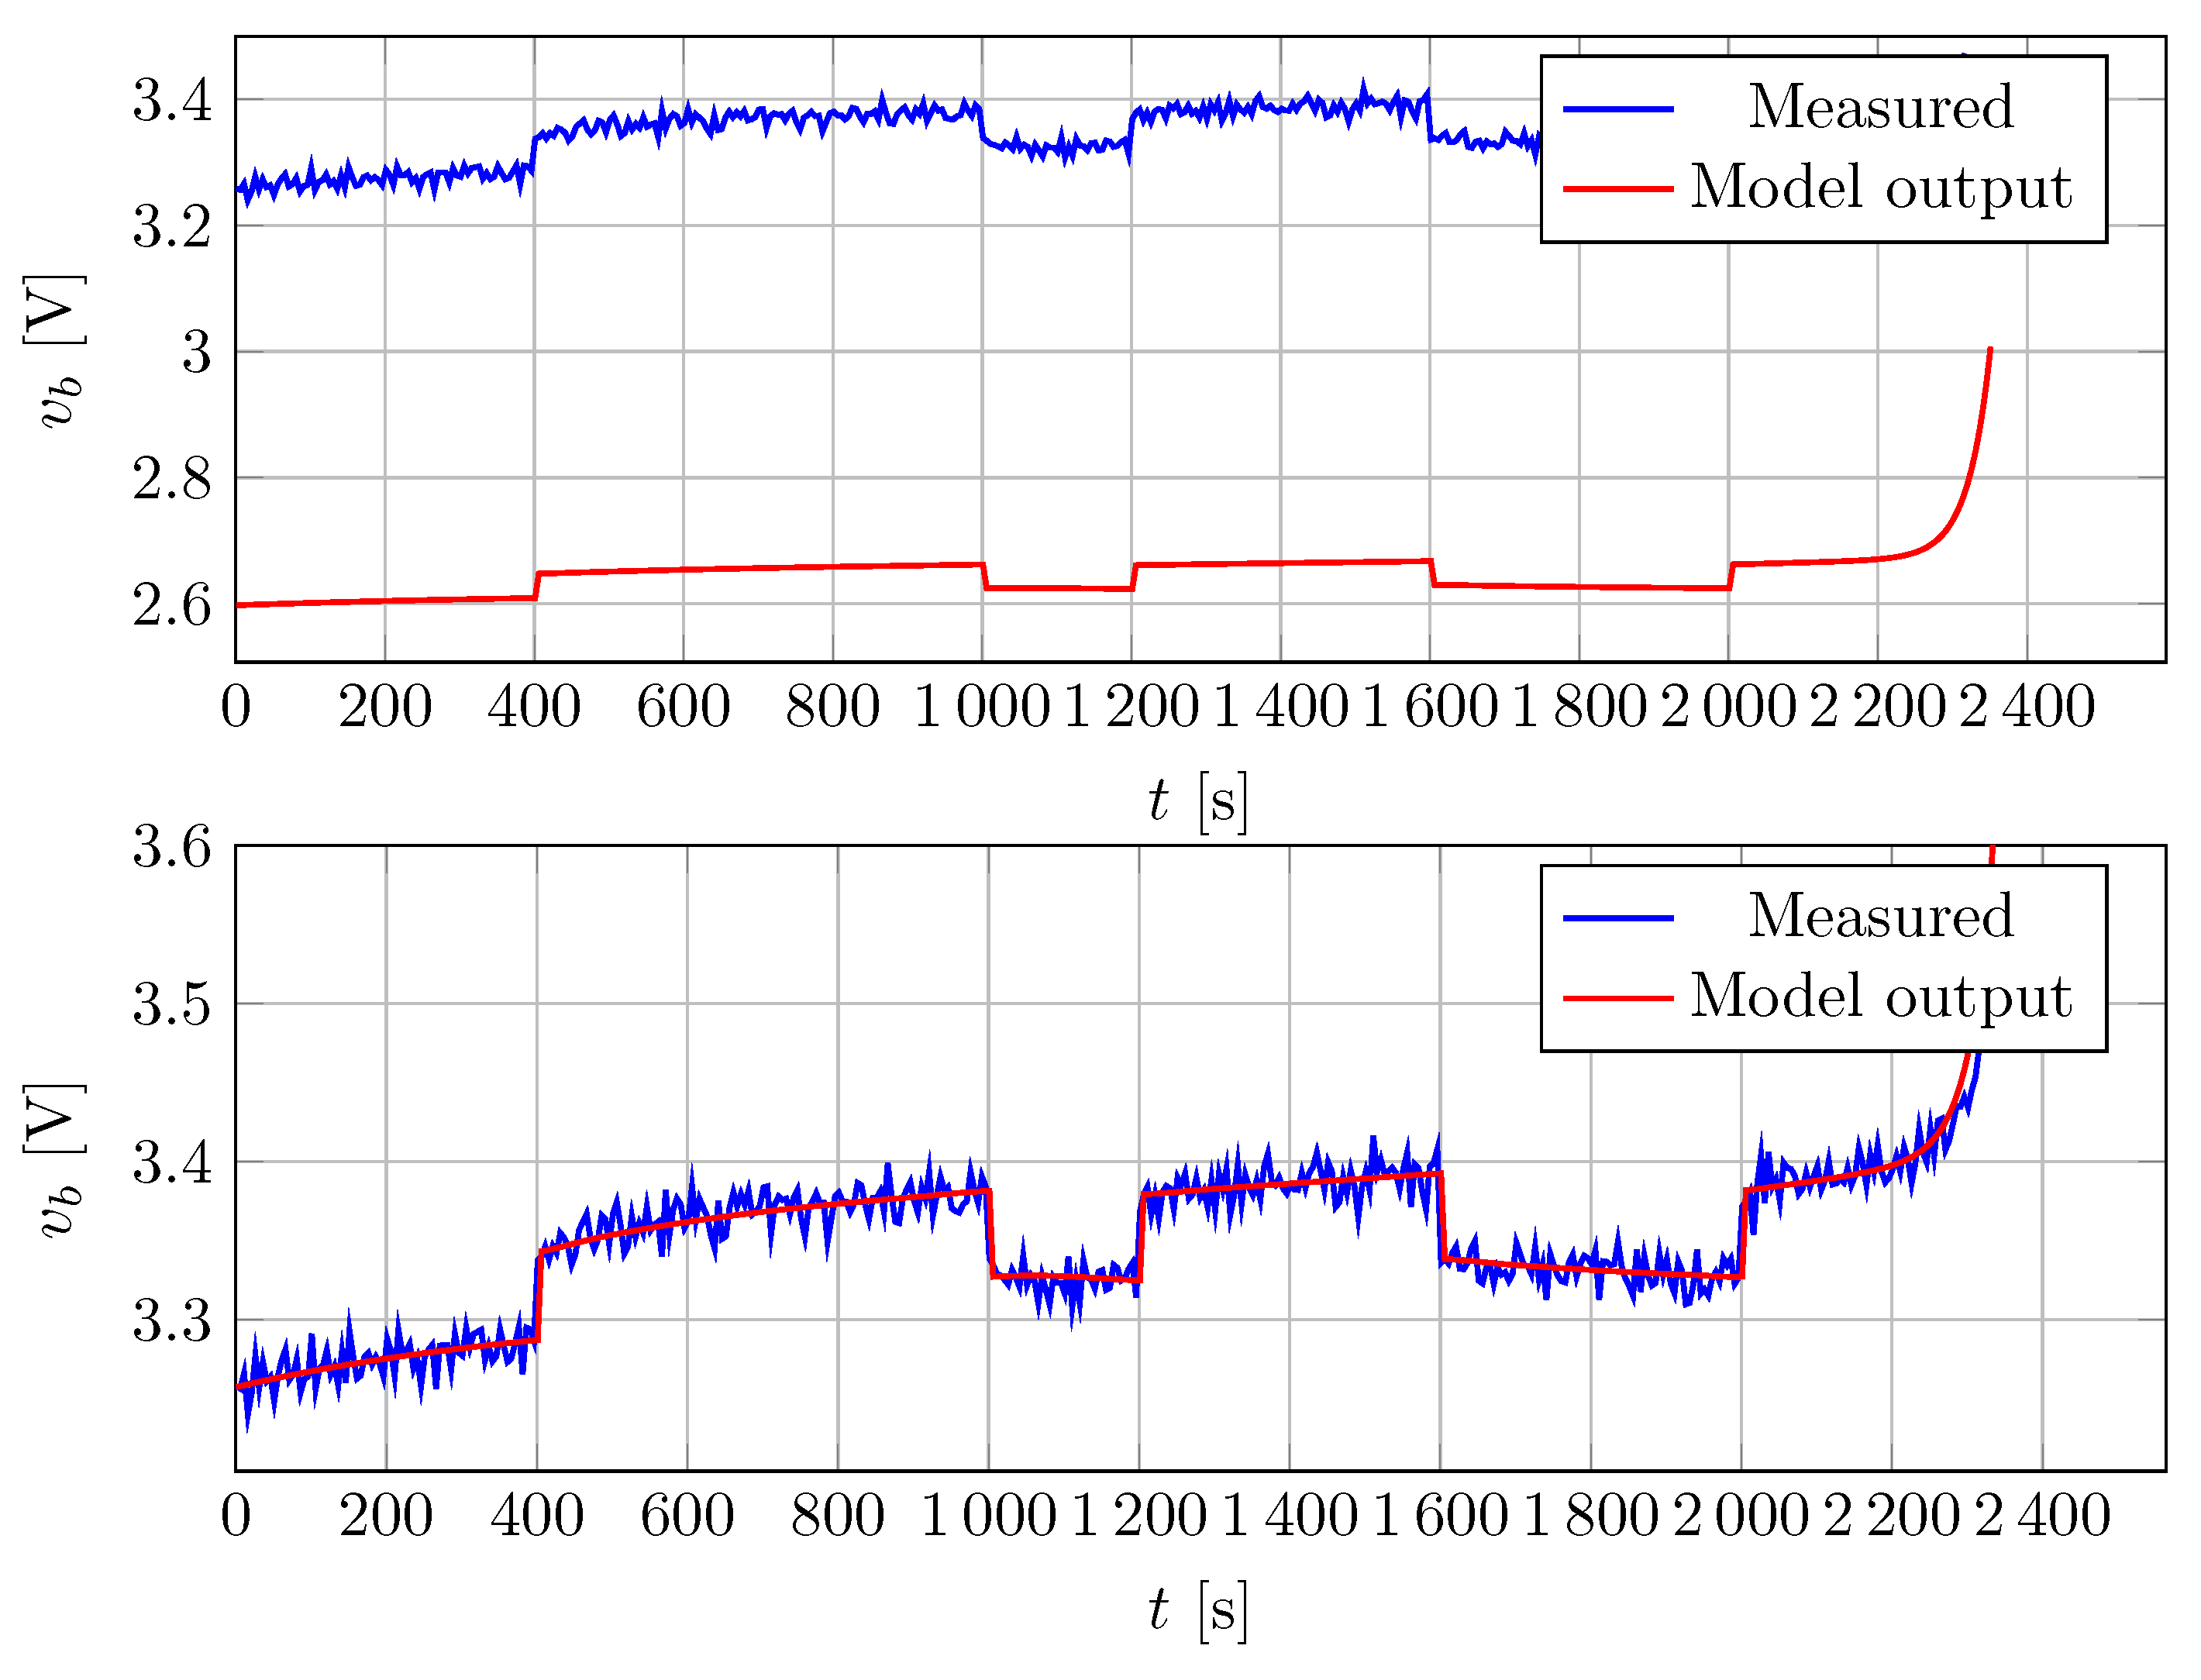
To validate the identified model, a different charge current was also applied to the battery than it was used for the parameter estimation. The PRBS (Pseudo Random Binary Sequence) input signal was chosen to this purpose. The current levels of the PRBS was set to 0.5C and 2C and the sample time was 200 s. The same input was applied to the real battery and the identified battery model and the two output voltages were compared.
Figure 7 shows the results of the parameter estimation for the most important parameters performed after each generation. It can be seen, that the estimated
,
,
and
parameter values definitely converge to a final value during the simulation.
Figure 8 illustrates the deviation of the estimated voltage from the simulated voltage for the initial parameter set and after the first parameter estimation step. The objective of the parameter estimation is to reduce the difference between the simulated and the estimated battery voltages. At subsequent estimations this gap noticeably decreases while the solutions are improving, as it is seen in the bottom of
Figure 8.
5.3. Evaluation of the Results
The operation of the optimization algorithm has been evaluated
in terms of the charge profiles,
using the fitness values of the individuals, and
in terms of the charge performance on the actual battery
5.3.1. Charge Profiles
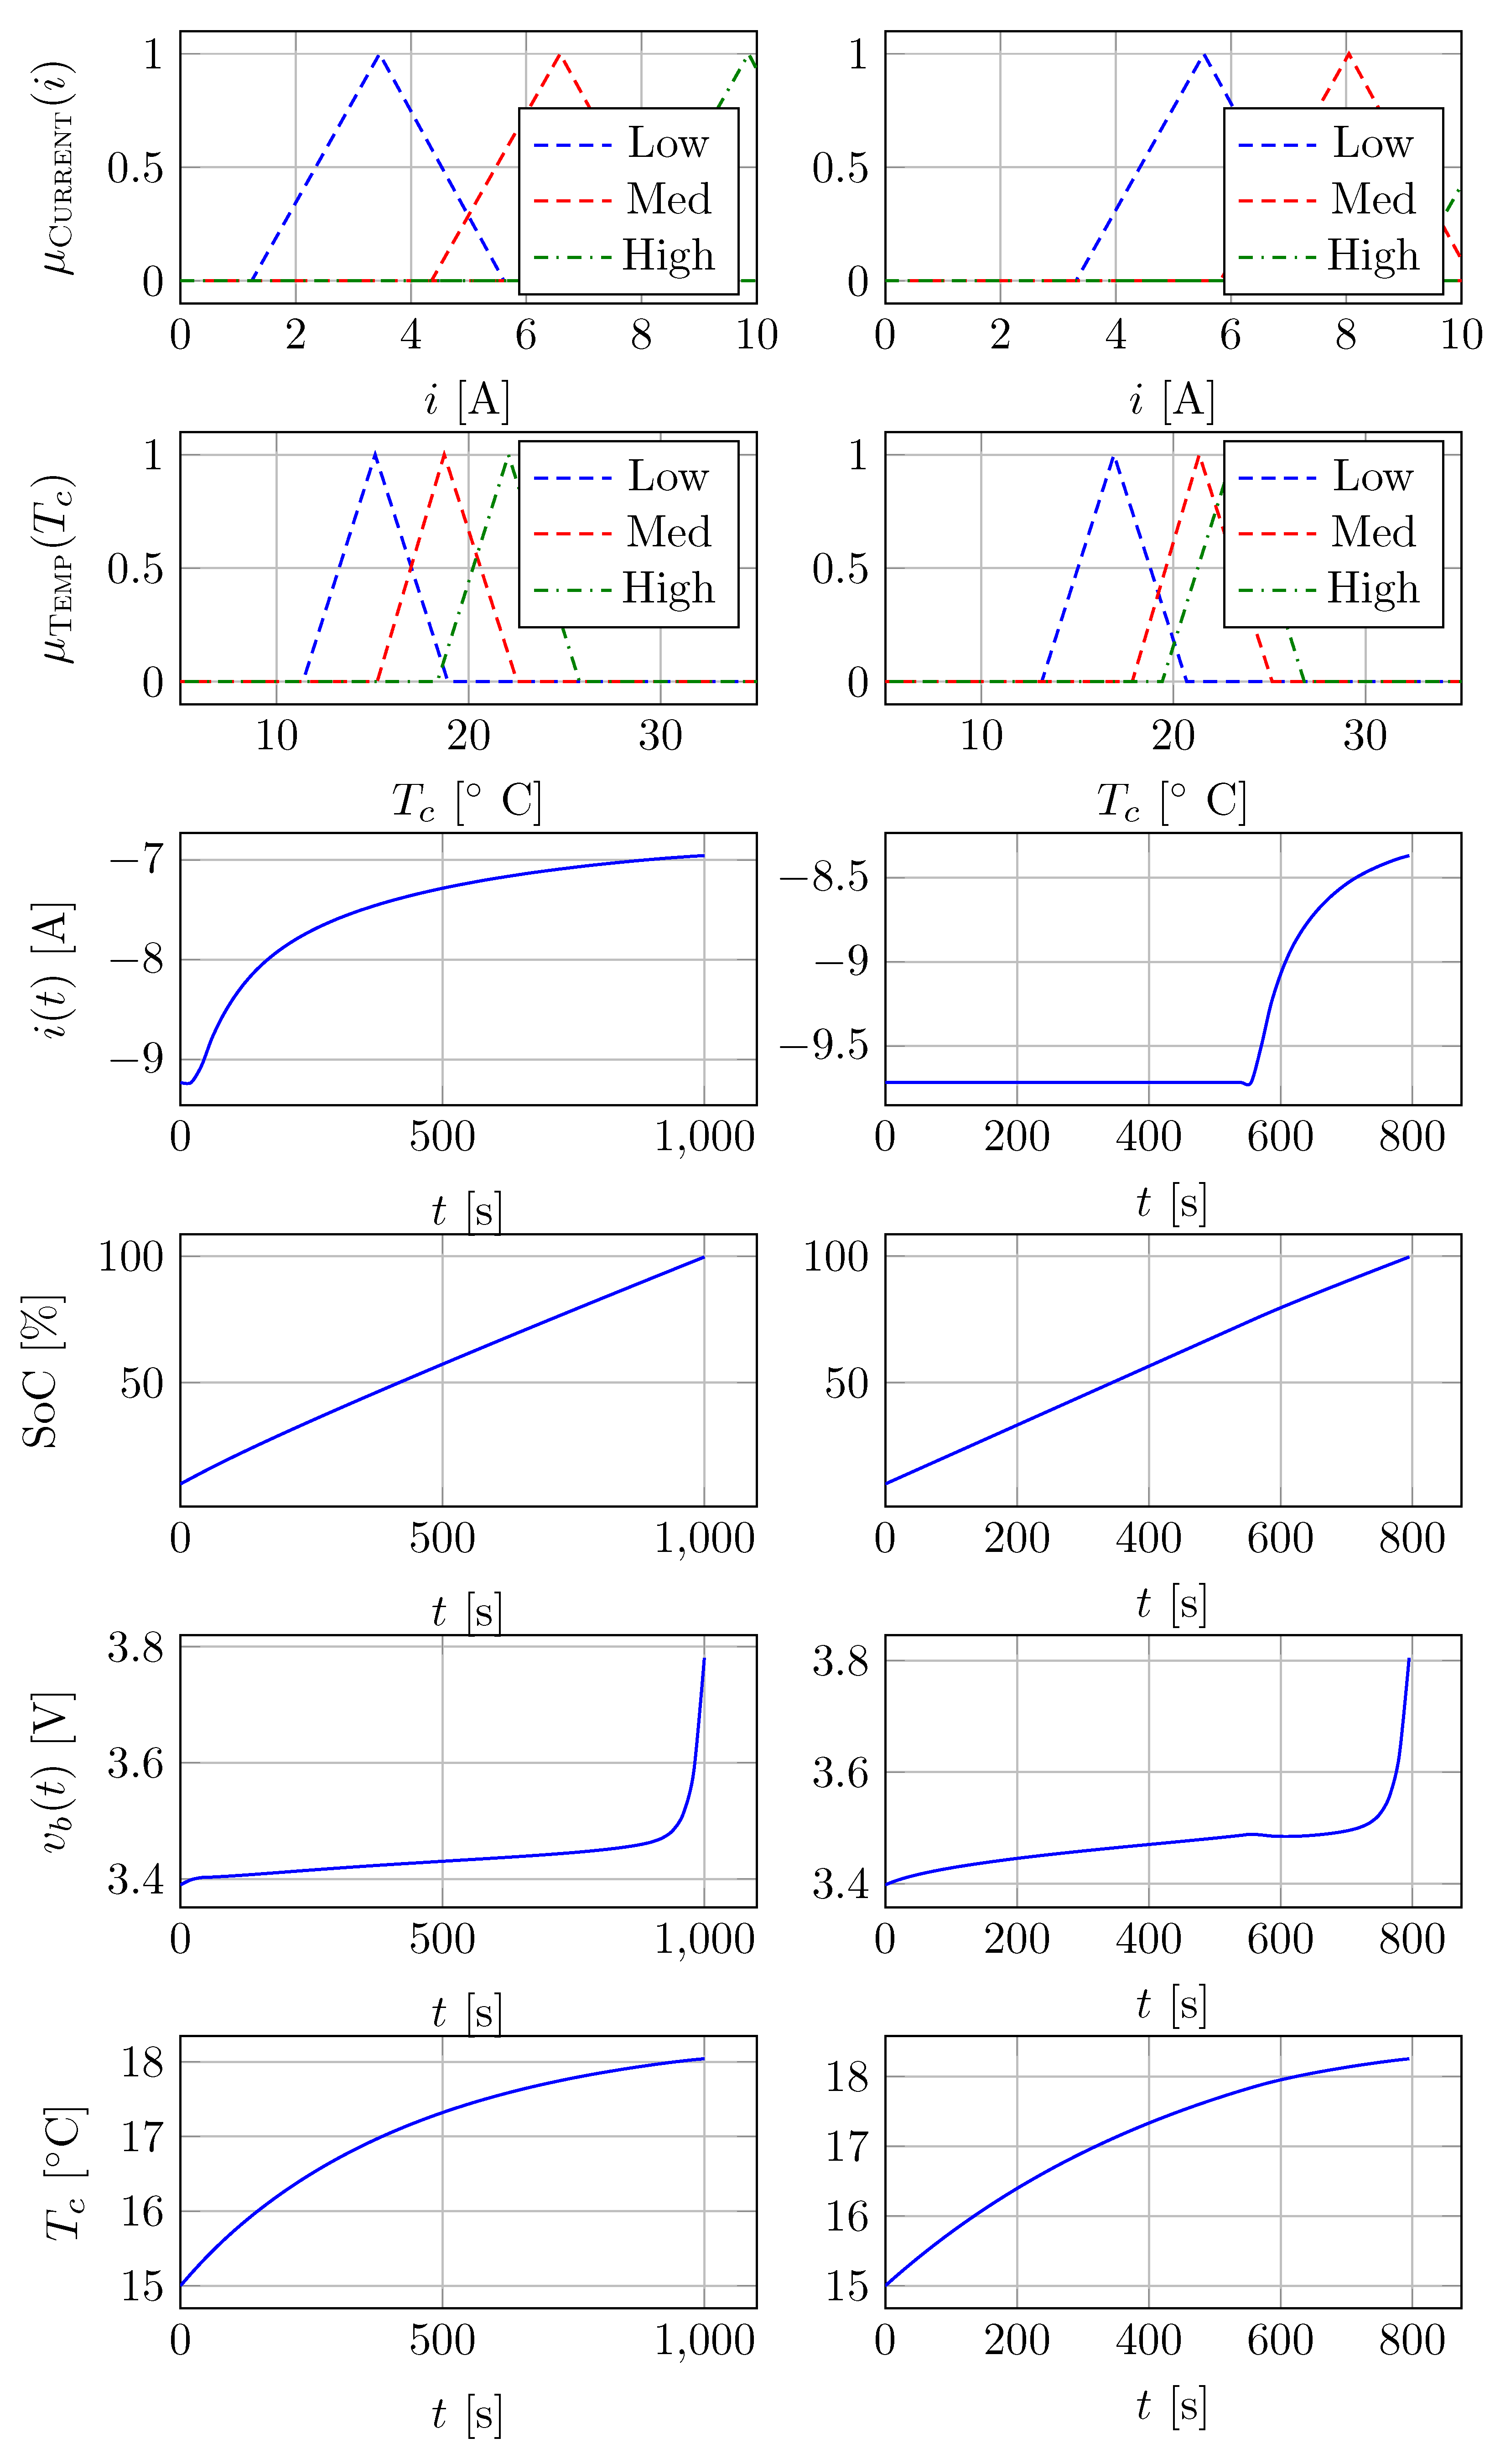
In order to see the differences of the charge controlling system, the worst individual and the best individual are compared in
Figure 9 in the case of a simulation experiment with a five element initial population, and with
,
and
. The figure includes the membership functions of the FIS, as well as the time series of the important battery variables (
,
,
and
, respectively). The values for the worst individual are in the left column, the values belonging to the best individual are in the right column. Note, that the battery variables are the variables of the internal battery model of the proposed charge controller system.
It can be seen that there is a significant difference between the charge profiles of the worst and the best individuals. In case of the worst individual, the charge current is continuously reduced during the charge process, while in case of the best individual it is reduced at the end of the charge process only. Moreover the average amplitude of the current is greater in case of the best individual. This affects the charge time of the battery, too: in case of the worst individual the battery reaches 100 % state of charge in 1000 s, while in case of the best individual the battery is fully charged in 800 s. The increase of the battery cell temperature is slightly greater in case of the best individual, but there is no significant difference between the two individuals.
5.3.2. Fitness Values of the Individuals
As expected, the fitness values of the individuals become lower with the increasing number of generations. This is illustrated in
Figure 10. The construction of the fitness function (
15) determines the behavior of the method. It can be seen from
Figure 10 that the fitness values converge relatively fast to a minimum value around four. It is important to note, that only the best individual of each generation (black filled markers on the figure) is implemented in the charge controller during the charge of a real battery.
5.4. Dependence of the Results on the Algorithms’ Tuning Knobs
The proposed method has also been examined with resect to the different design parameters of the GA. Four important parameters of the proposed charge controller method has been identified: , , the size of the initial population and .
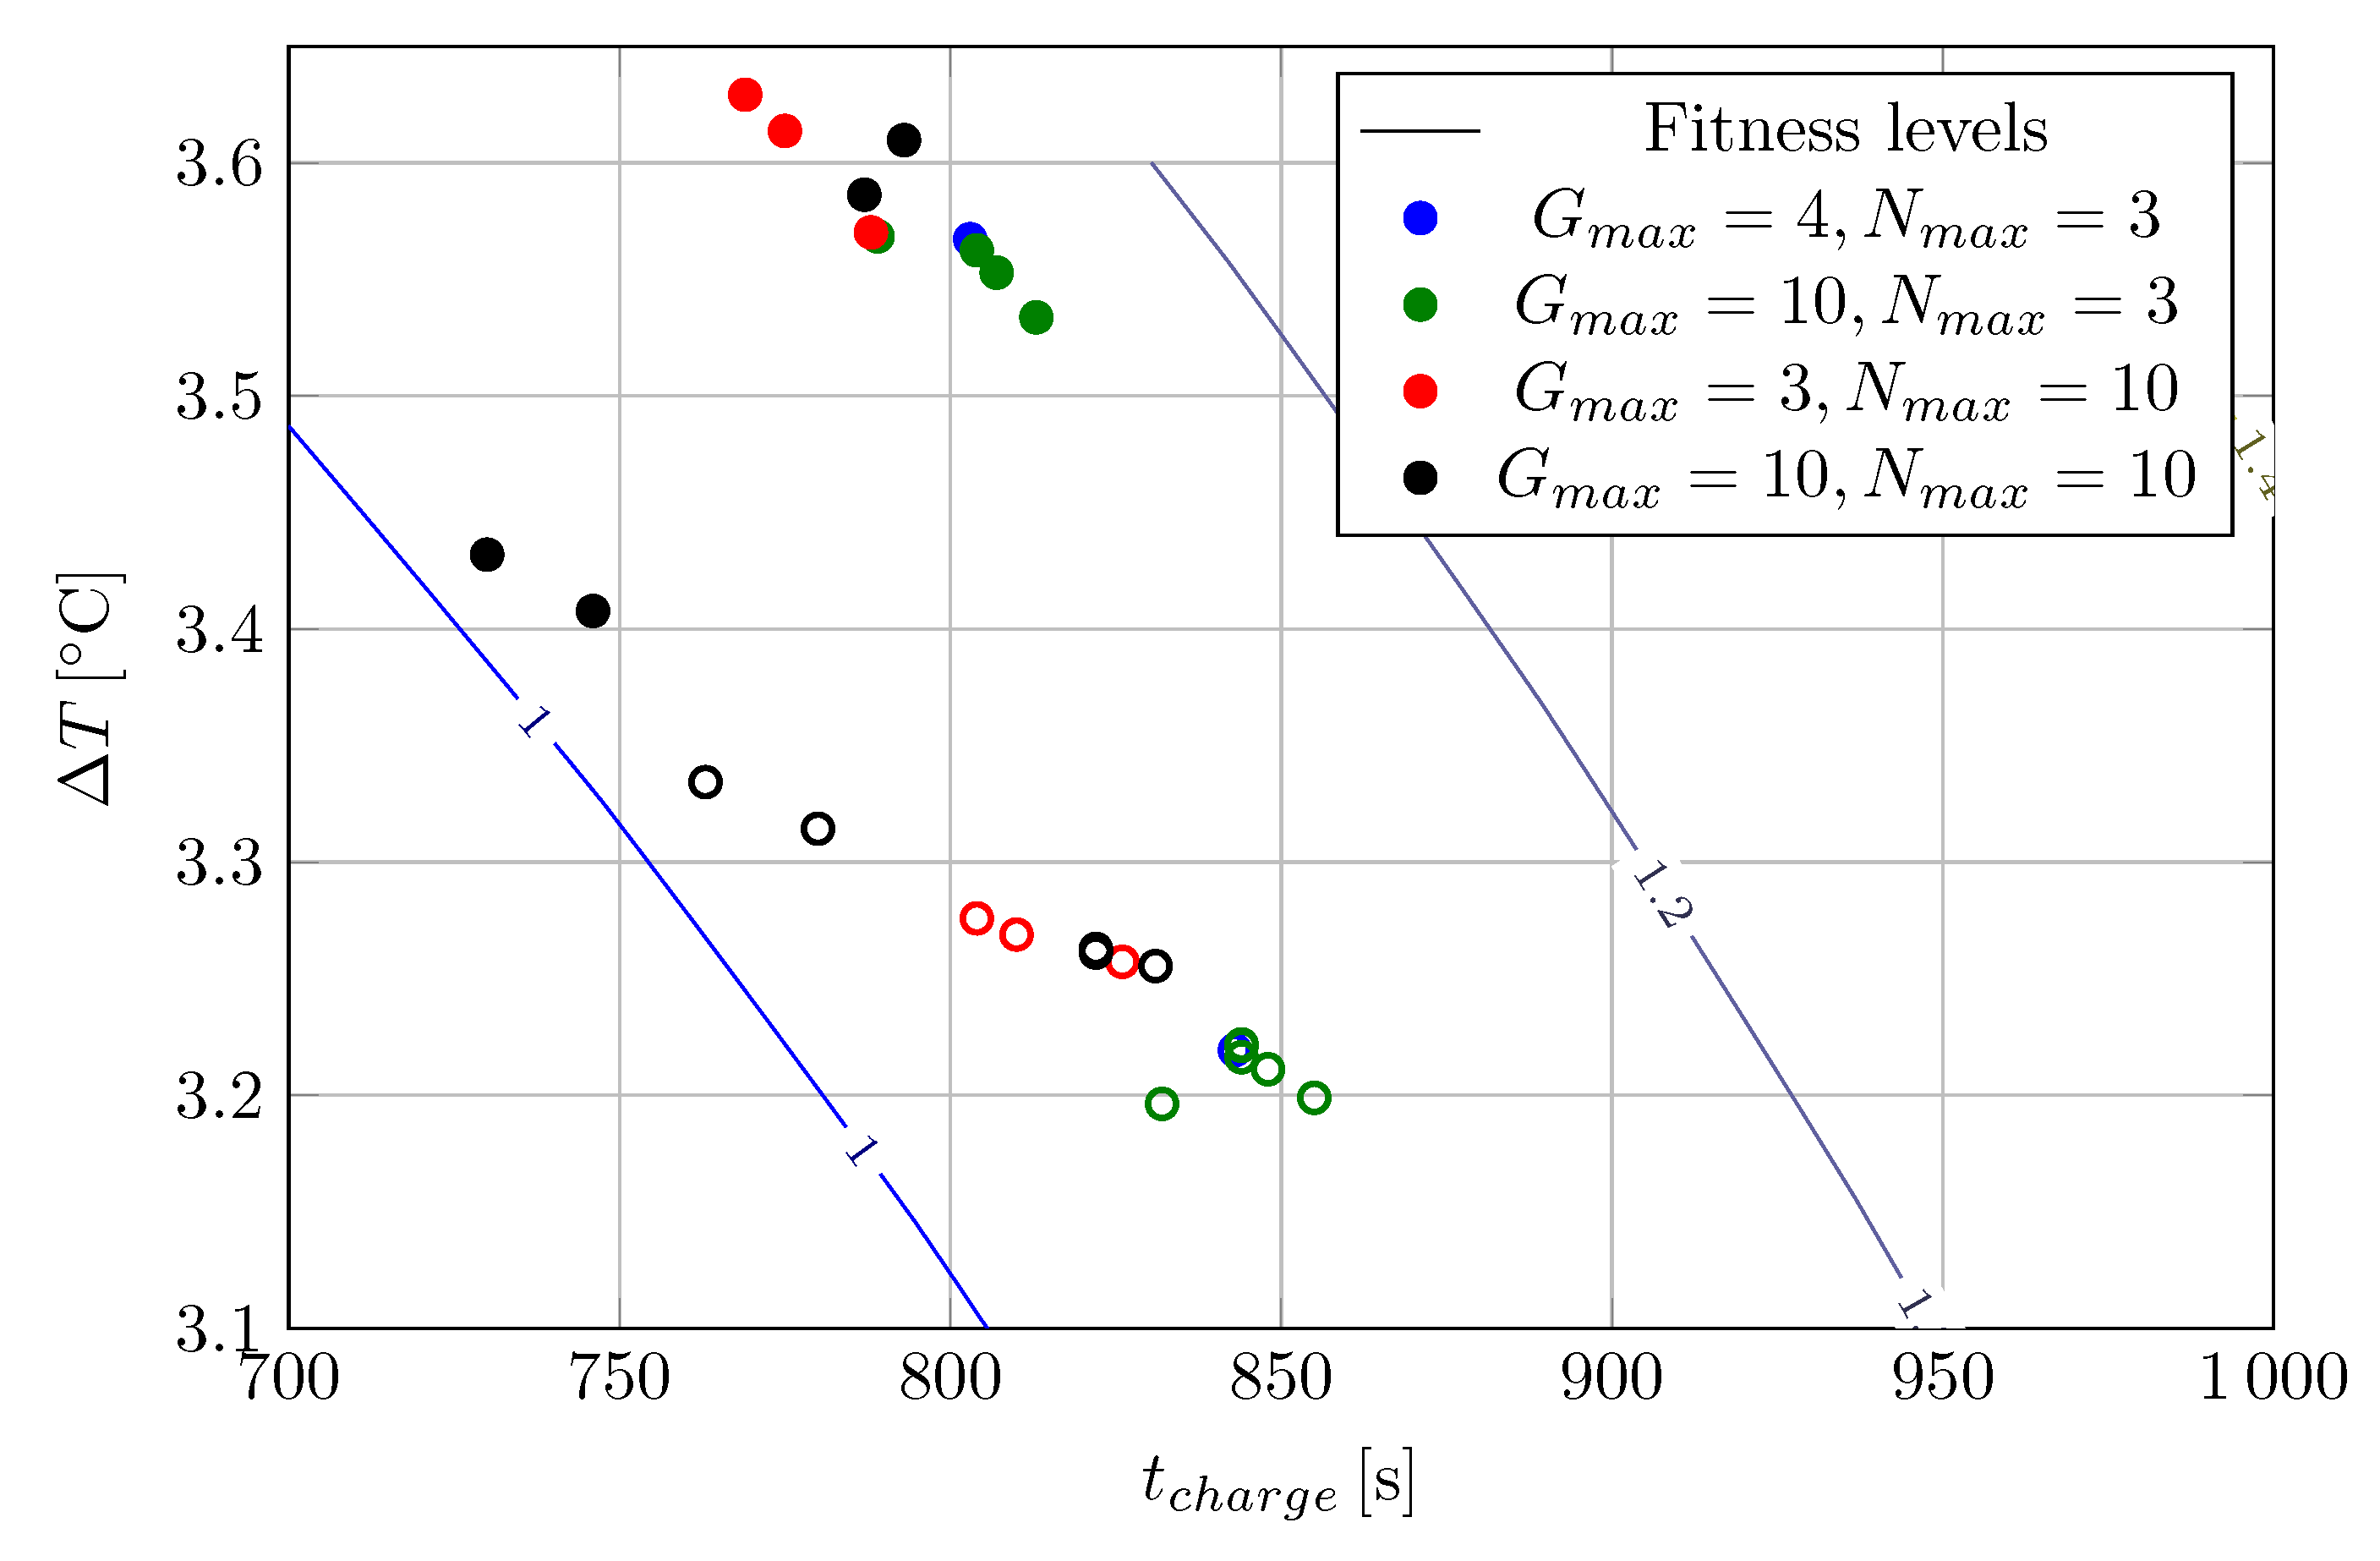
Figure 11 summarizes the results of four simulation experiments, where parameters
and
were changed between a relatively small (3–4) and a large (10) value. The empty markers show the best individuals of each generation for the four setups. It can be seen that a smaller number of individuals per generation (
) and/or a smaller number of generations (
) results in individuals that converge to the real battery results slower with weaker fitness values (red, green and blue empty markers), while larger
and
values resulted in better convergence and better fitness values (black).
The most important tuning knob of the proposed method is the trade-off parameter
of the fitness function (
15). A set of simulation experiments have been performed in order to illustrate the results of the charge controller based on different
values. The initial population size was five with
.
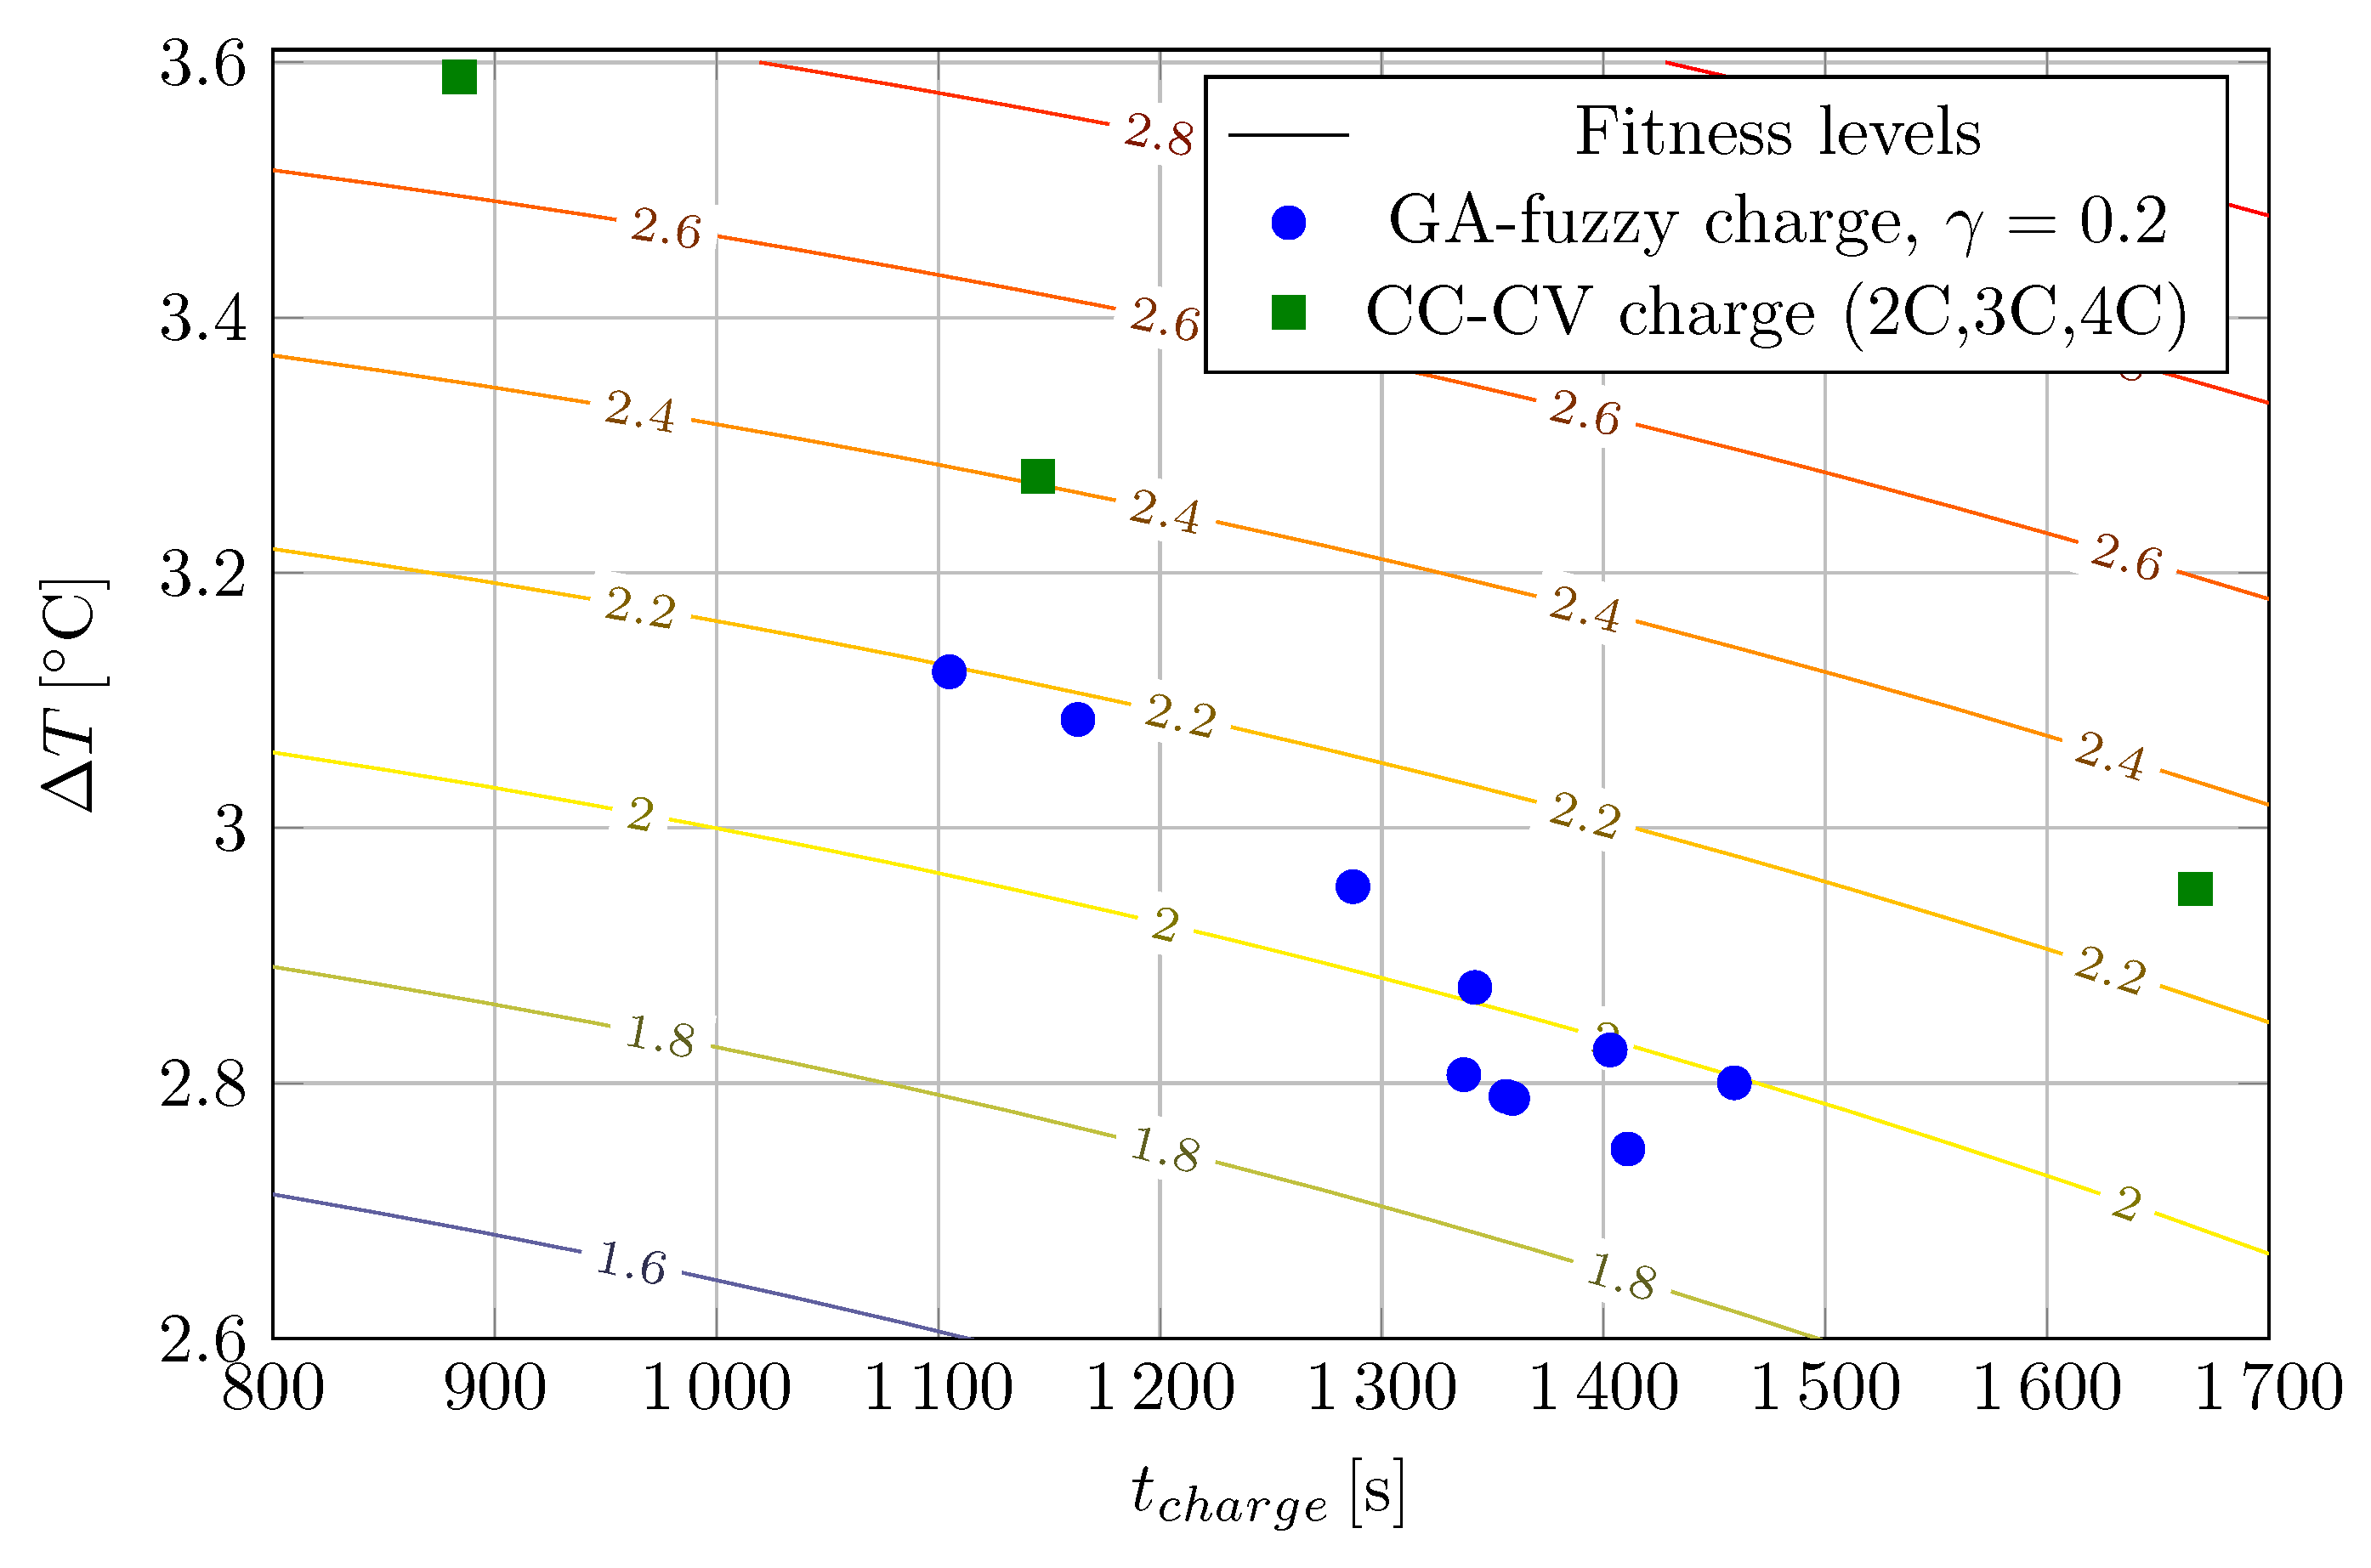
Figure 12 shows the results in the
plane together with the level curves of the fitness function for
. As a reference, the
and
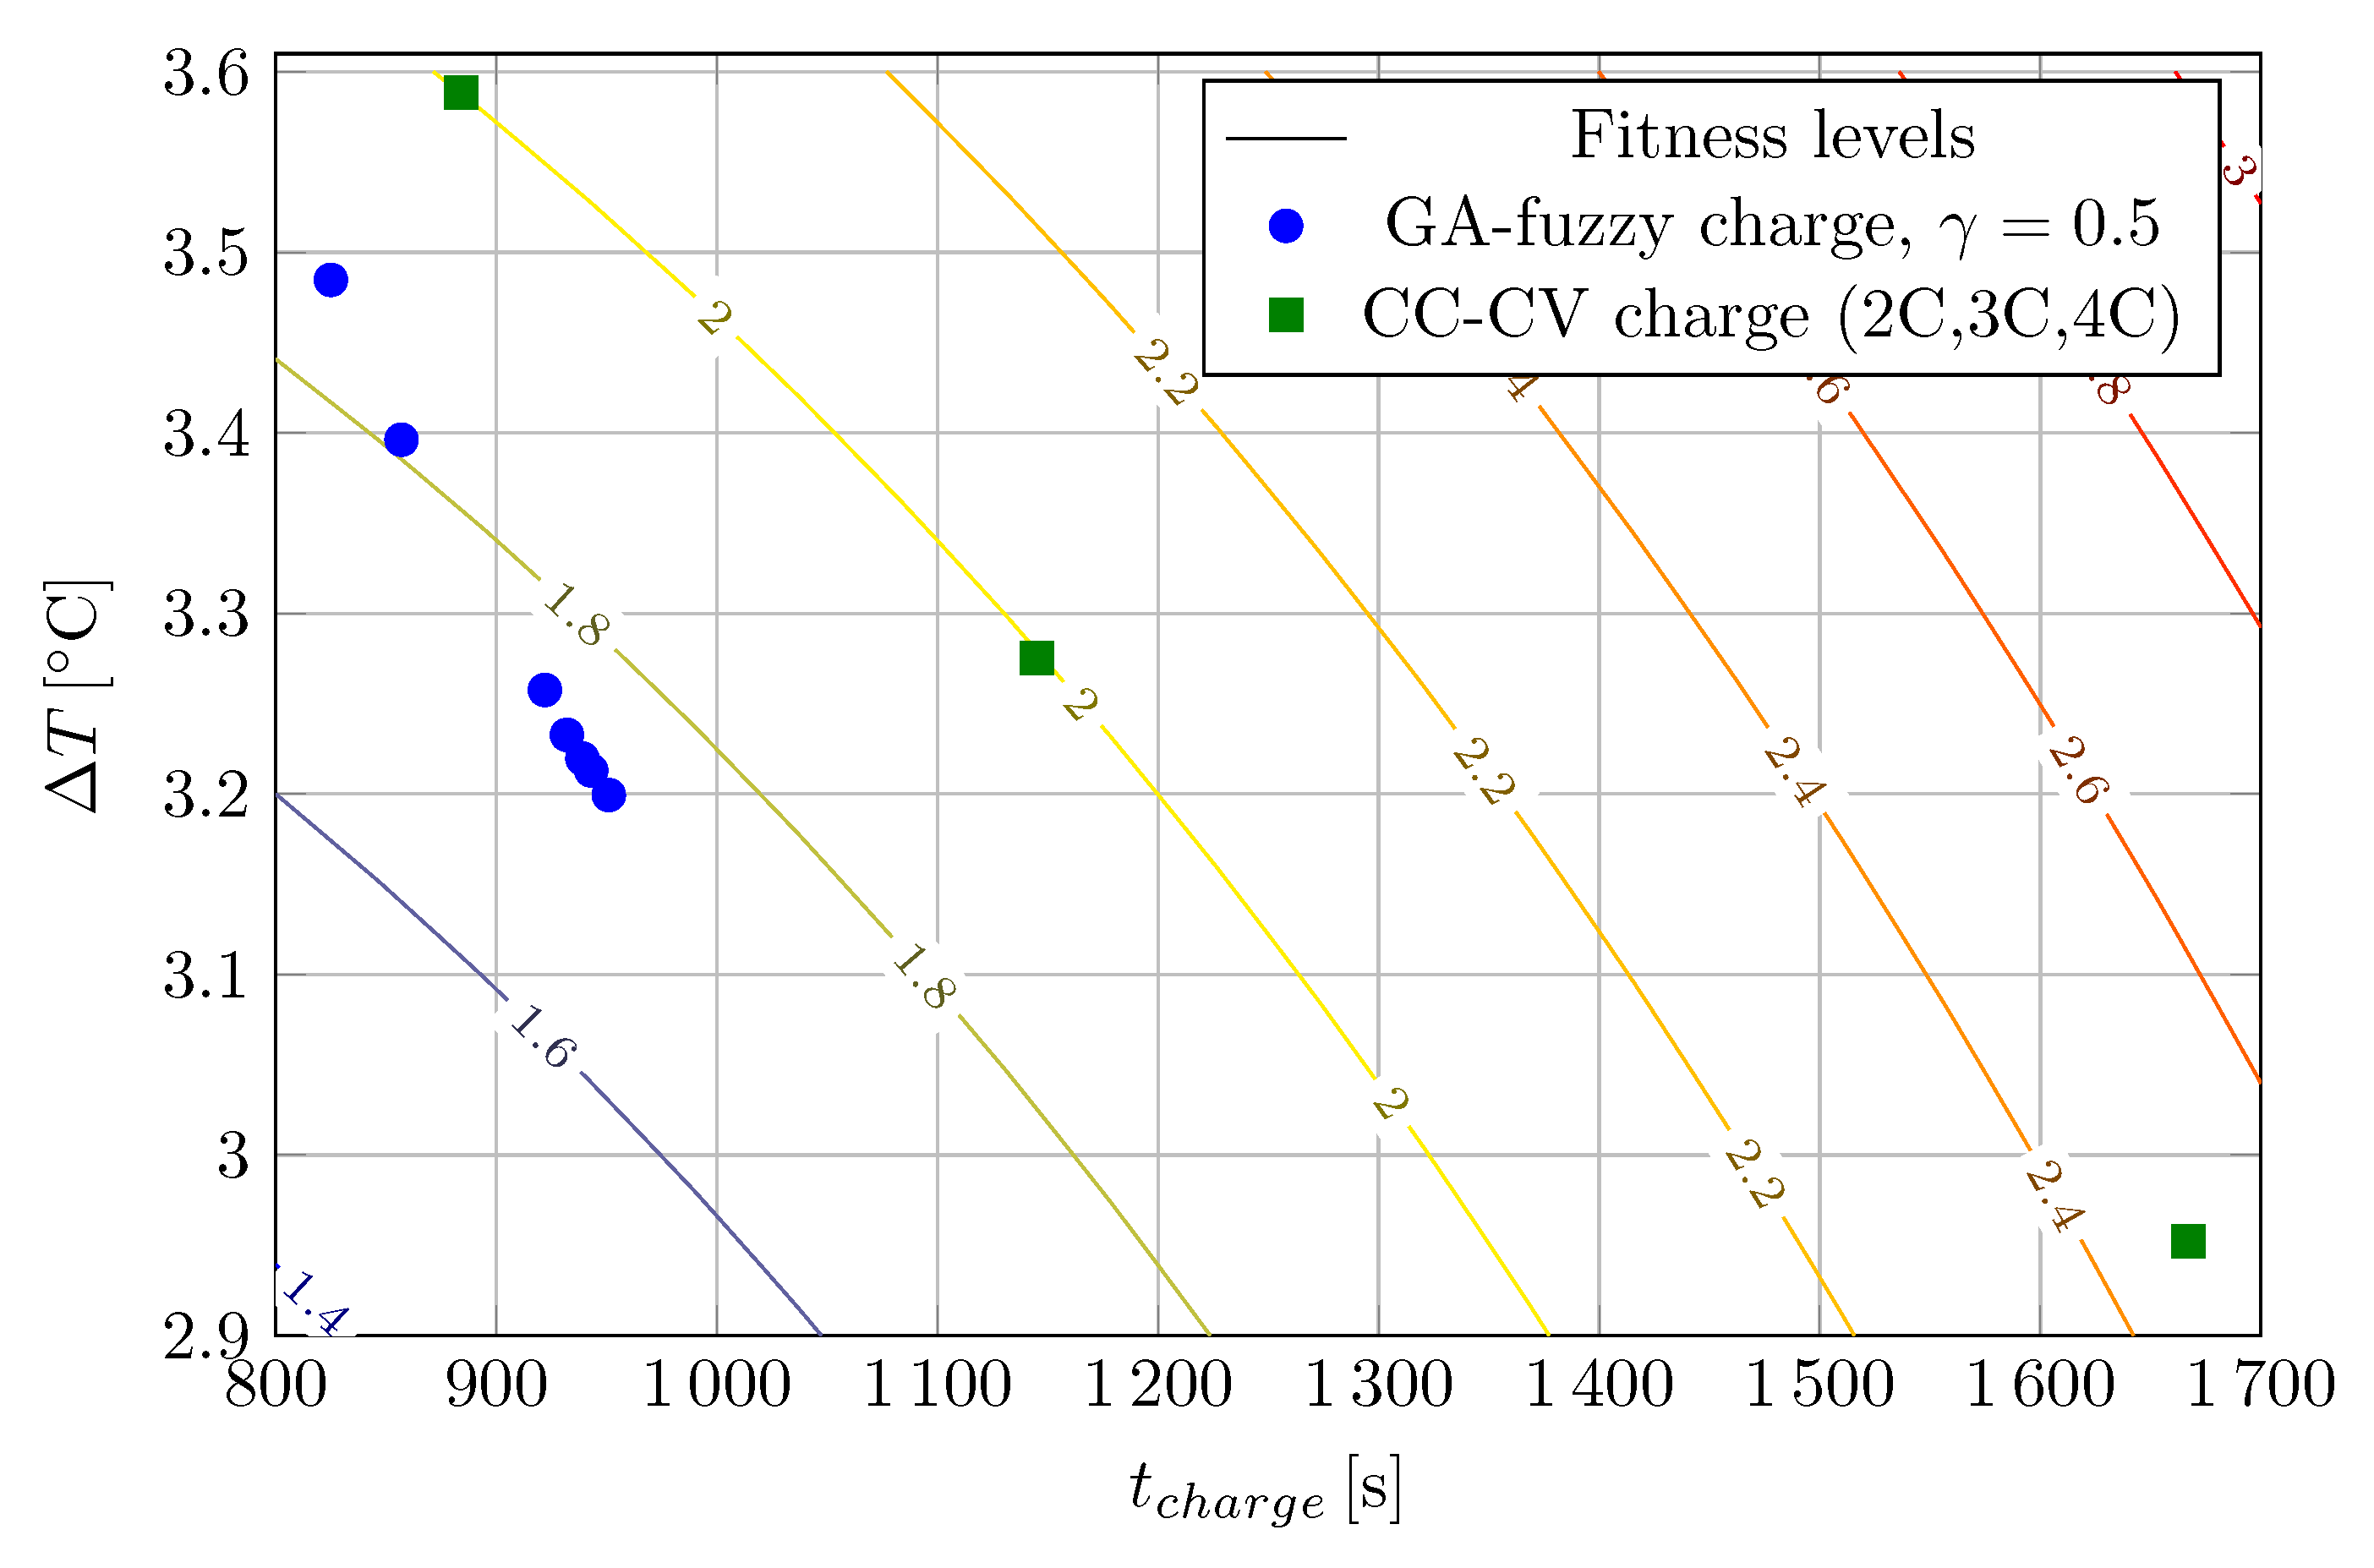
values of conventional CC-CV charging profiles for 2C, 3C and 4C, are depicted by green squares. (The charge current in the constant current phase for the 2C, 3C and 4C cases were 4.6 A, 6.9 A and 9.2 A, respectively.) It can be clearly seen that, although the GA-fuzzy charge controller charges the battery in a much slower rate, it keeps the temperature on a lower level (2.8
C).
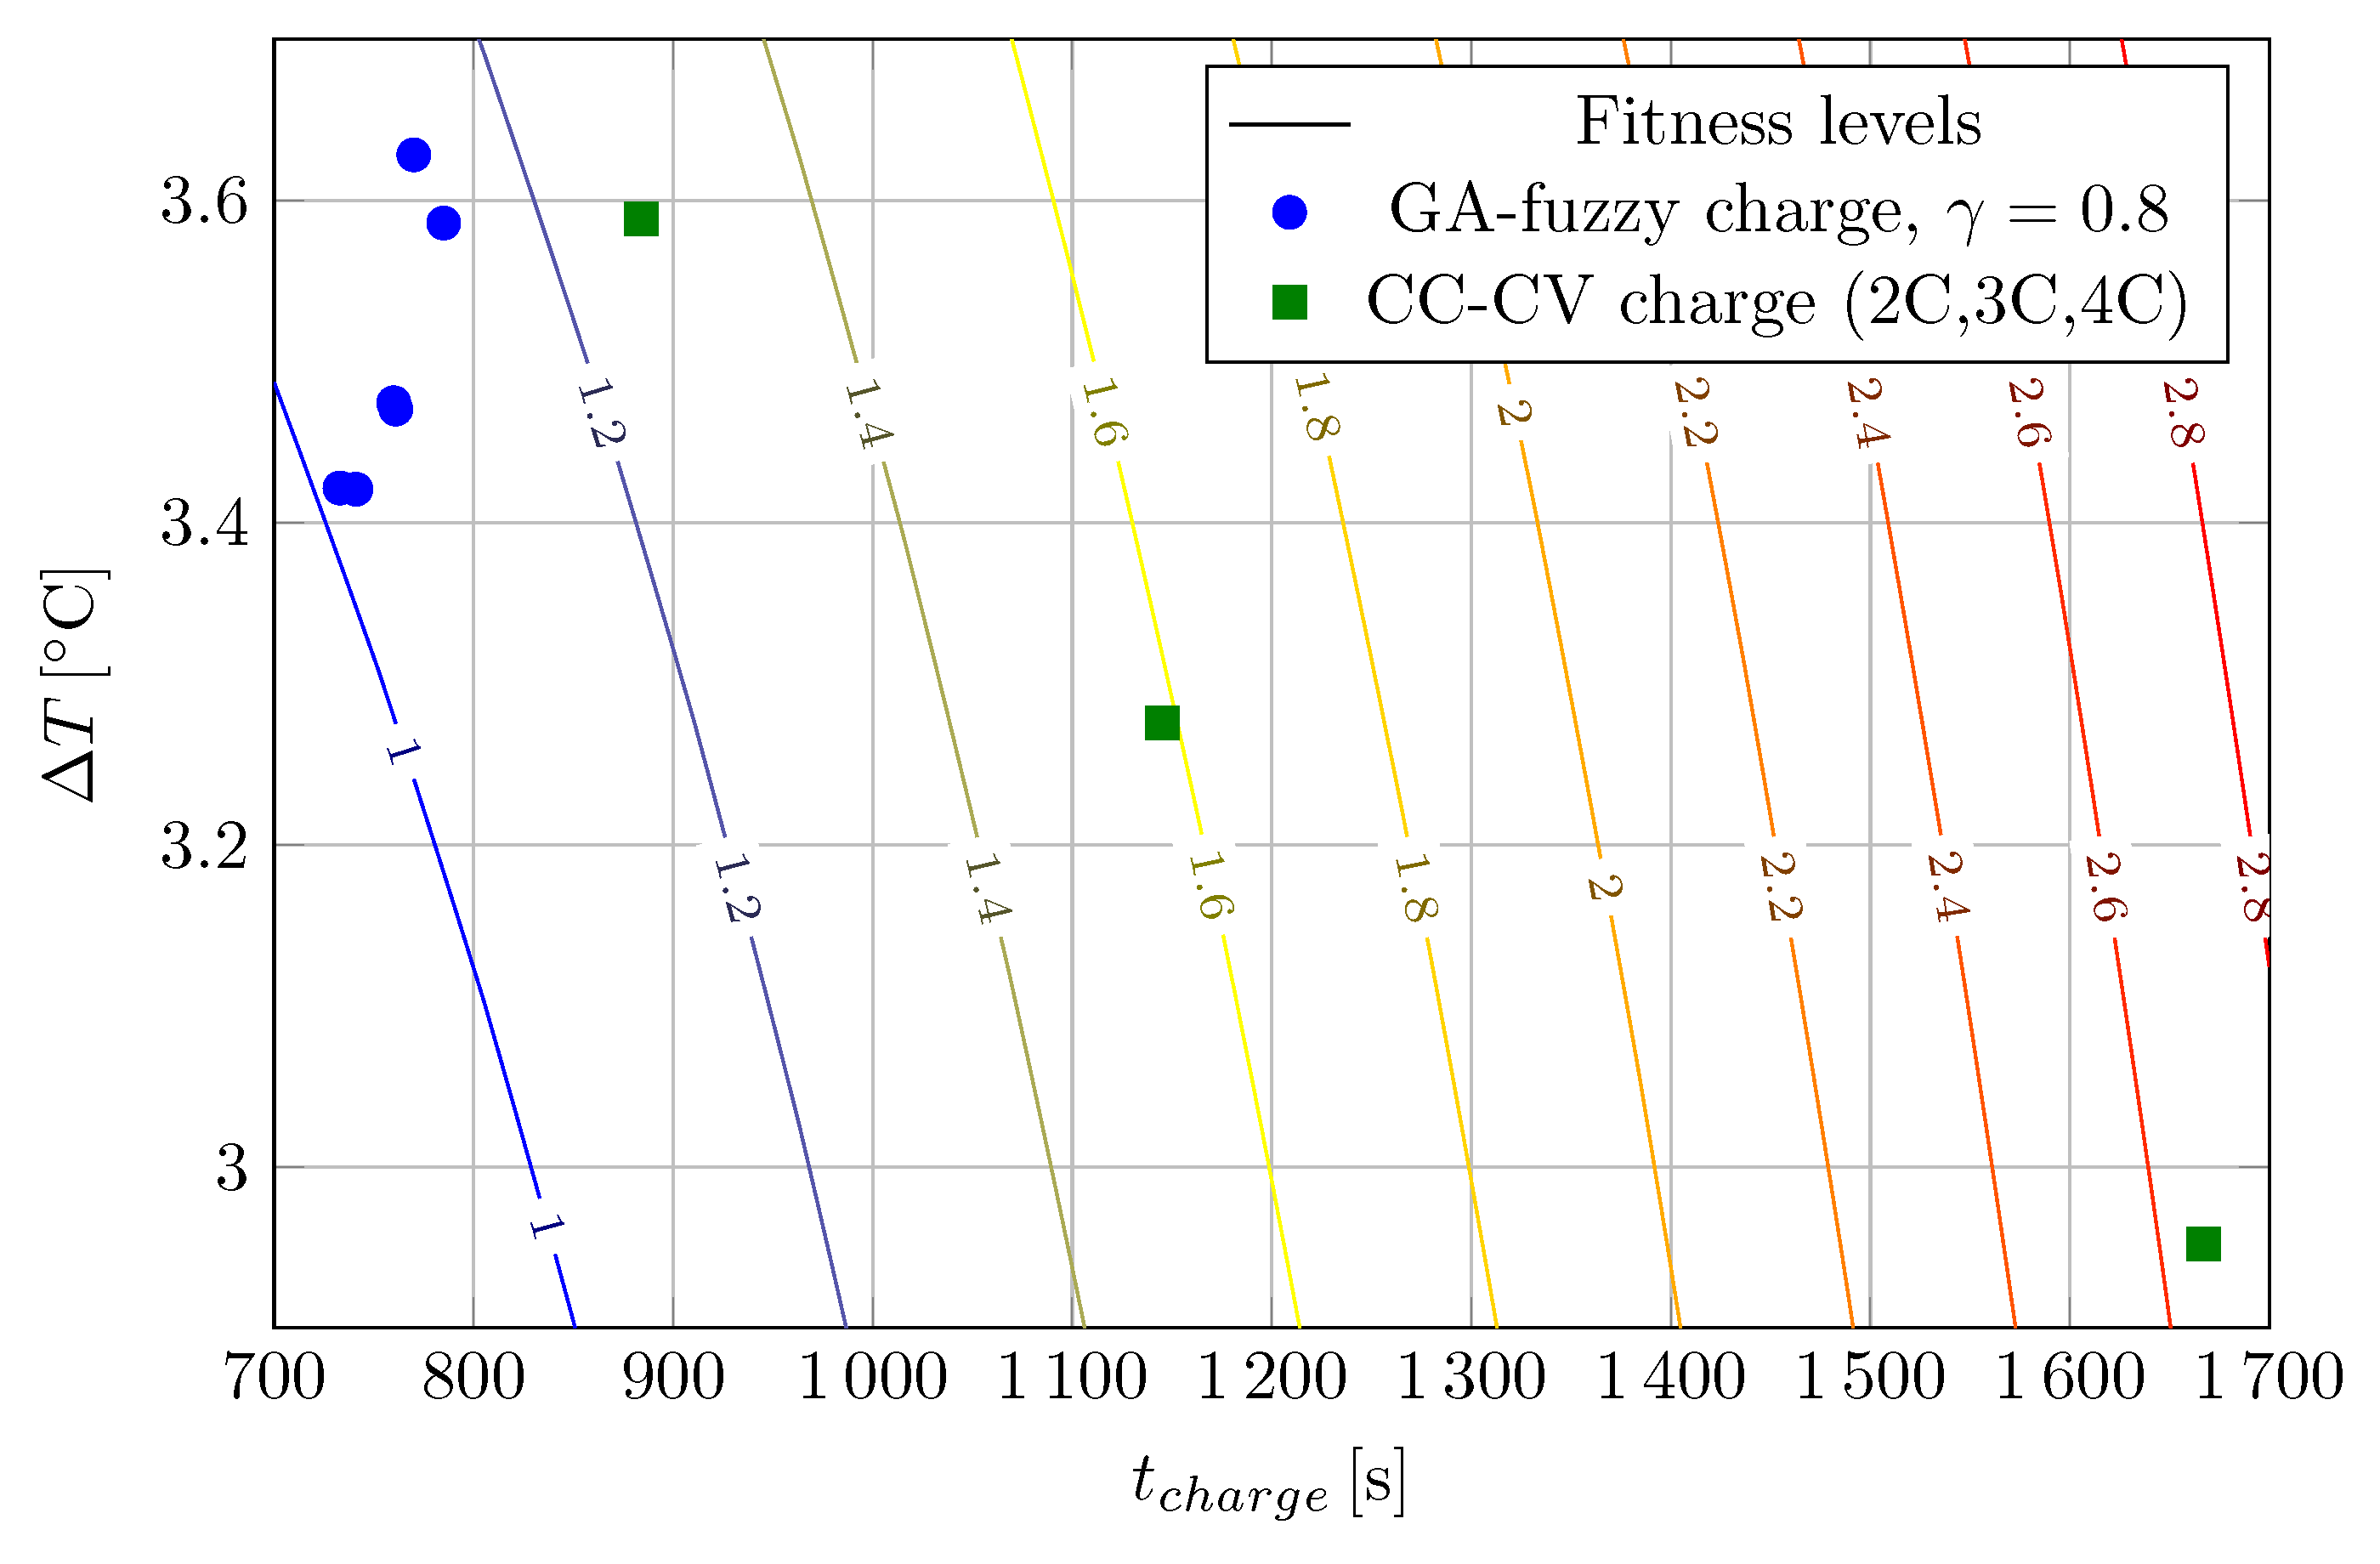
Figure 13 shows the results for
. It is apparent, that the charge controllers realized from the best individuals of each generations of the GA are faster than 900 s, however the maximal temperature difference almost reaches 3.5
C. The results can be compared to the CC-CV charge for 3C and 4C. A very similar charge time could be reached with a 0.3
C lower cell temperature.
The final simulation experiment corresponds to
. The results are depicted in
Figure 14, where (apart from an outlier of the first generation) the GA-fuzzy charge controllers are gathering around 750 s which can be regarded as a very good result; it is 50 s faster and 0.2
C cooler than the 4C CC-CV charge.
Summarized, it can be seen on
Figure 12,
Figure 13 and
Figure 14, that for different
values the proposed method yields approximately a 20% decrease in
and a 5% decrease
compared to the conventional CC-CV method.
6. Conclusions and Future Work
A simple optimized fuzzy controller is proposed in this paper that is responsible for the regulation of charging current of a battery charging system. The basis of the method is a simple dynamic electrical circuit type model of the Li-ion battery that takes into account the temperature dependency of the model parameters, too.
Since there is a tradeoff between the charging speed determined by the value of the charging current and the increase in temperature of the battery, the proposed simple fuzzy controller is applied for controlling the charging current as a function of the temperature. The controller is optimized using a genetic algorithm to ensure a jointly minimal charging time and battery temperature increase during the charging. The parameters of the fuzzy membership functions of the battery temperature and that of the charging current are optimized using a fitness function that is a weighted sum of the charging time and the temperature increase during charging.
The proposed GA-fuzzy control method is adaptive in the sense that we use parameter estimation of an underlying dynamic battery model to adapt to the actual status of the battery after each charging. The parameter estimation is performed in each charging cycle using constrained direct minimization of a loss function.
The main advantage of the proposed method as opposed to similar optimized equivalent circuit methods, that an off-line optimization is performed by the GA in each generation that does not involve the real battery. Only the best fuzzy controller of each generation is applied as an ultimate battery charge. This improves the convergence of the method from the user point of view. Using a proper discretization, the simulation of the equivalent circuit battery model can be implemented in a computationally effective way, and it can also be run on a battery management system. Moreover, by changing the value of the cost function, the optimization aim can be changed online. This means that, after a short transient, the method is able to optimize for the new aim.
The performance and properties of the proposed optimized charging control system are evaluated using a simulation case study. The evaluation was performed in terms of the charge profiles, using the fitness values of the individuals, and in terms of the charge performance on the actual battery. The charge performance has been compared to the conventional CC-CV battery charge policy. We have found that the proposed GA-fuzzy controller gives a slightly better performance by means of charging time as well as temperature increase.
The effect of the most important tuning knobs of the proposed GA-fuzzy controller, namely the weighting factor in the fitness function, the size of the initial population and the maximal number of generations has also been thoroughly analyzed.
Further work will be directed to relate the estimated parameters to the ageing of the battery and thus predict the speed of the ageing process.
The fuzzy charging controller will also be extended to take into account the actual SoC value of the battery. This will make the fuzzy rule set more complex by increasing the number of rules and their kind of predicates.
Author Contributions
Conceptualization, G.K., A.M. and K.M.H.; software, G.K. and A.I.P.; validation, A.M.; writing—original draft preparation, G.K. and A.M.; writing—review and editing, K.M.H., A.I.P. and A.M.; visualization, A.M.; supervision, A.M. All authors have read and agreed to the published version of the manuscript.
Funding
Project No. 131501 has been implemented with the support provided from the National Research, Development and Innovation Fund of Hungary, financed under the K_19 funding scheme. A.M. was supported by the Janos Bolyai Research Scholarship of the Hungarian Academy of Sciences. Attila Magyar was supported by the ÚNKP-21-5 New National Excellence Program of the Ministry for Innovation and Technology from the source of the National Research, Development and Innovation Fund.
Institutional Review Board Statement
Not applicable.
Informed Consent Statement
Not applicable.
Data Availability Statement
Not applicable.
Conflicts of Interest
The authors declare no conflict of interest.
Abbreviations
The following abbreviations are used in this manuscript:
| GA | Genetic Algorithm |
| SoC | State of Charge |
| CCCV | Constant Current-Constant Voltage |
| FLC | Fuzzy Logic Controller |
| FIS | Fuzzy Inference System |
Appendix A
Table A1.
List of notations.
Table A1.
List of notations.
| Quantity | Description | Unit |
|---|
| Temp | linguistic variable for cell temperature | - |
| Current | linguistic variable for i | - |
| n | number of samples in a measurement | - |
| fuzzy membership value | - |
| i | battery charging current | A |
| battery voltage | V |
| cell temperature | C |
| SoC | state of charge | % |
| R | internal resistance | |
| Q | capacity | Ah |
| battery constant potential | V |
| polarization resistance | |
| polarization coefficient | V/Ah |
| T | the battery internal (cell) temperature | K |
| the ambient temperature | K |
| the thermal time constant, cell to ambient | s |
| the thermal resistance, cell to ambient | K/W |
| the overall heat generated during charge/discharge | W |
| the temperature coefficient | V/K |
| the power loss difference between charge and discharge | W |
| general parameter vector | - |
| estimated parameter vector | - |
| charge time | s |
| temperature difference | C |
| N | number of individuals in the actual generation | - |
| maximal number of individuals in a generation | - |
| G | number of generations | - |
| maximal number of generations | - |
| y | fitness value | - |
References
- Barré, A.; Deguilhem, B.; Grolleau, S.; Gérard, M.; Suard, F.; Riu, D. A review on lithium-ion battery ageing mechanisms and estimations for automotive applications. J. Power Sources 2013, 241, 680–689. [Google Scholar] [CrossRef] [Green Version]
- Nordeloef, A.; Poulikidou, S.; Chordia, M.; Bitencourt de Oliveira, F.; Tivander, J.; Arvidsson, R. Methodological Approaches to End-Of-Life Modelling in Life Cycle Assessments of Lithium-Ion Batteries. Batteries 2019, 5, 51. [Google Scholar] [CrossRef] [Green Version]
- Lin, J.; Liu, X.; Li, S.; Zhang, C.; Yang, S. A review on recent progress, challenges and perspective of battery thermal management system. Int. J. Heat Mass Transf. 2021, 167, 120834. [Google Scholar] [CrossRef]
- Chen, F.; Huang, R.; Wang, C.; Yu, X.; Liu, H.; Wu, Q.; Qian, K.; Bhagat, R. Air and PCM cooling for battery thermal management considering battery cycle life. Appl. Therm. Eng. 2020, 173, 115154. [Google Scholar] [CrossRef]
- Zhang, S.; Zhang, C.; Xiong, R.; Zhou, W. Study on the Optimal Charging Strategy for Lithium-Ion Batteries Used in Electric Vehicles. Energies 2014, 7, 6783–6797. [Google Scholar] [CrossRef] [Green Version]
- Goldar, A.; Romagnoli, R.; Couto, L.D.; Nicotra, M.; Kinnaert, M.; Garone, E. Low-Complexity Fast Charging Strategies Based on Explicit Reference Governors for Li-Ion Battery Cells. IEEE Trans. Control Syst. Technol. 2021, 29, 1597–1608. [Google Scholar] [CrossRef]
- Allafi, W.; Uddin, K.; Zhang, C.; Sha, R.M.R.A.; Marco, J. On-line scheme for parameter estimation of nonlinear lithium ion battery equivalent circuit models using the simplified refined instrumental variable method for a modified Wiener continuous-time model. Appl. Energy 2017, 204, 497–508. [Google Scholar] [CrossRef]
- Pózna, A.; Hangos, K.; Magyar, A. Design of experiments for battery aging estimation. IFAC-PapersOnLine 2018, 51, 386–391. [Google Scholar] [CrossRef]
- Pózna, A.; Hangos, K.; Magyar, A. Temperature Dependent Parameter Estimation of Electrical Vehicle Batteries. Energies 2019, 12, 3755. [Google Scholar] [CrossRef] [Green Version]
- Li, Y.; Li, K.; Xie, Y.; Liu, J.; Fu, C.; Liu, B. Optimized charging of lithium-ion battery for electric vehicles: Adaptive multistage constant current–constant voltage charging strategy. Renew. Energy 2020, 146, 2688–2699. [Google Scholar] [CrossRef]
- Umair Ali, M.; Hussain Nengroo, S.; Adil Khan, M.; Zeb, K.; Ahmad Kamran, M.; Kim, H.J. A Real-Time Simulink Interfaced Fast-Charging Methodology of Lithium-Ion Batteries under Temperature Feedback with Fuzzy Logic Control. Energies 2018, 11, 1122. [Google Scholar] [CrossRef] [Green Version]
- Cheng, Y.S.; Young, C.M.; Liu, Y.H.; Chen, G.J.; Yang, Z.Z. Design and implementation of Li-ion battery charger using state-of-charge estimation with fuzzy temperature control. In Proceedings of the 2015 IEEE International Conference on Industrial Technology (ICIT), Seville, Spain, 17–19 March 2015; pp. 2075–2079. [Google Scholar]
- Xie, Y.; Wang, C.; Hu, X.; Lin, X.; Zhang, Y.; Li, W. An MPC-based control strategy for electric vehicle battery cooling considering energy saving and battery lifespan. IEEE Trans. Veh. Technol. 2020, 69, 14657–14673. [Google Scholar] [CrossRef]
- Hsieh, G.C.; Chen, L.R.; Huang, K.S. Fuzzy-controlled Li-ion battery charge system with active state-of-charge controller. IEEE Trans. Ind. Electron. 2001, 48, 585–593. [Google Scholar] [CrossRef]
- Wang, S.C.; Liu, Y.H. A PSO-based fuzzy-controlled searching for the optimal charge pattern of Li-ion batteries. IEEE Trans. Ind. Electron. 2014, 62, 2983–2993. [Google Scholar] [CrossRef]
- Peng, B.R.; Wang, S.C.; Liu, Y.H.; Huang, Y.S. A Li-ion battery charger based on remaining capacity with fuzzy temperature control. In Proceedings of the 2016 IEEE/ACIS 15th International Conference on Computer and Information Science (ICIS), Okayama, Japan, 26–29 June 2016; pp. 1–5. [Google Scholar]
- Li, Y.; Vilathgamuwa, M.; Wikner, E.; Wei, Z.; Zhang, X.; Thiringer, T.; Wik, T.; Zou, C. Electrochemical Model-Based Fast Charging: Physical Constraint-Triggered PI Control. IEEE Trans. Energy Convers. 2021, 36, 3208–3220. [Google Scholar] [CrossRef]
- Wei, Z.; Quan, Z.; Wu, J.; Li, Y.; Pou, J.; Zhong, H. Deep deterministic policy gradient-DRL enabled multiphysics-constrained fast charging of lithium-ion battery. IEEE Trans. Ind. Electron. 2022, 69, 2588–2598. [Google Scholar] [CrossRef]
- Li, W.; Demir, I.; Cao, D.; Jst, D.; Ringbeck, F.; Junker, M.; Sauer, D.U. Data-driven systematic parameter identification of an electrochemical model for lithium-ion batteries with artificial intelligence. Energy Storage Mater. 2021, 44, 557–570. [Google Scholar] [CrossRef]
- Pózna, A.I.; Magyar, A.; Hangos, K.M. Model identification and parameter estimation of lithium ion batteries for diagnostic purposes. In Proceedings of the 2017 International Symposium on Power Electronics (Ee 2017), Novi Sad, Serbia, 19–21 October 2017; pp. 1–6. [Google Scholar] [CrossRef] [Green Version]
- Tremblay, O.; Dessaint, L.A.; Dekkiche, A.I. A generic battery model for the dynamic simulation of hybrid electric vehicles. In Proceedings of the Vehicle Power and Propulsion Conference (VPPC 2007), Arlington, TX, USA, 9–12 September 2007; pp. 284–289. [Google Scholar]
- Ovejas, V.; Cuadras, A. Effects of cycling on lithium-ion battery hysteresis and overvoltage. Sci. Rep. 2019, 9, 14875. [Google Scholar] [CrossRef]
- Tremblay, O.; Dessaint, L.A. Experimental validation of a battery dynamic model for EV applications. World Electr. Veh. J. 2009, 3, 289–298. [Google Scholar] [CrossRef] [Green Version]
- Shabani, B.; Biju, M. Theoretical modelling methods for thermal management of batteries. Energies 2015, 8, 10153–10177. [Google Scholar] [CrossRef]
- Ljung, L. System Identification; Prentice Hall: Hoboken, NJ, USA, 1999. [Google Scholar]
- Xia, G.; Cao, L.; Bi, G. A review on battery thermal management in electric vehicle application. J. Power Sources 2017, 367, 90–105. [Google Scholar] [CrossRef]
- Mamdani, E.H.; Assilian, S. An experiment in linguistic synthesis with a fuzzy logic controller. Int. J. Man-Mach. Stud. 1975, 7, 1–13. [Google Scholar] [CrossRef]
- Eiben, A.E.; Smith, J.E. Introduction to Evolutionary Computing; Springer: Berlin/Heidelberg, Germany, 2003. [Google Scholar]
- Simscape Version 4.3 (R2017a); The Mathworks, Inc.: Natick, MA, USA, 2017.
- Byrd, R.H.; Hribar, M.E.; Nocedal, J. An interior point algorithm for large-scale nonlinear programming. SIAM J. Optim. 1999, 9, 877–900. [Google Scholar] [CrossRef]
Figure 1.
Equivalent electrical circuit model of the battery. Voltage of the controlled voltage source is different in the case of charge and discharge.
Figure 1.
Equivalent electrical circuit model of the battery. Voltage of the controlled voltage source is different in the case of charge and discharge.
Figure 2.
Membership functions for the input fuzzy sets corresponding to the linguistic variable Temp.
Figure 2.
Membership functions for the input fuzzy sets corresponding to the linguistic variable Temp.
Figure 3.
Membership functions for the input fuzzy sets corresponding to the linguistic variable Current.
Figure 3.
Membership functions for the input fuzzy sets corresponding to the linguistic variable Current.
Figure 4.
Flowchart of the system: N stands for the number of individuals of the current generation. G means the number of the actual generation, while is the maximal number of generations.
Figure 4.
Flowchart of the system: N stands for the number of individuals of the current generation. G means the number of the actual generation, while is the maximal number of generations.
Figure 5.
Each membership function is described by a vector .
Figure 5.
Each membership function is described by a vector .
Figure 6.
In the introduced example the parents are shifted to the two sides in order to visualize the deviation. The fitness value of the better parent is 80% better than that of the worse parent, that is why, the offspring is much closer to the the better parent.
Figure 6.
In the introduced example the parents are shifted to the two sides in order to visualize the deviation. The fitness value of the better parent is 80% better than that of the worse parent, that is why, the offspring is much closer to the the better parent.
Figure 7.
Estimated parameter values after the generation G.
Figure 7.
Estimated parameter values after the generation G.
Figure 8.
The measured battery voltage and the battery model output voltages for the initial parameter set (top) and after the last (sixth) parameter estimation step (bottom).
Figure 8.
The measured battery voltage and the battery model output voltages for the initial parameter set (top) and after the last (sixth) parameter estimation step (bottom).
Figure 9.
Results of the model based simulation for the individual with the worst fitness value (left column) and the individual with the best fitness value (right column).
Figure 9.
Results of the model based simulation for the individual with the worst fitness value (left column) and the individual with the best fitness value (right column).
Figure 10.
Fitness value of the different individuals along the generations. The different colors denote the different generations. The first group is the initial generation with five individuals. In each generation, the individual with the best fitness value is denoted by black filled marker. (five element initial population, , and ).
Figure 11.
The contour lines represent the fitness surface over the plane. The four different colours shows the results of the GA-fuzzy charge controller with four different parameter setups for the number of generations () and the number of individuals per generation (), .
Figure 11.
The contour lines represent the fitness surface over the plane. The four different colours shows the results of the GA-fuzzy charge controller with four different parameter setups for the number of generations () and the number of individuals per generation (), .
Figure 12.
The contour lines represent the fitness surface over the plane for . Blue dots represents the real battery data corresponding to the charge process using the fuzzy charge controller generated in each generation of the genetic algorithm. Square markers denote the performance of the conventional CC-CV charging profiles with 2C, 3C and 4C respectively.
Figure 13.
The contour lines represent the fitness surface over the plane for . Blue dots represents the real battery data corresponding to the charge process using the fuzzy charge controller generated in each generation of the genetic algorithm. Square markers denote the performance of the conventional CC-CV charging profiles with 2C, 3C and 4C respectively.
Figure 14.
The contour lines represent the fitness surface over the plane for . Blue dots represents the real battery data corresponding to the charge process using the fuzzy charge controller generated in each generation of the genetic algorithm. Square markers denote the performance of the conventional CC-CV charging profiles with 2C, 3C and 4C respectively.
Table 1.
Parameters of the FIS.
Table 1.
Parameters of the FIS.
| Parameter | Value |
|---|
| And method | Min |
| Or method | Max |
| Implication | Min |
| Aggregation | Max |
| Defuzzification | Centroid |
Table 2.
The rule base of the FIS consists of the following four IF-THEN rules.
Table 2.
The rule base of the FIS consists of the following four IF-THEN rules.
| Rule | Temp | Current |
|---|
| 1 | Low | High |
| 2 | Med | Med |
| 3 | High | Low |
| 4 | Over | Zero |
Table 3.
Structure of the chromosome.
Table 3.
Structure of the chromosome.
| Gene | Description | Involved In |
|---|
| Temp.Low | fuzzy membership function | Crossover, Mutation |
| Temp.Med | fuzzy membership function | Crossover, Mutation |
| Temp.High | fuzzy membership function | Crossover, Mutation |
| Current.Low | fuzzy membership function | Crossover, Mutation |
| Current.Med | fuzzy membership function | Crossover, Mutation |
| Current.High | fuzzy membership function | Crossover, Mutation |
| charge current timeseries | Fitness evaluation, Selection |
| cell temperature timeseries | Fitness evaluation, Selection |
Table 4.
Nominal parameters of the simulated Li-ion battery.
Table 4.
Nominal parameters of the simulated Li-ion battery.
| Parameter | Value | Unit |
|---|
| 298.15 | K |
| 288.15 | K |
| 3.4511 | V |
| 0.014 | |
| 2.3 | Ah |
| 0.001 | |
| 0.001 | V/Ah |
| A | 0.3499 | V |
| B | 26.5487 | Ah−1 |
| 0.0189 | V/K |
| 0.0037 | Ah/K |
| 329.915 | K |
| 329.915 | K |
| 1364.9 | K |
| 30 | W |
| 500 | s |
| 0.05 | K/W |
Table 5.
The membership functions of the initial population elements. The triangular membership functions are represented by three dimensional vectors (see
Figure 5).
Table 5.
The membership functions of the initial population elements. The triangular membership functions are represented by three dimensional vectors (see
Figure 5).
| Chromosome | Fuzzy set | A | B | C |
|---|
| 1 | Temp.Low | 12.7963 | 16.5563 | 20.3463 |
| 1 | Temp.Med | 17.5226 | 21.0126 | 24.8126 |
| 1 | Temp.High | 21.1951 | 24.8951 | 28.5951 |
| 1 | Current.Low | −0.1801 | 2.0370 | 4.1970 |
| 1 | Current.Med | 3.4253 | 5.6573 | 7.8123 |
| 1 | Current.High | 6.9476 | 9.1826 | 11.2576 |
| 2 | Temp.Low | 11.3729 | 15.1329 | 18.9229 |
| 2 | Temp.Med | 15.2393 | 18.7293 | 22.5293 |
| 2 | Temp.High | 18.3727 | 22.0727 | 25.7727 |
| 2 | Current.Low | 1.2363 | 3.4535 | 5.6135 |
| 2 | Current.Med | 4.3556 | 6.5876 | 8.7426 |
| 2 | Current.High | 7.6242 | 9.8592 | 11.9342 |
| 3 | Temp.Low | 13.3391 | 17.0991 | 20.8891 |
| 3 | Temp.Med | 17.1737 | 20.6637 | 24.4637 |
| 3 | Temp.High | 19.8315 | 23.5315 | 27.2315 |
| 3 | Current.Low | 1.2363 | 3.4535 | 5.6135 |
| 3 | Current.Med | 4.3556 | 6.5876 | 8.7426 |
| 3 | Current.High | 7.6242 | 9.8592 | 11.9342 |
| {4,5} | Temp.Low | 13.6245 | 17.3845 | 21.17455 |
| {4,5} | Temp.Med | 16.6663 | 20.1563 | 23.9563 |
| {4,5} | Temp.High | 18.9435 | 22.6435 | 26.3435 |
| 4 | Current.Low | 1.2363 | 3.4535 | 5.6135 |
| 4 | Current.Med | 4.3556 | 6.5876 | 8.7426 |
| 4 | Current.High | 7.6242 | 9.8592 | 11.9342 |
| 5 | Current.Low | 0.4117 | 2.6289 | 4.7889 |
| 5 | Current.Med | 3.3408 | 5.5728 | 7.7278 |
| 5 | Current.High | 7.6242 | 9.8592 | 11.9342 |
Table 6.
The attributes of the initial population. This pool is the jumping-off place of the entire population.
Table 6.
The attributes of the initial population. This pool is the jumping-off place of the entire population.
| Chromosome | [s] | [°C] |
|---|
| 1 | 883 | 3.1710 |
| 2 | 1005 | 3.0449 |
| 3 | 868 | 3.1769 |
| 4 | 896 | 3.1450 |
| 5 | 1007 | 3.0161 |
| Publisher’s Note: MDPI stays neutral with regard to jurisdictional claims in published maps and institutional affiliations. |
© 2022 by the authors. Licensee MDPI, Basel, Switzerland. This article is an open access article distributed under the terms and conditions of the Creative Commons Attribution (CC BY) license (https://creativecommons.org/licenses/by/4.0/).


