1. Introduction
Over dozens of years, we have observed the constant growth of energy consumption, which has simultaneously increased greenhouse gas emissions [
1], causing global warming. Therefore, the academic sector has performed numerous researches focused on the widely understood environmental protection. Presently, there are numerous long-term strategies for providing a more sustainable environment in the future, among which the most ambitious plan is probably the EU strategy towards an environmental-neutral society by 2050 [
2]. The building sector has a crucial role in setting actions towards a sustainable future: buildings (both residential and commercial) are responsible for approximately one-third of energy consumption and approximately 40% of greenhouse gas (GHG) emissions [
1,
3]. Therefore, all the actions related to the energy transformation of the building sector should focus on both newly constructed and existing buildings, where modernizations of existing buildings are significantly more important. The best results can be obtained by combining deep building refurbishments with the usage of renewable energy sources (RES). Buildings with properly insulated enclosures, highly efficient appliances, especially heating, ventilation and air conditioning (HVAC) and domestic hot water (DHW) systems, and effective RES are a basis towards sustainable houses. All the above-mentioned actions can be implemented from a single building scale into a cluster-level, thus, they can be used for an analysis of a built environment. The development of an area, consisting of numerous buildings, can be analyzed using the energy cluster (EC) or, more precisely, the building energy cluster (BEC) concept [
4]. An EC can be defined as an agreement, on a restricted area, which provides the overall improvement of energy efficiency of the region, while the basis for any BEC is that the examined EC consist of buildings. BEC is a sustainable approach for urban energy modelling (UEM), allowing us to develop smart city regions, following the energy flexible building clusters (EFBC) idea [
5]. This concept has already been applied in some residential city scale clusters, e.g.,
Smart Grid Gotland [
6] or
Fujisawa Sustainable Smart Town [
7]. Moreover, due to the wide range and flexibility of potential actions within EC fields (see
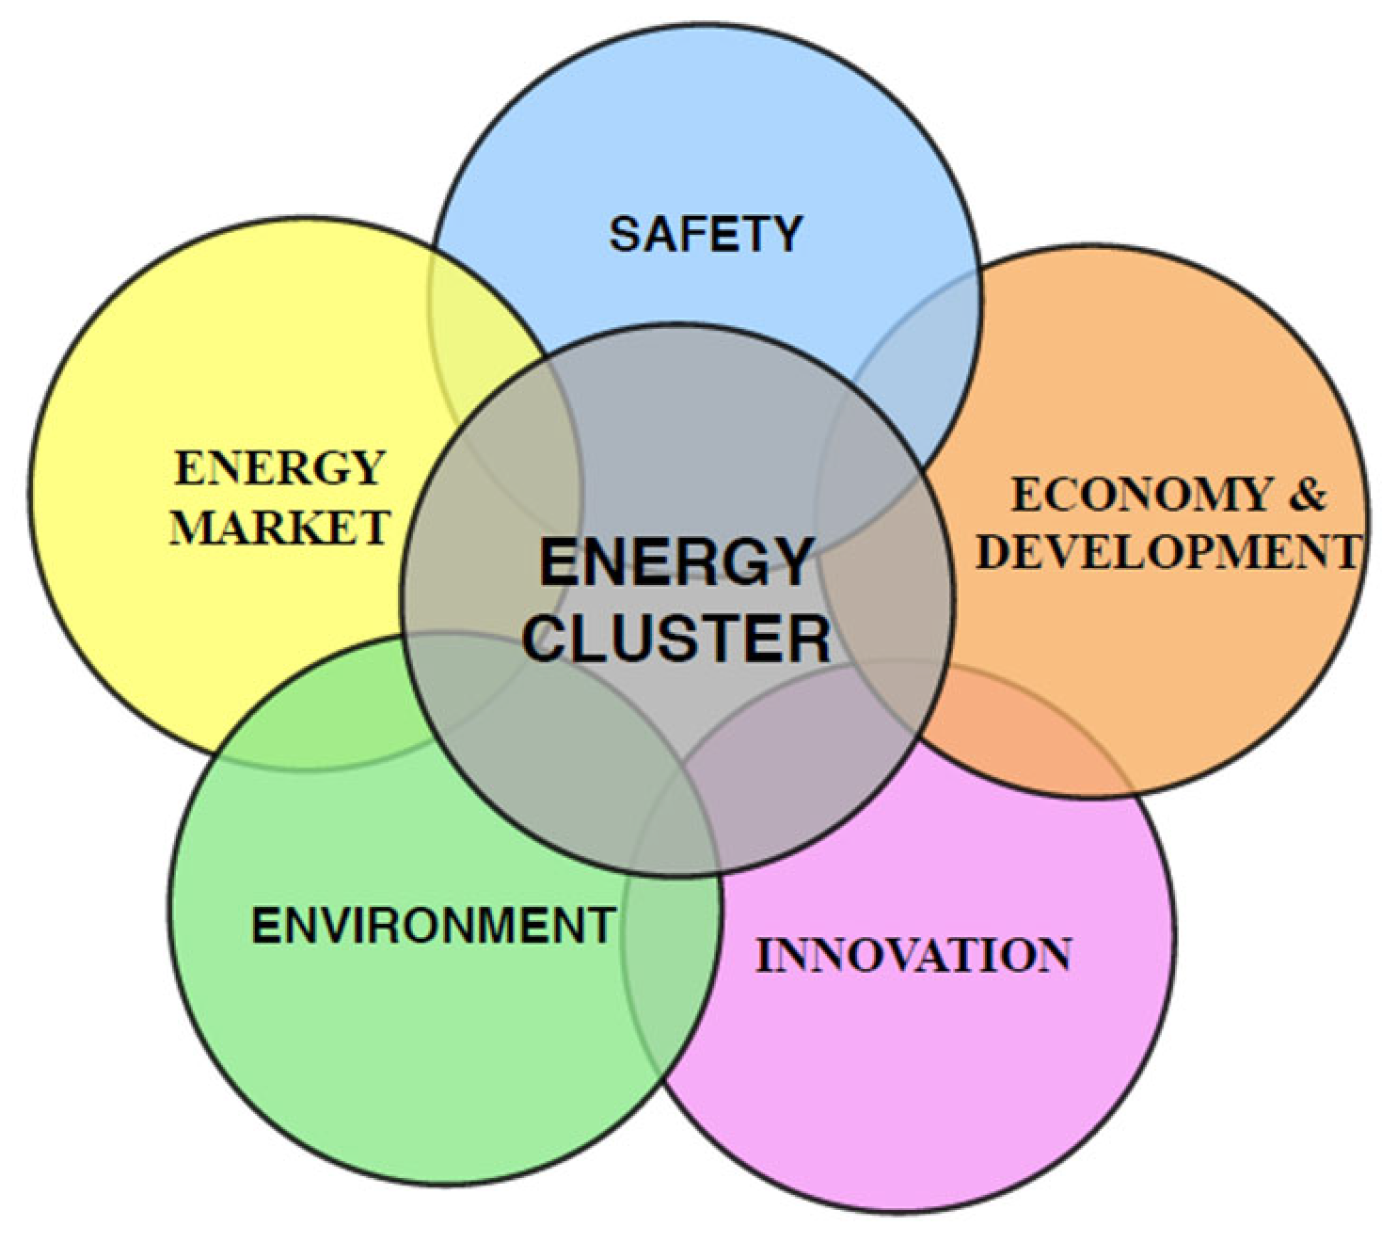
Figure 1), when an exemplary neighborhood is focused on electricity production out of the photovoltaics (PV), it can thus be considered as a solar cluster. Concluding all of the above-mentioned information, the EC concept is a universal approach for UEM, which might be an efficient method for the necessary modernization of the building sector.
Various computational studies have focused on different levels/scales of analysis, but it seems essential to shift from building scale analyses [
9] to the neighborhood scale [
10]. Software for energy-related analyses of a single building (e.g.,
Energy Plus [
11]) are presently substituted by tools for urban building energy models (UBEM). The UBEM can be a helpful approach applied to support the development of urban sustainability. There are two main types of UBEM, accordingly
top-down and
bottom-up techniques, with further, more comprehensive divisions. The overview of all UBEM techniques can be found in [
12], while some exemplary computational tools are presented in [
13]. One of the most interesting and promising works following the UBEM concept is focused on an analysis of a Swiss village, consisting of 150 buildings [
14]. The authors developed software allowing them to examine electricity and heat consumption within the investigated area. In 2019, the research was continued; it is focused on energy-related predictions for the examined village for the years 2030 and 2050 [
15]. Another interesting work was published in 2020, which focused on urban heat island (UHI) analysis using the BEC concept [
16]. Some other interesting studies, using the UBEM approach, are described in [
17].
Despite the growing popularity of the UBEM studies, the list of valuable computer tools is limited. In this paper, the
Computer Tool for Energy Efficiency Analysis of an Energy Cluster (TEAC) software is used. Each of the UBEM software has some advantages and disadvantages. The information presented in
Table 1 shows the comparison between the TEAC software and some of the most popular computer tools applied for UBEM studies, accordingly the
CitySim [
18], the
Urban Modelling Interface—UMI [
19] and the
City Building Energy Saver—CityBES [
20]. A comprehensive overview of some UBEM computer tools can be found in [
13]. Their users can choose the best software for their aims based on the information of what is available and possible to analyze with the different computer tools applied for UBEM.
Presently, the integration of RES into a building is an essential practice towards the sustainable built environment [
4]. Wind and water energy systems are regularly used as a support supply for local/national power systems, while solar energy and ground heat constitute the basis of the distributed energy structure. Solar energy can be used in a passive or active way [
21]. The passive solar systems are related to the building design [
22], while the active ones use appliances allowing the harvesting of energy out of the solar radiation [
23]. Presently, it is popular to use either solar collectors (SC) or PVs in order to harvest heat energy or electricity, accordingly. SCs usually supply heating or DHW systems [
24], while PVs have various applications [
25] due to the fact that electricity is a universal ‘fuel’. Sometimes, both systems are used simultaneously; nevertheless, the development of solar technology already provides a hybrid solution named photovoltaic thermal solar collector (PVT) [
26,
27]. Some novel approaches of solar energy application into buildings are bound with the ability to charge electric vehicles [
28]. Then, it is profitable to analyze PVs at a cluster level [
29,
30,
31] in order to estimate the solar potential at a local scale. The so-called solar clusters are, in fact, a kind of distributed energy system, which might be considered as a necessary factor in the national power system transformation towards a greener, more sustainable form.
This paper is focused on the UBEM of an actual suburban residential neighborhood in Poland, consisting of hundreds of single-family houses. In this study, the EC concept is applied to the suburban area, thus, the examined neighborhood is analyzed as a BEC. In this work, most attention is put on the modernization of the cluster, including the application of solar energy. These types of studies are characterized by a huge complexity, therefore, the TEAC software [
8] is used for all of the calculations performed. The TEAC software is a home-developed computer tool allowing us to perform various energy-, economic- and environmental-related analyses of the Polish residential sector (see more in
Section 2.1). Some other applications of the TEAC software can be found in [
32,
33,
34,
35]. This study shows that the TEAC software is a valuable computer tool for UBEM applications. In this work, the cluster modernization provides a full electrification of the buildings making up the examined neighborhood. It is shown that the proposed modernizations are not only energy-efficient approaches but also environmentally friendly practices. Additionally, from the presented results, it can be seen that the EC concept is a valuable approach towards the development of energy independent and environmentally-neutral urban scale areas. In addition, this study follows the sustainable development paradigm concerning the United Nations 17 sustainable goals [
36]; these are focused on objectives of affordable and clean energy, sustainable cities and communities, as well as climate actions.
The residential sector of Poland consists mostly of single-family houses, which represent approximately 91% of all dwellings [
37]. Approximately 67% of all Polish single-family houses were constructed before 1985 [
37] and, unfortunately, about 70% of them have insufficient thermal insulation [
38]. Thus, the Polish single-family house sector is characterized by a high energy demand. It is estimated that the total amount of approximately PLN 78,000 million (i.e., approximately USD 19,000 million) has to be invested in order to ensure a high energy efficiency level of the national single-family building sector [
39]. Considering all the above-mentioned information, the thermal modernization of the Polish single-family house sector is analyzed in this work. The Polish building typology was developed by the
National Energy Conservation Agency (pol.
Narodowa Agencja Poszanowania Energii, NAPE) and published in the
TABULA scientific report [
40], which was a part of the European project
ERISCOPE launched in 2013 [
41]. The proposed typology is based on the national household sector data, i.e., energy performance certificates (EPC), considering buildings before thermal modernizations only. For the Polish single-family stock, seven representative (average) single-family houses (RSFHs) were defined. Those houses are composed of the most typical elements in the defined building types; they are developed to be used to analyze the impact of the proposed modernizations for the existing Polish single-family houses. The RSFHs of Poland are characterized by different construction periods and their various building parameters, as shown in
Table 2. The oldest group of buildings were defined as those built before 1945, while the newest were constructed after 2009. There is a clear trend, in that, the newer the building is, the larger it is, it has a higher window share, and it has better overall energy characteristics. Therefore, the newer the house, the more energy efficient it is. Moreover, each of the RSFHs has a gable roof with a defined inclination and total area; those parameters are extremely important for studies of roof-mounted PV systems.
This paper consists of four sections, accordingly, introduction, research design and methodology, results and discussion, and conclusions, as well as references. The first section shows a brief overview of the motivations of this study. In
Section 2, the research design and applied methodology are presented including the list of assumptions. Additionally, in
Section 2.1 the examined case study is presented. The results of the performed analysis are shown and discussed in the third section. Finally, our work outcomes are summarized in
Section 4.
2. Research Design and Methodology
In this section, a brief description of the procedure used to develop the TEAC software is presented. Then, the application of the TEAC software for the examined case study is shown. Finally, the overview of the examined neighborhood is presented in
Section 2.1.
The TEAC is a computational tool allowing us to perform UEM analyses of BEC areas. The TEAC software is suitable for Polish residential building stock studies, based on the single-family houses typology. The TEAC software uses a hybrid approach of the UBEM, combining the
bottom-up and
top-down models [
12]. The software is based on the statistical data referring to the Polish household sector, as well as using AI (by means of ANN) for heating demand predictions. This home-developed tool allows analyzing areas consisting of numerous buildings. Moreover, even though the examined residential areas are characterized by a huge complexity, the calculation time is very fast due to the ANN application. One of the biggest advantages of the TEAC software is the relatively small amount of the necessary input data. Those obligatory inputs are as follows: the analysis timestep, outdoor temperature, total hourly solar radiation, building heating area, building volume, total windows area, air-change rate, U-values of exterior walls, roofs, ground floors and windows, heating system efficiency, as well as the building orientation and closest surrounding variant. The network was developed in three variants, for hourly, daily and monthly predictions. The developed tool was coded using the
Python [
42] programming language, including application of the
MATLAB [
43] software during the ANN definition and training process. The TEAC software [
8] consists of four main modules and seven submodules; the solar energy module is presented more in detail in this section. The purposes of the main software modules are area definition (its size, buildings distribution etc.), ANN application (for heating demand prediction), supplementary results calculation and output generation. Additionally, there is one more external module, which allows us to implement mechanisms of the active demand side management (DSM). It enables analyses of the RES, including the application of batteries, following various prosumer strategies. A comprehensive description of the TEAC software can be found in [
30].
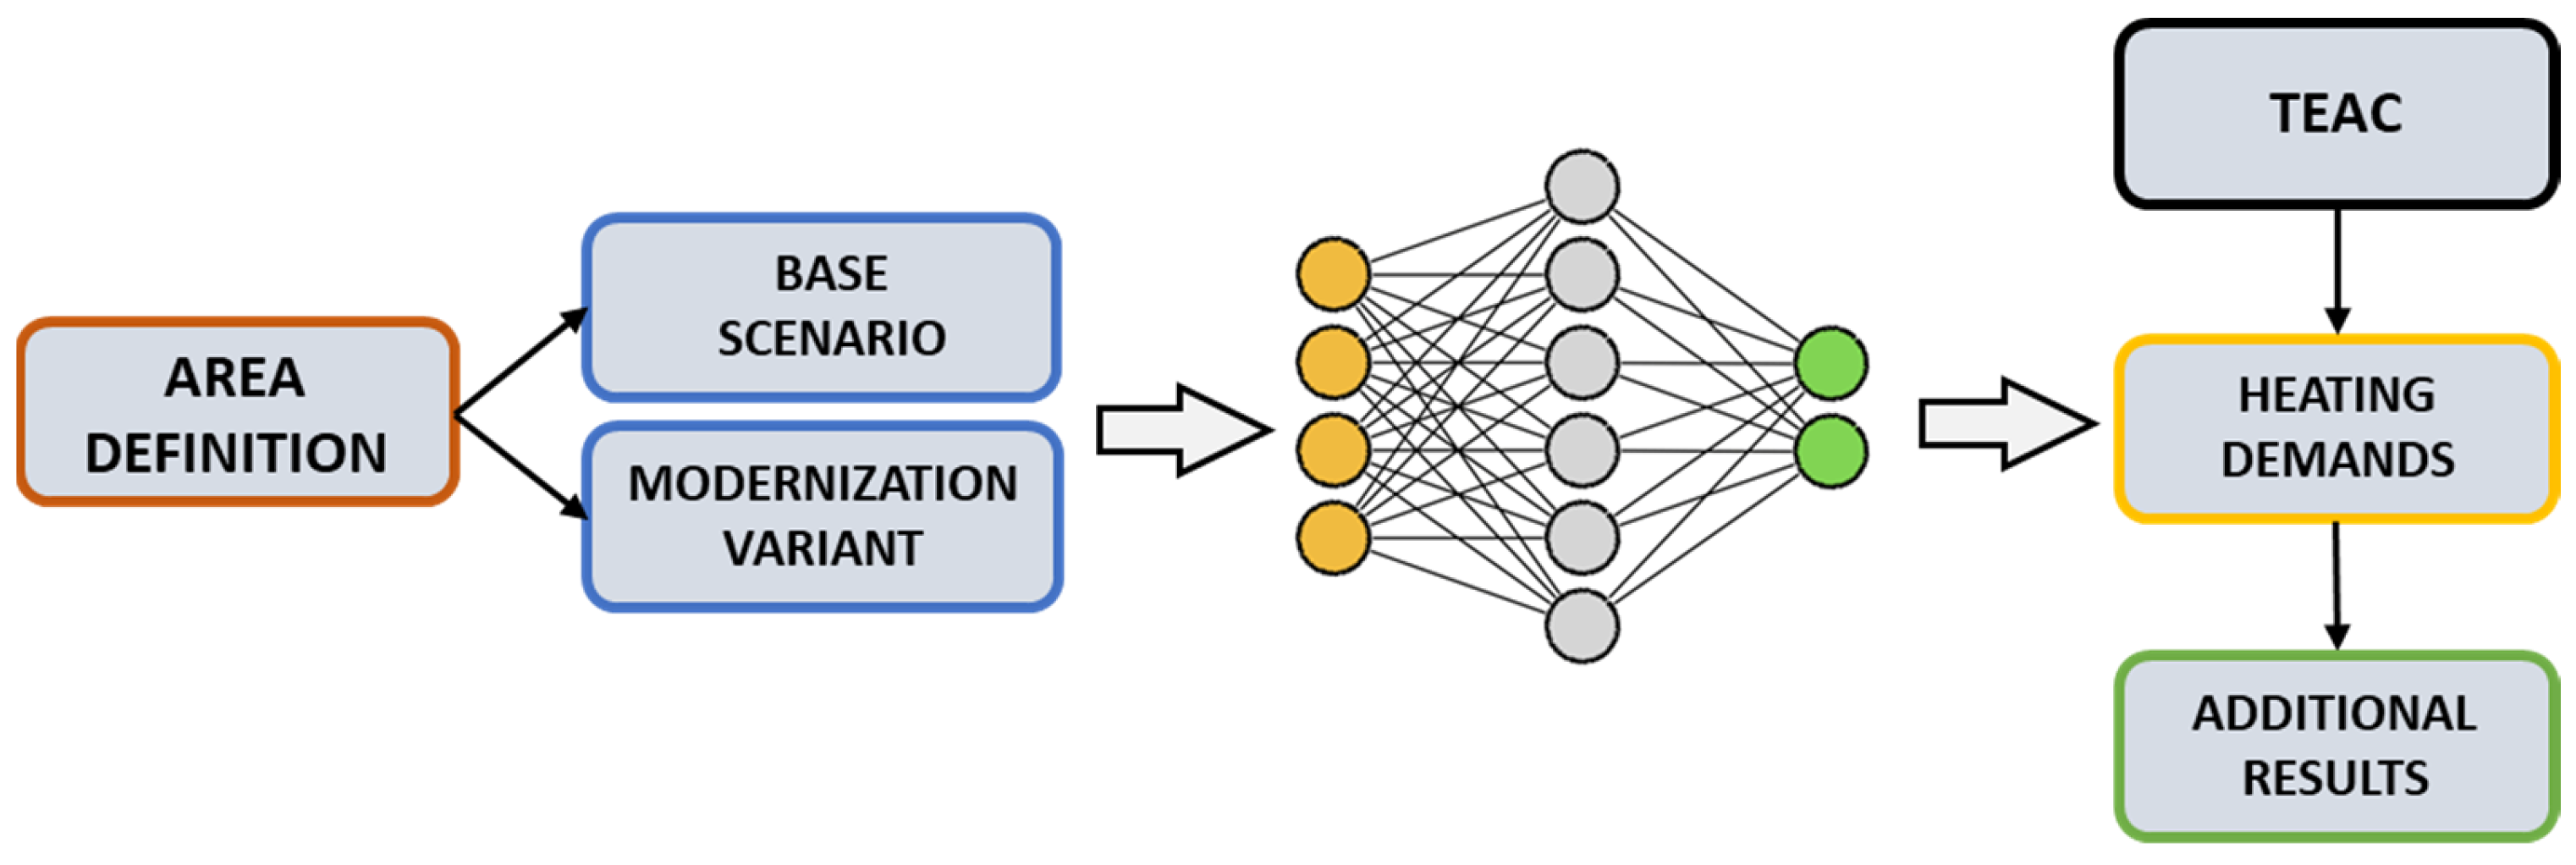
The TEAC software was developed using a procedure that has several steps. Some of them were performed just once (during the development process), some were repeated if necessary (gathering some additional data), and the others were repeated for each study (the actual usage of the TEAC software). The schema of the TEAC software application is shown in
Figure 2. The ANN used in the software was trained with the results of 358,400 simulations, performed with the
Energy Plus software for the Polish representative single-family houses (RSFH), in some selected locations and with various orientations, using the hourly calculation step. The total computing time lasted about 51 days. The defined database can be freely extended in the future if needed. The ANN application is presently a popular approach of UBEM [
44,
45]. The ANN in the TEAC software allows for heating demand predictions of buildings constituting the analyzed BEC. The trained ANN was validated in detail; the results are presented in our previous work—see Figures 4 and 5, as well as Table 1 in [
35]. A satisfactory match was observed comparing the predictions with the
Energy Plus outputs (the base results) by means of the correlation coefficient. Additionally, the validation proved that the TEAC software is able to predict a heating demand correctly, especially during meaningful moments (e.g., peak demands). The applied procedure, as well as the defined ANN itself, is comprehensively described in [
8,
35]. Using the TEAC software it is possible to define a residential area following the BEC concept. The software allows for various energy-, economic- and environmental-related analyses of the residential building cluster. Using the TEAC software we can analyze heating and electricity demands by means of load duration curves (LDC), various maps, economic assessments using different methods (e.g., life cycle costing, LCC), or environmental aspects expressed by the different GHG emissions.
The application of RES within the examined residential cluster is the main aim of this work; thus, the methodology of solar and wind energy usage is described in more detail. The wind module estimates the electricity production from the wind turbines, based on the fundamentals of
Betz’s law [
46]. It is possible to analyze home-applied vertical-axis wind turbines (VAWT), as well as industrial horizontal-axis wind turbines (HAWT), both onshore and offshore types. All the turbines available in the TEAC software are described with technical data of the commercially available products. The solar module examines the potential electricity generation out of the PVs, following the Isotropic Radiation Model (IRM) [
21], proposed in 1942 by
Hottel and
Woertz [
47]. The IRM is described with the following equation
where I
c(t) is the solar irradiation, I
b(t) is the beam radiation, I
d(t) is the diffuse radiation (all at a given hour), R
b(t) the correction factors for beam at a given time, diffuse (R
d) and reflected (R
r) radiations, as well as surface reflectance (ρ
o). The R
b can be described using a complex function of the latitude (φ), tilt angle (β), solar azimuth angle (γ), declination (δ) and solar angle (ω), as shown below.
All solar calculations are performed for the so-called Solar Window (SW) time span. The SW occurs from 9 a.m. to 3 p.m., when solar irradiation is the highest. Nevertheless, it is a common practice to extend the SW time spa-n during the summer months, as was assumed in the TEAC software. For January, February, March, October, November and December the standard SW period is assumed (9 a.m.–3 p.m.). For April, May and September the time gap is extended from 8 a.m. to 4 p.m.. Finally, for the summer months (June, July and August), SW time span is assumed from 6 a.m. to 4 p.m.. Moreover, there are several assumptions set in order to define the most profitable placement of PV panels. Whenever the roof surface is oriented north, north-east or north-west, PV application on these surfaces is aimless. Moreover, appropriate placement of the PV panels on available roof area is considered, by means of panel size, not only a total area of the arrangement. From the technical parameters of the applied PVs, the panel efficiency, its peak power, as well as length and width, need to be defined.
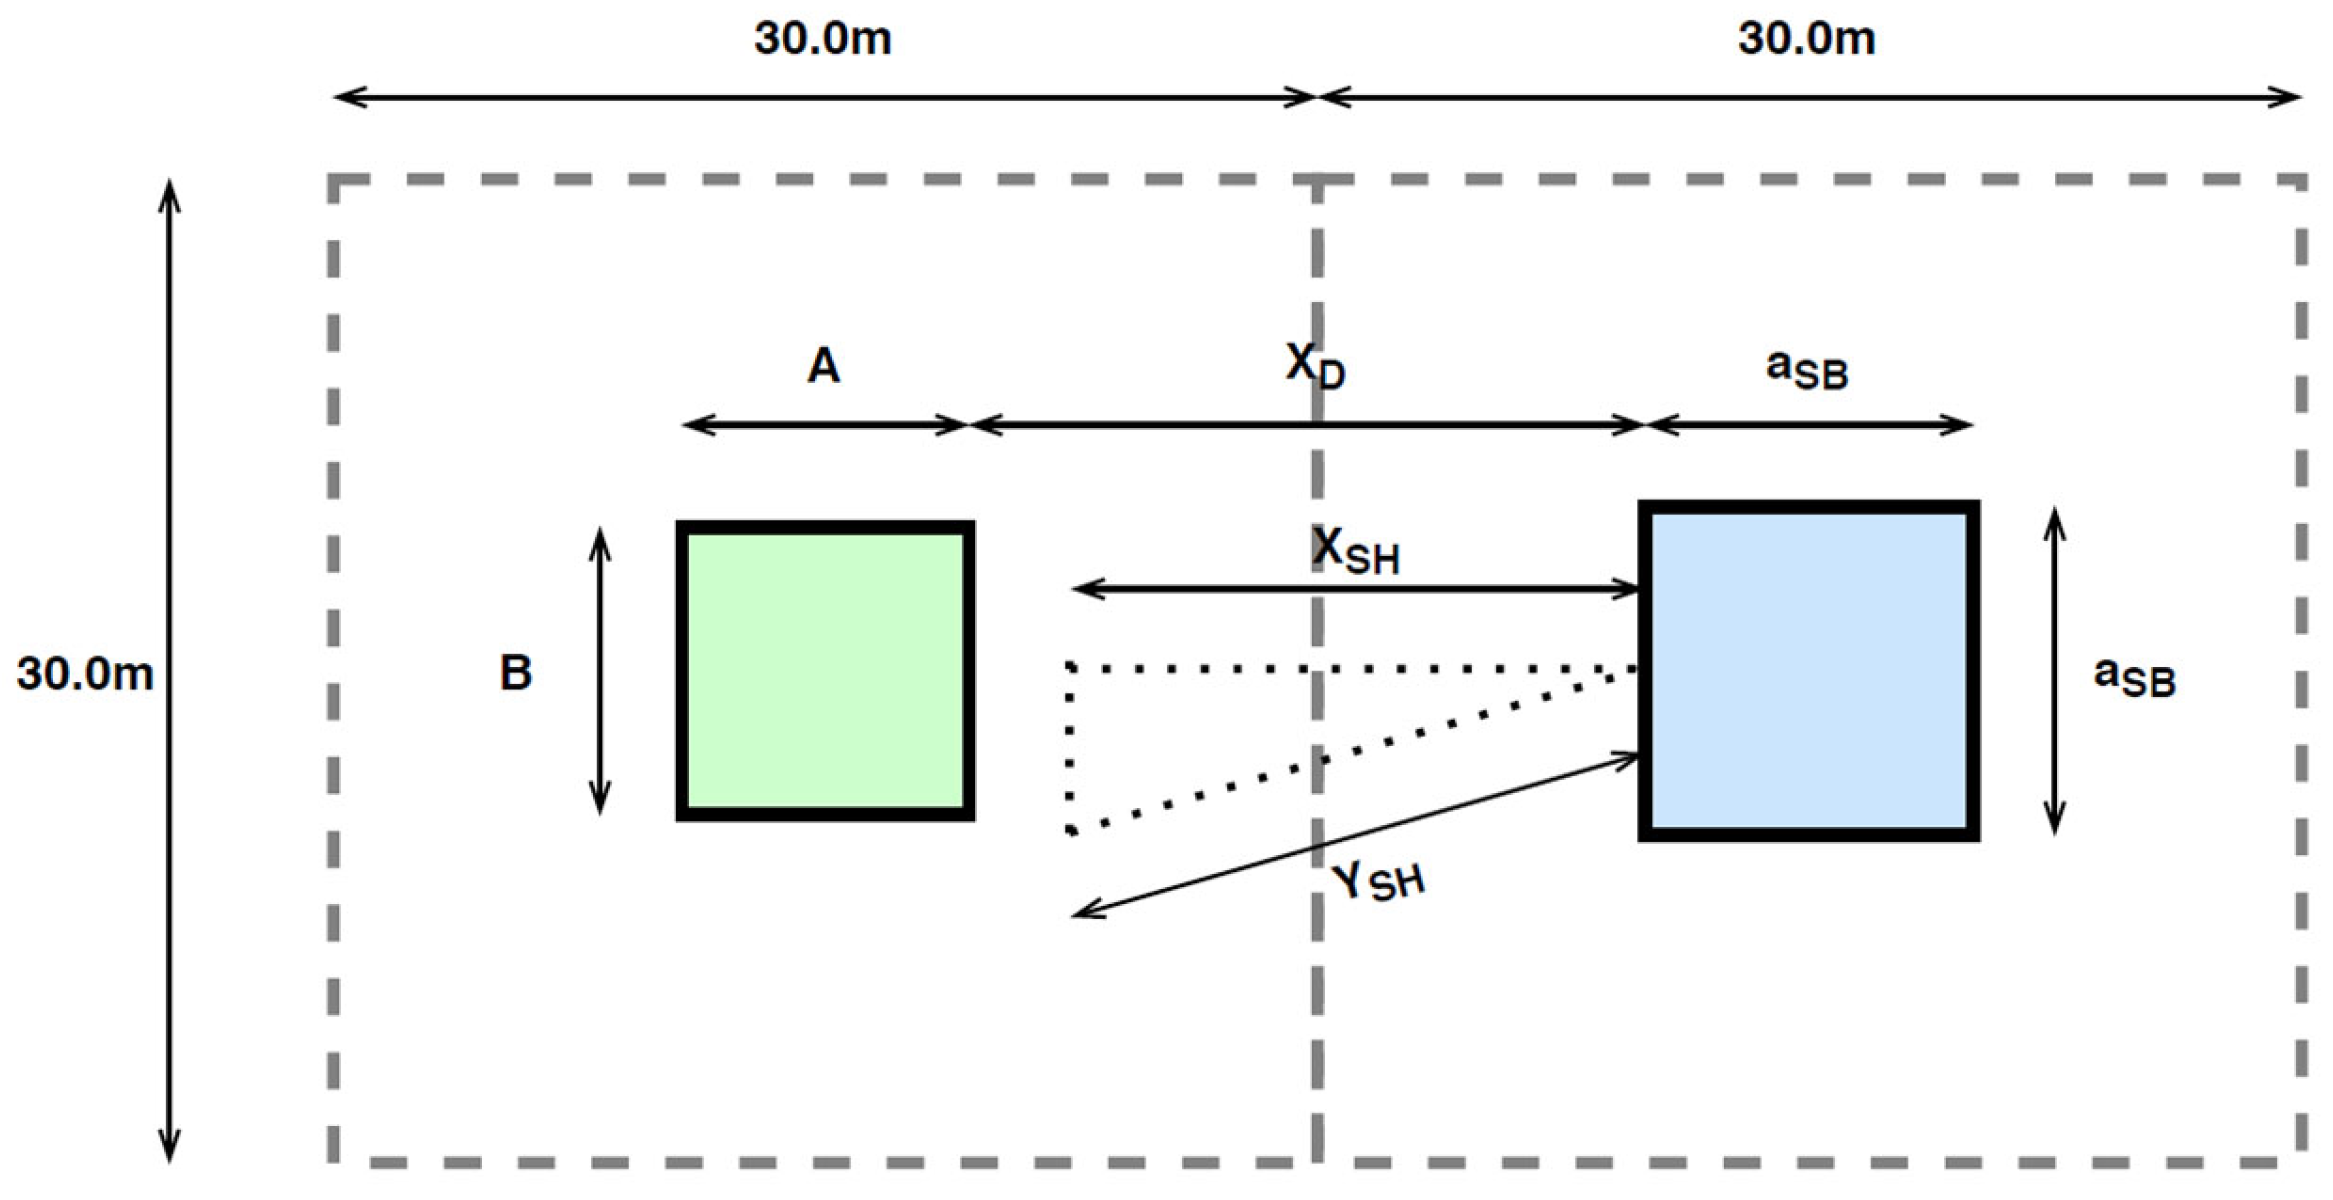
Additionally, the solar energy is analyzed, including not only the localization (climate) impact but also the built environment: the shading impact from the closest surrounding (contiguous buildings) is included in calculations, as shown in
Figure 3.
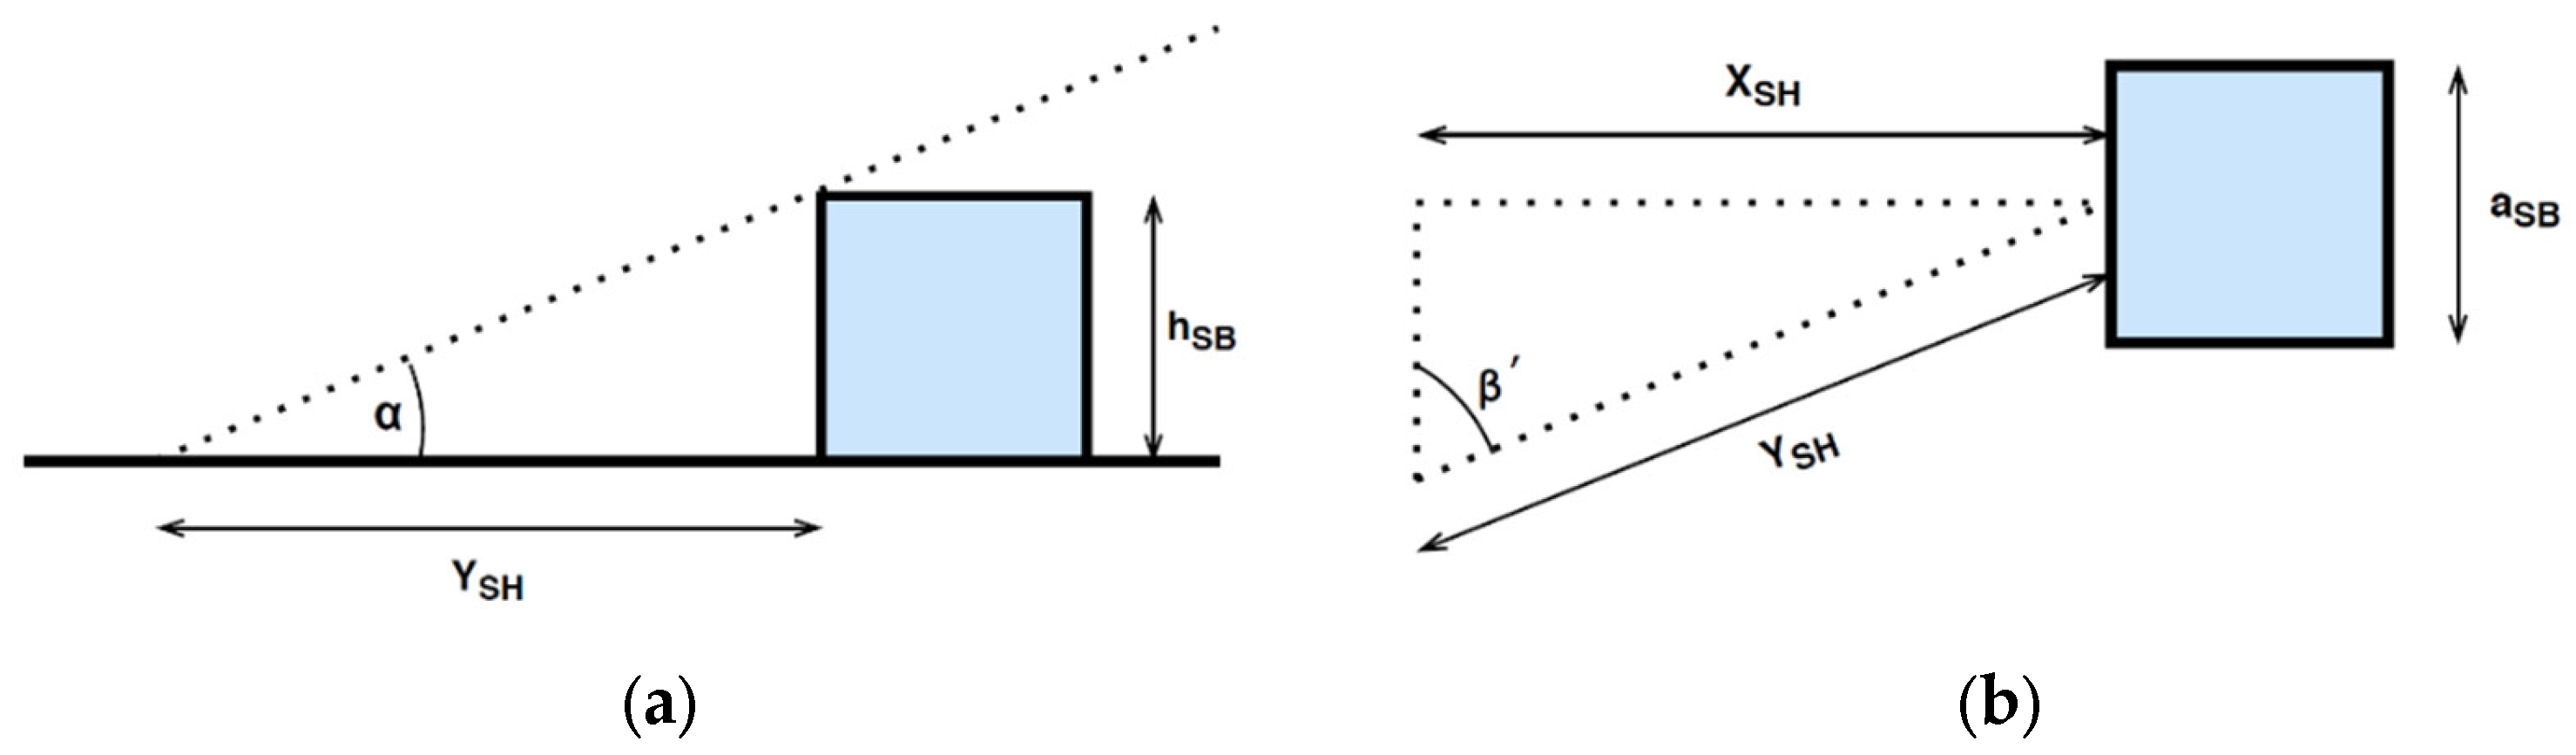
The shading impact is examined based on the sun positioning or, more precisely, on its elevation; the worst-case scenario is observed during the winter solstice. The procedure below is used in order to examine shading impact on solar systems. Firstly, the shading length out of the solar positioning (Y
SH) is defined using the below relationship
where α is the attitude angle and h
SB is the obstacle height. Secondly, shading based on the solar azimuth angle (X
SH) is examined using the following equation
where β′ is an angle expressing a difference between 90 degrees and the γ. Using Equation (3), Equation (4) can be rewritten as follows
Both shading lengths (X
SH and Y
SH) are shown in
Figure 4 to illustrate an exemplary scenario. If X
SH is greater than the distance between the building and an obstacle (X
D), the solar outputs are equal to zero for the considered hour. The X
D is easy to calculate because both the building and obstacle positioning on each parcel is known. The abovementioned analysis is performed for all obstacles in east, south or west from the analyzed building. The obstructions such as trees or natural hills are not included in the TEAC software.
Figure 4.
Schema of shading calculations: (a) vertical view; (b) horizontal view.
Figure 4.
Schema of shading calculations: (a) vertical view; (b) horizontal view.
The analyzed area was defined using the geographical distribution, based on the satellite image of the examined region. The predefined grid of cells was used, where each cell represents a single parcel of the most typical dimensions in Poland, 30 m × 30 m, where only a single house can be assigned to each cell (always placed in its middle). Due to the fact that the actual residential area was examined, the manual building definition was used, in order to select which cells are occupied. Building orientations were assumed randomly, while the distribution of the RSFH types followed the national statistics. The area is defined using the local coordinates of each building (within the examined area), and the basic information expressing the applied type of the RSFH. Then, information about building energy profiles are required; in this study, two variants were considered for the input set of data: base scenario and after deep building refurbishment. All other modernizations, e.g., lighting system upgrade or PVs applications, were considered after heating demand predictions. These are performed by the input of necessary parameters; for this study, the same assumptions were considered for all buildings consisting of the examined cluster (e.g., PVs parameters). The supplementary results are obtained basically executing the submodules of the TEAC software; calculations are performed using already obtained and saved outputs. Presently the TEAC software has no graphical user interface (GUI), therefore, it is planned to develop a GUI in the near future.
2.1. The Nowosolan Neighborhood Case Study
The examined zone is located in Lodz; it is a suburban neighborhood called
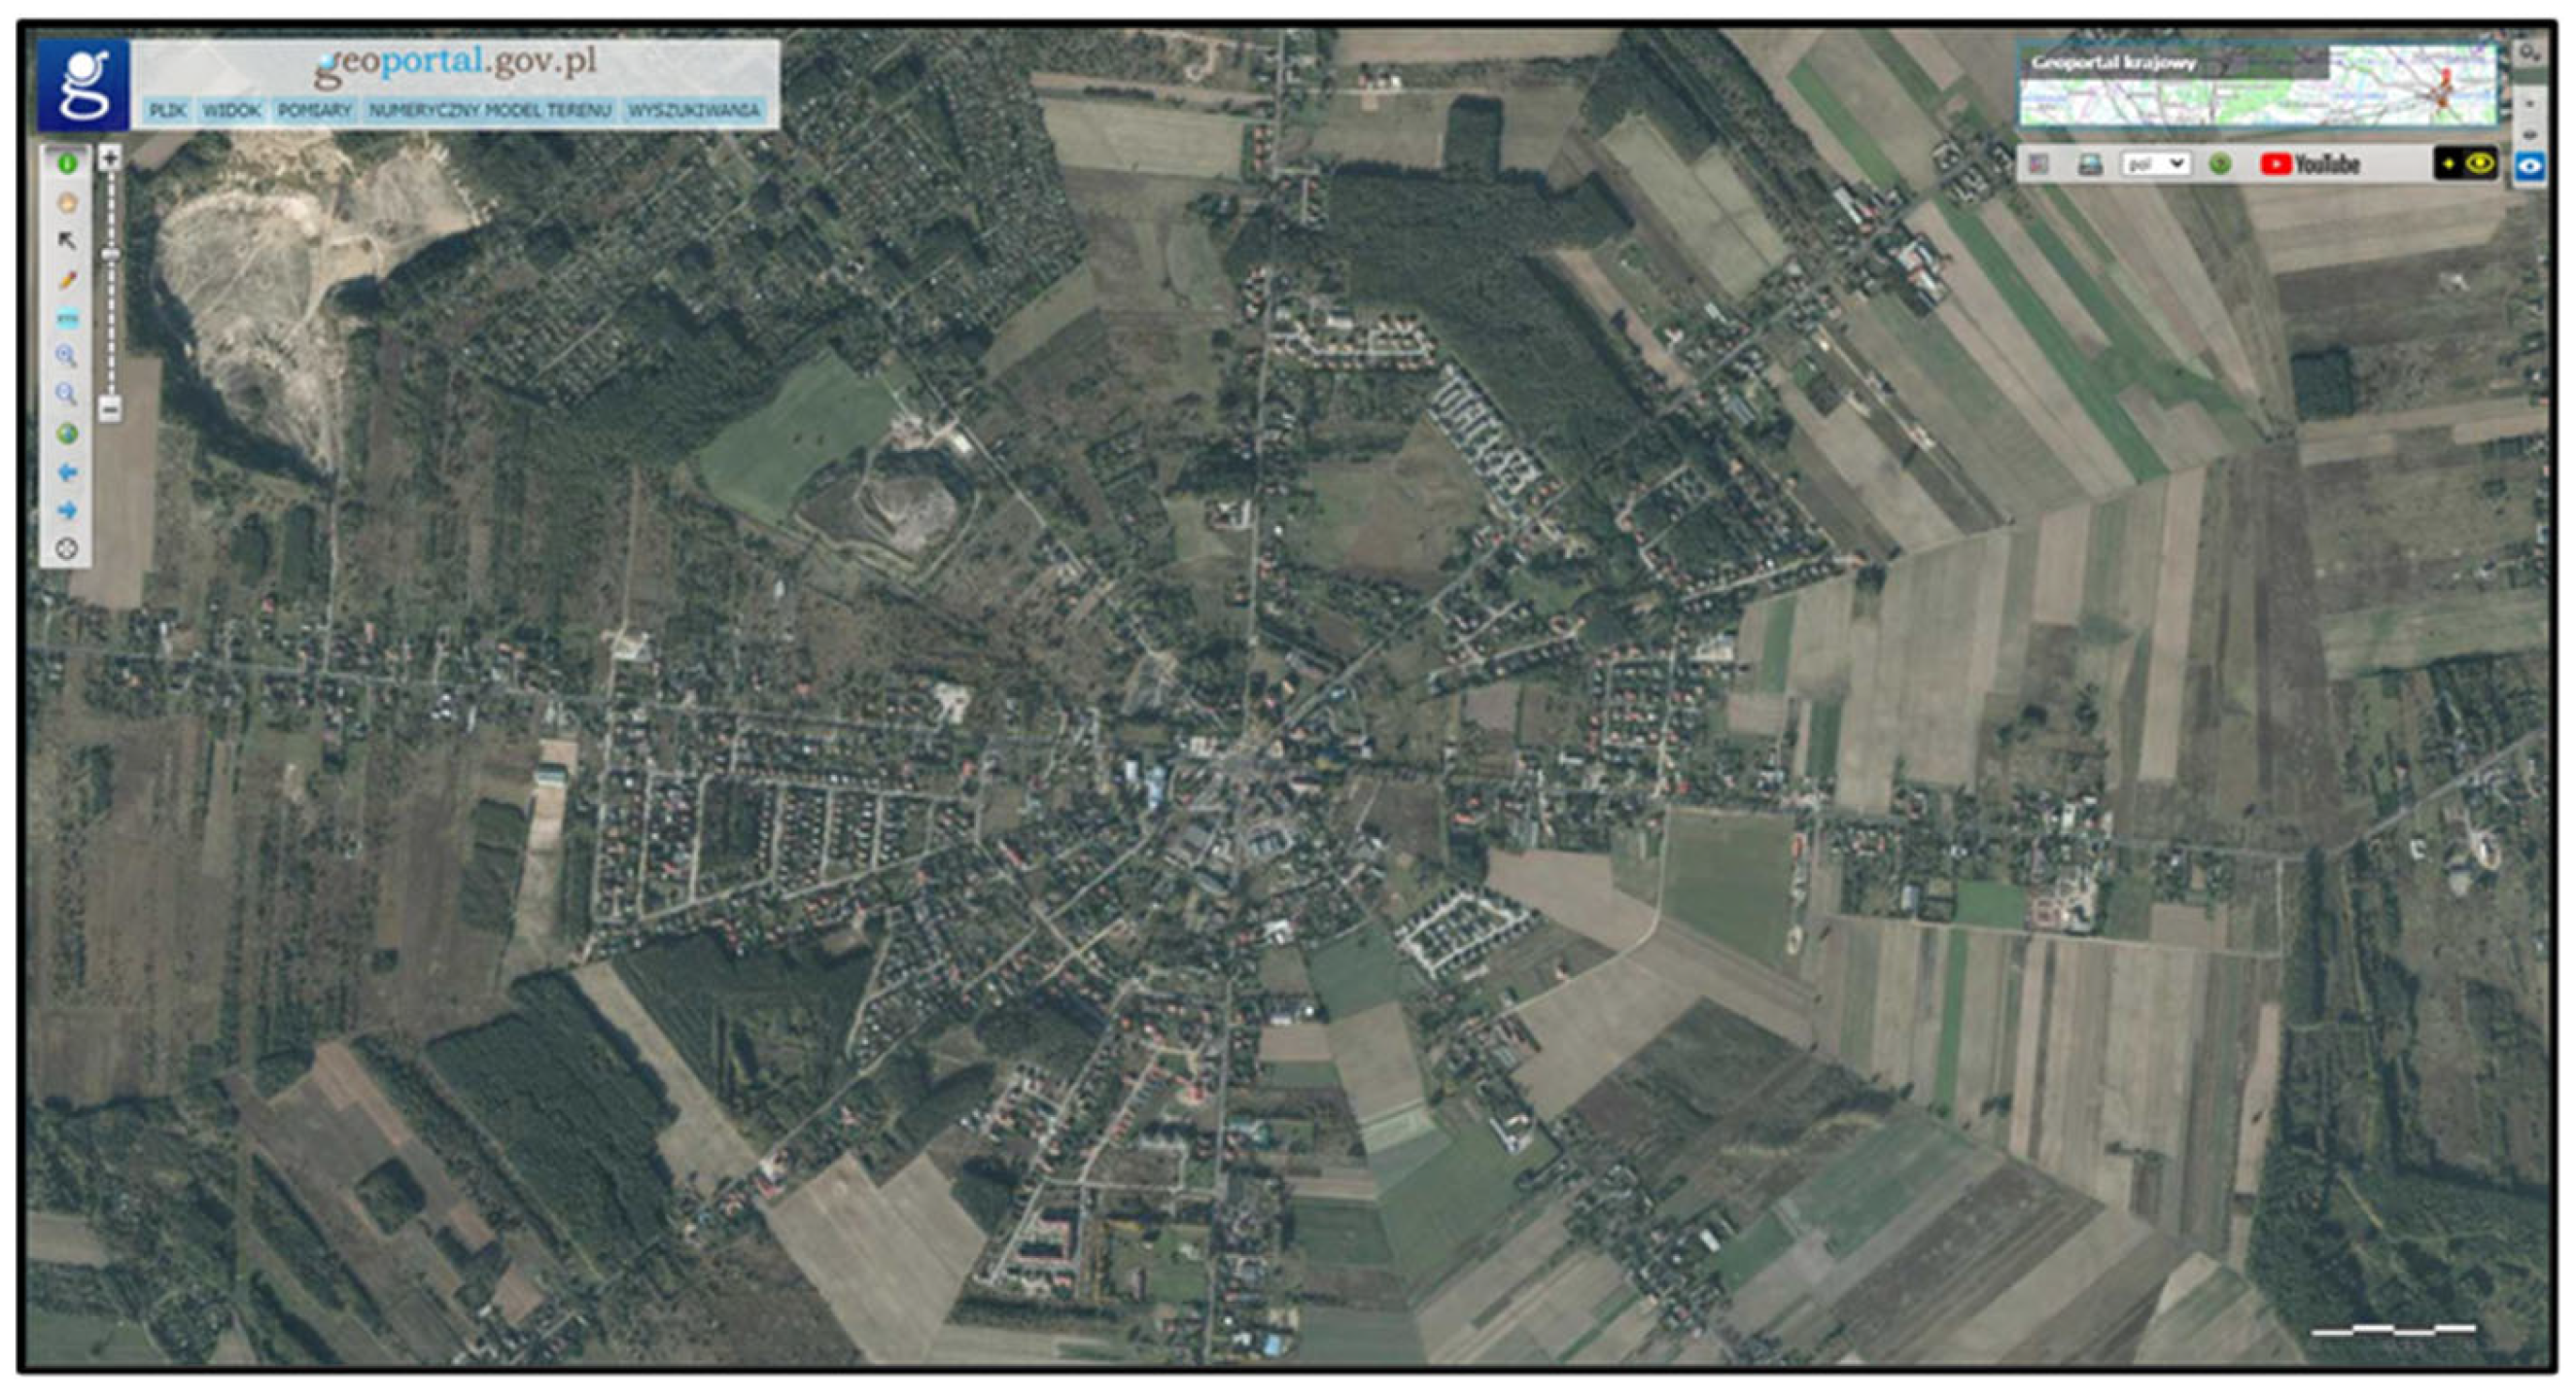
Nowosolna, approximately 12 km from the city center. The examined residential area is spread over a large area, and its satellite view is shown in
Figure 5. It was defined using the geographical distribution, based on the satellite image.
Figure 5.
The satellite view of the examined
Nowosolna cluster (source: [
48]).
Figure 5.
The satellite view of the examined
Nowosolna cluster (source: [
48]).
The
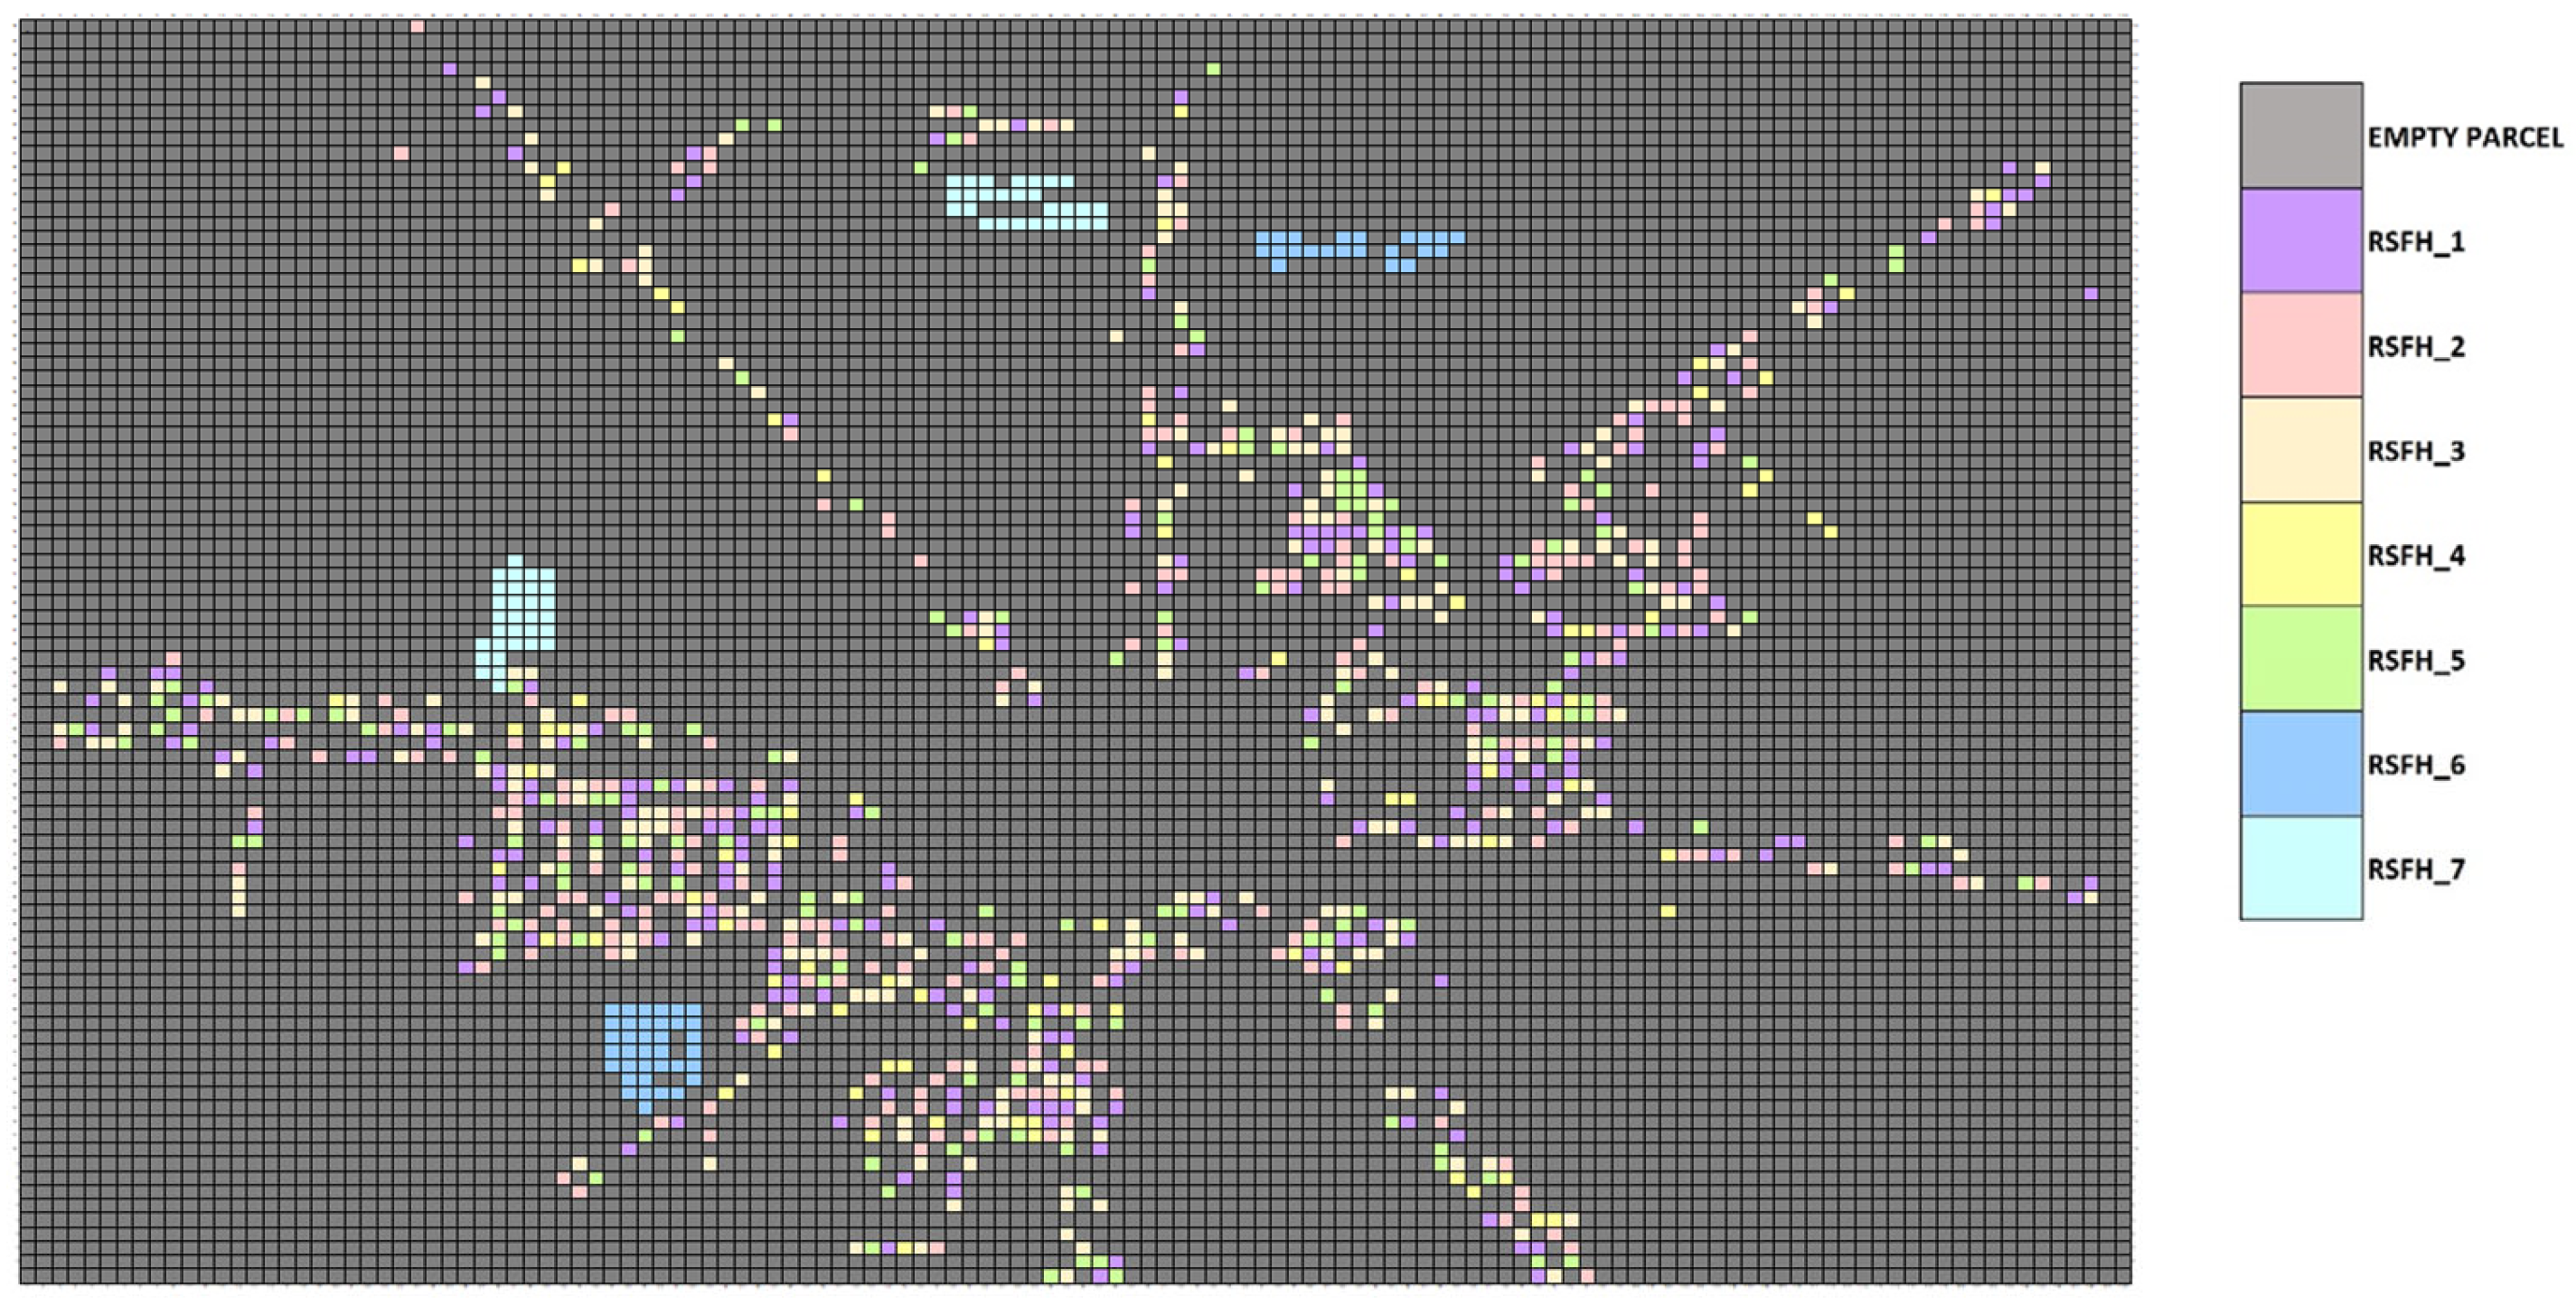
Nowosolna cluster is a rectangle region, 2.70 km by 3.90 km (approximately 1053 ha of land), characterized by a low density of buildings. The area is defined using a grid of cells, while the image is slightly rotated (only by approximately 7 degrees counterclockwise) to fit the visible streets pattern. The examined zone consists of 11.7 hundred parcels. It can be seen that the building distribution is non-uniform and rather irregular; their placement was performed using an optical fitting. Additionally, it is taken into account that the center of this region consists of several public buildings (school, church, shops); thus, this part of the area was not considered. The schema of the examined BEC is presented in
Figure 6; it consists of 1098 single-family houses, which is only 9.4% of all available cells.
The distribution of RSFH types is assumed following the national statistical data [
38], and their orientation is random. The assumed distribution of building types is shown in
Table 3. This analysis was focused on the energy, economic and environmental profitability of the considered variants of modernizations for the
Nowosolna cluster. The following variants were analyzed:
This scenario assumes the reference parameters of the examined area. The applied parameters of buildings are based on the Polish typology (see
Table 2). The results obtained for this variant are considered as the reference and are used for assessment of the proposed modernizations.
This variant considers deep retrofitting of all buildings within the examined BEC. Building enclosures are modernized up to the passive standard and the traditional heating systems are replaced with the highly efficient GHP, with a COP of 4.53. Additionally, lighting systems are modernized by replacing traditional lightbulbs with LEDs. The modernized cluster is supplied only by electrical energy.
Two different RES are applied additionally to the V1 scenario. This variant assumes three scenarios: the usage of solar (V2a) and wind (V2b) energy separately, as well as both simultaneously (V2c). The wind energy analysis is performed considering the home turbines (VAWT), as well as large HAWT. The solar energy analysis considered PV systems, installed on the most preferable roof slopes.
This scenario is considered as additional to the V2 variant application of the batteries to provide energy flexibility into the examined BEC. This variant is examined for two approaches, assuming, accordingly, a single battery for each of the houses (V3a) or one infinite (imaginary) energy bank for the whole cluster (V3b). In the V3a scenario, the commercially available model of lithium iron phosphate (LFP) battery is assumed, with the capacity of 10.65 kWh. The considered battery model is PylonTech Force L2; it is a low voltage battery (which can be composed of up to four units), with a potential peak power of 5.0 kW. Additionally, for both cases, the cost-effectiveness analysis is performed, comparing different electricity pricing.
3. Results and Discussion
The performed calculations are summarized in
Table 4. All the variants assumed a full energy shift to electricity, thus, the obtained demands for the modernized scenarios include energy for heating purposes. Out of the examined variants, V3b is the most profitable, considering a reduction in energy demand, as well as being the most environmentally friendly variant; all types of emissions are decreased by an average of about 90%. The performed study can be compared with the already published research, assuming the deep building refurbishment of district scale areas. According to [
14], the reduction in up to 78% of the overall heating demand was possible for an examined Swiss village by renovating its buildings. Here, the considered scenario assumed deep building refurbishment with the application of PVs, similar to the assumptions of this study. On the other hand, in [
49] the potential of RES share in the energy demand profile was analyzed. It was shown that it is possible to transform a residential area into a prosumer building cluster, where the self-consumption of the produced electricity is at a satisfactory level. Moreover, it was noticed that those types of studies can be evaluated by means of emission reduction. All the above-mentioned is a part of the results of this work.
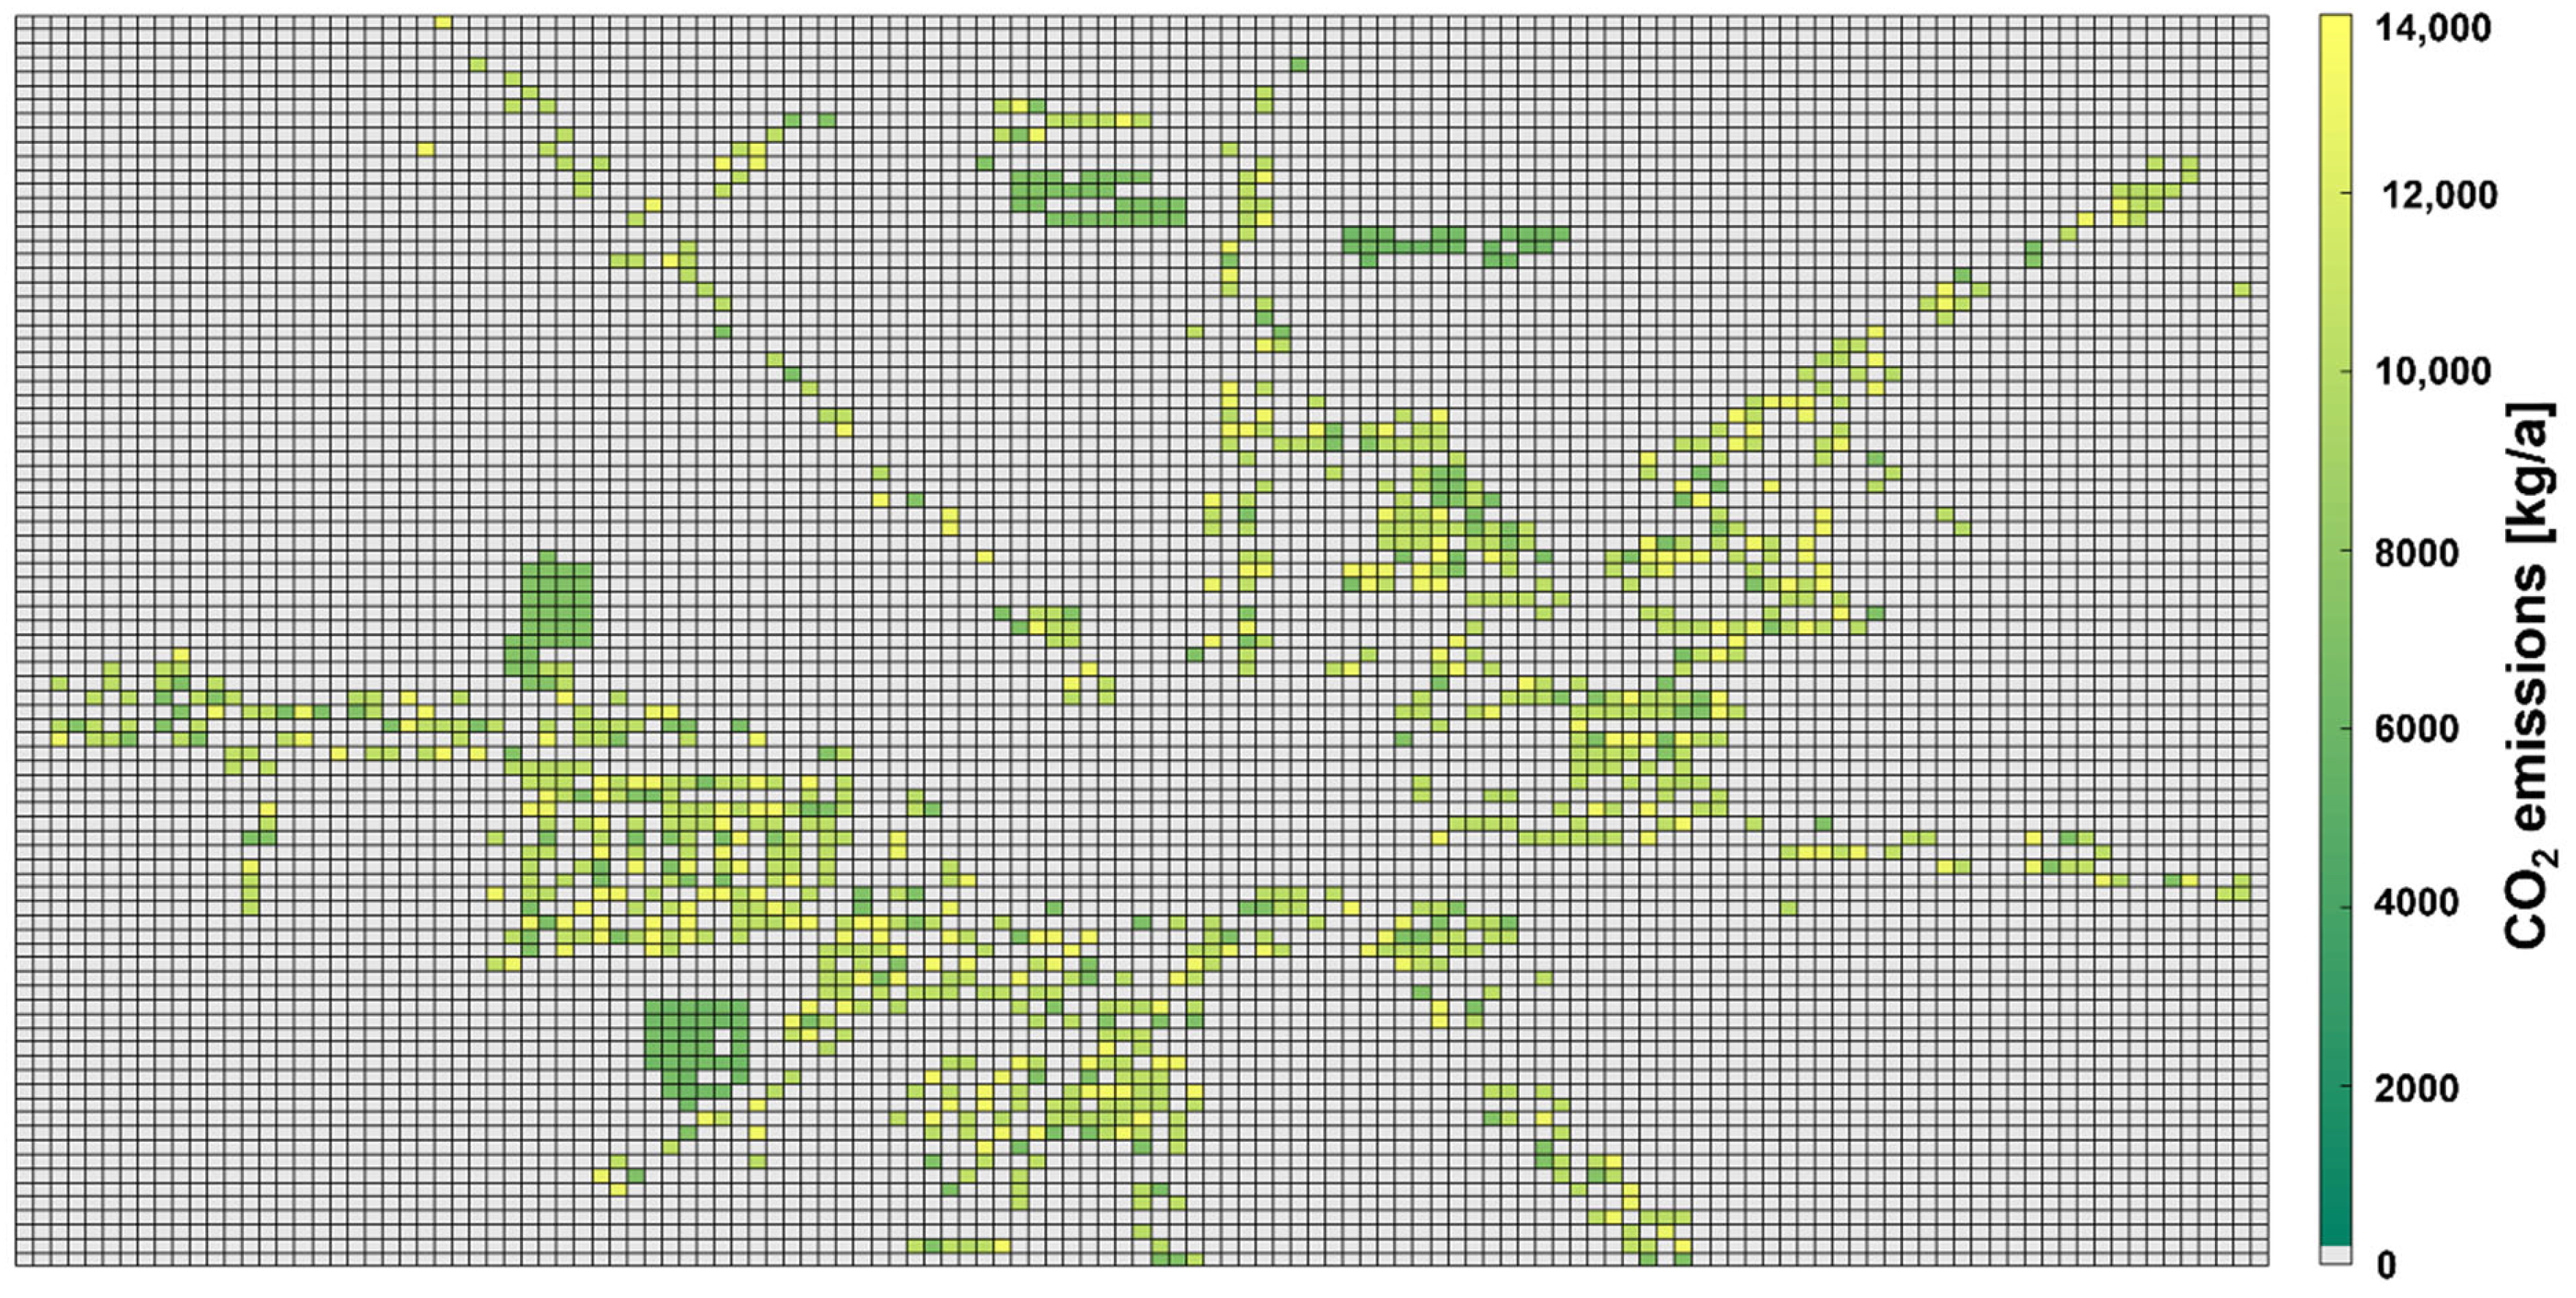
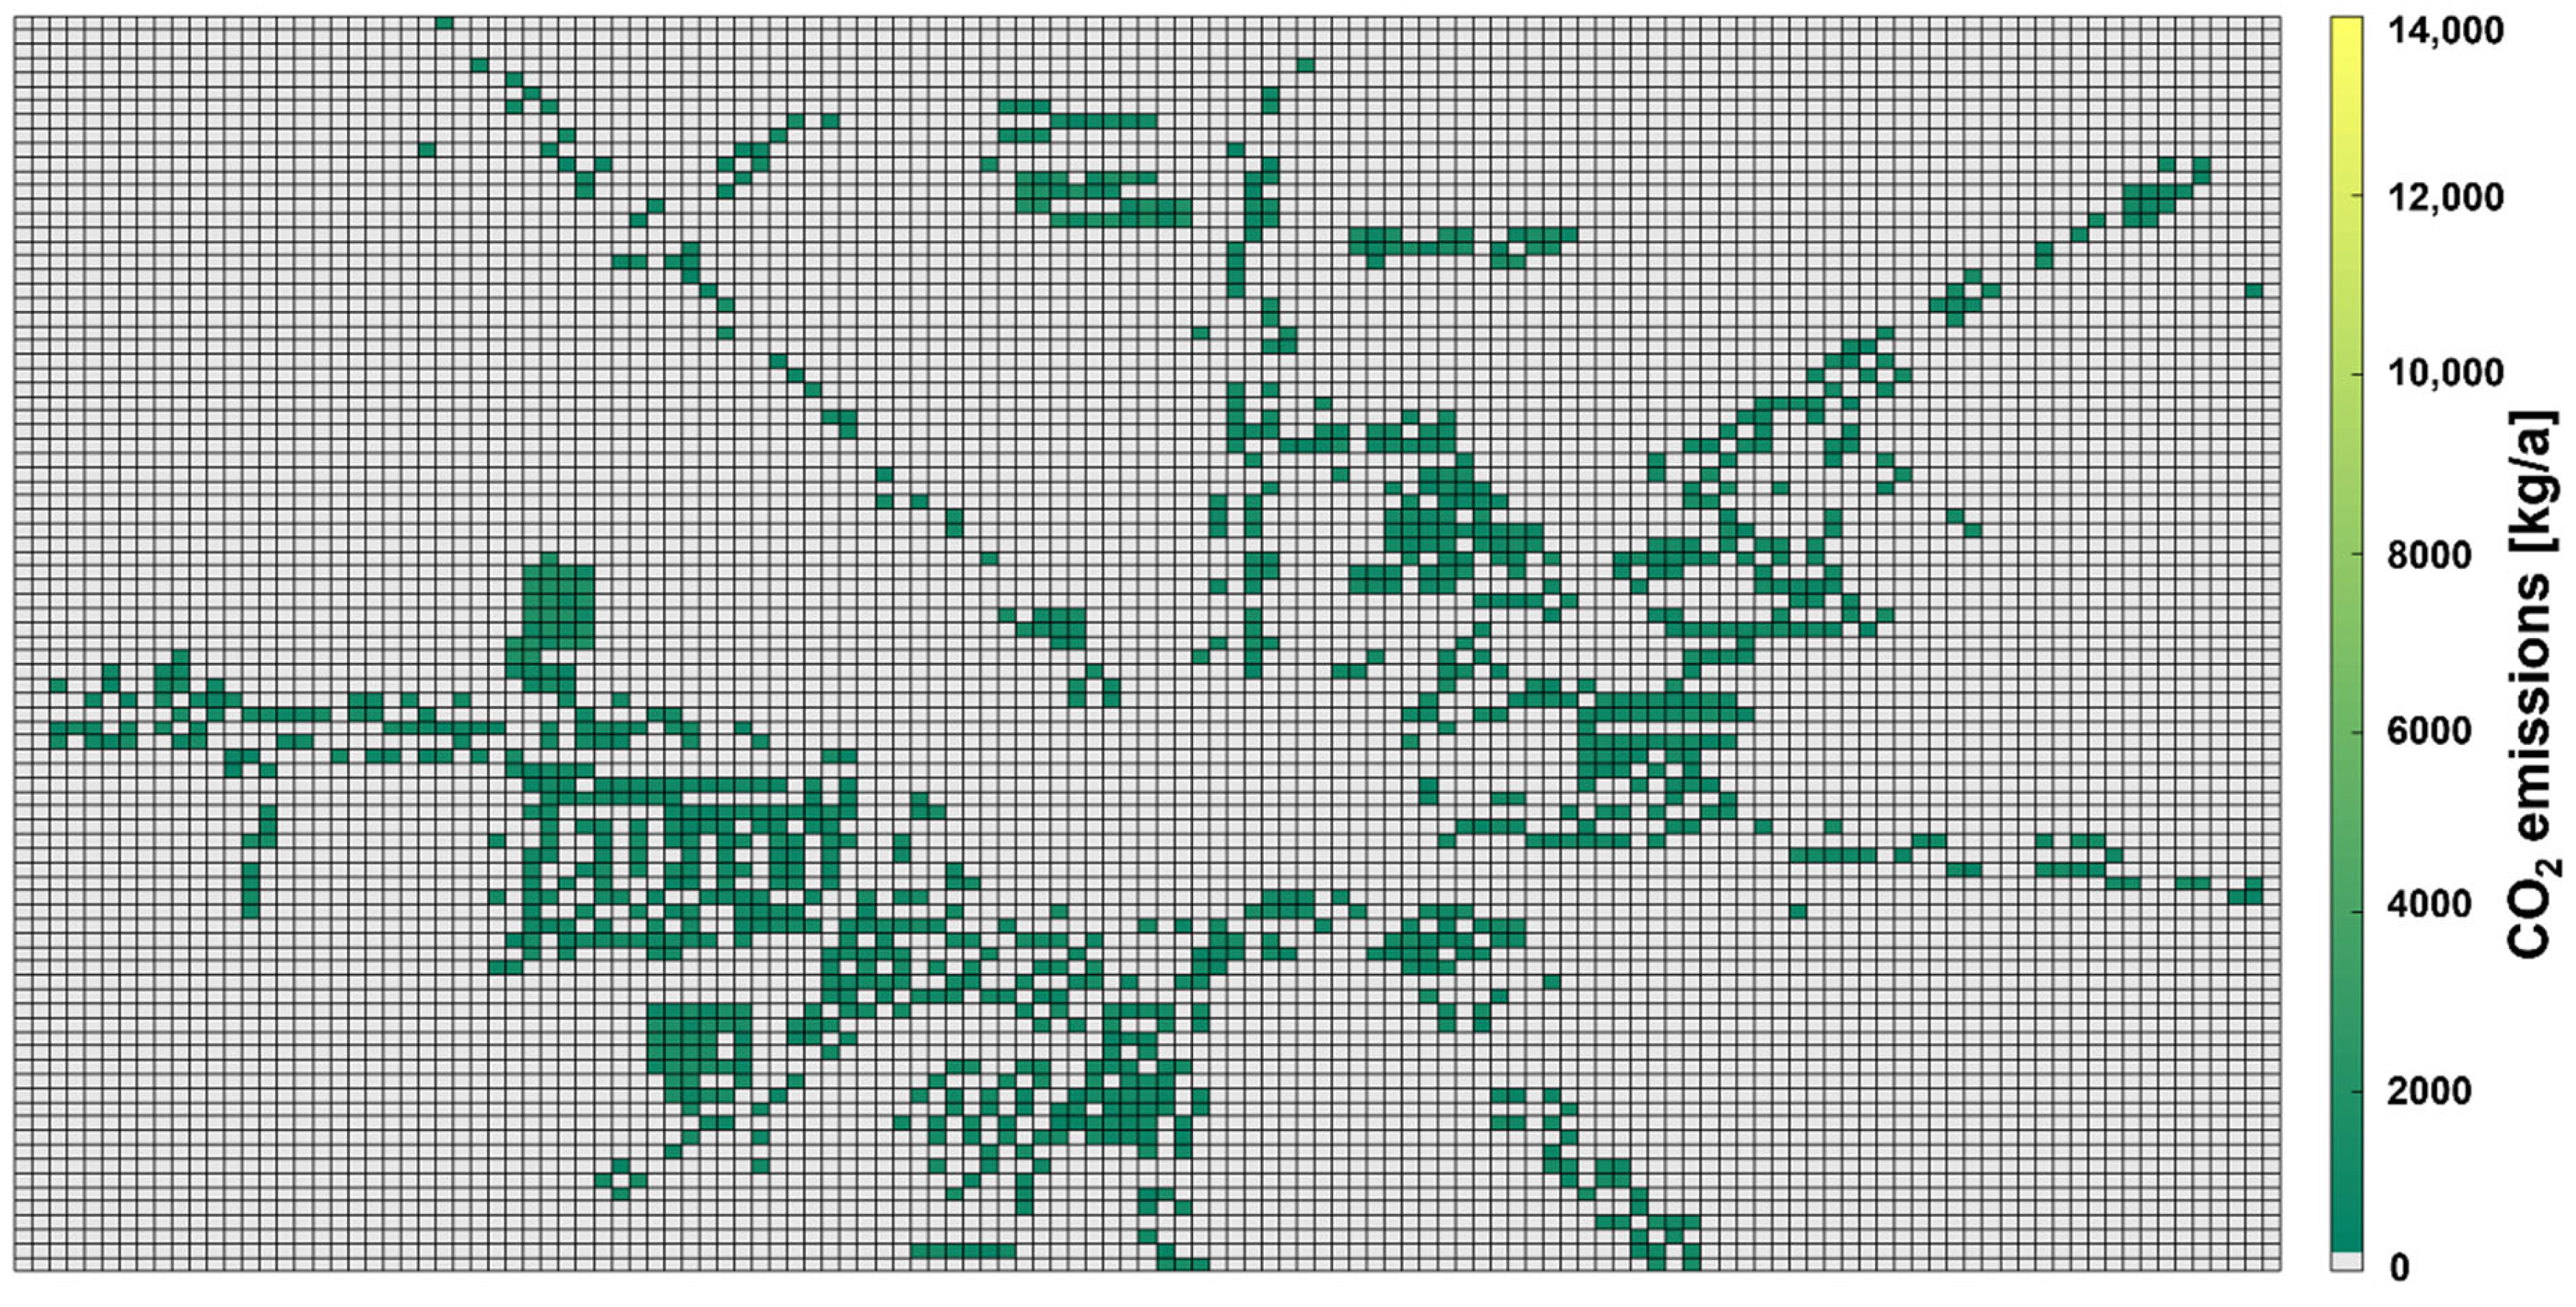
The results obtained out of the TEAC software can be presented by means of maps. The comparison of the CO
2 emissions maps of the base (V0) and V3b scenarios is shown in
Figure 7; the greener the cell the more environmentally friendly a building is. The total CO
2 emissions could be reduced by up to 89.3%. Hence, a significant environmental improvement of the cluster is possible.
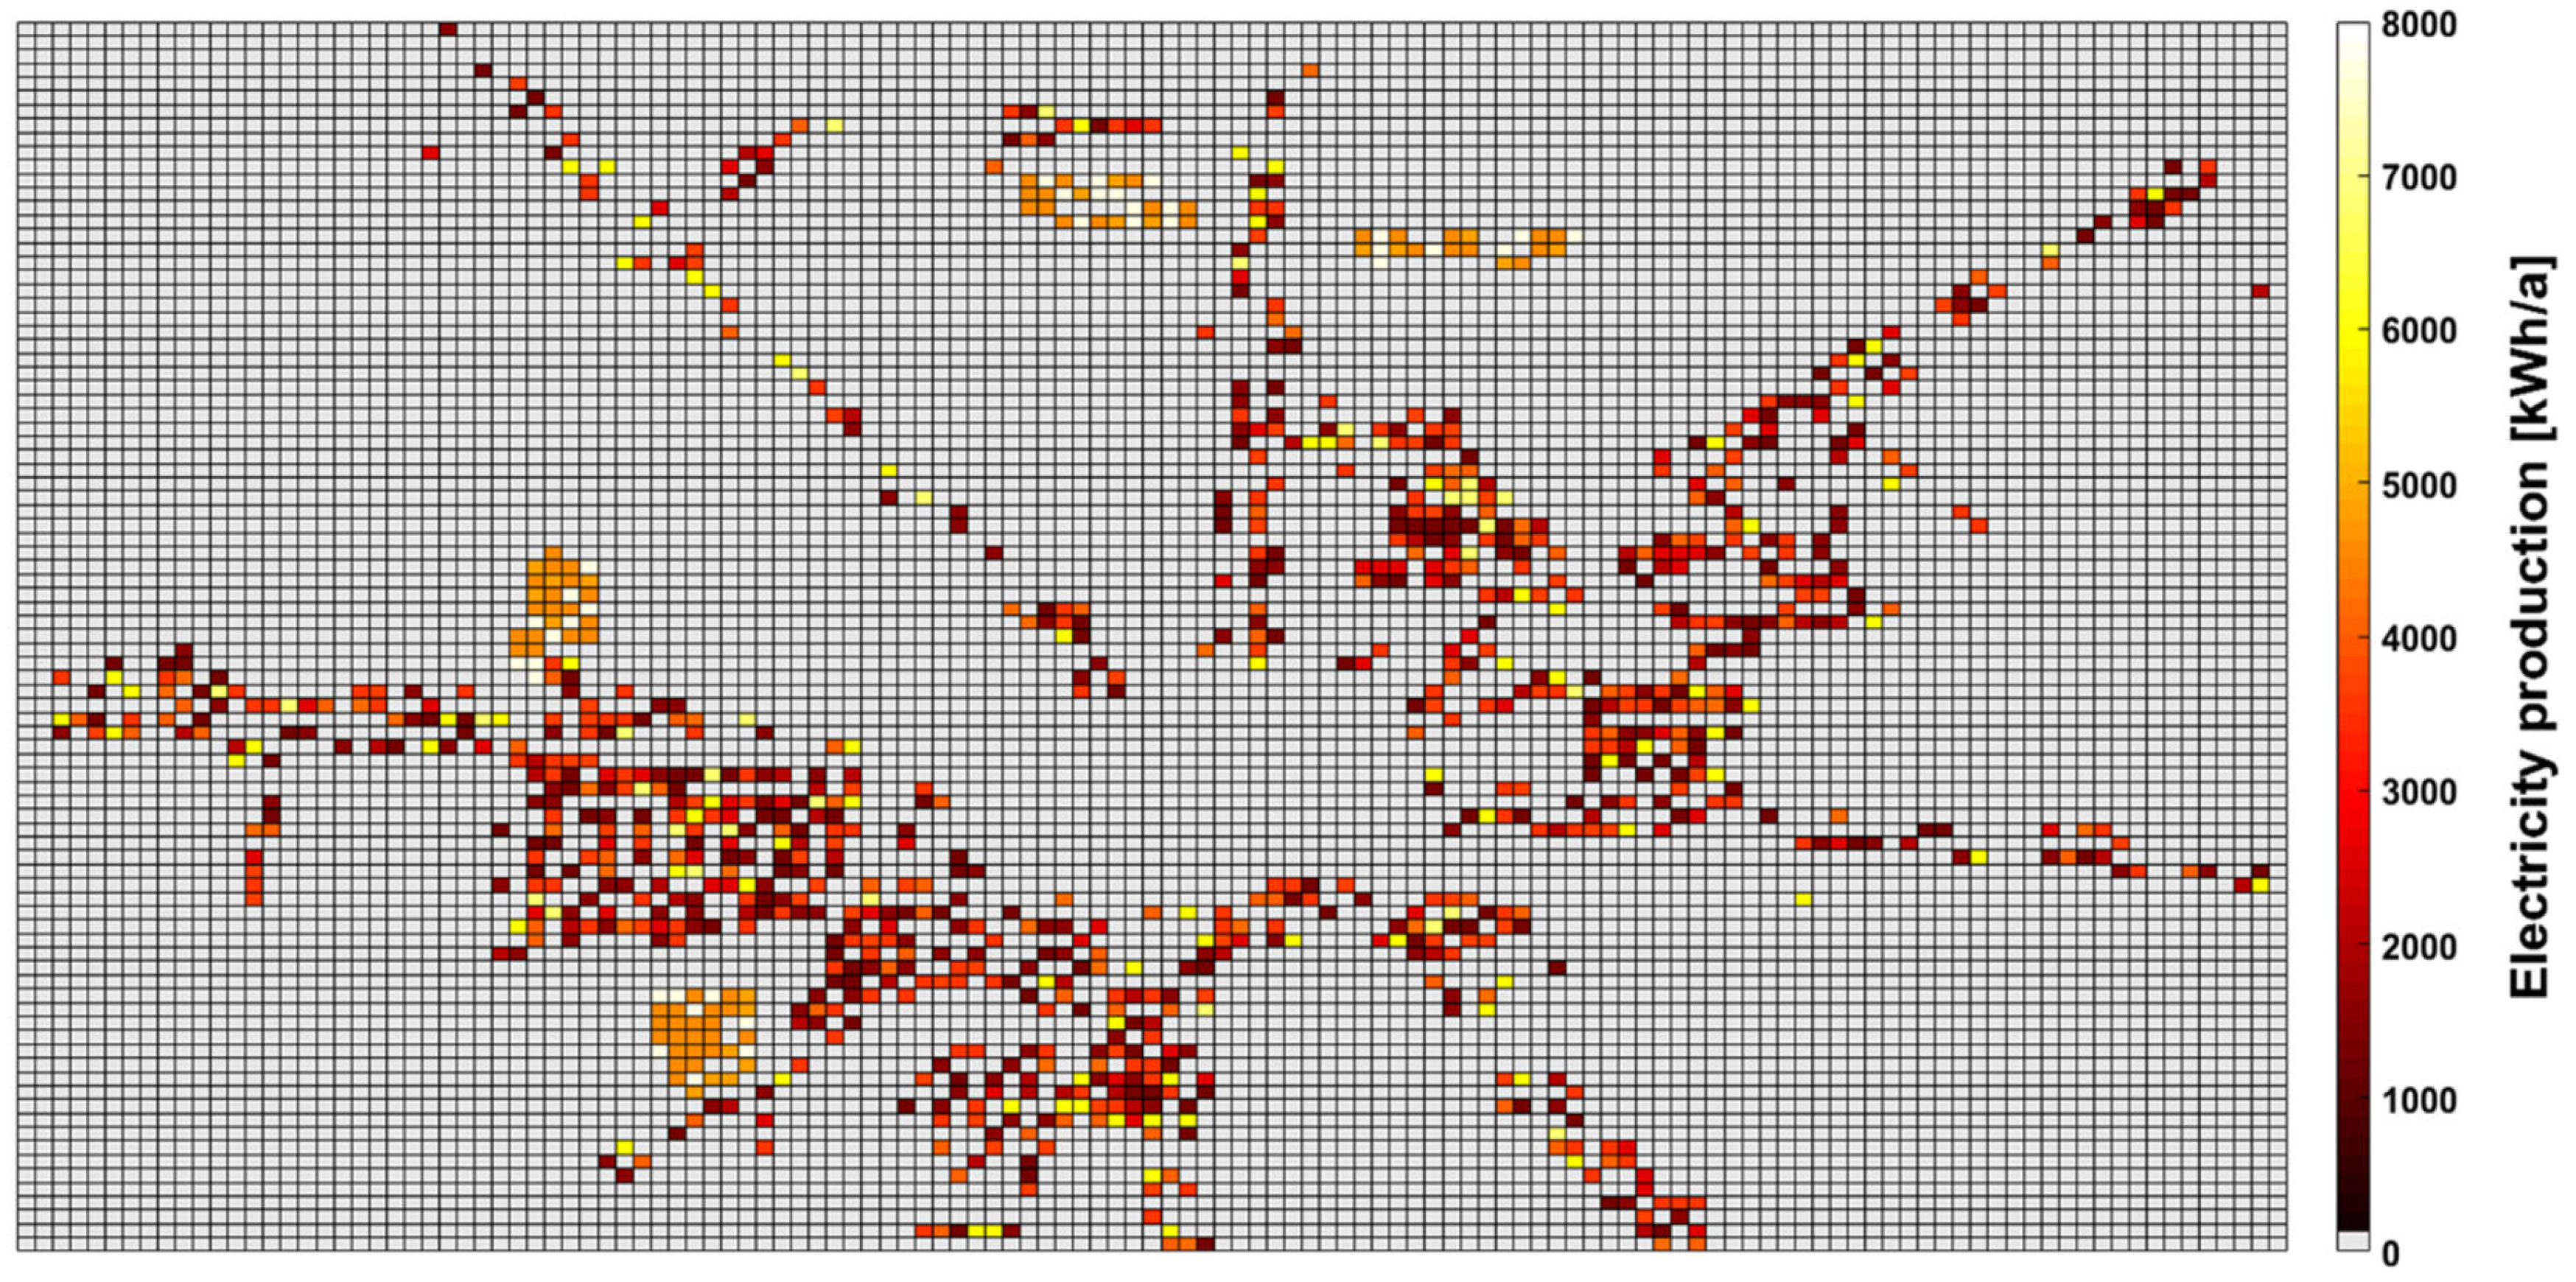
The considered PVs are highly efficient ones, with the efficiency of 21% (280 Wp each); the total area of 25,028.85 m
2 of PVs is assumed (the V2a variant). The considered system is examined as on-grid; thus, it is possible to transfer the surplus electricity generated to the grid. All of the PVs can produce up to 3606.20 MWh/a electricity, with a peak productivity of 4.19 MWp. The map of solar energy potential is shown in
Figure 8; the examined neighborhood could be considered as a solar cluster whenever so many PVs are applied. The usage of wind energy is examined in two cases, for VAWT and HAWT, where results for the home applied turbines are assigned as V2b. The technical parameter of the examined turbines is considered following their technical documentation, 3.0 kW for the VAWT and 1.6 MW for the HAWT. Only two HAWTs are required to cover the peak demands; nevertheless, it covers the electricity demand of the cluster for approximately 37% of the time (3183 h). The usage of VAWT is not efficient; the application of singular turbines for each house provides a 14% reduction (saving of 1108.44 MWh) in the electricity demand of the cluster. A summary of the RES calculations is shown in
Table 5. Due to the fact that the wind energy application is not so efficient for the Lodz localization, considering both the energy and economic aspects, only the V2a scenario is used in further analysis (as a basis for the V3a and V3b variants).
It is also possible to analyze the BEC in terms of financial profitability after application of the examined modernization variant. As was mentioned above, the basis for the V3 scenarios is the V2a variant. Thus, in both the V3a and V3b variants, the
Nowosolna solar cluster is additionally equipped with batteries, and some smart metering techniques are applied. The annual cost of operation for heating purposes of the
Nowosolna cluster can be reduced from 6.141 M PLN (base scenario) to 0.797 M PLN (the V3b variant). The cost of the proposed modernizations for the V1 variant is approximately PLN 116.121 M. The SPBT for the whole cluster is almost 22 years, while out of the LCC analysis the payback time is approximately 18 years. Considering all of the available electricity tariffs, some additional savings can be obtained. In Poland, the G-type tariffs are for individual billing, while the C-type refers to cluster level (i.e., all buildings together). It is important to mention that switching electricity price tariff requires no initial costs (or marginal ones). Based on the results shown in
Table 6, it can be seen that additional savings can be observed using an appropriate electricity tariff; within each variant, the potential annual savings can be as high as PLN 355 k (USD 87 k). The V3b case is the most profitable, using the C23 tariff, where the whole cluster is considered as a unity.
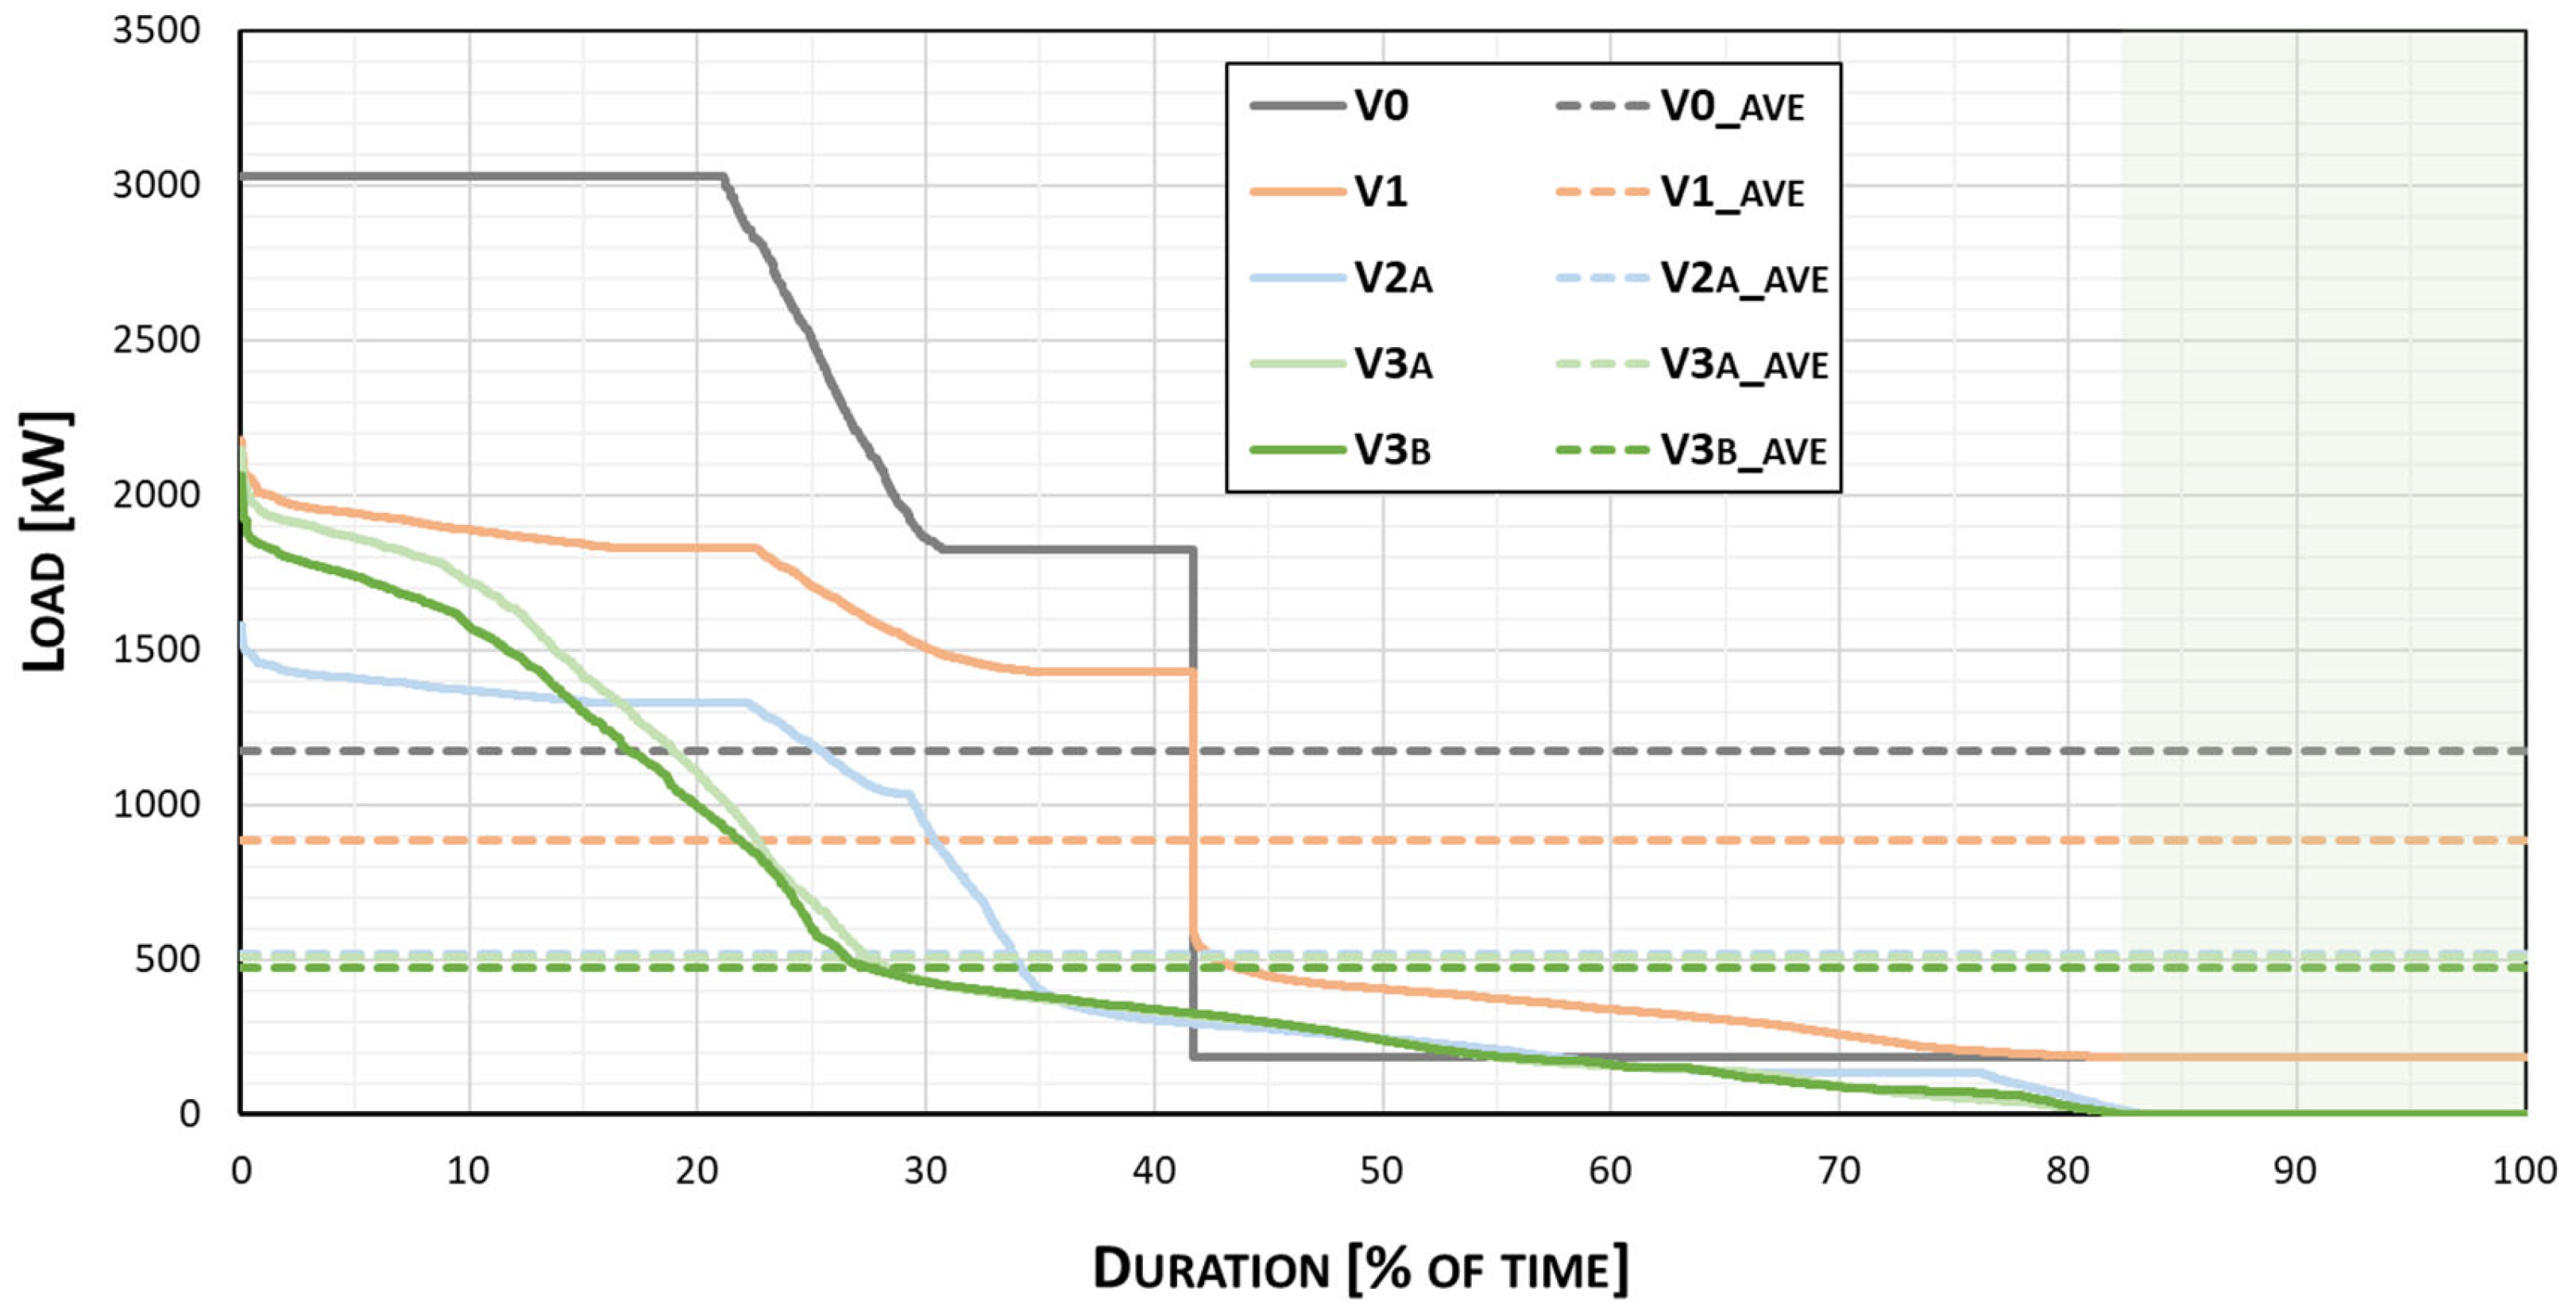
Finally, the results can be presented by means of LDCs; in
Figure 9, the electricity LDCs for the analyzed scenarios are compared. It can be seen that for all of the modernization variants, the peak demands are lower and the overall load is more uniformly distributed in time. The application of PVs successfully shifts the demand, while both V3 scenarios allow us to use the full potential of the applied RES. The V3b scenario is the most profitable both in terms of the grid safety and its stability; it provides the zeroth demand (marked as a green box in
Figure 9) for approximately 18% of the year.
4. Conclusions
The aim of this paper was to examine the possible effects of energy transformation of the Polish single-family house sector, following deep retrofitting and RES application. It was analyzed using the EC concept, by means of the home-developed TEAC software. The exemplary, non-uniform residential neighborhood was examined in terms of the potential energy, economic and environmental improvement. Based on the obtained results, it was shown that the Polish single-family house sector has a huge potential in terms of overall energy efficiency improvement. Energy independence and improved grid flexibility might be obtained, providing higher sustainability for the region. Additionally, a high profitability of the analyzed RES application was shown.
A deep retrofit of the buildings constituting the Nowosolna cluster, can provide significant savings in terms of heating demand. The application of PVs and LEDs (lighting system upgrade) considerably decrease the electricity demand of the neighborhood. It was shown that the analyzed solar systems might be extremely valuable for local energy stability. Out of the LDCs it can be seen that the proposed modernizations might reduce the duration of electricity supply, decrease peak loads, as well as improve the local grid stability. All of the examined modernizations showed that they are energy, economically and environmentally profitable. Moreover, transforming the Nowosolna neighborhood into an energy/building/solar cluster can provide some further advantages, i.e., financial profitability. A comparison with similar studies is discussed in chapter 3. The results obtained in this work are comparable with those previously published by other authors for a similar type of study, although obviously with some differences, e.g., base scenario profile or modernization assumptions. Therefore, the presented results are in agreement with the actual trends of the UBEM concept.
The usefulness of the TEAC software for the UEM studies was demonstrated in this work. The TEAC software, currently at the alpha-stage of development, follows the hybrid method of UEM, mixing statistical and engineering approaches. The software allows us to perform comprehensive calculations of BEC in Poland, with accuracy comparable with the Energy Plus simulations, using significantly less complex input data. In this article, some key applications for the developed tool were shown. It enables us to determine the most appropriate modernizations towards the development of sustainable residential areas. Nevertheless, some further improvements of the developed tool are planned, focusing especially on the application of a graphical user interface (GUI) and supporting geographic information system (GIS).
Despite the fact that multiple advantages of the TEAC software were shown in this paper, it has some limitations. The main one is the fact that the whole software is based on the statistical data of the Polish residential sector. On the other hand, using the statistical distribution seems accurate whenever it concerns large areas. Nevertheless, there is not a fully free definition of the analyzed area using the TEAC software, despite the fact that the accuracy of results from the TEAC software is comparable with those from
Energy Plus, which has been validated several times, see [
8,
32,
33,
34,
35]. Another limitation (a temporary one) is that the TEAC software has no GUI and, at the moment, is not available for the wider public (as was already mentioned, such works are already in progress). Finally, in order to fully evaluate the developed computer tool, it would be useful to compare its results with those obtained for some exemplary district areas from the other available software. The authors plan to publish a separate paper devoted to this important issue.
The TEAC software and presented results might be helpful for decision makers and local authorities to significantly improve the energy and environmental characteristics of the examined residential area, with potentially major financial benefits.


