1. Introduction
Internet of Things (IoT) technologies provides large-scale solutions for efficient resource monitoring and management [
1]. These technologies have been heavily integrated into various domains including manufacturing, healthcare, agriculture, and utilities. This integration contributes significantly towards emergence of sustainable cities. A key challenge to the sustainability and growth of cities is conservation of vital energy resources against overconsumption [
2]. As a result, great efforts have been invested into increasing the efficiency of green energy resources to eliminate dependence on finite energy resources such as fossil fuels. One of the planet’s most abundant and freely available energy sources is sunlight. Sunlight is also considered the only source capable of keeping up with global energy demand, as the amount of sunlight the planet receives in one hour is more than enough to power the planet for a whole year [
3]. While solar energy penetration into primary grids remains relatively low compared to conventional fossil fuels, the last few years have witnessed a steady increase in solar power utilization. The 2021 Renewable Capacity Statistics Report by IRENA reported a global solar energy capacity of over 713 Giga Watts (GW), accounting for over 25% of installed renewable energy capacity [
4]. Furthermore, the global solar energy capacity was expected to increase by 150 GW in the year 2022, with the average annual addition capacity reaching almost 165 GW for the years 2023–2025 [
5].
While such increases in utilization of solar energy are in the right direction, they also pose new challenges when it comes to Operation and Maintenance (O&M) of solar farms. One of the primary challenges to 100% solar energy grid penetration is the intermittency of this energy source [
6]. Environmental factors such as irradiance and soiling, as well as operational conditions such as array configuration and tilt can cause short-term and long-term energy fluctuations. If allowed to propagate through the grid, significant energy fluctuations can cause service disruptions at best, and damage critical resources and infrastructure at worst. Avoiding fluctuations requires intelligent energy reserve planning which can be accomplished by utilizing technology to not only monitor solar resources, but to also use data along with artificial intelligence (AI) to generate trend reports and forecasts [
7]. The success of the latter depends on the availability of data, as well as the quality of the data management infrastructure [
8]. Internet of Things (IoT) introduced numerous new software, hardware, and networking technologies designed for efficient and low-cost data transport, storage, and processing [
9]. However, appropriate selection and integration of the correct technologies is crucial to ensuring a positive return on investment for such systems. This paper presents a novel end-to-end infrastructure for solar energy analytics and prediction via edge-based analytics for large-scale solar farms.
This primary contributions of this paper are as follows:
The paper presents an analysis of AI applications in solar energy
Derives key functional and non-functional requirements based on a survey of smart energy systems, IoT systems, and smart grids
Proposes and evaluates a design for a low-cost data collection and streaming from distributed solar installations
Proposes a design for a middleware services software architecture which makes use of scalable data streaming, processing, storage, and analytics technologies
Offers examples of microservices which can be deployed using such as system, as well as detailed use cases for remote and distributed solar installations
2. Artificial Intelligence and IoT in Solar Energy
The output of a solar module is highly dependent on its context [
6]. Natural phenomena such as global horizontal irradiance (GHI) [
10,
11], ambient temperature [
12,
13], and aerosol particle concentration [
14,
15] play a large part in influencing the amount of energy a module can yield. Furthermore, once operational as part of an array or a grid, the output of a solar module can also be influence by its operational elements such as array location, array configuration and tilt [
16]. Such factors can influence the Current-Voltage (IV) curve [
17] for a module. Furthermore, both natural and operational context can decrease the output of a module overtime. This happens by either blocking sunlight from reaching its surface such as with soiling [
18,
19], or causing damage to the module’s surface or circuitry such as the case with surface degradation, and the development of hotspots [
20]. Context varies not only from region to another, but within the same region and even within the same farm [
21,
22]. As a result, generating an accurate model of an individual module, string, or array requires highly-granulated data collection to avoid making generalized assumptions about individual situations [
23]. This requires a new type of data monitoring and analytics infrastructure that is equipped to make sense of large masses of heterogenous data and generate models, predictions, and reactions within a relatively short amount of time.
3. System Requirements
The functional and non-functional system requirements for a large-scale solar monitoring and analytics infrastructure are shown in
Table 1. The requirements were selected based on a survey of smart energy systems as well as IoT systems in order to match the needs of a hybrid IoT-based energy system [
24]. In addition, to account for the amount of data expected to flow through the system, and to overcome challenges that come with the transportation, processing and storage of such data, incorporating Big Data Systems has been included as one key requirement [
25]. The requirements not only cover matters related to the deployment, operation, and maintenance of such system, but the longevity, long-term cost, and return-on-investment are also considered.
4. Infrastructure for City-Wide Energy Intelligence
4.1. Edge Infrastructure
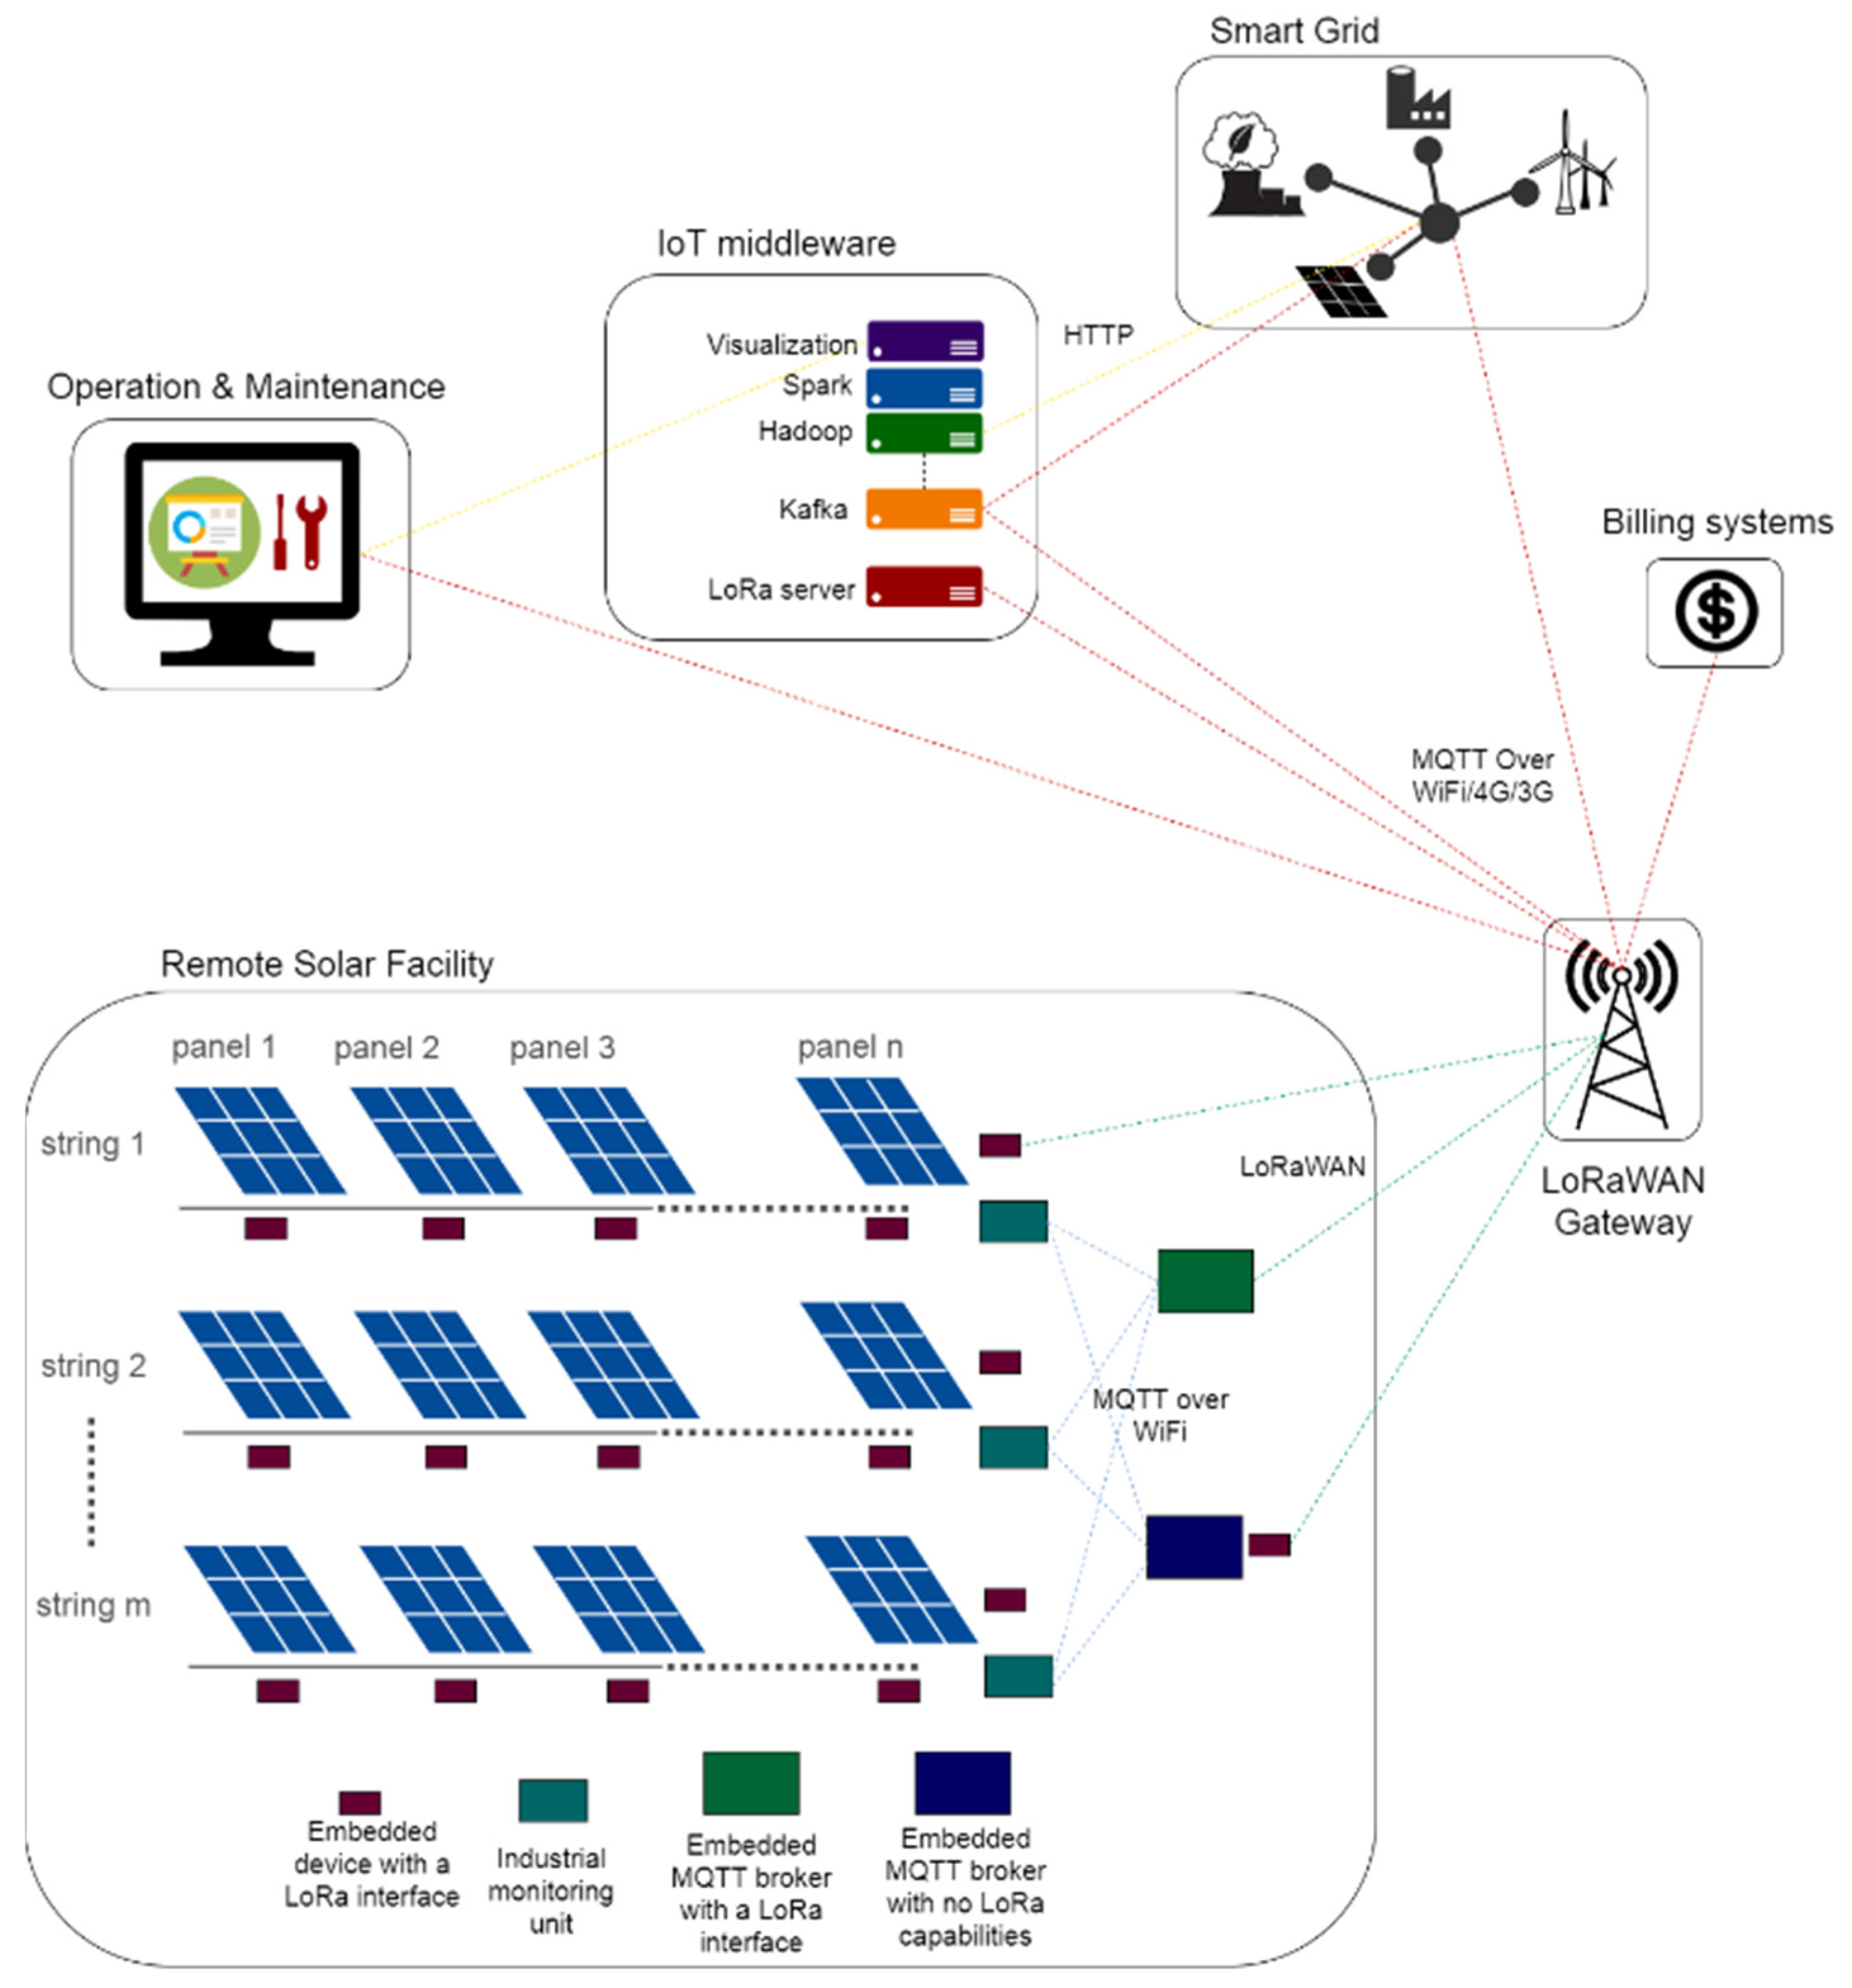
The hardware and network infrastructure of the edge layer are shown in
Figure 1. Located at the solar farm are edge nodes responsible for monitoring, analysis, and control of the solar modules. The nodes consist of low-cost microcontrollers such as ESP32 board equipped with sensors capable of capturing the solar module’s state as well as its environmental context. A typical ESP board uses a single or dual-Core 32-bit microprocessor with typical clock frequency of up to 240 MHz, and about 520 KB of SRAM, 448 KB of ROM and 16 KB of RTC SRAM. These boards support 802.11 b/g/n Wi-Fi connectivity with speeds up to 150 Mbps. Data can be captured at three different levels: module, string, and region or facility. The latter refers to data describing the environmental context of the solar panels. Depending on the scale of the facility, the area may be divided into multiple regions in order to capture the variations in context across the whole facility.
Table 2 shows the various types of readings that can be captured at each level. Other devices may be added which may be responsible for control such bypassing a module or dynamically reconfiguring the array [
26,
27].
Edge devices such as the ESP32 are required to use a low-power, long-range communication module to transmit the sensor data across a city. The proposed architecture uses low-power long-range communication network as the primary network protocol to transport data from remote farms to datacenters to reduce the cost of deploying and operating a long-range network when compared to conventional long-range networks such as 5G. There are several alternative lower-power, long-range communication technologies currently available on the market including LoRaWAN, Sigfox, NB-IoT, and LTE-M. Comparative analyses and performance evaluations of the technologies have so far have found LoRaWAN and NB-IoT have an edge above the rest in terms of power consumption, payload size, and range [
28,
29]. Given that LoRaWAN uses unlicensed frequency spectrum, the cost of deploying a LoRaWAN infrastructure is be significantly less than deploying NB-IoT which piggybacks on existing cellular frequency spectrums. Consequently, the work here assumes a LoRaWAN infrastructure for remote communication.
In addition to an ESP board, the edge device includes a LoRaWAN [
30] module that forwards the data to a remote LoRaWAN gateway.
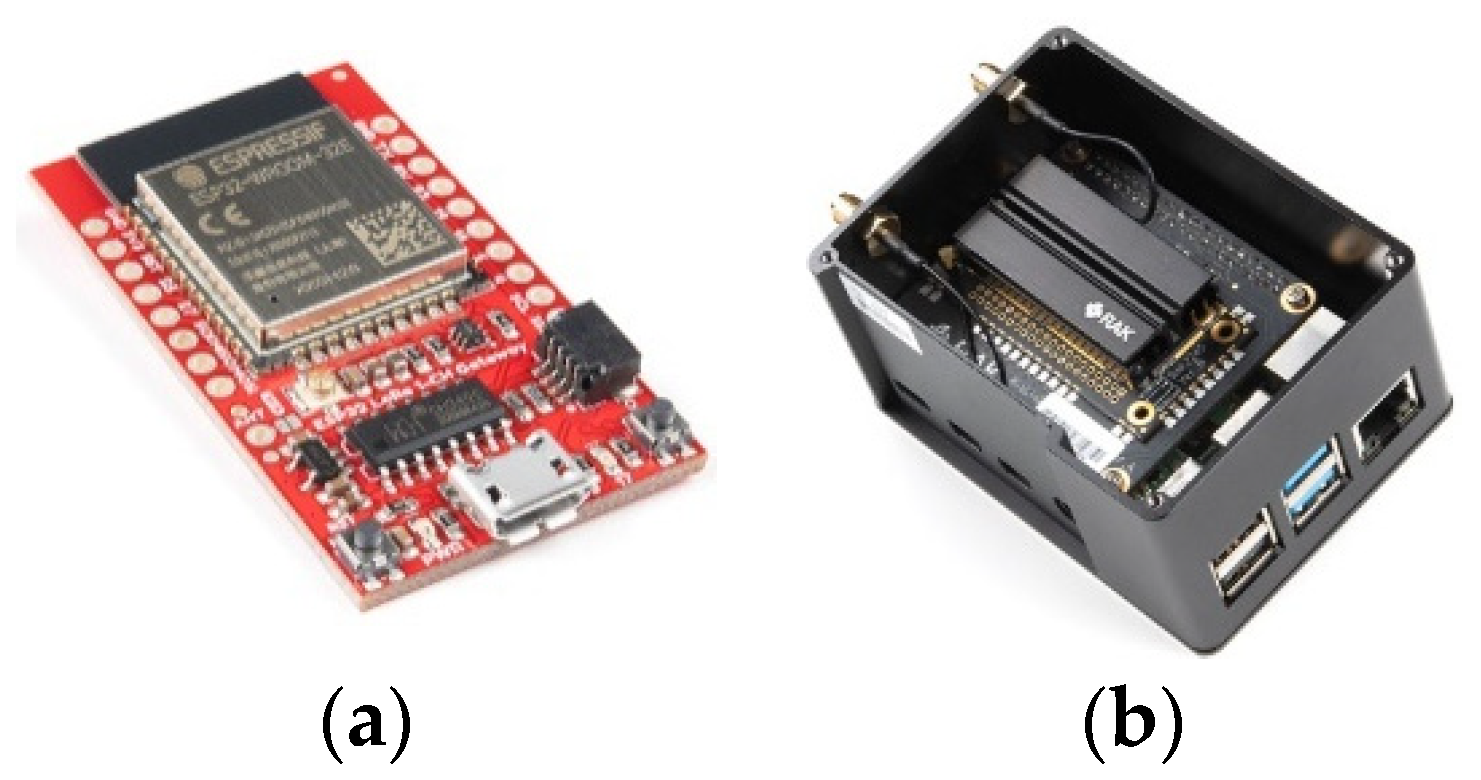
Figure 2a shows an ESP32 equipped with an on-board LoRaWAN chip [
31] that enables the board to function as a LoRaWAN edge device. In this implementation, the ESP32 + LoRaWAN board was used as an edge device, while the Gateway consisted of a Raspberry Pi (RPi) equipped with a RAK Wireless LoRaWAN multi-channel shield [
32] (shown in
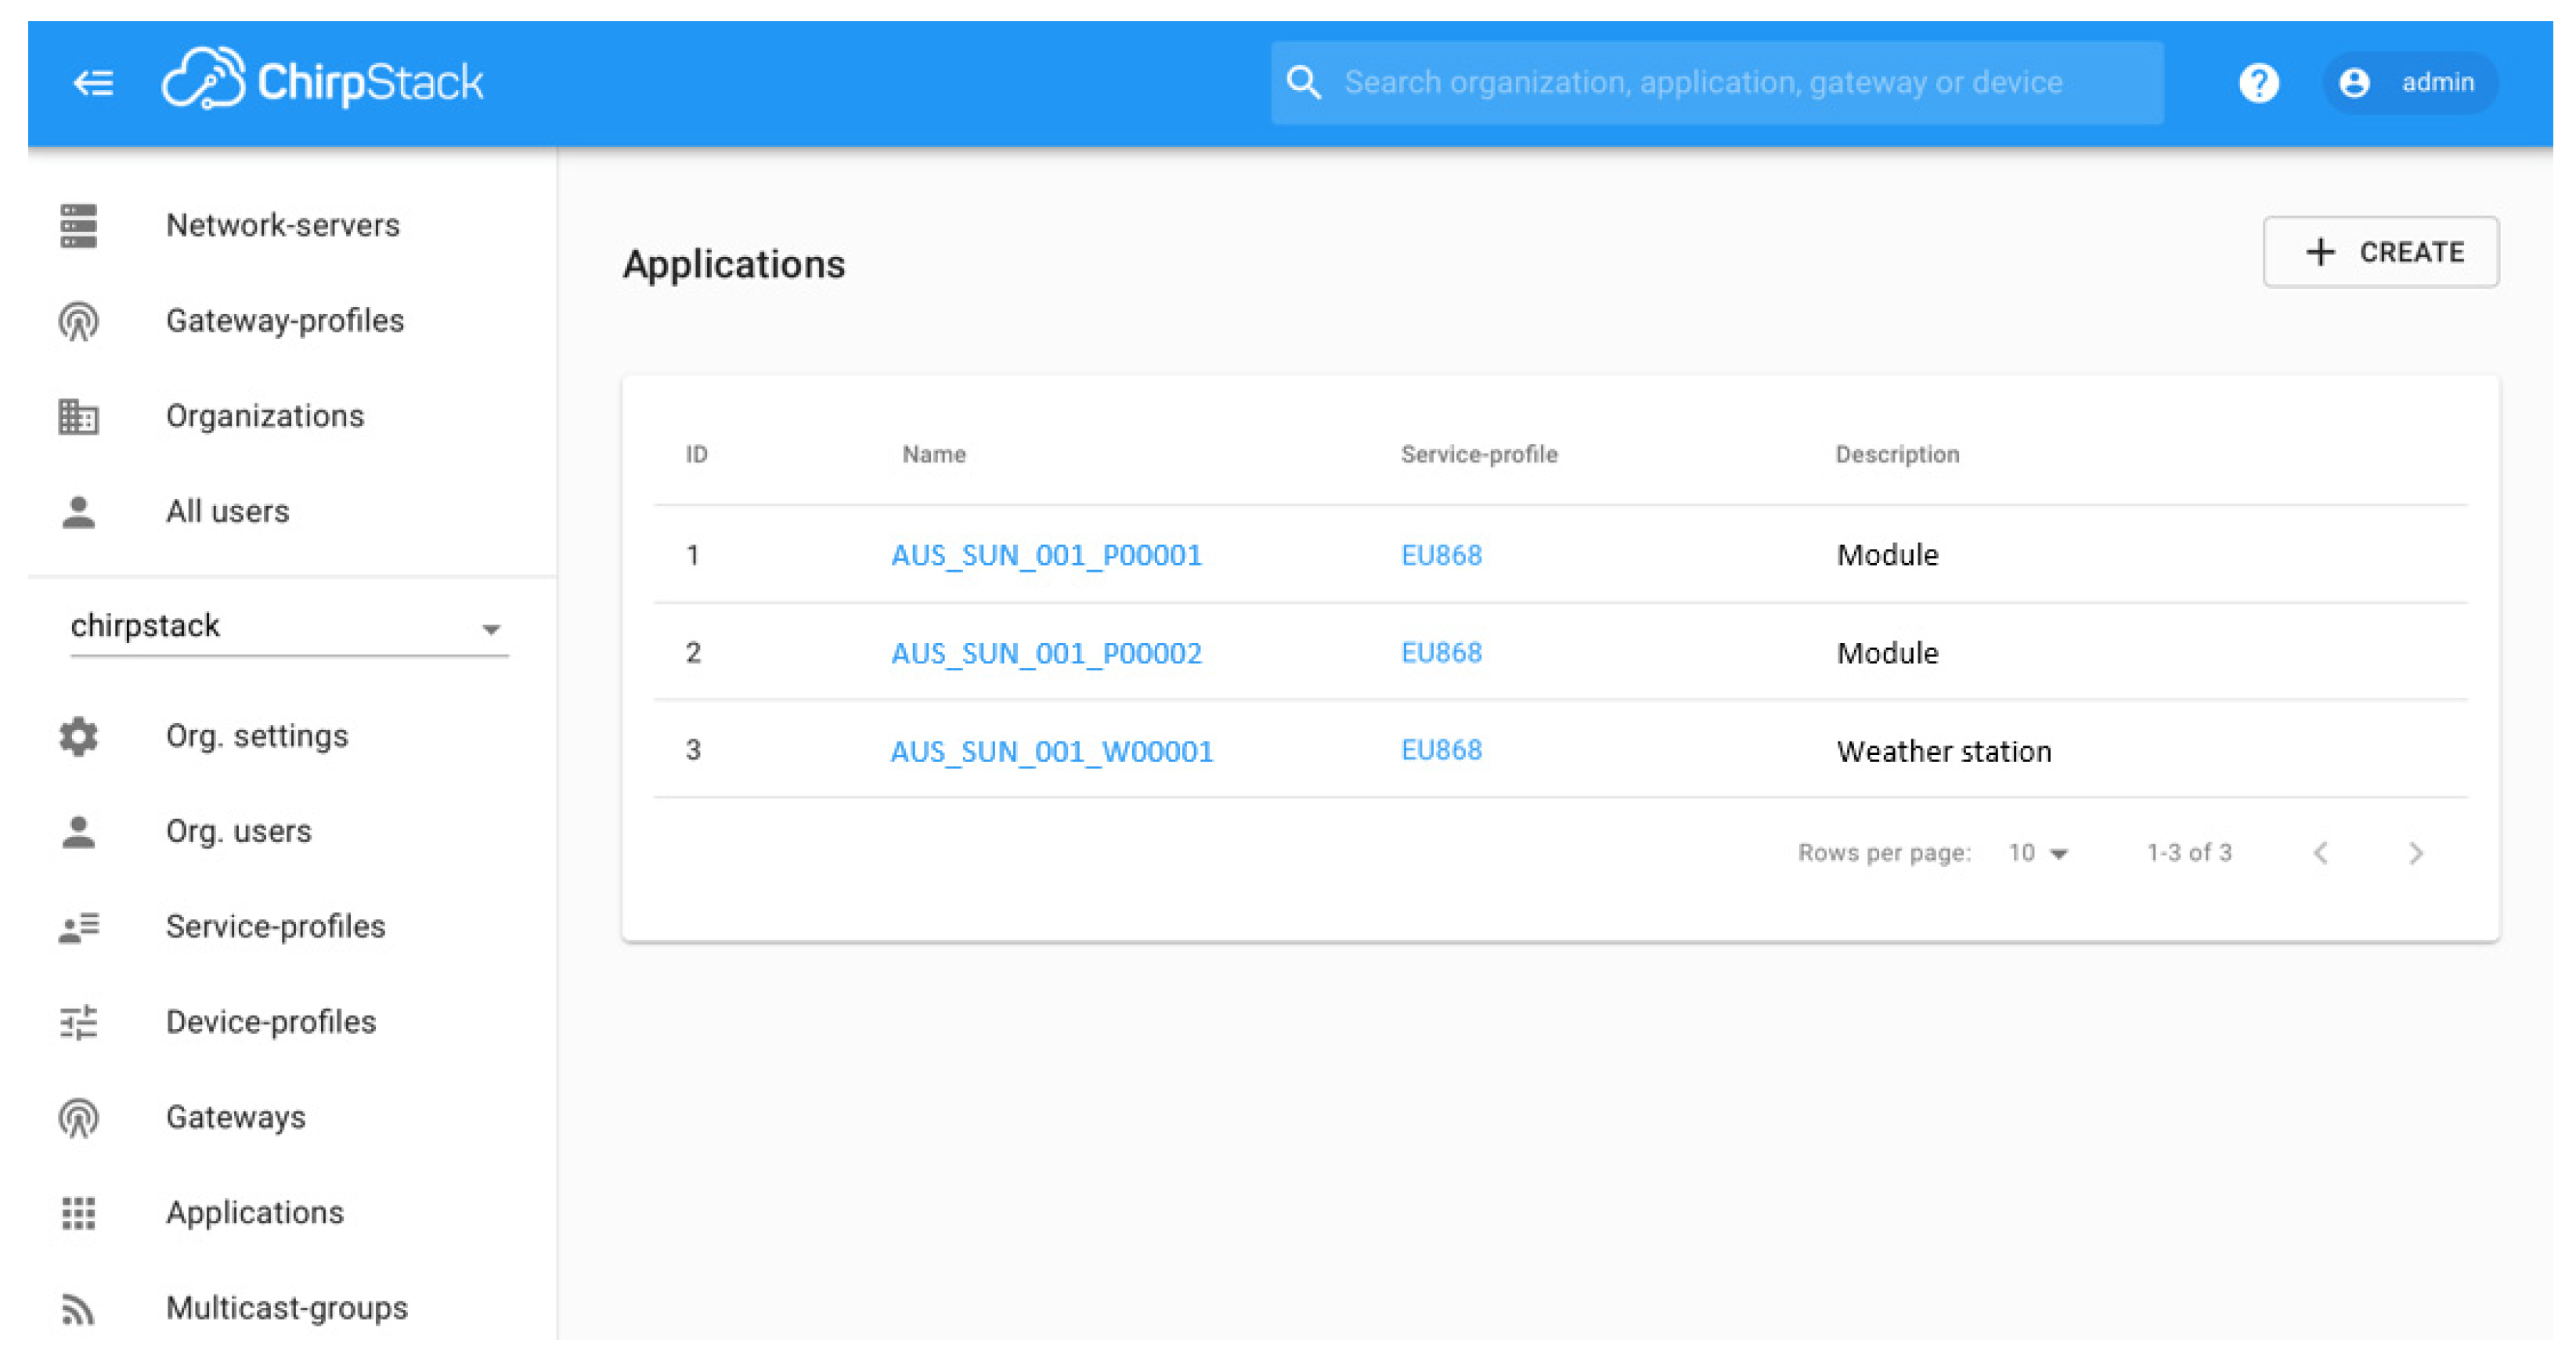
Figure 2b. Edge devices communicate with the gateway over the 868MHz frequency band. In addition to forwarding data from the LoRaWAN network over the internet, the gateway hosts the Chirpstack LoRaWAN server stack which performs device identification and management. The Chirpstack interfaces is shown in
Figure 3.
The LoRaWAN gateway, forwards the information received over the LoRaWAN network using the Message Queuing Telemetry Transport (MQTT) [
33] over wireless (e.g., WiFi, 4G, 3G) or wired connection (e.g., Fiber) to the datacenter.
Solar module and battery current and voltage information typically captured by proprietary monitoring devices provided by electrical equipment vendors can also be integrated into the proposed architecture. Such devices are represented by the “Industrial Monitoring Unit” in
Figure 1. Most modern electrical equipment such as Maximum Power Point Tracking (MPPT) controllers and Battery Management System (BMS) are equipped with a wired or wireless interfaces used to relay real-time information. This information is often communicated over open standard communication protocols such as MQTT and Modbus-TCP/IP [
34]. Messages from such devices are routed through a local gateway which forwards data over LoRaWAN.to be integrated into the LoRaWAN infrastructure. An analysis of the cost and resources required to operate such a design has been presented in [
35].
4.2. Core Infrastructure
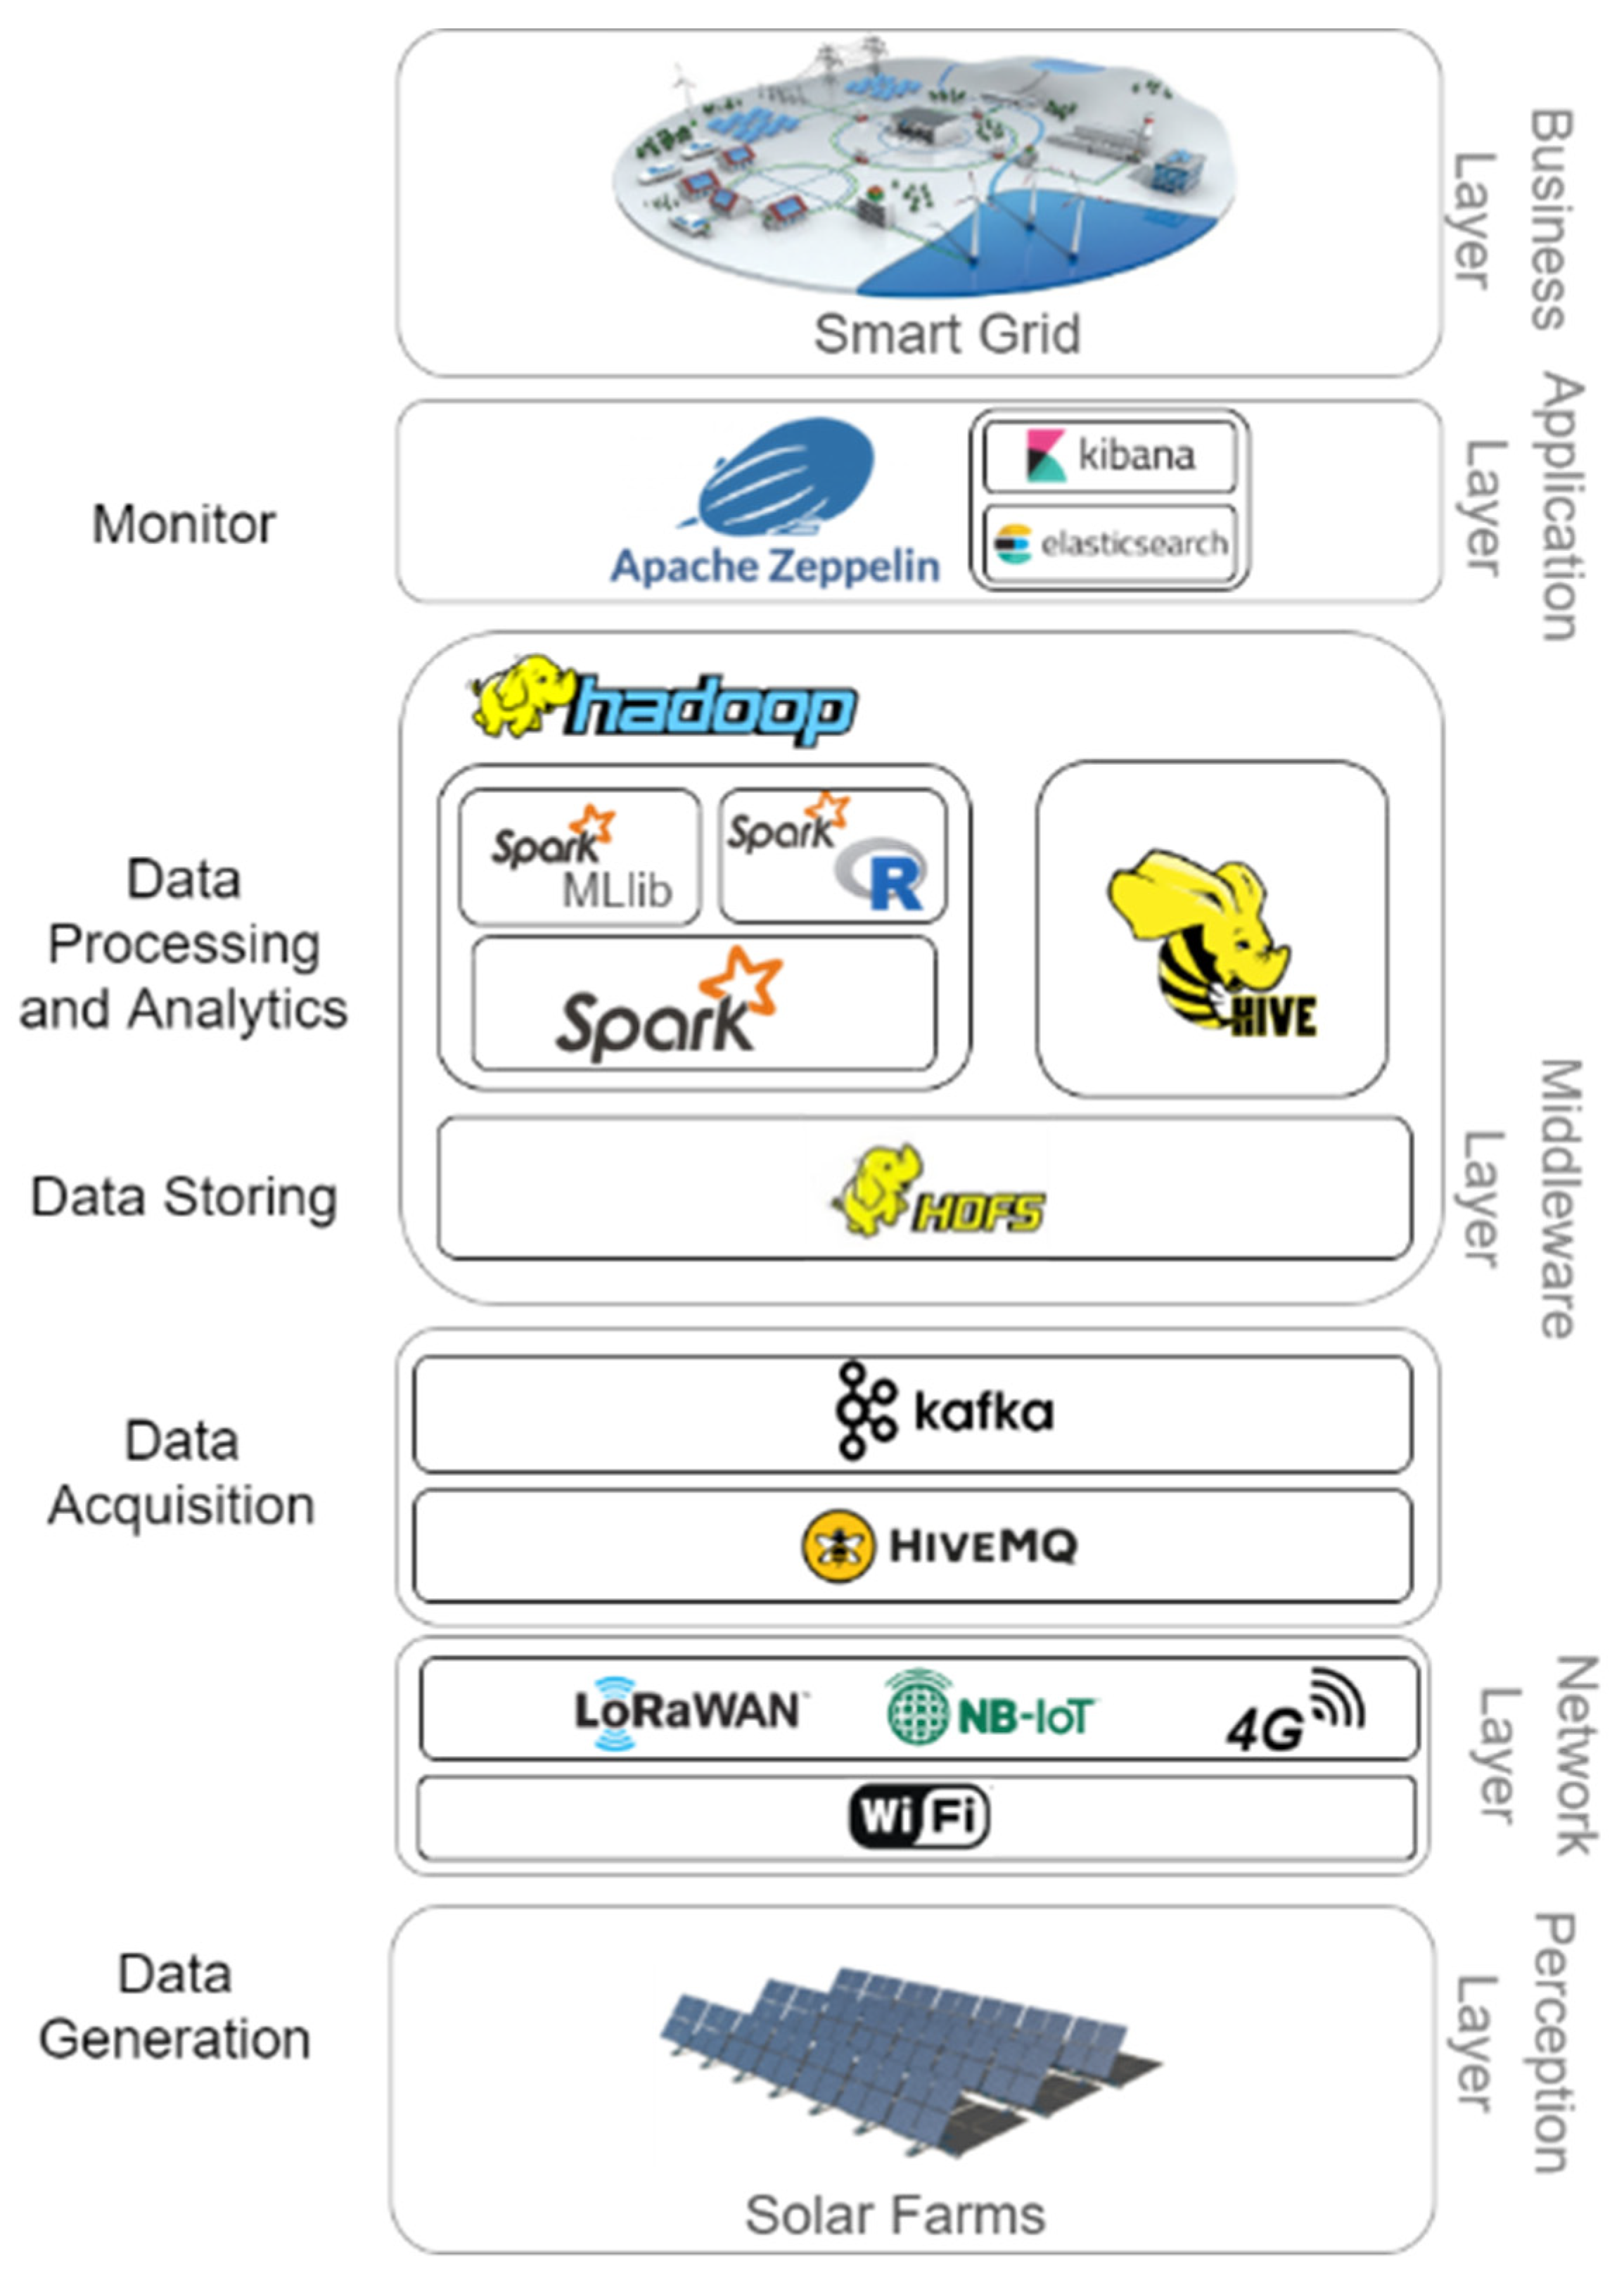
Data from edge monitoring devices is transported through a hybrid wireless network infrastructure all the way to the datacenter, or the “core”. The core infrastructure, shown in
Figure 4, provides interfaces and services for end-to-end data communication, processing, storage, and visualization. At the application level, data communicated from edge devices at remote solar farms is aggregated through an MQTT-Kafka distributed data streaming network. While MQTT provides low-cost event-based communication for edge devices [
9], Kafka [
36] offers real-time streaming of massive information from remote edge devices to the backend infrastructure [
37]. Distributed clusters of MQTT brokers and Kafka brokers make for an efficient communication network that is lightweight at the edge where resources are limited, and robust and scalable at the core where heavy data streaming is required. MQTT-Kafka streaming architectures have been previously proposed and evaluated in the context of smart medical applications [
38], cooperative and intelligent transportation systems [
39], and real-time data stream analytics [
40].
Once data is at the Kafka broker, a connectors from Kafka to Spark make it possible to stream it in real-time to stakeholders, apply artificial intelligence algorithms to produce real-time analytics, or store the information in Hadoop Distributed File System (HDFS) [
41]. At the backend, an orchestra of Celery [
42] workers and Spark [
43] jobs are deployed to offer microservices such as resource management, data management, data processing, and many others. Communication between Celery’s microservice workers takes place over message-oriented middleware based on AMQP [
44]. The core also includes a MongoDB [
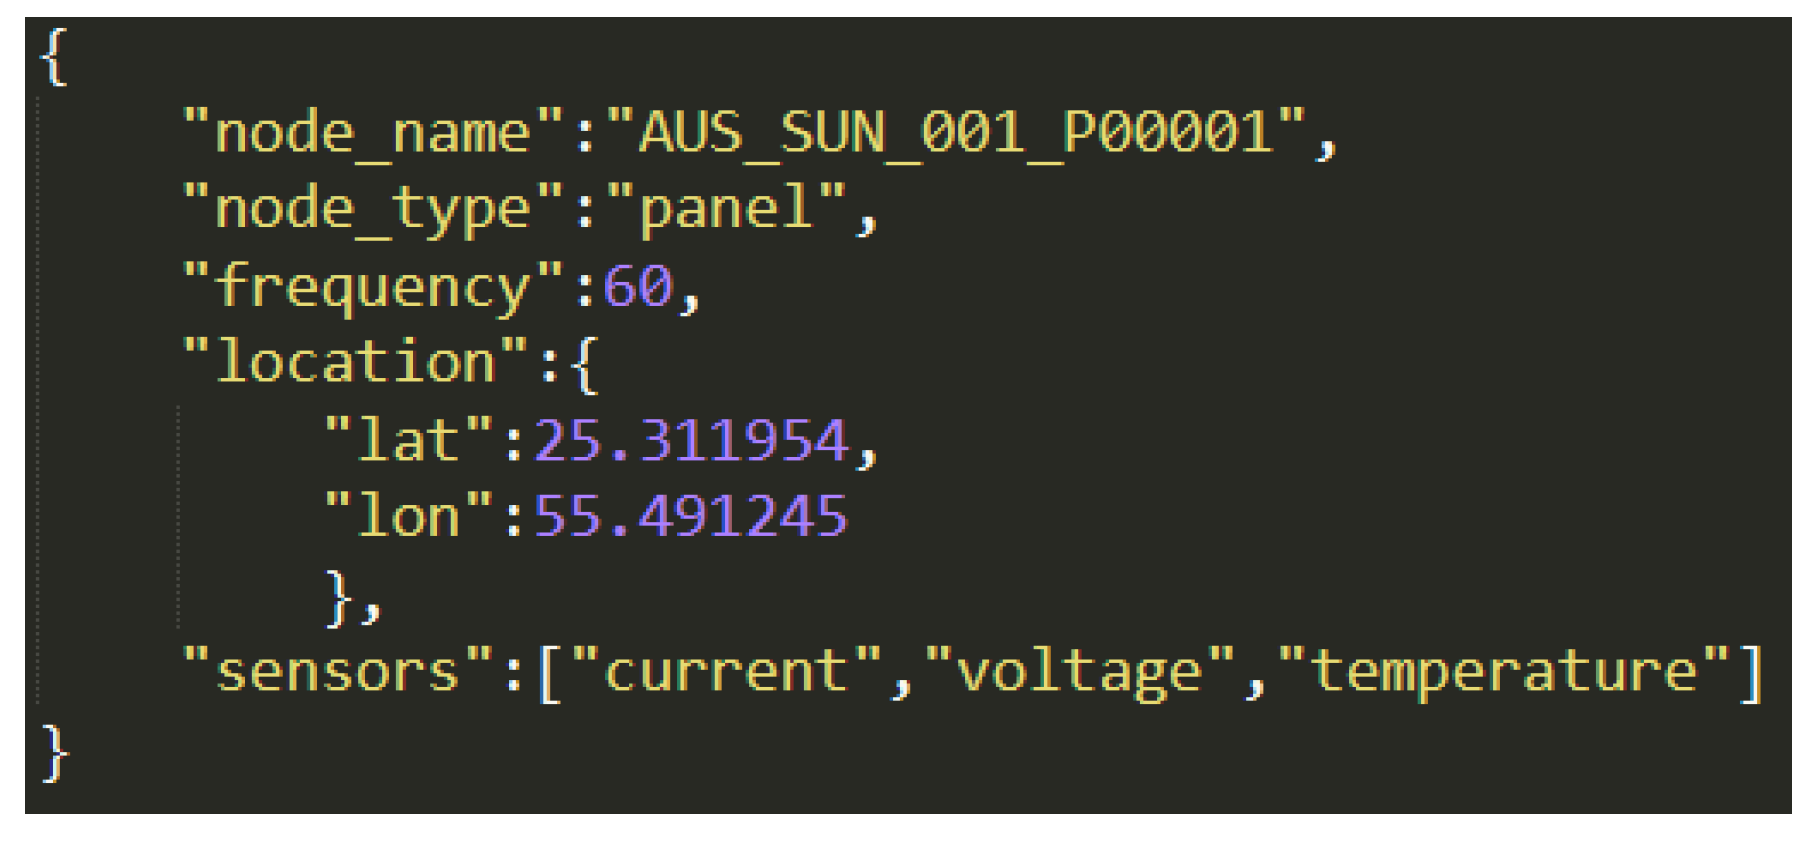
45] database which keeps records of all edge stations operating in the remote facilities. This data is used for device management as well as processing data, where each device has a profile that describes its location, the type of resources it offers, as well as miscellaneous O&M information. A sample of an edge device profile is shown in
Figure 5, while a packet generated by that edge devices is shown in
Figure 6.
4.3. Front-End
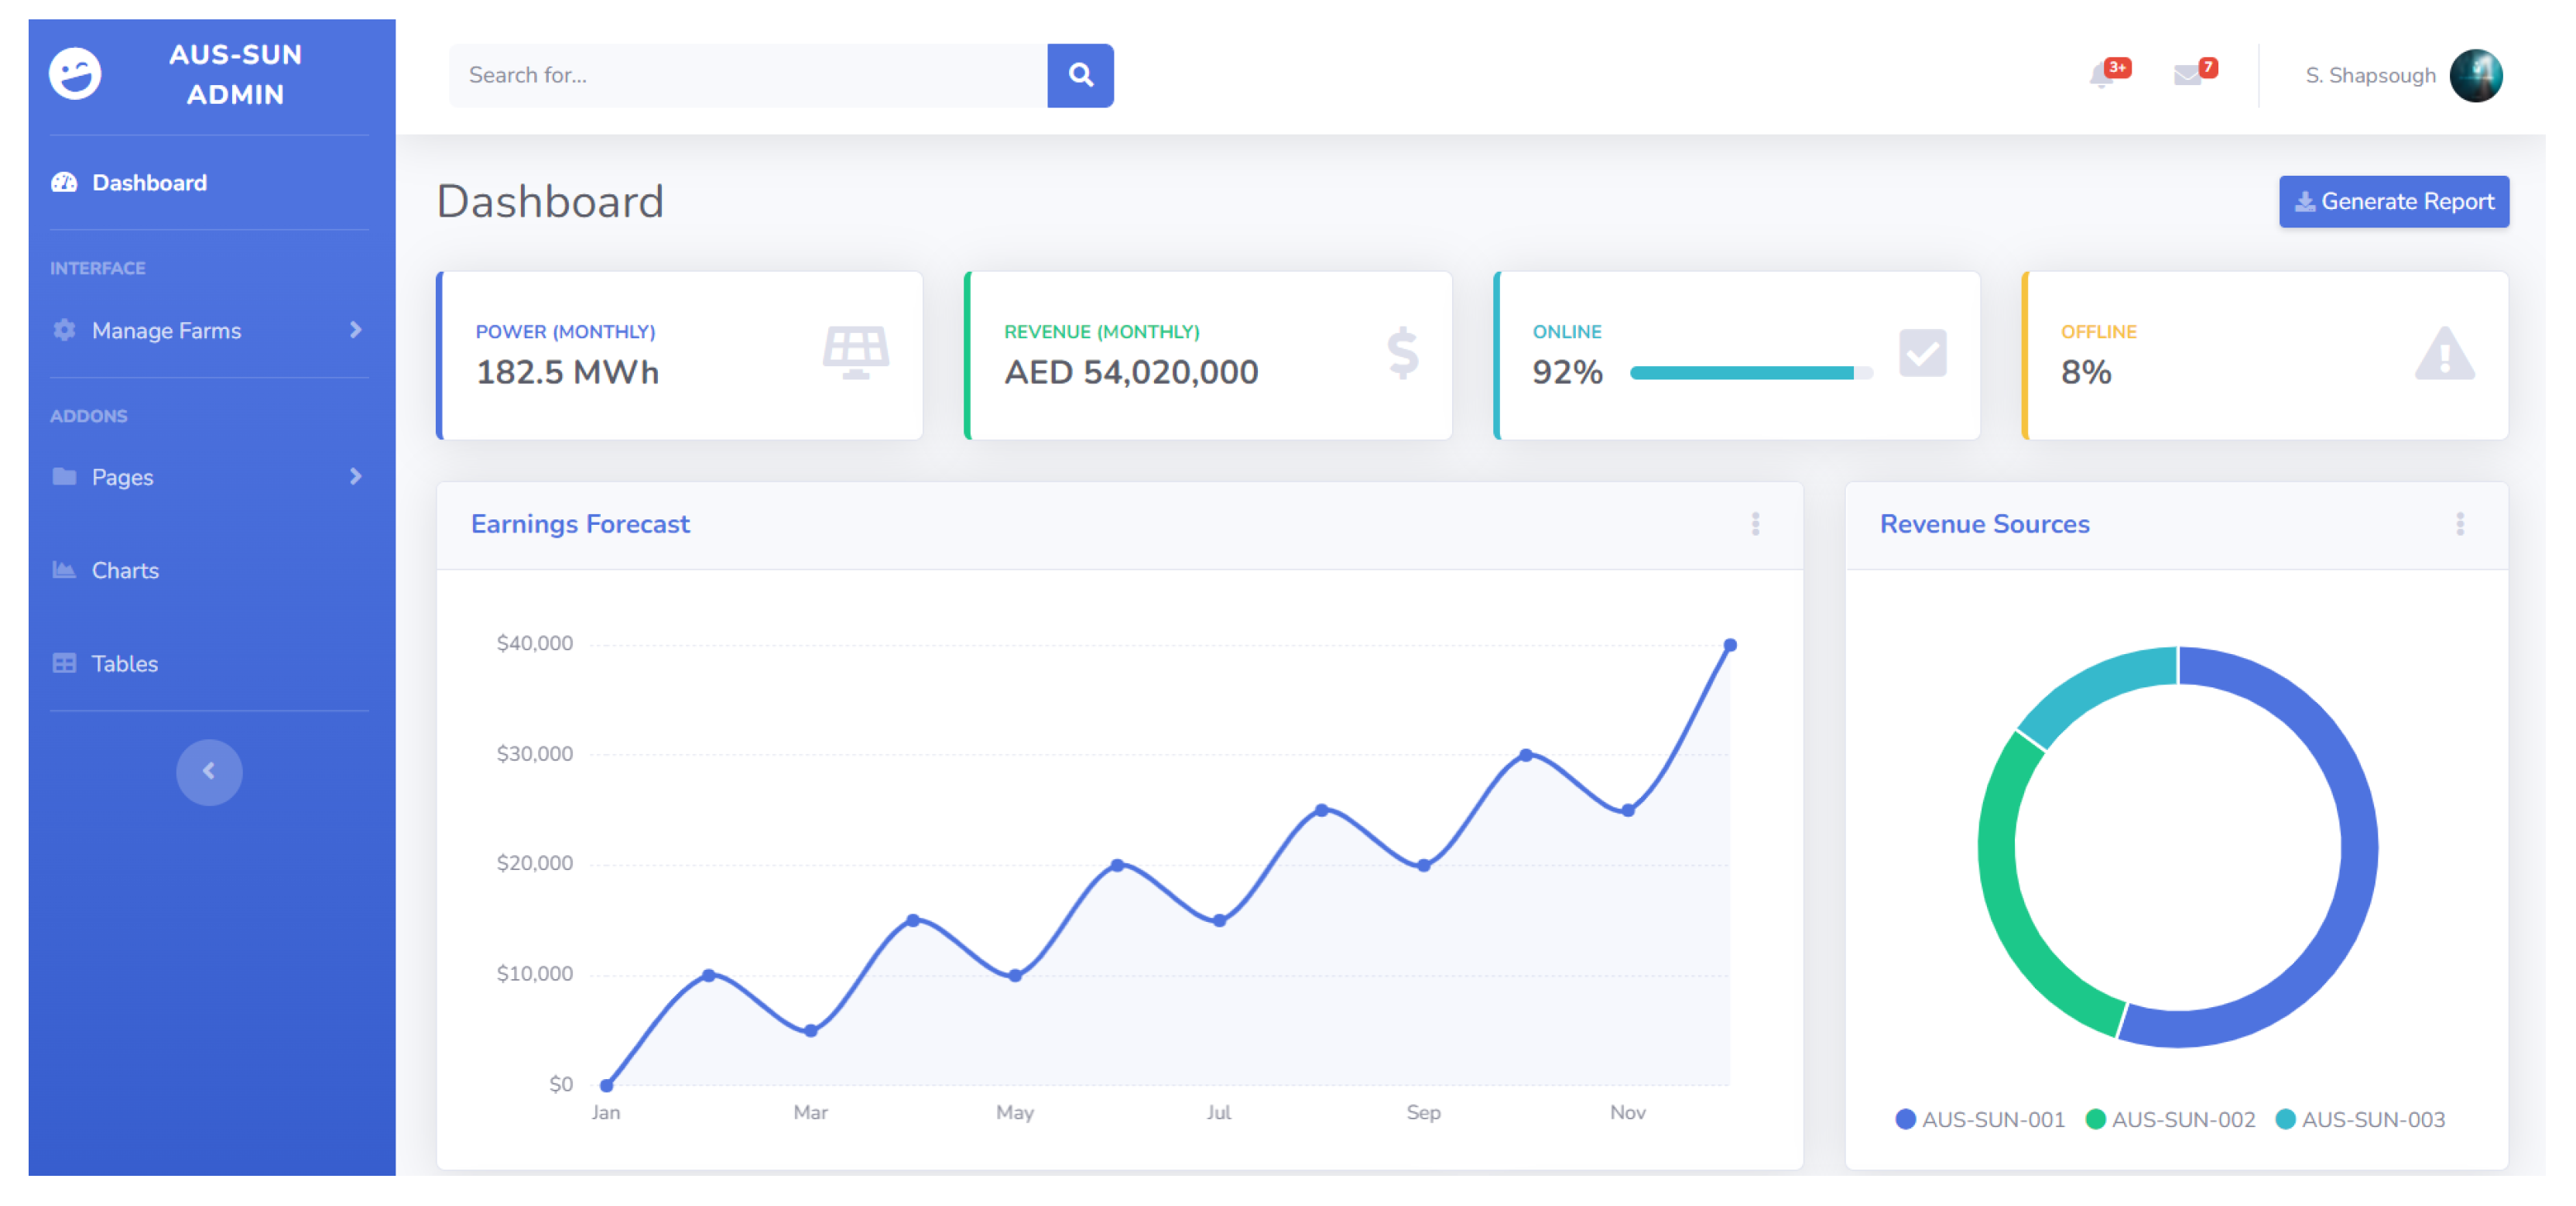
The front-end consists of a web application that allows stakeholders to monitor the performance of solar facilities in real-time. Stakeholders also have access to information regarding monthly power output and earnings, individual facility contribution, and earnings forecasts for the upcoming months. The web application also allows stakeholders to view detailed information per facility, as well as modify system properties such as data granularity and publishing frequency. Furthermore, data analytics such as forecasts, anomaly classifications, and system diagnostics are readily available. Samples of the admin dashboard are shown in
Figure 7 and
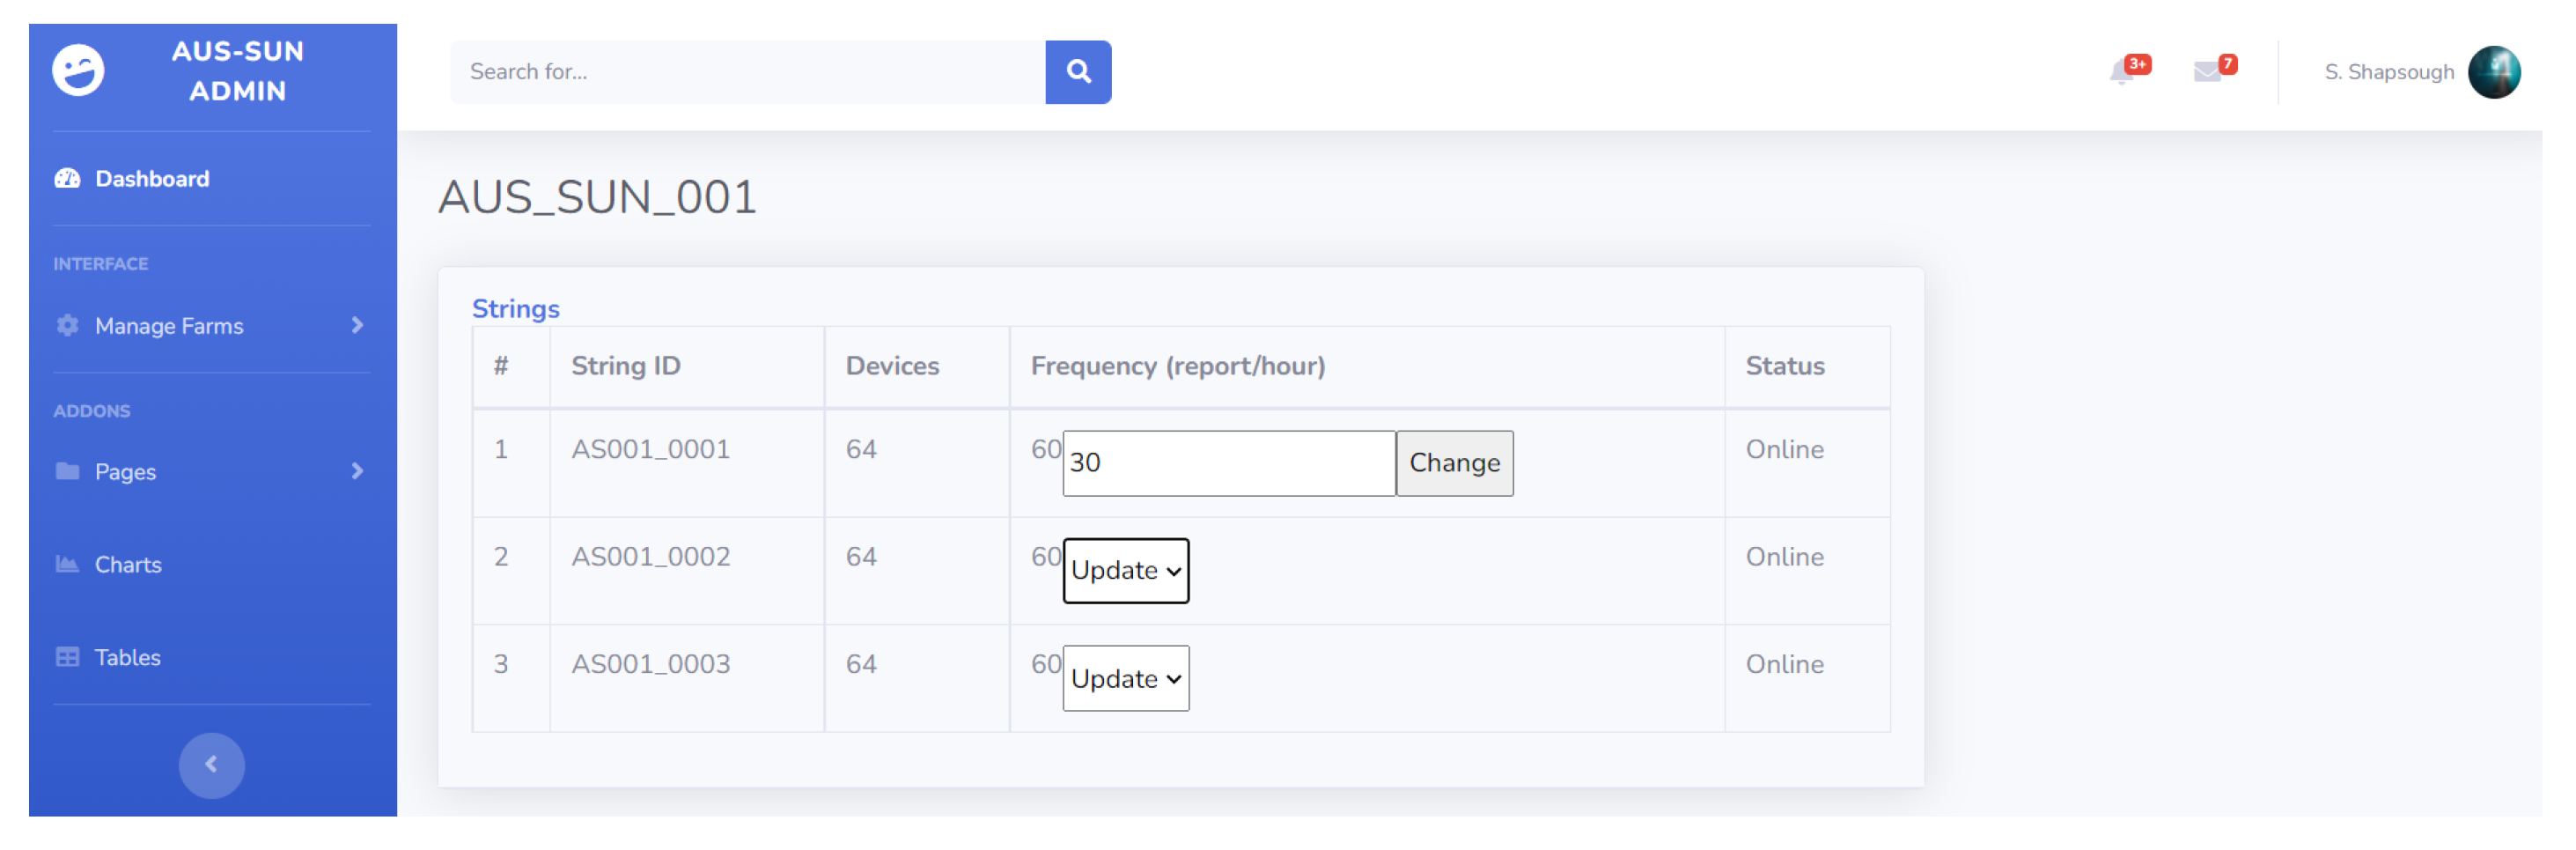
Figure 8, while a sample of system property control, specifically device frequency control, is shown in
Figure 9.
5. Microservices
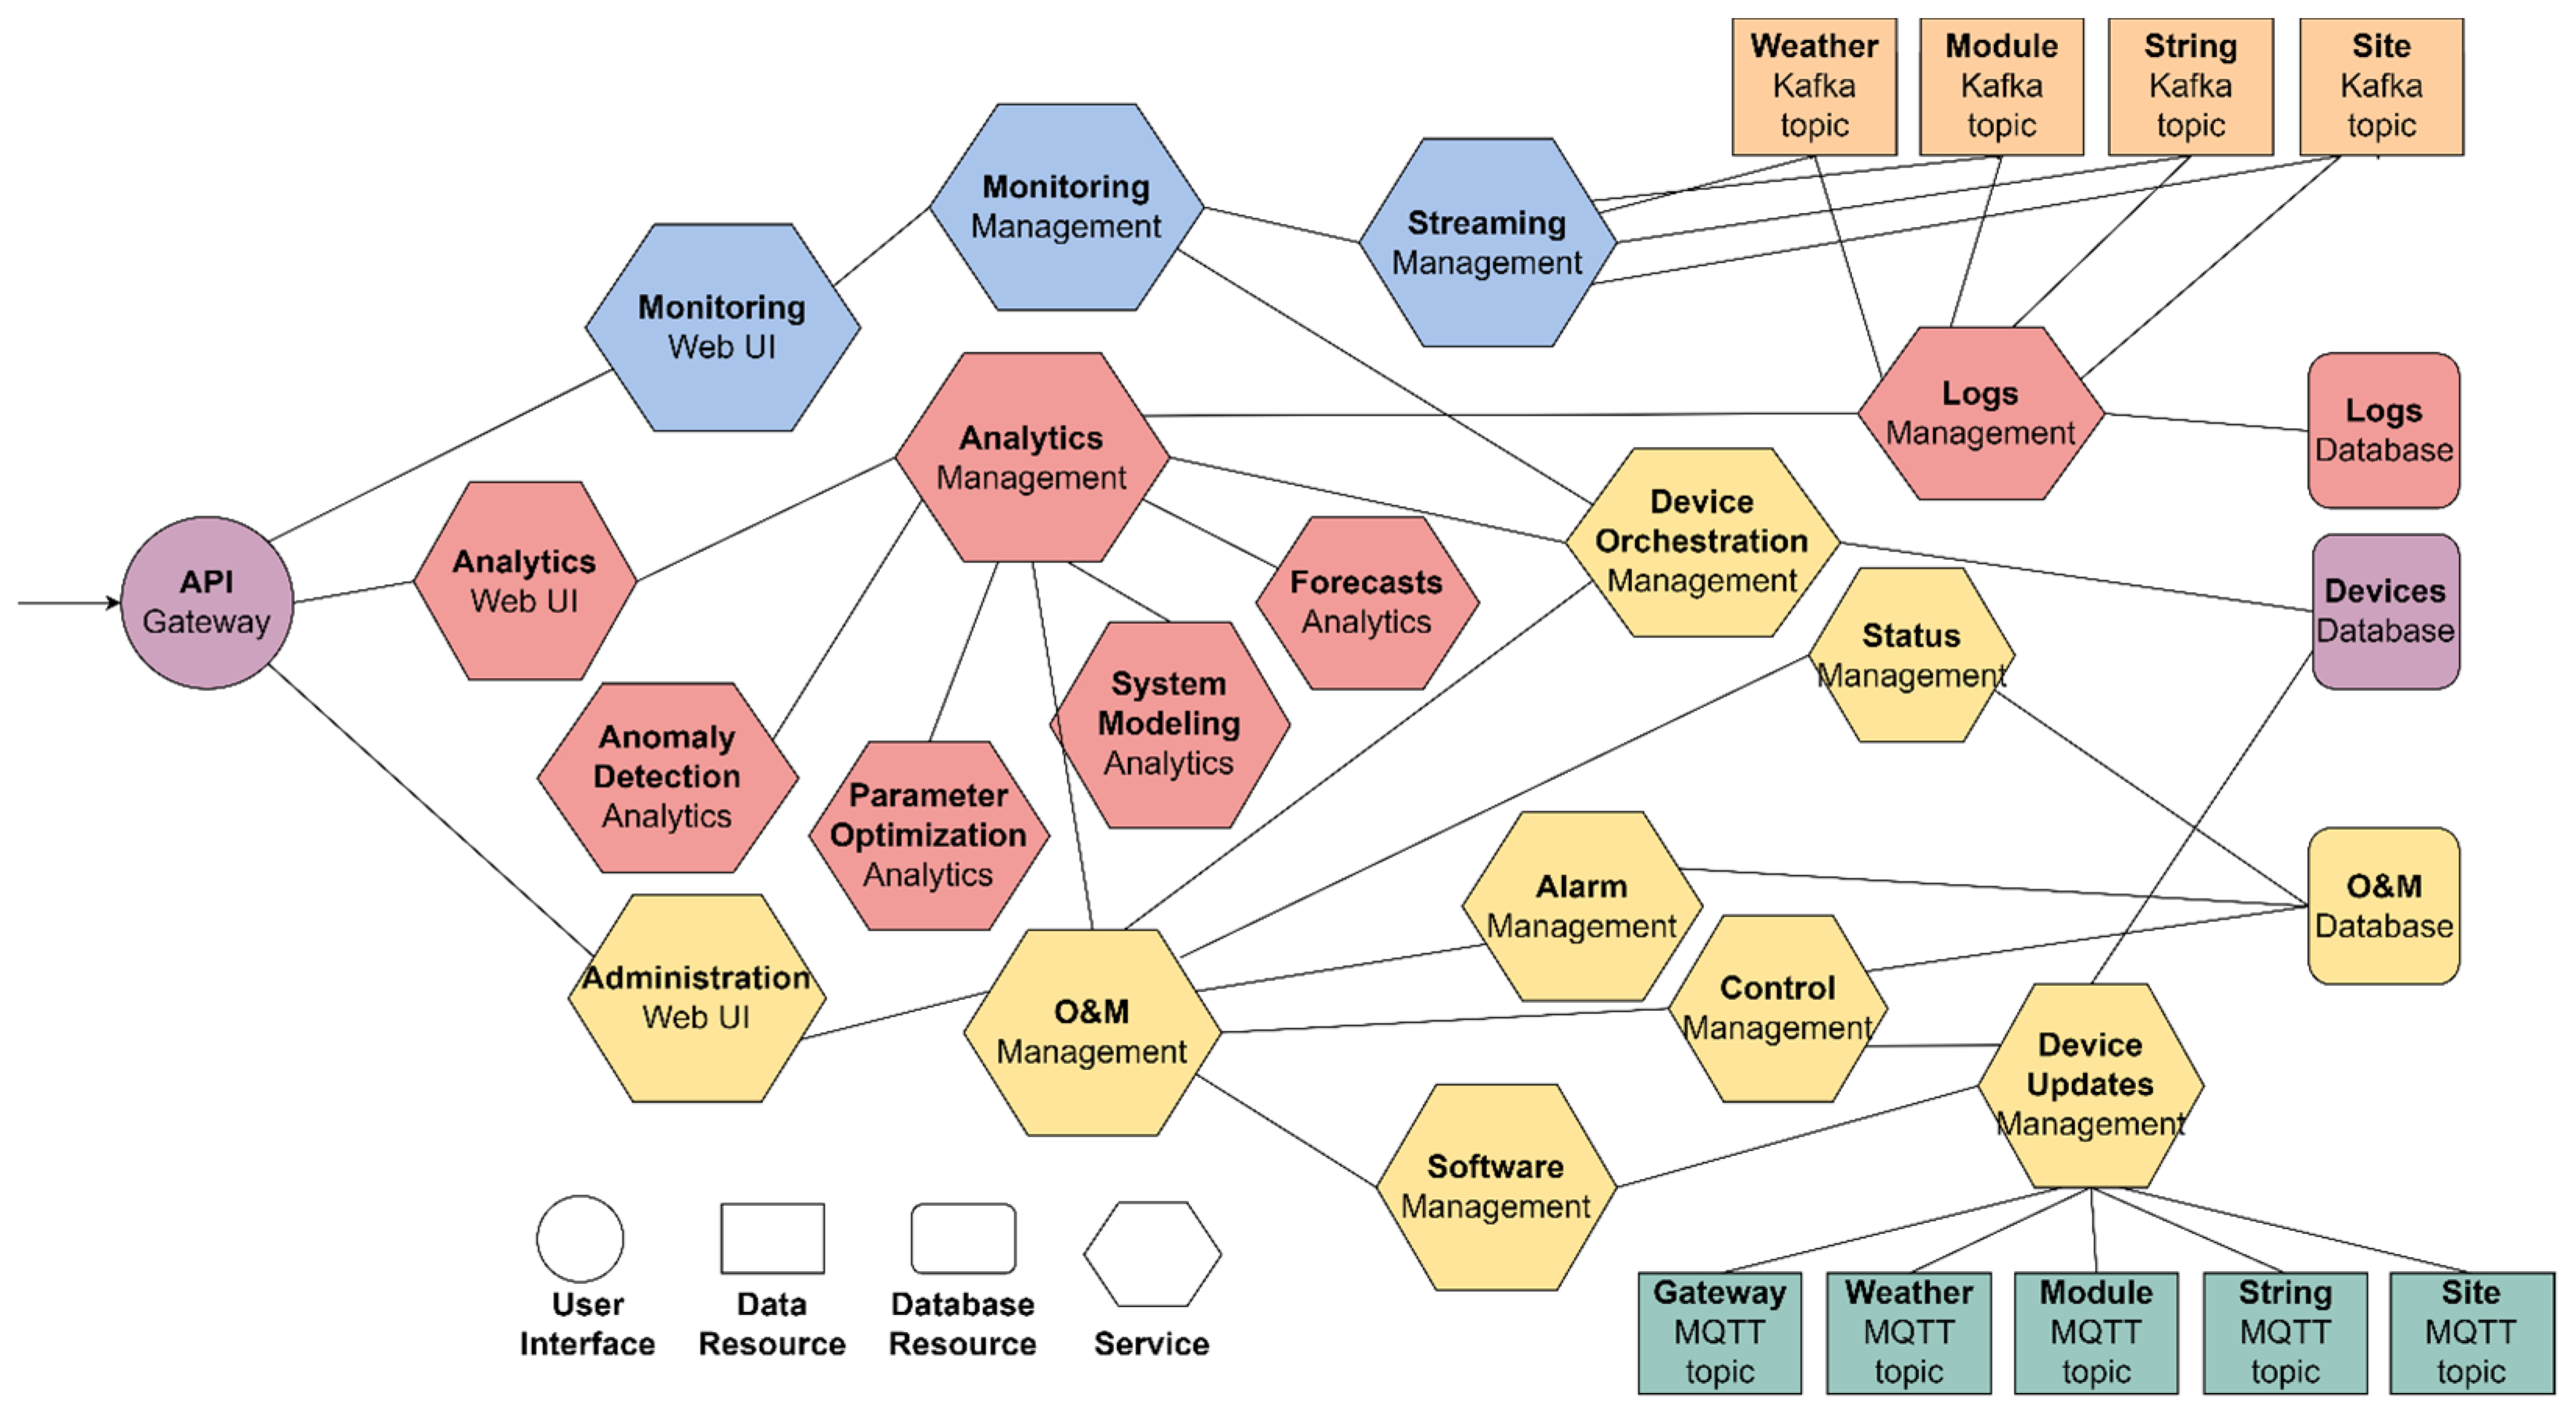
The system utilizes microservices-based architecture to provide administrative and operational capabilities to stakeholders. A microservices architecture is an architectural style that consists of loosely coupled services which function within the same framework but can be deployed, tested, and maintained independently. Microservice architectures are especially useful to Internet of Things systems because they allow for the seamless integration of new services and continuous upgrade of existing ones without disturbing the rest of the ecosystem. By decoupling the service, it is possible to implement each service using the most suitable technology, resulting in a heterogenous system of resources and services which communicate seamlessly using common interfaces and standardized communication protocols.
Figure 10 shows the microservices architecture. The services required in a solar power monitoring system can be roughly categorized into three types: real-time monitoring, intelligent analytics, and Operation and Maintenance (O&M). In each type of service, several workers are implemented to provide different microservices which collaborate on various tasks and continuously exchange data between them as well as the rest of the system.
5.1. Real-Time Monitoring
Real-time monitoring microservices are concerned with delivering observations describing the performance of the solar panels as well as their environment from remote solar farms to stakeholders. For example, the microservices can be implemented so that:
One worker initiates and maintains a Spark job which routes Kafka streams into MQTT topics.
One worker handles MQTT clients and delegates real-time data to the Web User Interface (UI).
One worker hosts the Web UI.
5.2. Data Analytics
Data analytics microservices provide stakeholders with summarized and detailed reports about the performance of remote solar farms at varying granularity levels. Moreover, this category hosts microservices cable of performing intelligent analytics including running machine learning and deep learning algorithms. Such algorithms are used to generate virtual models of solar farms which can then be used to generate customized forecasts, predict output, and plan accordingly. For example, a stakeholder might be interested in viewing the output forecast for multiple distributed facilities. Such report is needed for power planning in major grids in order to plan power distribution and access to power reserve [
46,
47]. Models are also used to perform preventative and reactive maintenance in order to prevent short-term and long-term disturbances in solar energy production from propagating through the grid. Using data acquired from operating facilities, individual models can be constructed for the system on the facility, string, and module level. The models run in parallel with the facility and are used to detect anomalies or deviation from expected performance, or schedule maintenance activities [
48,
49]. The increase in granularity consequently increases the accuracy of predictions by factoring the unique and individual conditions of each module, which can be affected by the geographical and electrical context of a module.
5.3. Operation and Maintenance (O&M) Management
Operation and Maintenance (O&M) Management processes play a key role in ensuring the continuous and reliable operation of the solar farm as well as the data transmission and processing infrastructure. O&M use a mix of real-time data and data diagnostics in order to identify system anomalies and recommend the most appropriate course of action, for both preventative as well as reactive maintenance [
50].
By implementing the backend as a modular microservice-based system, it is possible to update, modify, add, or remove any of the workers without causing any obstructions to the system as long as workers abide by communication standards and format. Furthermore, it is possible to scale the system in order to support higher volumes of data by duplicating the workers to provide means of load balancing.
5.4. Use Cases
Possible use cases the system is expected to provide include the general needs of any monitoring and analytics system, as well as installation-specific services relating to the kind of study, analysis, or service the farm is expected to provide. Below are four possible use cases and they can be implemented using the proposed infrastructure.
5.4.1. Use Case 1: Add a New Module Edge Device to the System
A regularly expected event is the addition of a new edge node to the system. This can include a module monitoring device, a battery monitoring device, a weather station, or any type of device expected to operate at the farm and provide information about the state or context of the farm. For the node to start operation, the system needs to not only update its registry of devices, but also update all context-related registers such as the string, array, and farm the devices is to be deployed in. Other actors in the system should also be made aware of the addition of the devices and the type of data resource it offers, and whether the device offers unique new information or has been added to reduce the load on other devices provided similar data resource.
The following steps should take place:
Add a new LoRaWAN device to The Things Network (TTN) (
Figure 4).
Register the LoRaWAN device to the application (TTN) along with its location (
Figure 11)
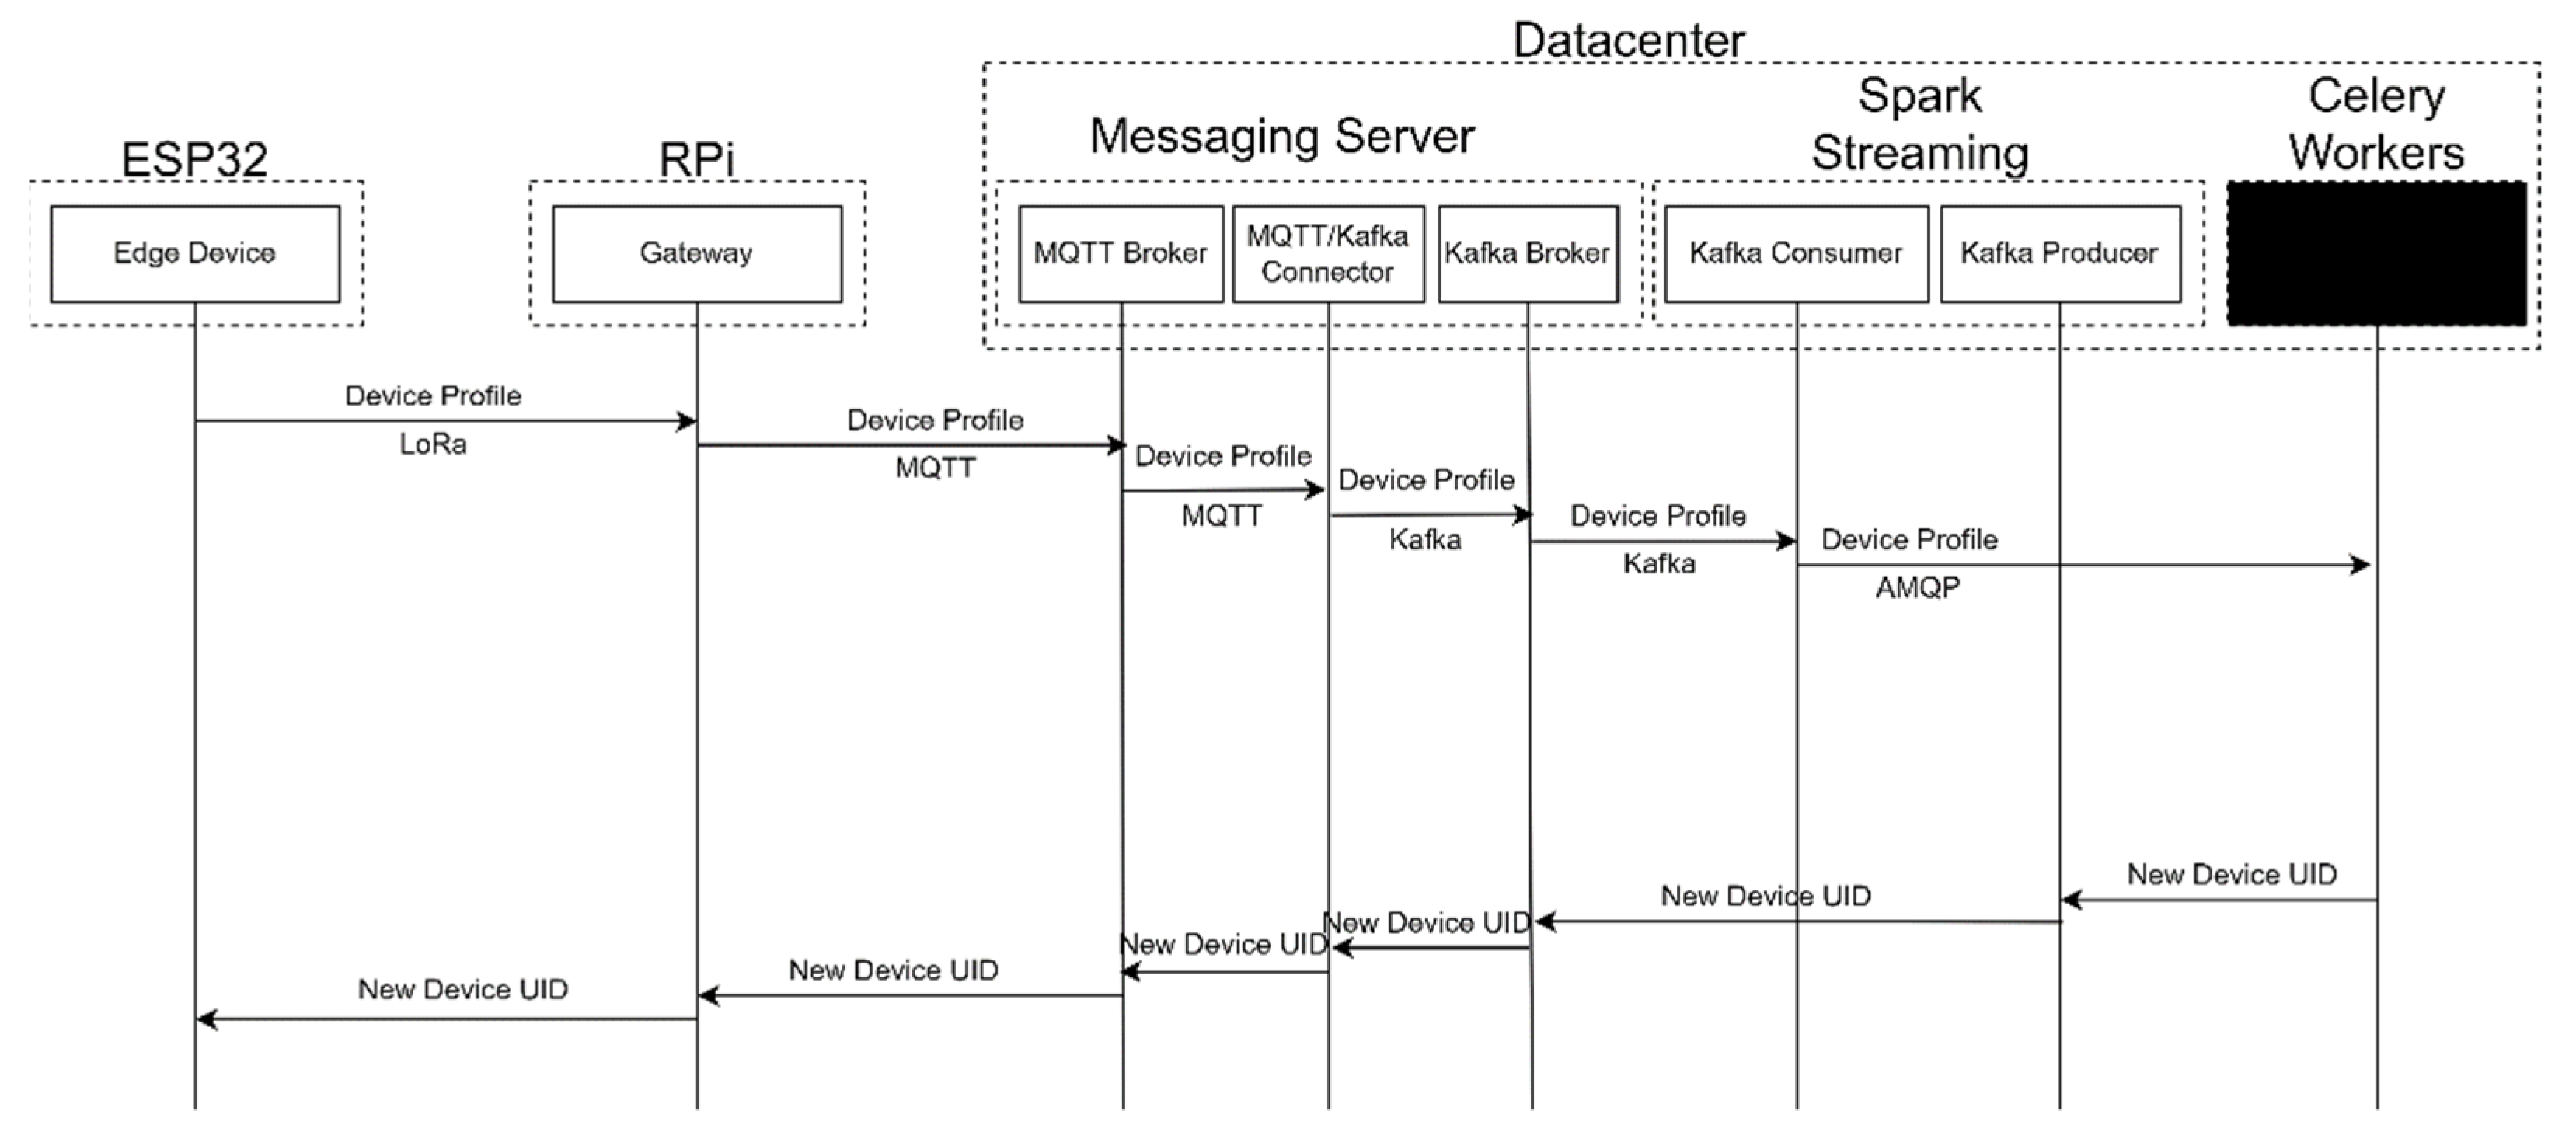
Send the edge device metadata to Celery (
Figure 12). The device can be a panel, a battery, a string, or a site
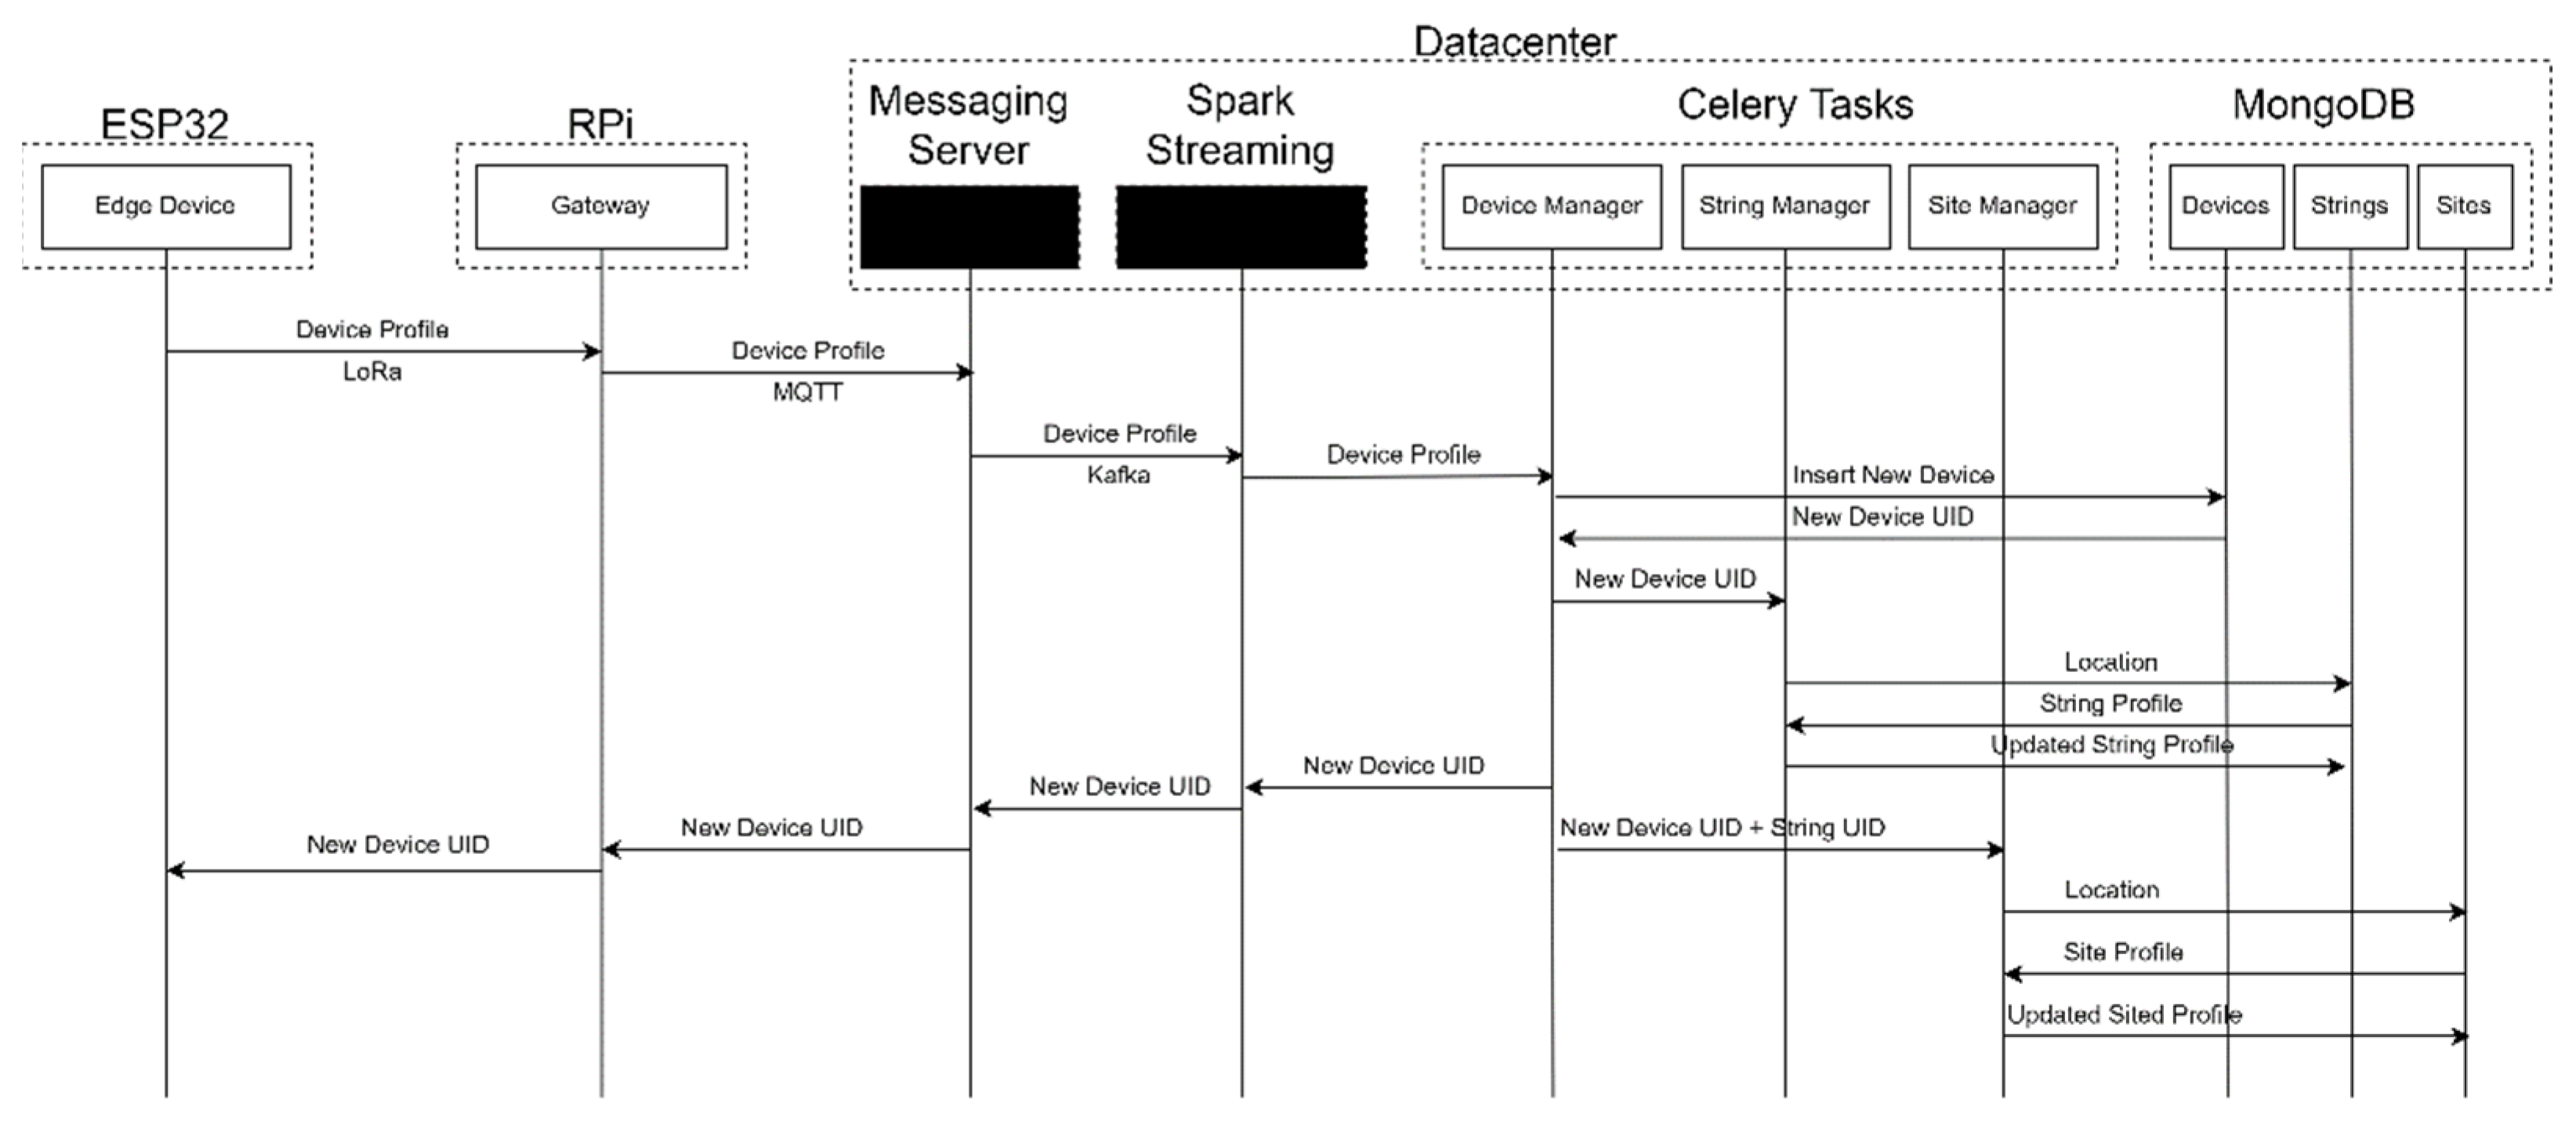
A Celery worker add/update the device’s profile in the database (
Figure 13) by:
If the site ID already exists, it will add/update the string profile.
If the String ID already exists, it will add the ID of the edge device to the string. Else, it creates a new string.
If device ID already exists, it will update its metadata. Else, it creates a new profile.
5.4.2. Use Case 2: Change Behavior of a String Monitoring Device to Report Data Every 2 Min Instead of Its Old Reporting Behavior
Another regularly occurring event is the need to remotely change the behavior of a monitoring device, whether it is the frequency of reporting, or the type of data reported. For example, an administrator notices the behavior of solar modules in a specific location has been fluctuating at a high frequency. In order to capture their behavior, the administrator might decide to temporarily increase the reporting frequency from once every hour to once every two minutes. Such operation would be carried out as follows:
User selects string from interfaces and updates information as required (
Figure 5)
Message is sent to the edge device through Kafka-MQTT-LoRa downlink
Device updates its sending frequency
Device’s profile is updated with new expected sending frequency
The process is divided into individual tasks which are distributed across several Celery workers, where each worker specializes in handling a specific segment of the process. For example,
Figure 14 shows the worker code for updating the entry for the string in the database, as well the worker which publishes the update to all devices in the string so that they start reporting at the selected frequency.
5.4.3. Use Case 3: Request New Type of Power Forecasts for a Specific Farm
Changes in the behavior of modules might raise the need to predict the output of a specific segment in the system or the system as a whole. For example, solar modules are more susceptible to soiling due to decreased humidity and increased sandstorms. Solar modules also suffer from higher overheating during summer due to high ambient temperatures and irradiance. Soiling behavior requires a different type of data collection and analytics models than that of overheating. Since administrators can be interested in studying different behaviors at different points of time, it is important that the system offers the flexibility to update its models as well as generate new models based on the needs of a given context.
User selects site and requests power output for the next week.
Device orchestration worker creates a list of relevant modules, strings, and weather devices.
Data retrieval worker prepares a table with all relevant data points.
Analytics manager builds models.
The result is displayed on the web application.
5.4.4. Use Case 4: Respond to an Error
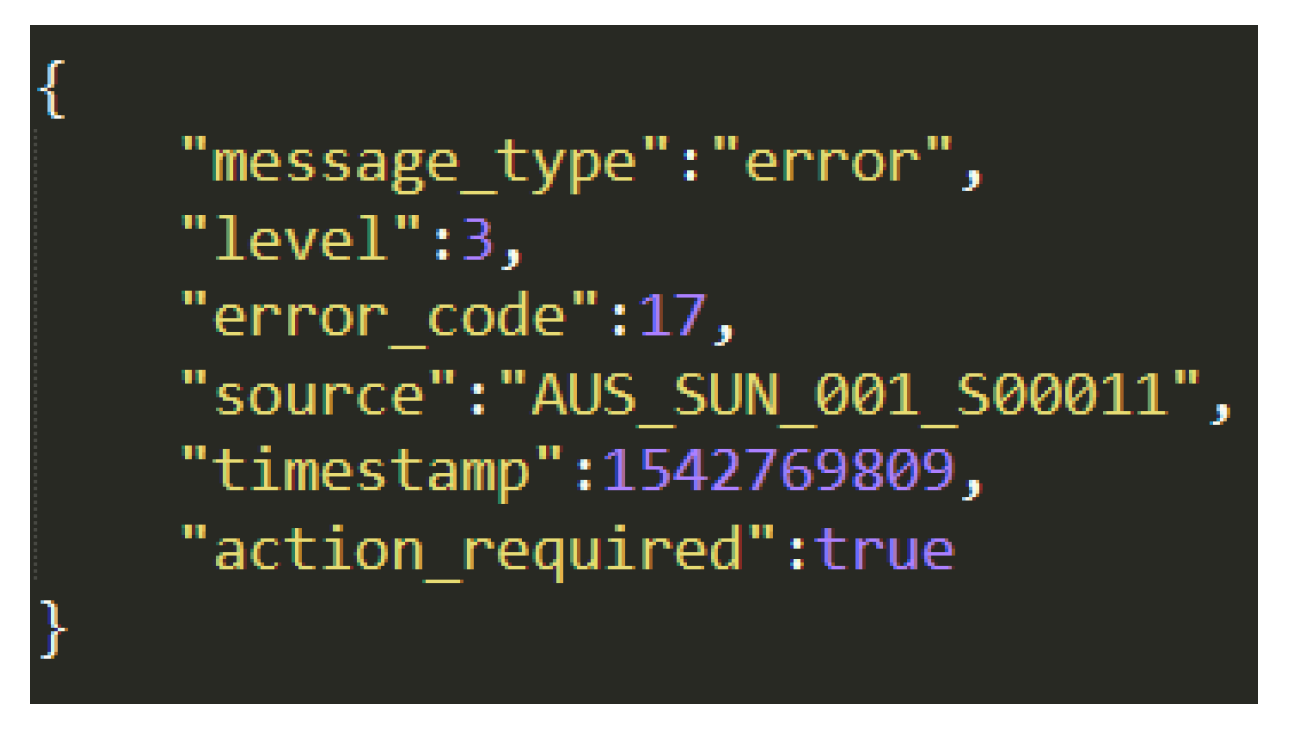
Anomalies are an expected part of energy generation. As discussed before, solar energy systems deal with a wide array of natural and man-made short-term and long-term anomalies. As a result, the system should be equipped with the intelligence and capabilities to appropriately diagnose and respond to anomalies within strict time constraints. For example, a module monitoring device reporting a current of 0 amps would trigger the following tasks:
Device sends an error message over LoRaWAN which gets forwarded over MQTT to the server at the core. The message includes the source of the error, the criticality level, code, timestamp, and whether or not action is required (
Figure 15).
A Celery worker logs the error message into MongoDB.
Diagnoses worker grabs real-time panel reading records, last day readings, and maintenance history.
Based on the criticality and type of error, diagnoses worker sends all information to analytics worker.
Analytics worker sends back result to diagnoses worker.
Diagnoses worker sends alert and analysis to automate O&M.
If an automatic response is needed (e.g., bypass module), a control command is sent to on-location bypass switch. This is done over MQTT which gets forwarded via the gateway to the LoRaWAN downlink towards the device responsible for performing the action.
6. Evaluation
A preliminary evaluation of a similar architecture was carried out in [
35]. A more comprehensive evaluation is presented below. The evaluation aims to estimate the cost of operating such a system in a real-life large-scale solar facility. Thus, calculations are based on the actual capacity of eleven of the largest solar facilities in the world which included the five largest solar farms in China [
51], Noor Abu Dhabi Solar Power Plant [
52], and five phases of Mohammed bin Rashed (MBR) Al Maktoum Solar Park [
53]. The capacity of each installation is shown in
Table 3. The architecture was evaluated in terms of bandwidth requirements, power consumption, response time, security, and cost.
6.1. Scalability
Scalability here refers to the system’s ability to reliably manage the amount of data generated by the system. Reports are generated at three levels: module level, string level, and region/facility level. While the first two can be estimated, the “region level” refers to reports of readings that represent a region of the facility or the full facility such as solar irradiance, ambient temperature, and humidity. The amount of data generated by irradiance reports depends on how much environmental elements vary in a given facility. While ambient temperature can be considered consistent across the whole facility, shading may vary. For the purpose of this evaluation, environmental conditions are assumed to be reported per string. The size of packets generated at each level was calculated based on an existing remote solar monitoring system discussed in [
54].
Table 4 shows a breakdown of the estimated data mass generated per reporting period. For example, for MBR P1, 19.93 MB of data is required to report sensor data from all the edge devices. If this were to be reported once every second, then this would require a bandwidth of 19.93 MB/Second.
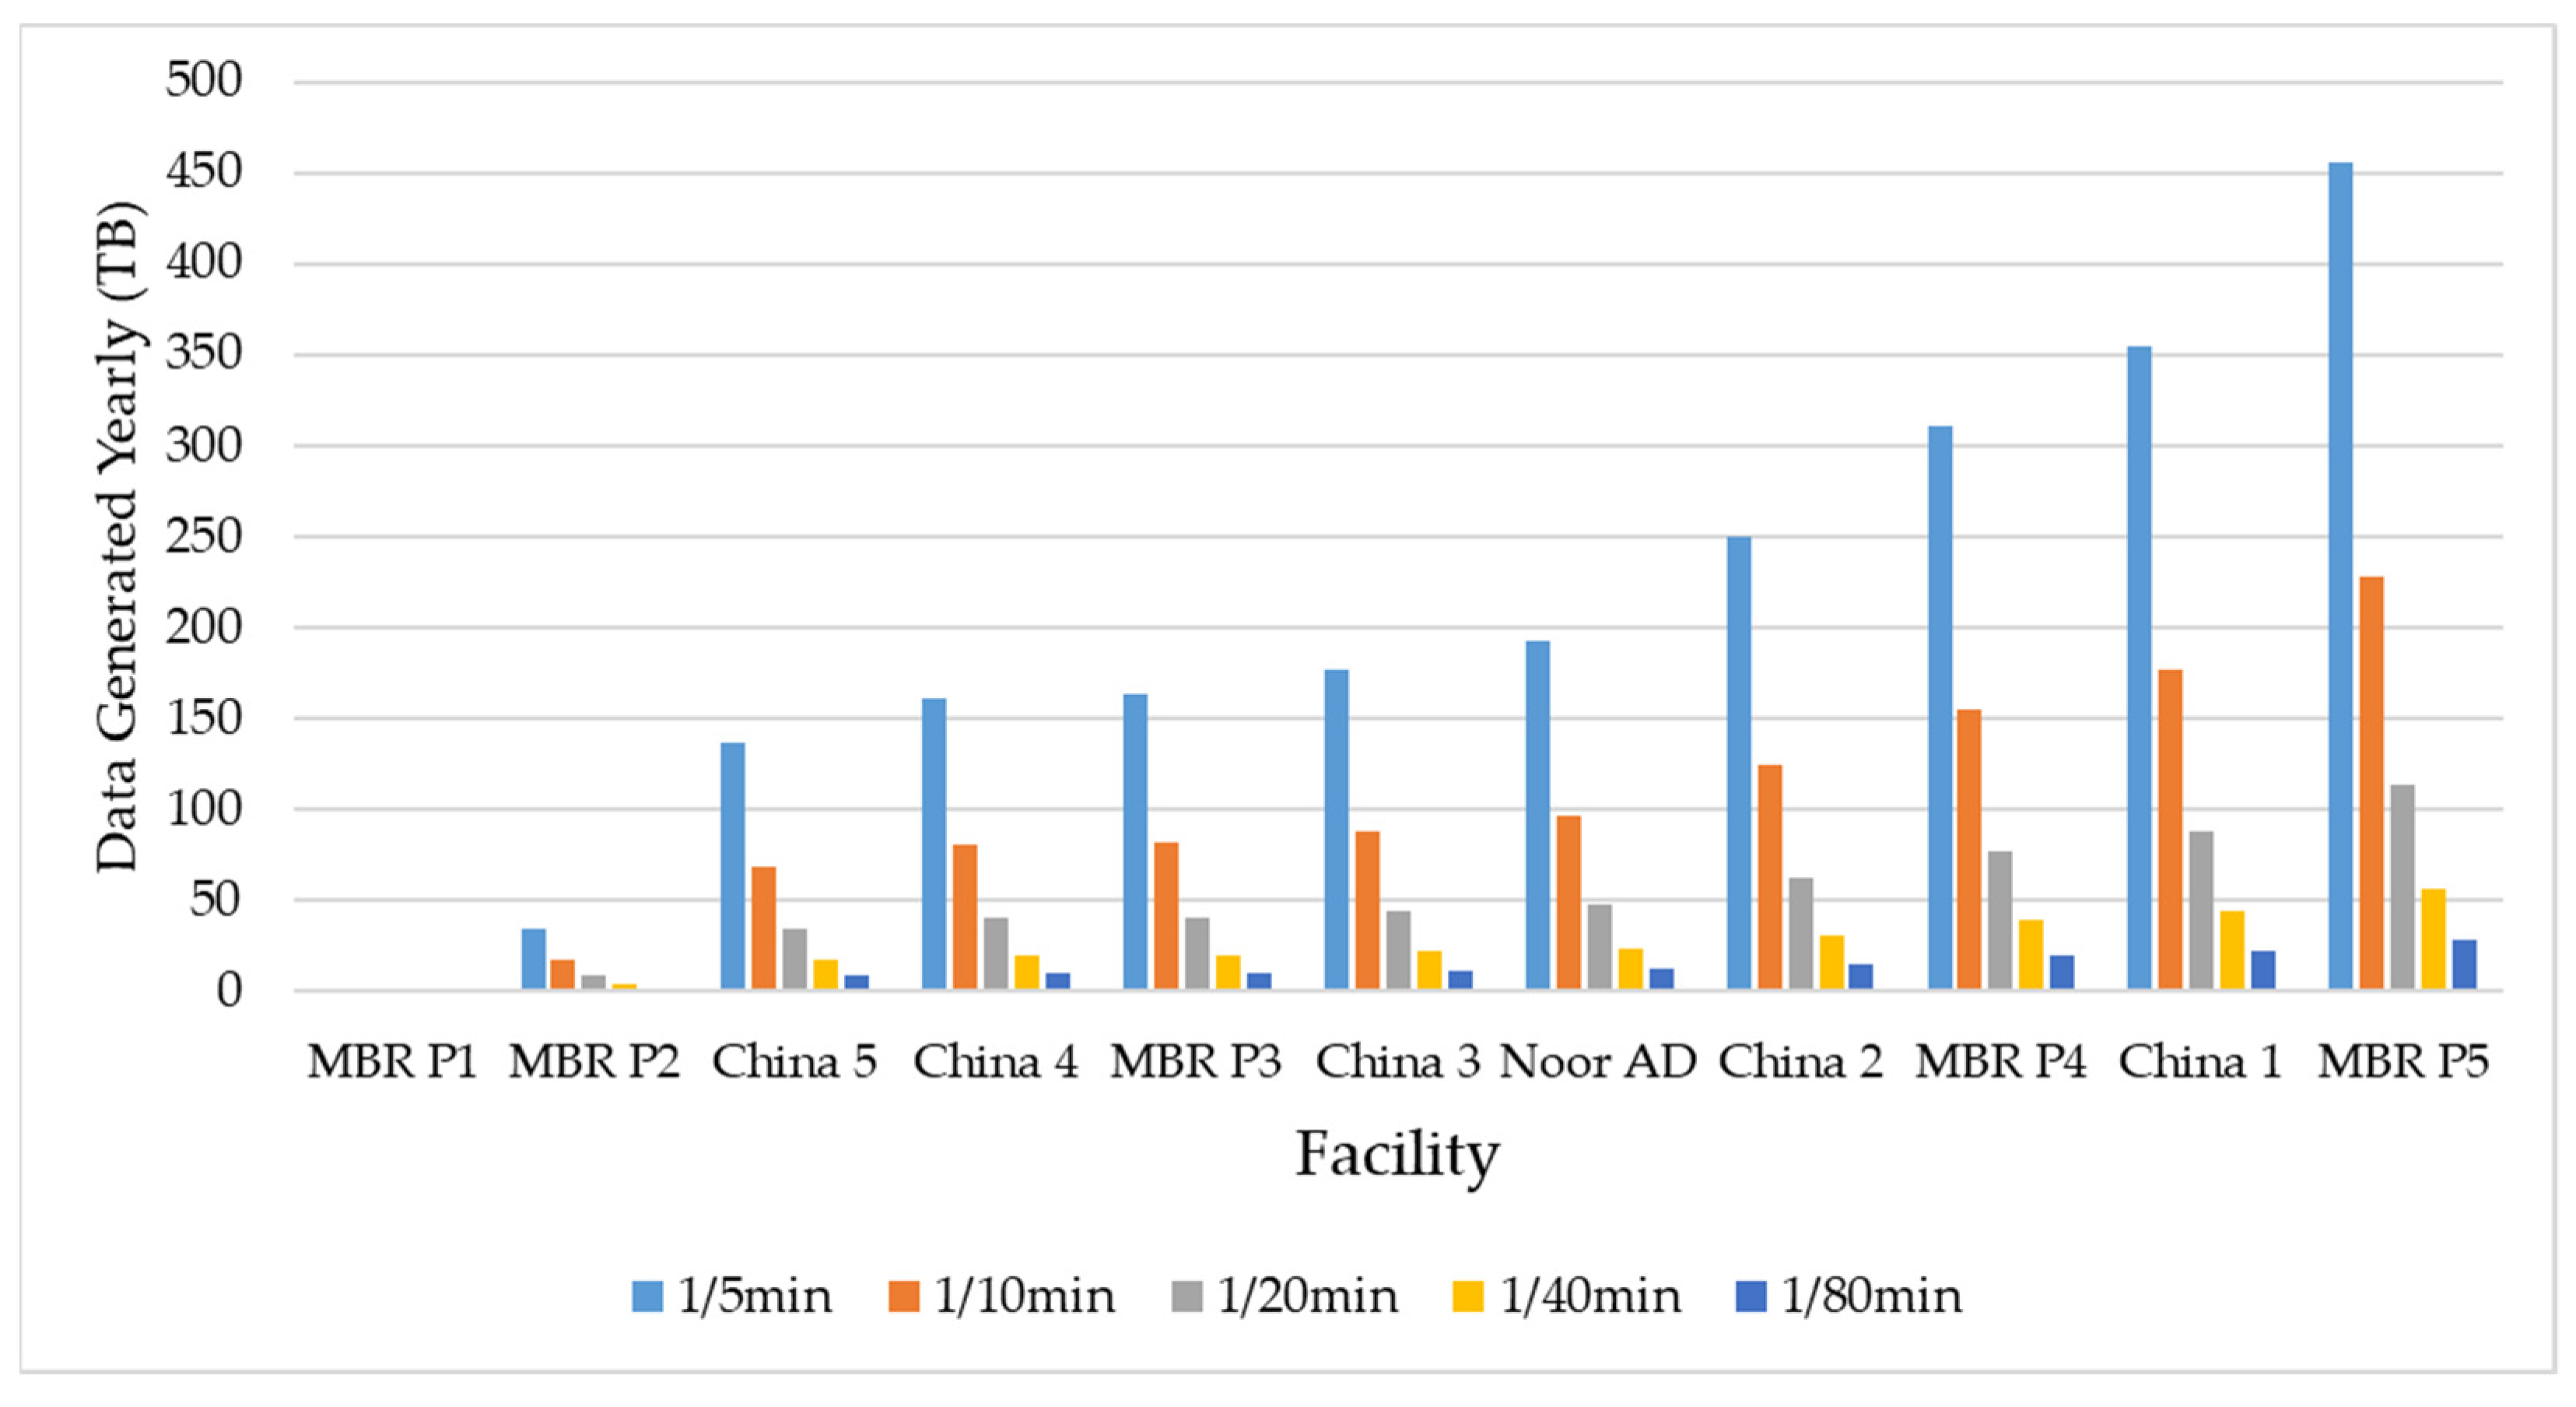
Using the previous numbers, it is possible to estimate the amount of data generated yearly based on the frequency of reporting.
Figure 16 shows the estimated data generated yearly per facility for reporting frequencies that vary from once every 5 min to once every 80 min.
Using the same data sizes, it is possible to estimate the bandwidth required by each facility in order to reliably transmit information back to the core. The bandwidth requirement per facility is shown in
Figure 17. As the figure shows, a facility of the size of MBR P1 where observations are sent every 5 min would require a bandwidth of 0.53 Mbps. A facility of the size of MBR P5, however, would require a bandwidth of 115.7 Mbps. The maximum uplink data rate that can be handled by a LoRaWAN gateway is 50 kbps [
55]. This means that even at highest publishing frequency, MBR P1 would require 11 gateways, while MBR P5 requires 2320 gateway devices. Publishing at lower frequencies would significantly reduce the number of gateways required.
At the core, scalability is less concerned with physical resources and more with the core’s ability to handle the large amounts of data being streamed and processed. Most existing solutions for solar energy monitoring focus instrumentation at the edge and the usage of microcontrollers and sensors to generate data at a lower cost [
56,
57], with some of the more recent works extending the study to consider LPWAN protocols such as LoRaWAN for data transmission [
58]. However, research into core infrastructure that can handle mass amounts of real-time data in the context of solar monitoring remains severely lacking. While MQTT is ideal for real-time data communicate near the edge, it is not the most ideal choice for data streaming at the core where data from all distributed segments of the facility sinks. Data moves from MQTT to Kafka which is designed to handle high-velocity, high-volume real-time data [
59,
60], and is commonly used in real-time event detection systems [
61]. Once data is available, the microservices-based design plays a large role in ensuring timely execution of various tasks [
62,
63]. By implementing processes as individual tasks run by workers, it is possible to not only run processes in parallel, but also distribute the load be deploying several workers that can perform the same tasks. This approach serves to avoid bottlenecks as well as single points of failure. Data such as device profiles and user profiles, which is considerably smaller in volume compared to real-time streams, is stored on MongoDB for ease of access. However, conventional databases such as MongoDB were not designed to handle large volumes of real-time data. High-volume, high-velocity data storage and management is best handled by Big Data platforms such as Hadoop [
41], which implement concepts such as parallel processing, data partitioning, and map-reduce in order to accelerate data storage and retrieval [
64].
6.2. Operational Cost
Since the system is built using open-sources software, the cost of operating the software is zero. The operating cost of LoRaWAN is also low since the protocol uses the free frequency spectrum. The only significant operational cost comes from the energy required to power the system and hardware maintenance. For the system operation to be cost-effective, the design should minimize the solar energy lost while operating the edge devices. This is done by carefully selecting the appropriate components and protocols which enable reliable operation at reduced power consumption. A study comparing LPWAN protocols for smart cities found that in outdoor conditions and depending on the size of the packet, an average LoRaWAN device consume between 132 mW and 475 mW [
65]. An ESP32 LoRaWAN module acting as an edge device draws around 70 mA at 5 V, which amounts to 350 mW [
31]. Each module node, weather node, and string node consists of an ESP32 equipped with few sensors. Assuming weather is relatively consistent across 4 strings,
Table 5 shows the estimated power consumption per device category as well as the overall facility power consumption percentage. As the table shows, operating the system consumes about 0.1% of the total output generated by the facility.
6.3. Security
Energy systems, mainly grids, are the target of 54% of cyber-attacks on critical infrastructure [
66]. As more data flows in the system, the risk of compromising the privacy and integrity of the data increases. Cyber-attacks on solar energy systems can lead to privacy breaches and data loss. More importantly, data injection attacks can be used to steal energy, redistribute load [
67], and, in severe cases, cause significant damage to the infrastructure [
68] resulting in power disruptions and financial losses [
69]. While device security is manageable through physical security, data is most vulnerable while being transmitted from the edge to the core. Data is transmitted across the facility over LoRaWAN, then across the internet over MQTT and then Kafka. Ensuring data security entails implementing security measures, mainly encryption, at each step. In terms of encryption, LoRaWAN uses 128-bit keys for node-server authentication as well as payload encryption [
55]. This not only ensures data is protected during transmission, but also prevents false data injection via malicious nodes. Once at the gateway, LoRa messages are forwarded as MQTT packets over the internet. The packets are encrypted used Transport Layer Security (TLS) and Secure Socket Layer (SSL). Brokers are authenticated using X509 certificates, while clints authenticate using username and password [
70]. Data transmitted from MQTT to Kafka is protected using Kafka encryption. While security measures are optional in Kafka, the protocol supports client authentication as well as authorization [
36]. The three protocols together offer end-to-end encryption and authentication which ensures data from the edge arrives to the core untouched.
7. Conclusions
Solar energy has been widely adopted as one of the key sources of renewable energy sources to power future smart cities. The past decade has witnessed a boom in the global deployment of massive solar installations that can provide enough electrical capacities to power major countries; power by developments in solar technologies as well as recent global efforts to reduce dependance on fossil fuels as means to conserve natural resources and minimize damage to the environment. Nonetheless, renewable energy penetration into main grids remains low. One of the key issues that stand in the way of higher renewable integration is the intermittency of the source. As an energy source that is a product of its environment, fluctuations in temperature and solar irradiance, as well as contextual factors such as shading, soiling, module degradation, and other electrical issues. Internet of Things and big data analytics technologies can significantly contribute to reliable renewable generation by providing tools and products to model solar installations, predict power output, detect anomalies, and enable preventative maintenance and energy planning. The success of systems that make use of such technologies, however, depends on the intelligent selection and integration of tools and elements in order to provide a scalable, secure, and reliable data transports and analytics infrastructure. While there have been several works recommending the use of new technologies at the edge, few have considered employing big data and analytics technologies at the core to enhance the scalability and operation of such systems. This paper proposed a microservices-based architecture that makes use of low-cost data streaming and transport technologies such as ESP32, LoRaWAN, and MQTT at the edge, combined with middleware data management technologies including Kafka, Spark, Hadoop, and Celery. The overall design ensures appropriate management of devices, resources, and data based on requirements derived from smart energy systems, IoT platforms, and smart grid. The choice of technologies aims to provide scalability, reliability, security, and cost-effectiveness for large-scale solar monitoring system implementations. While the system has not yet been evaluated, similar solutions which have been proposed and evaluated in other domains including smart medical applications and smart cities suggest the design would significantly enhance the performance of energy monitoring and analysis systems while reducing the cost of deployment, operation, and maintenance. Future work will focus on technical evaluation of the system and how it adheres to functional and non-functional requirements in the domain.
Author Contributions
Conceptualization, S.S. and I.Z.; Methodology, I.Z.; Writing—original draft, S.S.; Writing—review and editing, S.S. and I.Z. All authors have read and agreed to the published version of the manuscript.
Funding
This research was funded in part by the Open Access Program from the American University of Sharjah.
Institutional Review Board Statement
Not applicable.
Informed Consent Statement
Not applicable.
Acknowledgments
The research reported here was supported in part by grant #SCRI-18-02 and the Open Access Program from the American University of Sharjah. This paper represents the opinions of the authors and does not mean to represent the position or opinions of the American University of Sharjah.
Conflicts of Interest
The authors declare no conflict of interest.
References
- Atzori, L.; Iera, A.; Morabito, G. The Internet of things: A survey. Comput. Netw. 2010, 54, 2787–2805. [Google Scholar] [CrossRef]
- Kim, H.; Choi, H.; Kang, H.; An, J.; Yeom, S.; Hong, T. A systematic review of the smart energy conservation system: From smart homes to sustainable smart cities. Renew. Sustain. Energy Rev. 2021, 140, 110755. [Google Scholar] [CrossRef]
- Basic Research Needs for Solar Energy Utulization. Available online: https://www.energy.gov/downloads/basic-research-needs-solar-energy-utulization (accessed on 19 June 2021).
- Renewable Capacity Statistics 2021. Available online: https://www.irena.org/publications/2021/March/Renewable-Capacity-Statistics-2021 (accessed on 20 June 2021).
- International Energy Agency. Renewables 2020; IEA: Paris, France, 2020.
- Fouad, M.M.; Shihata, L.A.; Morgan, E.I. An integrated review of factors influencing the perfomance of photovoltaic panels. Renew. Sustain. Energy Rev. 2017, 80, 1499–1511. [Google Scholar] [CrossRef]
- De Freitas Viscondi, G.; Alves-Souza, S.N. A systematic literature review on big data for solar photovoltaic electricity generation forecasting. Sustain. Energy Technol. Assess. 2019, 31, 54–63. [Google Scholar] [CrossRef]
- Smart Cities: A Survey on Data Management, Security, and Enabling Technologies. Available online: https://ieeexplore.ieee.org/document/8003273 (accessed on 19 June 2021).
- Mashal, I.; Alsaryrah, O.; Chung, T.-Y.; Yang, C.-Z.; Kuo, W.-H.; Agrawal, D.P. Choices for interaction with things on Internet and underlying issues. Ad Hoc Netw. 2015, 28, 68–90. [Google Scholar] [CrossRef]
- Das, S.K.; Verma, D.; Nema, S.; Nema, R.K. Shading mitigation techniques: State-of-the-art in photovoltaic applications. Renew. Sustain. Energy Rev. 2017, 78, 369–390. [Google Scholar] [CrossRef]
- Diagne, M.; David, M.; Lauret, P.; Boland, J.; Schmutz, N. Review of solar irradiance forecasting methods and a proposition for small-scale insular grids. Renew. Sustain. Energy Rev. 2013, 27, 65–76. [Google Scholar] [CrossRef] [Green Version]
- Abd-Elhady, M.S.; Serag, Z.; Kandil, H.A. An innovative solution to the overheating problem of PV panels. Energy Convers. Manag. 2018, 157, 452–459. [Google Scholar] [CrossRef]
- Magalhães, P.M.L.P.; Martins, J.F.A.; Joyce, A.L.M. Comparative analysis of overheating prevention and stagnation handling measures for photovoltaic-thermal (PV-T) systems. Energy Procedia 2016, 91, 346–355. [Google Scholar] [CrossRef] [Green Version]
- Figgis, B.; Ennaoui, A.; Ahzi, S.; Rémond, Y. Review of PV soiling particle mechanics in desert environments. Renew. Sustain. Energy Rev. 2017, 76, 872–881. [Google Scholar] [CrossRef]
- Pulipaka, S.; Kumar, R. Analysis of soil distortion factor for photovoltaic modules using particle size composition. Sol. Energy 2018, 161, 90–99. [Google Scholar] [CrossRef]
- Pillai, D.S.; Blaabjerg, F.; Rajasekar, N. A comparative evaluation of advanced fault detection approaches for PV systems. IEEE J. Photovolt. 2019, 9, 513–527. [Google Scholar] [CrossRef]
- Kurokawa, K. Numerical analysis of the performance of a photovoltaic array curve tracer by the capacitive load method. Sol. Cells 1991, 31, 151–158. [Google Scholar] [CrossRef]
- Fraga, M.M.; de Campos, B.L.O.; de Almeida, T.B.; da Fonseca, J.M.F.; de Lins, V.F.C. Analysis of the soiling effect on the performance of photovoltaic modules on a soccer stadium in Minas Gerais, Brazil. Sol. Energy 2018, 163, 387–397. [Google Scholar] [CrossRef]
- Schill, C.; Brachmann, S.; Koehl, M. Impact of soiling on IV-curves and efficiency of PV-modules. Sol. Energy 2015, 112, 259–262. [Google Scholar] [CrossRef]
- Guerriero, P.; Daliento, S. Toward a hot spot free PV module. IEEE J. Photovolt. 2019, 9, 796–802. [Google Scholar] [CrossRef]
- Balarabe, M.A.; Tan, F.; Abdullah, K.; Nawawi, M.N.M. Temporal-spatial variability of seasonal aerosol index and visibility—A case study of Nigeria. In Proceedings of the 2015 International Conference on Space Science and Communication (IconSpace), Langkawi, Malaysia, 10–12 August 2015; pp. 459–464. [Google Scholar]
- Brown, P.R.; O’Sullivan, F.M. Spatial and temporal variation in the value of solar power across United States electricity markets. Renew. Sustain. Energy Rev. 2020, 121, 109594. [Google Scholar] [CrossRef]
- Shapsough, S.; Zualkernan, I.; Dhaouadi, R.; Sajun, A.R. Deep learning at the edge for operation and maintenance of large-Scale solar farms. In Proceedings of the 5th EAI International Conference on Smart Grid and Internet of Things, Taichung, Taiwan and Cyberspace, 5–6 December 2020. [Google Scholar]
- Shapsough, S.; Zualkernan, I. Requirements for an IoT middleware for utility-scale distributed solar farms. In Proceedings of the 6th International Conference on Internet of Things: Systems, Management and Security (IOTSMS 2019), Granada, Spain, 22–25 October 2019; pp. 51–57. [Google Scholar]
- Hajjaji, Y.; Boulila, W.; Farah, I.R.; Romdhani, I.; Hussain, A. Big data and IoT-based applications in smart environments: A systematic review. Comput. Sci. Rev. 2021, 39, 100318. [Google Scholar] [CrossRef]
- Tabanjat, A.; Becherif, M.; Hissel, D. Reconfiguration solution for shaded PV panels using switching control. Renew. Energy 2015, 82, 4–13. [Google Scholar] [CrossRef]
- Mahmoud, Y.; El-Saadany, E.F. Enhanced reconfiguration method for reducing mismatch losses in PV systems. IEEE J. Photovolt. 2017, 7, 1746–1754. [Google Scholar] [CrossRef]
- Ikpehai, A.; Adebisi, B.; Rabie, K.M.; Anoh, K.; Ande, R.E.; Hammoudeh, M.; Gacanin, H.; Mbanaso, U.M. Low-power wide area network technologies for Internet-of-things: A comparative review. IEEE Internet Things J. 2019, 6, 2225–2240. [Google Scholar] [CrossRef] [Green Version]
- Stusek, M.; Moltchanov, D.; Masek, P.; Mikhaylov, K.; Zeman, O.; Roubicek, M.; Koucheryavy, Y.; Hosek, J. Accuracy assessment and cross-validation of LPWAN propagation models in urban scenarios. IEEE Access 2020, 8, 154625–154636. [Google Scholar] [CrossRef]
- El Chall, R.; Lahoud, S.; El Helou, M. LoRaWAN network: Radio propagation models and performance evaluation in various environments in Lebanon. IEEE Internet Things J. 2019, 6, 2366–2378. [Google Scholar] [CrossRef]
- SparkFun LoRa Gateway. 1-Channel (ESP32). WRL-18074. SparkFun Electronics. Available online: https://www.sparkfun.com/products/18074 (accessed on 19 December 2021).
- LoRa Raspberry Pi 4 Gateway with Enclosure. WRL-16447. SparkFun Electronics. Available online: https://www.sparkfun.com/products/16447 (accessed on 19 December 2021).
- Banks, A.; Gupta, R. OASIS Standard; MQTT Version 3.1.1.; OASIS Open: Woburn, MA, USA, 2014. [Google Scholar]
- Modbus Messaging on TCP/IP Implementation Guide V1.0b; Modbus Organization: Hopkinton, MA, USA, 2008.
- Shapsough, S.; Zualkernan, I. Designing an edge layer for smart management of large-scale and distributed solar farms. In Information Science and Applications; Kim, K.J., Kim, H.-Y., Eds.; Springer: Singapore, 2020; pp. 651–661. [Google Scholar]
- Apache Kafka. Available online: https://kafka.apache.org/intro (accessed on 26 May 2018).
- Díaz, M.; Martín, C.; Rubio, B. State-of-the-art, challenges, and open issues in the integration of Internet of things and Cloud computing. J. Netw. Comput. Appl. 2016, 67, 99–117. [Google Scholar] [CrossRef]
- Greco, L.; Ritrovato, P.; Xhafa, F. An edge-stream computing infrastructure for real-time analysis of wearable sensors data. Future Gener. Comput. Syst. 2019, 93, 515–528. [Google Scholar] [CrossRef]
- Hugo, Å.; Morin, B.; Svantorp, K. Bridging MQTT and Kafka to support C-ITS: A feasibility study. In Proceedings of the 21st IEEE International Conference on Mobile Data Management (MDM), Versailles, France, 30 June–3 July 2020; pp. 371–376. [Google Scholar]
- Alencar, B.M.; Rios, R.A.; Santana, C.; Prazeres, C. FoT-stream: A fog platform for data stream analytics in IoT. Comput. Commun. 2020, 164, 77–87. [Google Scholar] [CrossRef]
- Welcome to ApacheTM Hadoop®! Available online: http://hadoop.apache.org/ (accessed on 3 December 2021).
- Workers Guide. Celery 5.2.1 Documentation. Available online: https://docs.celeryproject.org/en/stable/userguide/workers.html (accessed on 25 November 2021).
- Apache SparkTM—Lightning-Fast Cluster Computing. Available online: http://spark.apache.org/ (accessed on 3 December 2021).
- Karabey Aksakalli, I.; Çelik, T.; Can, A.B.; Tekinerdoğan, B. Deployment and communication patterns in microservice architectures: A systematic literature review. J. Syst. Softw. 2021, 180, 111014. [Google Scholar] [CrossRef]
- MongoDB for GIANT Ideas. Available online: https://www.mongodb.org/ (accessed on 1 December 2021).
- Calvillo, C.F.; Sánchez-Miralles, A.; Villar, J. Energy management and planning in smart cities. Renew. Sustain. Energy Rev. 2016, 55, 273–287. [Google Scholar] [CrossRef] [Green Version]
- Biesinger, F.; Meike, D.; Kraß, B.; Weyrich, M. A digital twin for production planning based on cyber-physical systems: A case study for a cyber-physical system-based creation of a digital twin. Procedia CIRP 2019, 79, 355–360. [Google Scholar] [CrossRef]
- Almadhor, A. Proactive Monitoring, Anomaly Detection, and Forecasting of Solar Photovoltaic Systems Using Artificial Neural Networks. Ph.D. Thesis, University of Denver, Denver, CO, USA, 2019. [Google Scholar]
- De Benedetti, M.; Leonardi, F.; Messina, F.; Santoro, C.; Vasilakos, A. Anomaly detection and predictive maintenance for photovoltaic systems. Neurocomputing 2018, 310, 59–68. [Google Scholar] [CrossRef]
- Baklouti, A.; Mifdal, L.; Dellagi, S.; Chelbi, A. An optimal preventive maintenance policy for a solar photovoltaic system. Sustainability 2020, 12, 4266. [Google Scholar] [CrossRef]
- Murray, J. Profiling the Five Largest Solar Power Plants in China. NS Energy. 2021. Available online: https://www.nsenergybusiness.com/features/largest-solar-plants-china/ (accessed on 16 November 2021).
- UAE Powers on Noor Abu Dhabi, the World’s Largest Solar Project. Available online: https://www.techspot.com/news/80740-uae-powers-noor-abu-dhabi-world-largest-solar.html (accessed on 25 September 2021).
- Mohammed Bin Rashid Al Maktoum Solar Park—A Leading Project That Promotes Sustainability in the UAE. Available online: https://www.dewa.gov.ae/en/about-dewa/news-and-media/press-and-news/latest-news/2019/03/mohammed-bin-rashid-al-maktoum-solar-park (accessed on 25 May 2019).
- Shapsough, S.; Takrouri, M.; Dhaouadi, R.; Zualkernan, I.A. Using IoT and smart monitoring devices to optimize the efficiency of large-scale distributed solar farms. Wirel. Netw. 2018, 27, 4313–4329. [Google Scholar] [CrossRef]
- What Is the LoRaWAN® Specification? Available online: https://lora-alliance.org/about-lorawan/ (accessed on 1 December 2021).
- Ansari, S.; Ayob, A.; Lipu, M.S.H.; Saad, M.H.M.; Hussain, A. A review of monitoring technologies for solar PV systems using data processing modules and transmission protocols: Progress, challenges and prospects. Sustainability 2021, 13, 8120. [Google Scholar] [CrossRef]
- Portalo, J.M.; González, I.; Calderón, A.J. Monitoring system for tracking a PV generator in an experimental smart microgrid: An open-source solution. Sustainability 2021, 13, 8182. [Google Scholar] [CrossRef]
- De Melo, G.C.G.; Torres, I.C.; de Araújo, Í.B.Q.; Brito, D.B.; de Barboza, E.A. A low-cost IoT system for real-time monitoring of climatic variables and photovoltaic generation for smart grid application. Sensors 2021, 21, 3293. [Google Scholar] [CrossRef] [PubMed]
- Van Dongen, G.; Van den Poel, D. Evaluation of stream processing frameworks. IEEE Trans. Parallel Distrib. Syst. 2020, 31, 1845–1858. [Google Scholar] [CrossRef]
- Van Dongen, G.; Van Den Poel, D. Influencing factors in the scalability of distributed stream processing jobs. IEEE Access 2021, 9, 109413–109431. [Google Scholar] [CrossRef]
- Kul, S.; Tashiev, I.; Şentaş, A.; Sayar, A. Event-based microservices with Apache Kafka streams: A real-time vehicle detection system based on type, color, and speed attributes. IEEE Access 2021, 9, 83137–83148. [Google Scholar] [CrossRef]
- Baboi, M.; Iftene, A.; Gîfu, D. Dynamic microservices to create scalable and fault tolerance architecture. Procedia Comput. Sci. 2019, 159, 1035–1044. [Google Scholar] [CrossRef]
- Waseem, M.; Liang, P.; Shahin, M.; Di Salle, A.; Márquez, G. Design, monitoring, and testing of microservices systems: The practitioners’ perspective. J. Syst. Softw. 2021, 182, 111061. [Google Scholar] [CrossRef]
- Zainab, A.; Ghrayeb, A.; Syed, D.; Abu-Rub, H.; Refaat, S.S.; Bouhali, O. Big data management in smart grids: Technologies and challenges. IEEE Access 2021, 9, 73046–73059. [Google Scholar] [CrossRef]
- Deutsche Telekom IoT. NB-IoT, LoRaWAN, Sigfox: An Up-To-Date Comparison; Deutsche Telekom AG: Bonn, Germany, 2021. [Google Scholar]
- Kimani, K.; Oduol, V.; Langat, K. Cyber security challenges for IoT-based smart grid networks. Int. J. Crit. Infrastruct. Prot. 2019, 25, 36–49. [Google Scholar] [CrossRef]
- Lee, L.; Hu, P. Vulnerability analysis of cascading dynamics in smart grids under load redistribution attacks. Int. J. Electr. Power Energy Syst. 2019, 111, 182–190. [Google Scholar] [CrossRef]
- Zografopoulos, I.; Ospina, J.; Liu, X.; Konstantinou, C. Cyber-physical energy systems security: Threat modeling, risk assessment, resources, metrics, and case studies. IEEE Access 2021, 9, 29775–29818. [Google Scholar] [CrossRef]
- Zhao, L.; Li, J.; Li, Q.; Li, F. A federated learning framework for detecting false data injection attacks in solar farms. IEEE Trans. Power Electron. 2022, 37, 2496–2501. [Google Scholar] [CrossRef]
- Singh, M.; Rajan, M.A.; Shivraj, V.L.; Balamuralidhar, P. Secure MQTT for Internet of things (IoT). In Proceedings of the 2015 Fifth International Conference on Communication Systems and Network Technologies, Gwalior, India, 4–6 April 2015; pp. 746–751. [Google Scholar]
Figure 1.
System Architecture.
Figure 1.
System Architecture.
Figure 2.
(a) ESP+ LoRaWAN edge device (b) Raspberry Pi + LoRaWAN Gateway.
Figure 2.
(a) ESP+ LoRaWAN edge device (b) Raspberry Pi + LoRaWAN Gateway.
Figure 3.
Chirpstack web interface.
Figure 3.
Chirpstack web interface.
Figure 4.
Software Architecture.
Figure 4.
Software Architecture.
Figure 5.
Panel monitoring edge device profile.
Figure 5.
Panel monitoring edge device profile.
Figure 6.
Panel monitoring edge device packet.
Figure 6.
Panel monitoring edge device packet.
Figure 7.
Admin dashboard overview—output and earnings.
Figure 7.
Admin dashboard overview—output and earnings.
Figure 8.
Admin dashboard overview—facility information.
Figure 8.
Admin dashboard overview—facility information.
Figure 9.
Admin dashboard—device frequency update.
Figure 9.
Admin dashboard—device frequency update.
Figure 10.
Microservices architecture.
Figure 10.
Microservices architecture.
Figure 11.
Sequence diagram for the first step of adding a new device.
Figure 11.
Sequence diagram for the first step of adding a new device.
Figure 12.
Sequence diagram for the third step of adding a new device.
Figure 12.
Sequence diagram for the third step of adding a new device.
Figure 13.
Sequence diagram for the fourth step of adding a new device.
Figure 13.
Sequence diagram for the fourth step of adding a new device.
Figure 14.
Celery workers updating the string frequency in the database and the physical devices.
Figure 14.
Celery workers updating the string frequency in the database and the physical devices.
Figure 15.
Error packet sample.
Figure 15.
Error packet sample.
Figure 16.
Estimated data generated by each facility per year for different reporting frequencies.
Figure 16.
Estimated data generated by each facility per year for different reporting frequencies.
Figure 17.
Bandwidth requirement by each facility for different reporting frequencies.
Figure 17.
Bandwidth requirement by each facility for different reporting frequencies.
Table 1.
System functional and non-functional requirements.
Table 1.
System functional and non-functional requirements.
| Requirement | Definition |
|---|
| Functional Requirements |
| Resource discovery | The process used by a device to locate and access a resource within the network |
| Resource management | Delegation of tasks between similar resources to ensure no single resource is overwhelmed |
| Data management | Appropriate handling of data regardless of its volume, frequency, variety, or errors |
| Event management | Appropriate, timely reaction to events or new information |
| Software management | Appropriate planning of software maintenance and updates |
| Context awareness | The system’s ability to provide information relevant to the device’s self or context in order to enhance decision making |
| Autonomy | The ability to seamlessly deploy new actors, services, or users in the system without human interference |
| Interoperability | Seamless flow of data and services across heterogeneous regions in the system |
| Non-Functional Requirements |
| Scalability | The ability to meet the same quality of services levels as the system increases in scale |
| Timeliness | Ensuring time delays based on the criticality of information and requirements of the domain |
| Security | Protection of information and infrastructure and mitigation of security attacks |
| Ease of deployment | The ability to replicate and deploy segments of the system by persons with minimum technical knowledge |
| Multiplicity | Decentralization and redundancy of critical resources to maintain continuous operation and quality of service against system faults |
| Adaptability | The system’s ability to seamlessly evolve with minimal disruptions to operation |
| Resource conservation | Optimizing operation and maintenance in order to reduce resource consumption and maximize net profit |
Table 2.
Examples of data captured at module, string, and region level.
Table 2.
Examples of data captured at module, string, and region level.
| Level | Data Captured |
|---|
| Module | Module surface temperature, dust level, module current and voltage |
| String | String current and voltage, battery current and voltage, battery temperature |
| Region/facility | Solar irradiance, wind speed, ambient temperature, humidity, air pressure, aerosol particle concentration |
Table 3.
Solar capacity of the eleven solar installations considered.
Table 3.
Solar capacity of the eleven solar installations considered.
| Facility | Solar Capacity (Giga Watt) |
|---|
| MBR P1 | 0.013 |
| MBR P2 | 0.213 |
| China 5 | 0.850 |
| China 4 | 1.000 |
| MBR P3 | 1.013 |
| China 3 | 1.100 |
| Noor Abu Dhabi | 1.200 |
| China 2 | 1.550 |
| MBR P4 | 1.930 |
| China 1 | 2.200 |
| MBR P5 | 2.830 |
Table 4.
Breakdown of amount of estimated data per reporting period transmitted per category for each facility.
Table 4.
Breakdown of amount of estimated data per reporting period transmitted per category for each facility.
| Facility | Strings | Panels | String (MB) | Module (MB) | Environmental Conditions (MB) | Total (MB) |
|---|
| MBR P1 | 2167 | 34,667 | 2.17 | 17.33 | 0.43 | 19.93 |
| MBR P2 | 35,500 | 568,000 | 35.50 | 284.00 | 7.10 | 326.60 |
| China 5 | 141,667 | 2,266,667 | 141.67 | 1133.33 | 28.33 | 1303.33 |
| China 4 | 166,667 | 2,666,667 | 166.67 | 1333.33 | 33.33 | 1533.33 |
| MBR P3 | 168,833 | 2,701,334 | 168.83 | 1350.67 | 33.77 | 1553.27 |
| China 3 | 183,333 | 2,933,334 | 183.33 | 1466.67 | 36.67 | 1686.67 |
| Noor AD | 200,000 | 3,200,000 | 200.00 | 1600.00 | 40.00 | 1840.00 |
| China 2 | 258,333 | 4,133,334 | 258.33 | 2066.67 | 51.67 | 2376.67 |
| MBR P4 | 321,667 | 5,146,667 | 321.67 | 2573.33 | 64.33 | 2959.33 |
| China 1 | 366,667 | 5,866,667 | 366.67 | 2933.33 | 73.33 | 3373.33 |
| MBR P5 | 471,667 | 7,546,667 | 471.67 | 3773.33 | 94.33 | 4339.33 |
Table 5.
Estimated power consumption.
Table 5.
Estimated power consumption.
| Facility | Capacity (MW) | Strings | Panels | Module Nodes (MW) | Weather Nodes (MW) | String Nodes (MW) | Total percentage |
|---|
| MBR P1 | 13 | 2167 | 34,667 | 0.012 | 0.000 | 0.001 | 0.10% |
| MBR P2 | 213 | 35,500 | 568,000 | 0.199 | 0.004 | 0.018 | 0.10% |
| China 5 | 850 | 141,667 | 2,266,667 | 0.793 | 0.018 | 0.071 | 0.10% |
| China 4 | 1000 | 166,667 | 2,666,667 | 0.933 | 0.021 | 0.083 | 0.10% |
| MBR P3 | 1013 | 168,833 | 2,701,334 | 0.945 | 0.021 | 0.084 | 0.10% |
| China 3 | 1100 | 183,333 | 2,933,334 | 1.027 | 0.023 | 0.092 | 0.10% |
| Noor AD | 1200 | 200,000 | 3,200,000 | 1.120 | 0.025 | 0.100 | 0.10% |
| China 2 | 1550 | 258,333 | 4,133,334 | 1.447 | 0.032 | 0.129 | 0.10% |
| MBR P4 | 1930 | 321667 | 5,146,667 | 1.801 | 0.040 | 0.161 | 0.10% |
| China 1 | 2200 | 366,667 | 5,866,667 | 2.053 | 0.046 | 0.183 | 0.10% |
| MBR P5 | 2830 | 471,667 | 7,546,667 | 2.641 | 0.059 | 0.236 | 0.10% |
| Publisher’s Note: MDPI stays neutral with regard to jurisdictional claims in published maps and institutional affiliations. |
© 2022 by the authors. Licensee MDPI, Basel, Switzerland. This article is an open access article distributed under the terms and conditions of the Creative Commons Attribution (CC BY) license (https://creativecommons.org/licenses/by/4.0/).


