Article

Experimental and Numerical Analysis of the Impeller Backside Cavity in a Centrifugal Compressor for CAES

1
Institute of Engineering Thermophysics, Chinese Academy of Sciences, Beijing 100190, China
2
University of Chinese Academy of Sciences, Beijing 100049, China
3
National Energy Large Scale Physical Energy Storage Technologies R&D Center of Bijie High-Tech Industrial Development Zone, Bijie 551712, China
4
Nanjing Institute of Future Energy System, Institute of Engineering Thermophysics, Chinese Academy of Sciences, Nanjing 211135, China
*
Authors to whom correspondence should be addressed.
Energies 2022, 15(2), 420; https://doi.org/10.3390/en15020420
Submission received: 7 December 2021 / Revised: 29 December 2021 / Accepted: 1 January 2022 / Published: 6 January 2022

Abstract

:
Relying on a closed test rig of a high-power intercooling centrifugal compressor for compressed air energy storage (CAES), this study measured the static pressure and static temperature at different radii on the static wall of the impeller backside cavity (IBC) under variable rotating speeds. Simultaneously, the coupled computations of all mainstream domains with IBC or not were used for comparative analysis of the aerodynamic performances of the compressor and the internal flow field in IBC. The results show that IBC has a significant impact on coupling characteristics including pressure ratio, efficiency, torque, shaft power, and axial thrust of the centrifugal compressor. The gradients of radial static pressure and static temperature in IBC both increase with the decrease of mainstream flow or the increase of rotating speed, whose distributions are different under variable rotating speeds due to the change of the aerodynamic parameters of mainstream.

1. Introduction

Compressed air energy storage (CAES) is a significant technology for power grid peak shaving, load valley filling and instability elimination of wind and solar power generation [1]. The multistage geared centrifugal compressor becomes the core component of CAES system by virtue of low exergy loss, small footprint, and efficient inter-stage heat utilization. Impeller backside cavity (IBC) is an easily overlooked or simplified cavity in the centrifugal compressor, which actually has a significant influence on the flow field details, pressure ratio, efficiency, torque, shaft power, and axial thrust (AT) of the centrifugal compressor [2,3]. The complete geometry (360°) with the volute and the exit pipe of a compressor was calculated using the Large Eddy Simulation (LES), which showed that ignoring the cavity will bring errors to the performance prediction [4]. From the perspective of geometric structure, IBC is the limited annular gap between the impeller wheel disk and the casing wall, whose large radius position is connected to the static and dynamic gap, and the small radius position is attached with the sealing structure. Seen from the flow characteristics, the airflow entering the cavity from the rim of the impeller outlet has a unique flow mechanism different from that of the mainstream. There is a temperature rise and pressure drop inside it, which causes friction loss and leakage loss to reduce the efficiency of the compressor. It’s significant to investigate the aerodynamic parameter distribution in IBC and the coupled interaction between mainstream and IBC, which contributes to analyzing the internal flow field structure and loss distribution of the centrifugal compressor for CAES.
The published researches on rotating-cavity are mainly aimed at internal flow structure and heat transfer characteristics. In terms of flow structure, the influences of Ro and G on the flow structure in the cavity were studied using the flow field display technology by Owen [5]. Laser Doppler Anemometry (LDA) technology was utilized by Farthing [6] to reveal many flow phenomena inside the backside cavity with axial throughflow of cooling air. Gantar [7] determined the phenomenon of fluid rotation in side chambers and its effect on the impeller hydraulic axial thrust under different leakage flow regimes, as well as the influence of increased wear ring radial clearance on axial thrust. Zeng [8] evaluated the leakage flow rates at different positions and the axial forces of a micro gas turbine. Dong [9] investigated the correlation between the magnitude of the leakage, fluid pressure and velocity distribution at the crown of the centrifugal pump hub. Qin [10] found the cavity flow has little impact on the flow field in the upstream impeller, but it significantly increases the flow loss in the downstream diffuser. Li [11] calculated and analyzed the internal flow field characteristics of the IBC and its influence on the performance of the whole machine. Liu [12] summarized the influence of the change in radial position of the swirl-controlled orifice on the pressure distribution, and the effect of the axial load on the rotating disk under various radial inflow (including Reω, Cw, G, β0, λT, etc.). Qiao [13] and Hazby [14] numerically studied the leakage flow in shroud and hub cavities of a multistage centrifugal compressor. Pitz [15] analyzed the effect of an axial throughflow on buoyancy-induced flow in the cavity through large-eddy simulation.
In the aspect of heat transfer characteristics, an overview of a method used for simulating windage rise and ingestion on a macroscopic scale was proposed by Haaser [16]. Farthing [17] revealed the heat transfer characteristics of the rotating disk surface under different heating conditions. Alexiou [18] experimentally studied the influences of the buoyancy force on the heat transfer characteristics in the cavity with axial throughflow. Young [19] assessed a series of noncircular offtake passages to suppress the creation of vortices for cooling optimization in rotor cavities. Owen [20] found the heat transfer characteristics of the rotating disk surface are jointly affected by factors such as Rez, Reω, Gr. Coren [21] established the correlation of the torque coefficient as a function of the throughflow and the rotating Reynolds number. Luo [22] and Tao [23] experimentally summarized the empirical relationships of the dimensionless wind resistance torque coefficient and the temperature rise parameter in the cavity. An application of robust optimization methods in the design of a low-pressure turbine secondary air system was proposed by Antinori [24].
Based on the combing and summary of the previous typical studies, it can be found that the research hotspots for the disc cavity are concentrated on the study of flow phenomena and flow field structure, the control method of the internal complex flow status, the influences on the stage aerodynamic performance and the upper and lower flow fields, the advanced design methods for the cavity bleed secondary air system, and the multi-dimensional coupling simulation method coupling the cavity with impeller/diffuser/seal gear. In view of the fact that the existing research results are limited to simplified test experiments or numerical simulations that have not been actually verified, this paper has carried out in-depth numerical analysis and experimental verification on the cavity of the centrifugal compressor with large flow and high power. Static pressure (ps) and static temperature (Ts) at different radii on the static wall of the impeller backside cavity (IBC) under variable rotating speeds are measured. The coupled numerical simulations of all mainstream domains and IBC were used for comparative analysis of the aerodynamic performances of the centrifugal compressor and the internal flow field in IBC. The changes in the distributions of aerodynamic parameters (represented by ps and Ts) in the cavity under different mainstream flows and the influences of IBC on the centrifugal compressor performance are summarized. Considering the influences of Reω and β0, the coupling characteristics of the whole machine and the change law of the flow field in IBC under variable rotating speeds are also studied.

2. Research Object

The first stage large-size centrifugal compressor in the multi-stage intercooling closed test facility is selected as the research object in the present study. The schematic diagram of the geometric structure and the physical drawing of the corresponding castings on-site are shown in detail in Figure 1, whose main flow components consist of 12 adjustable inlet guide vanes (AIGVs), 13 unshroud impeller blades, 11 low-solidity adjustable vaned diffusers (AVDs) and a circular external volute with tangential inlet. IBC structure is a very irregular cavity surrounded by the impeller disk, the casing, the rotating shaft and the sealing structure (ignored in Figure 1), because such a weight reduction casting can save input power considering from the perspective of rotor dynamics. The upper and lower interfaces of IBC are respectively connected to the gap between impeller and AVDs, and the carbon ring seal and the oil seal (showed in Figure 3b). The sealing effect is so good that the leakage relative to the mainstream is negligible. The design parameters of the compressor are as follows: total inlet pressure 97,000 Pa, total inlet temperature 303.15 K, design mass flow (m) 34 kg/s, design rotating speed (n) 8658.7 r/min, total pressure ratio (PRt) 2.29 with consideration of volute. Main structural parameters of mainstream components such as impeller, AVDs, IGVs and volute are fully listed in Table 1.

3. Experimental and Numerical Methods

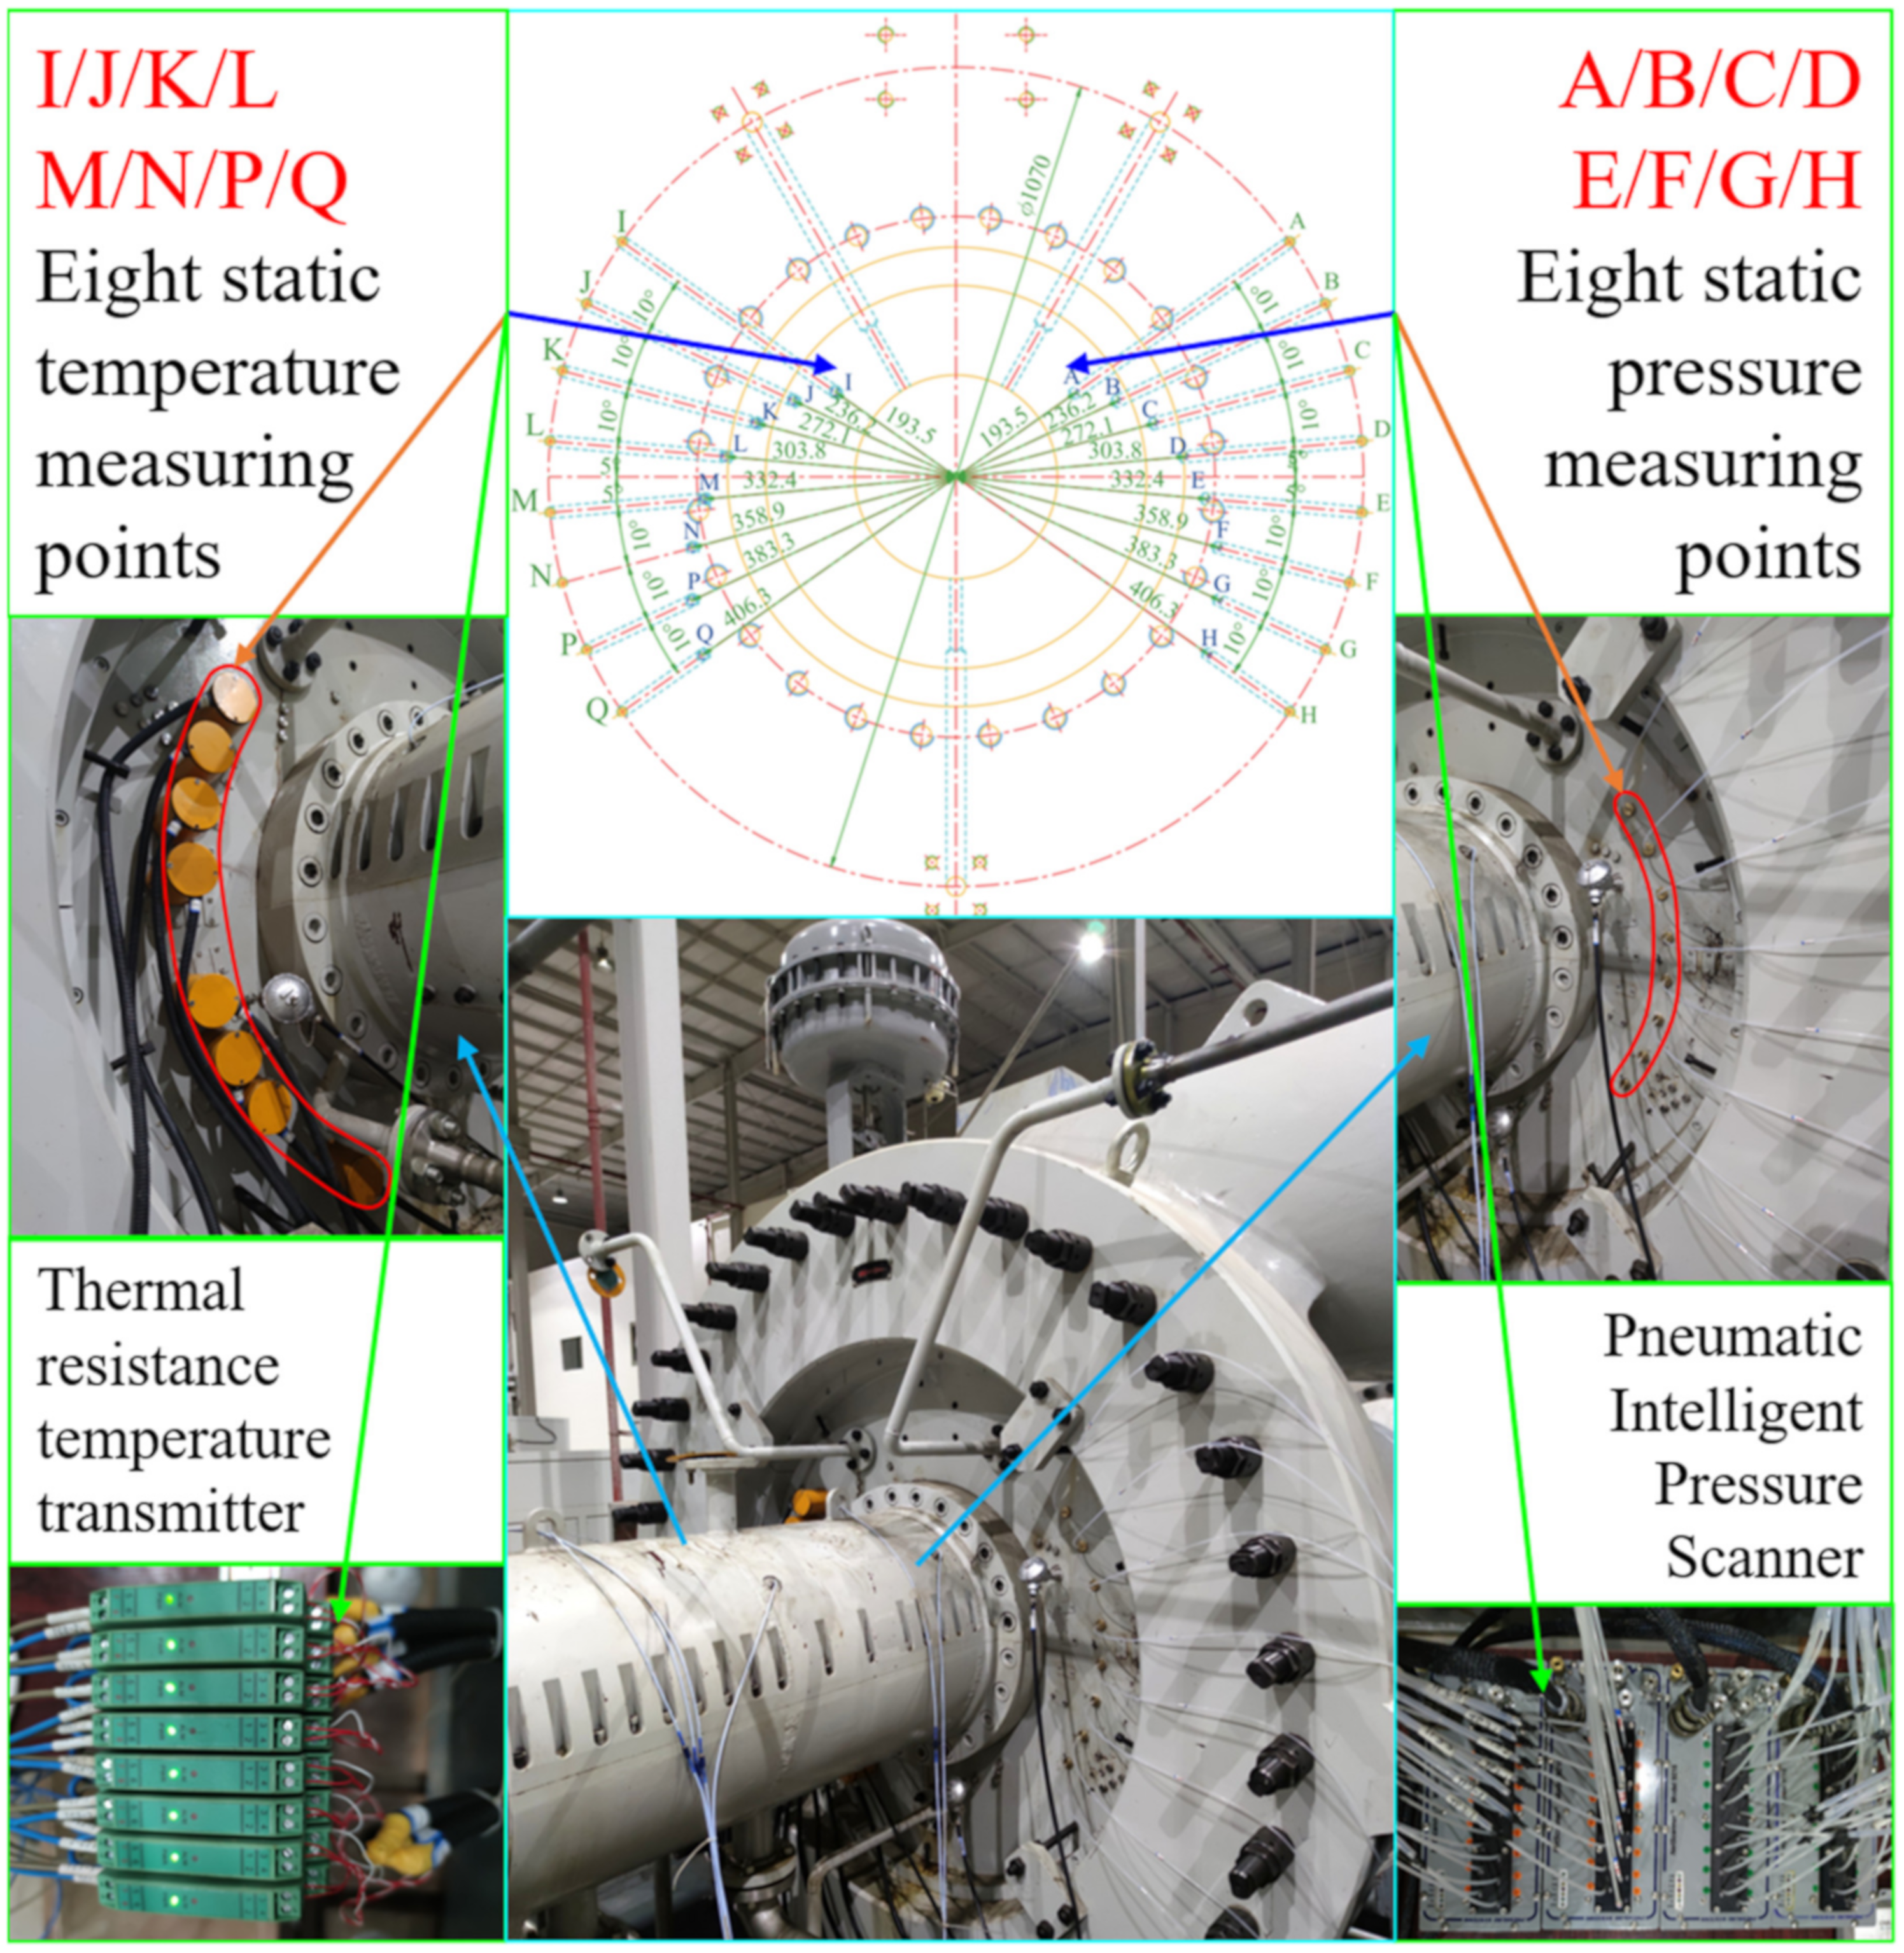
3.1. Test Facility and Measuring Points

All experimental procedures were completed on the closed test rig of the large-scale CAES multi-stage intercooling centrifugal compressor in National Energy Large-Scale Physical Energy Storage Technologies R&D Center (IET, CAS). The entire facility has strong capabilities with a 0.5~110 bar pressure measurement range, 0~40,000 r/min speed measurement range, and 0~10 MW power measurement range. More detailed information about the experimental compressor can be retrieved from previous research [25]. The radius distribution of all measuring points on the static wall surface of IBC is determined by the equivalent area ring method. As shown in Figure 2, the eight ps measuring points and eight Ts measuring points are densely arranged on the left and right sides respectively, and the radii of the specific positions are 193.5 mm, 236.2 mm, 272.1 mm, 303.8 mm, 332.4 mm, 358.9 mm, 383.3 mm, and 406.3 mm. All 16 measuring points are respectively led out to the circumference of the casing wall with a radius of 535 mm (surrounded by the red circle in Figure 2) through the corresponding internal channels. The static pressure of the 8 marked points A, B, C, D, E, F, G, and H on the right side of the cavity is transmitted to the remote PSI pressure scanning system through the white pressure tube after passing through the internal flow channel. The static temperature signals of the 8 marked points I, J, K, L, M, N, P, and Q on the left side of the cavity are converted into electrical signals by the thermal resistance sensor lead wires arranged in the internal flow channel, and then it is amplified and transported to the host computer by the temperature transmitter.

3.2. Measurement Method and Error Analysis

Field data collection mainly includes total pressure (pt) probe combs and WRN thermocouple total temperature (Tt) probe combs for inlet and outlet pipelines; UNIK5000 pressure sensors and WZPK thermal resistances PT100 between each flow component; annubar mass flowmeter (m) in the front of damping chamber; non-contact torque (T) meter; vibration sensor for rotating shaft and pneumatic throttle valve group opening. With regard to sixteen measuring points of ps and Ts at different radii on the static wall of IBC in Figure 2, four Model 9216 Pneumatic Intelligent Pressure Scanners are selected to directly transmit all ps and pt signals to PSI9000 pressure acquisition system through massive white pressure pipes. Three-wire embedded thermal resistance, thermal resistance temperature transmitter, and PLC data acquisition module are connected in turn to transmit Ts signal to the host computer. The recorded steady-state physical quantities mainly include pt, Tt, m, T, n, ps, and Ts,while other physical quantities can be obtained through data processing and thermodynamic calculations, such as PRt, ηis, and Ps. In the error analysis, the combined standard uncertainty in a measurement is the combination of uncertainty due to random error and uncertainty caused by the systematic error [26]. Before the test, the systematic error was reduced to an acceptable level by optimizing the test method, selecting a reasonable instrument range, calibrating the test instrument, and correcting the data. Therefore, the uncertainty of the measurement result is mainly caused by random error, and some major sensors’ uncertainties are listed in Table 2.
Since there are many direct or indirect measurement parameters involved, this paper does not show the random standard uncertainty distribution diagram of each measurement parameter result after measurements. Instead, the feasibility of the test plan before measurements is demonstrated by identifying whether the maximum random error after the error transmission is consistent with the engineering analysis, which can refer to the author’s previous article [25]. The relative errors of PRt, ηis, and Ps are generated by the uncertainty of the direct measurement value through the error transfer formulas. The error ranges of PRt, ηis, and Ps are calculated respectively as being ±0.07%, ±0.75%, and ±0.31%, which can be accepted in experimental analysis and engineering applications.

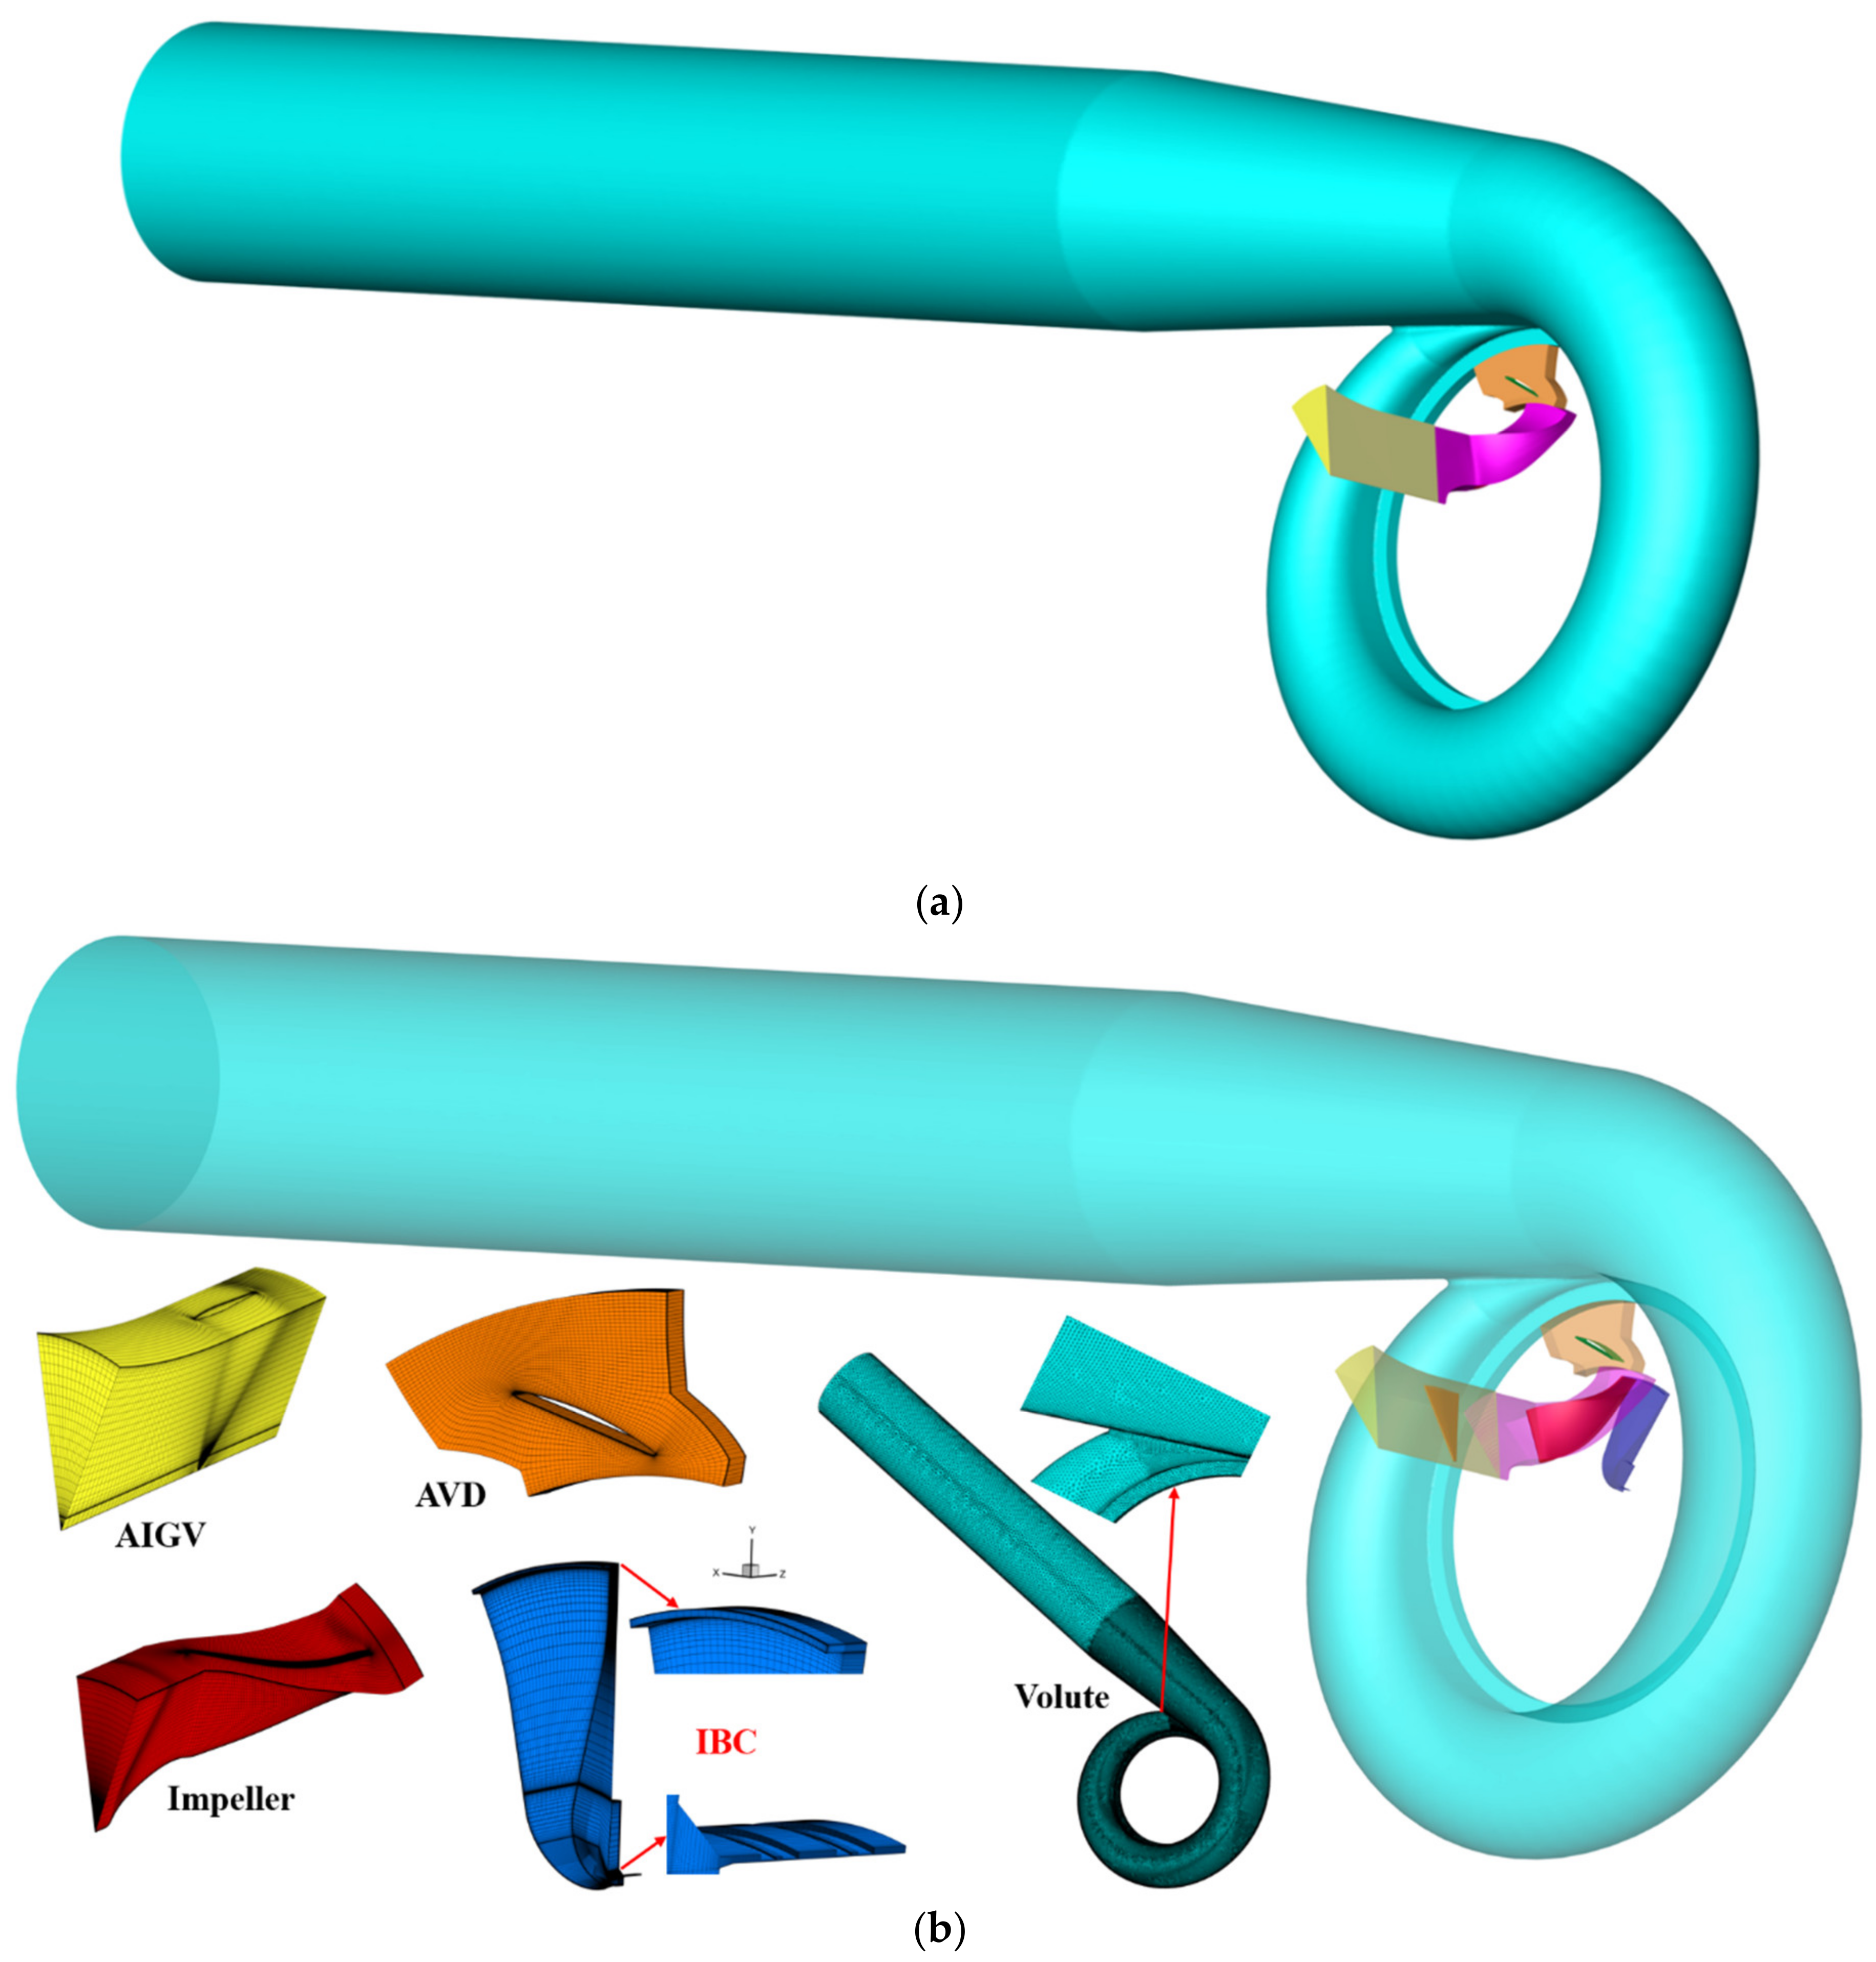
3.3. Computational Fluid Dynamic (CFD) Model

Based on the assumption that the incoming flow at AIGV inlet is circumferentially uniform and the rotating flow inside impeller and AVD passage is periodic, the numerical simulation adopts the single passage coupled computational domains consisting of IBC and all mainstream domains including AIGV, impeller, AVD, and volute. As a comparative analysis, another group of numerical calculation domains includes all conventional mainstream coupling, ignoring the influence of IBC. Figure 3 shows two groups of computational domains, which are exactly the same as the geometric model of the whole experimental machine in Figure 1.
In the calculation settings, the uniform total pressure of 97,000 Pa and the total temperature of 303.15 K with inlet airflow direction are determined. Different average mass flows are input from the choke point to the stall point at the exit of the volute. For the inlet boundary condition, medium turbulence (intensity 5%) and a length scale equal to the passage domain height are set. Due to the temporary inability to accurately test the relatively small amount of leakage, the interface leakage at the lower edge of the cavity is set to zero and the labyrinth seal clearance is exactly the same as the tested cavity, which is slightly different from the actual test situation. The Stage Mixing Plane is selected to be applied to the rotor-stator interfaces, which circumferentially averages the fluxes through the bands on the interface. In order to simplify the CFD model, the non-slip and adiabatic boundary conditions are specified at all solid walls, which has an error for static temperature analysis in IBC. Because the actual casing solid wall has a varying radial heat flow distribution effect that causes heat transfer with the internal flow field, and it’s difficult to accurately measure in experiments or estimate approximately in simulations. The steady-state calculations in this paper utilizes the k-omega shear stress transport (SST) turbulence model [27] with the gamma-theta transition model, and solves the continuity, momentum, and energy equations through the high-resolution scheme in ANSYS CFX. The total nodes of the grids of the two calculation models are 3,169,336 and 3,597,950 respectively, and all the root-mean-square residuals for momentum and mass equations, energy equation, and turbulence equation are converged less than 10−6. The first boundary layer offset is set to 5 × 10⁻⁶ m and a total of 10 layers are generated. The maximum wall y plus value after the simulation is within 50, which satisfies the requirements of the turbulence model.

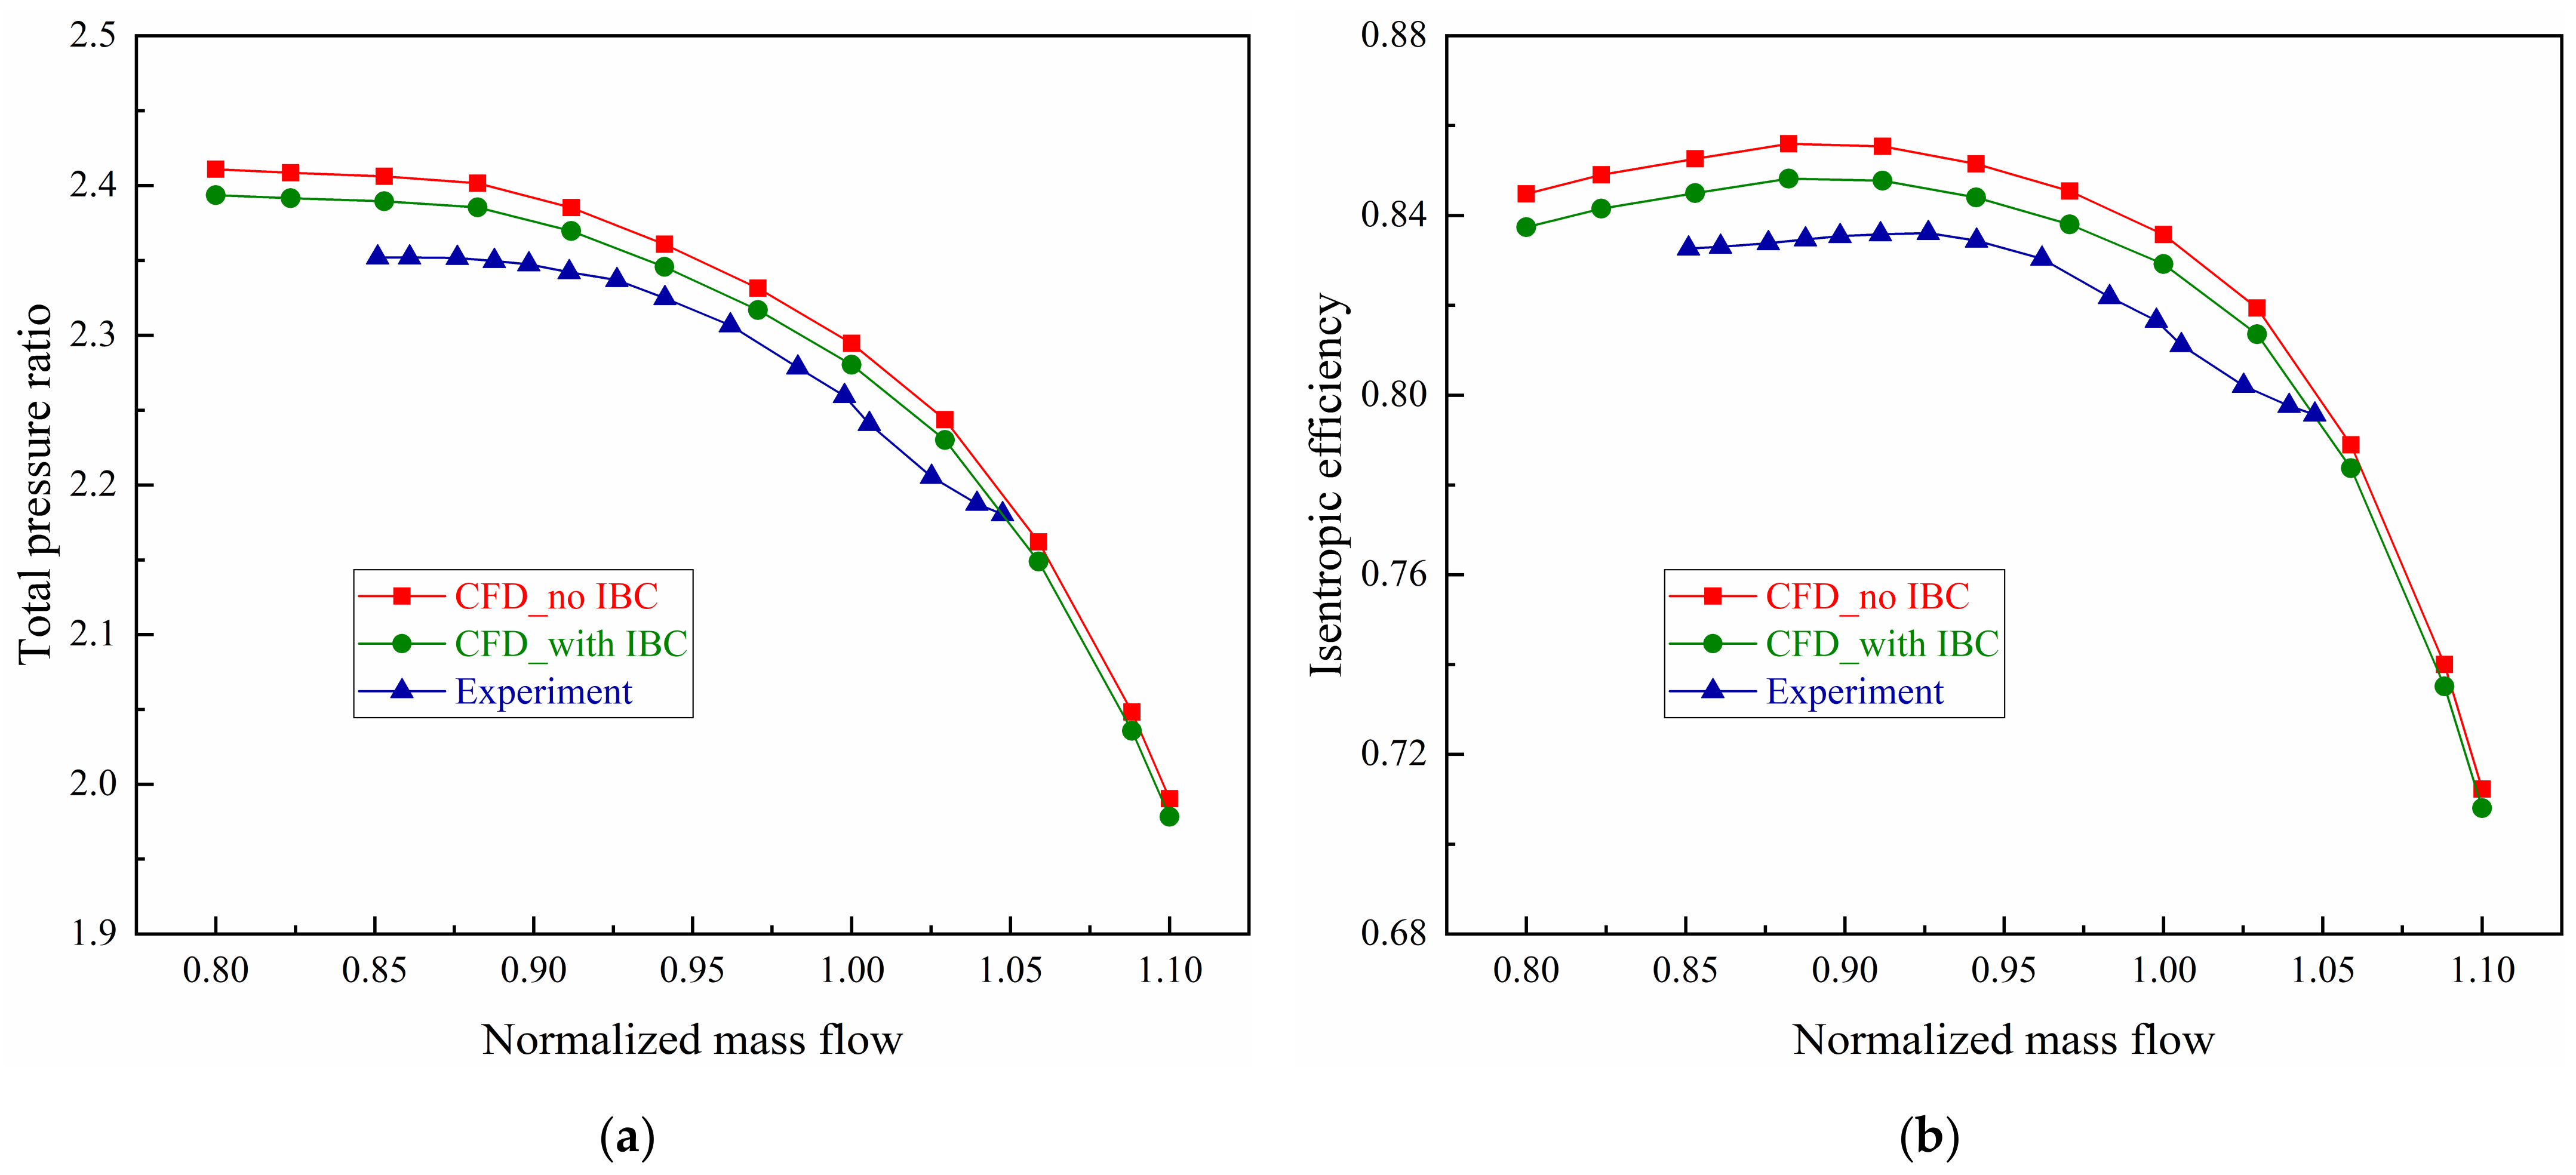
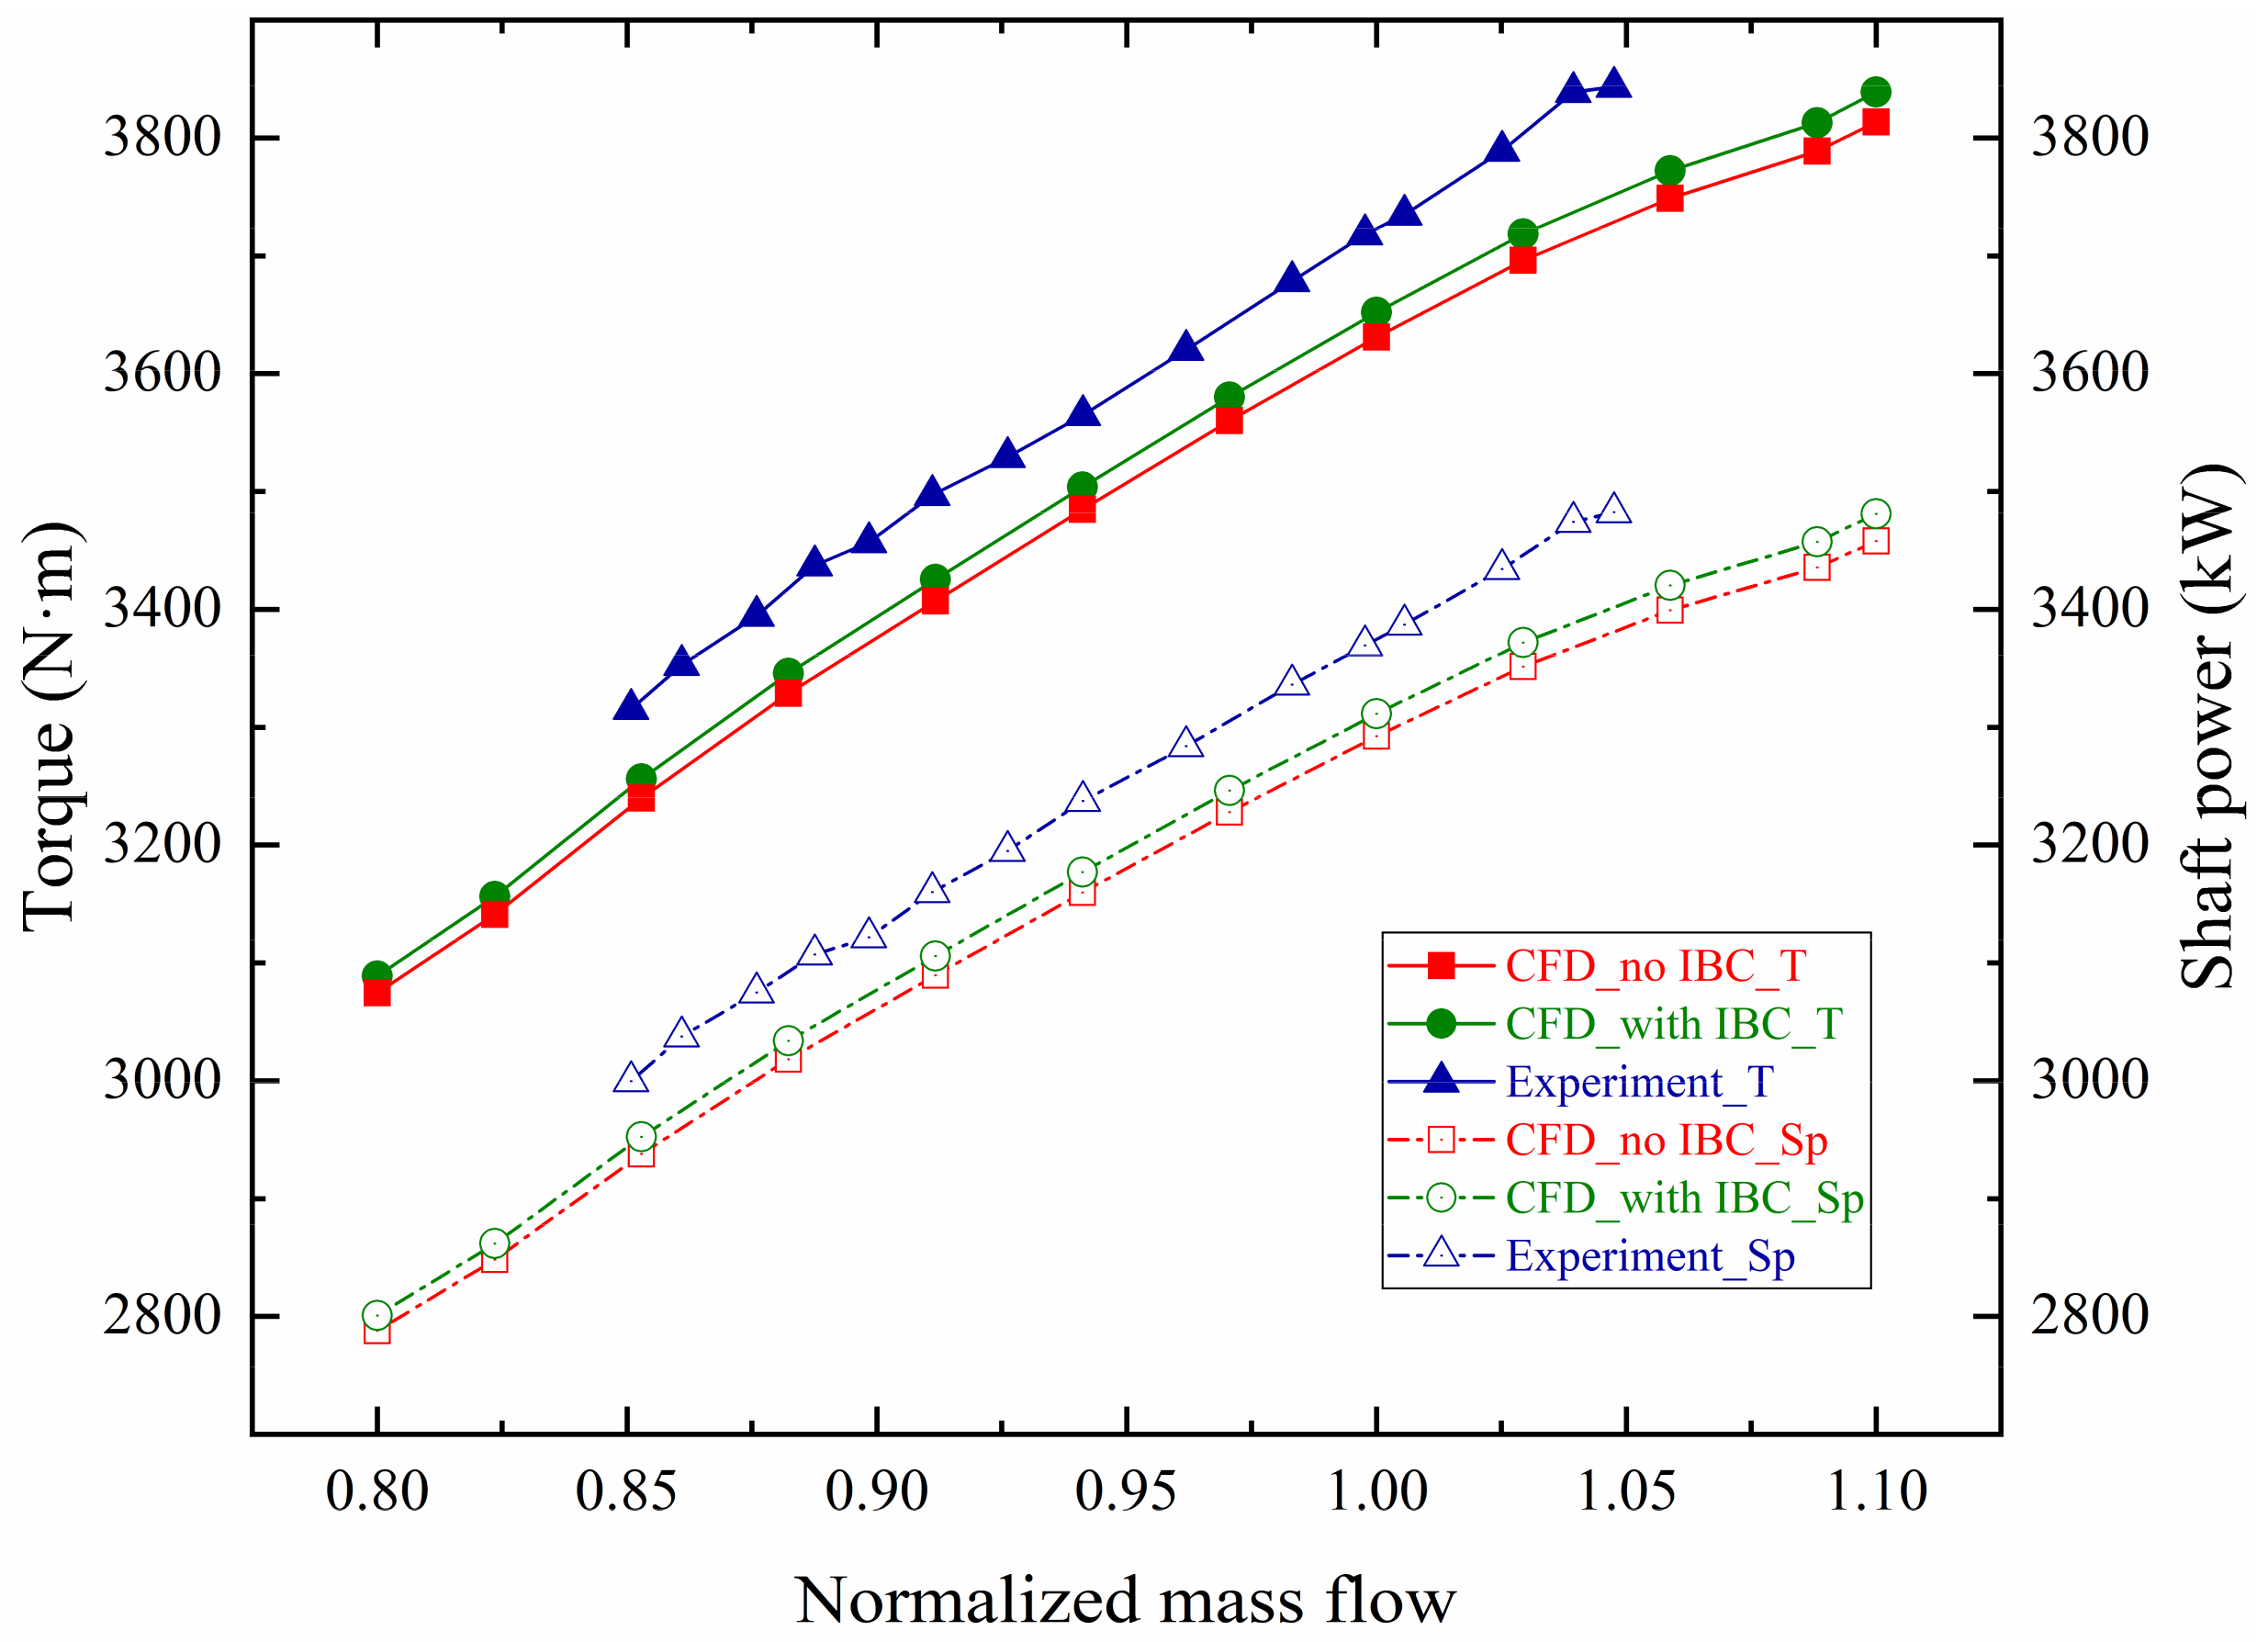
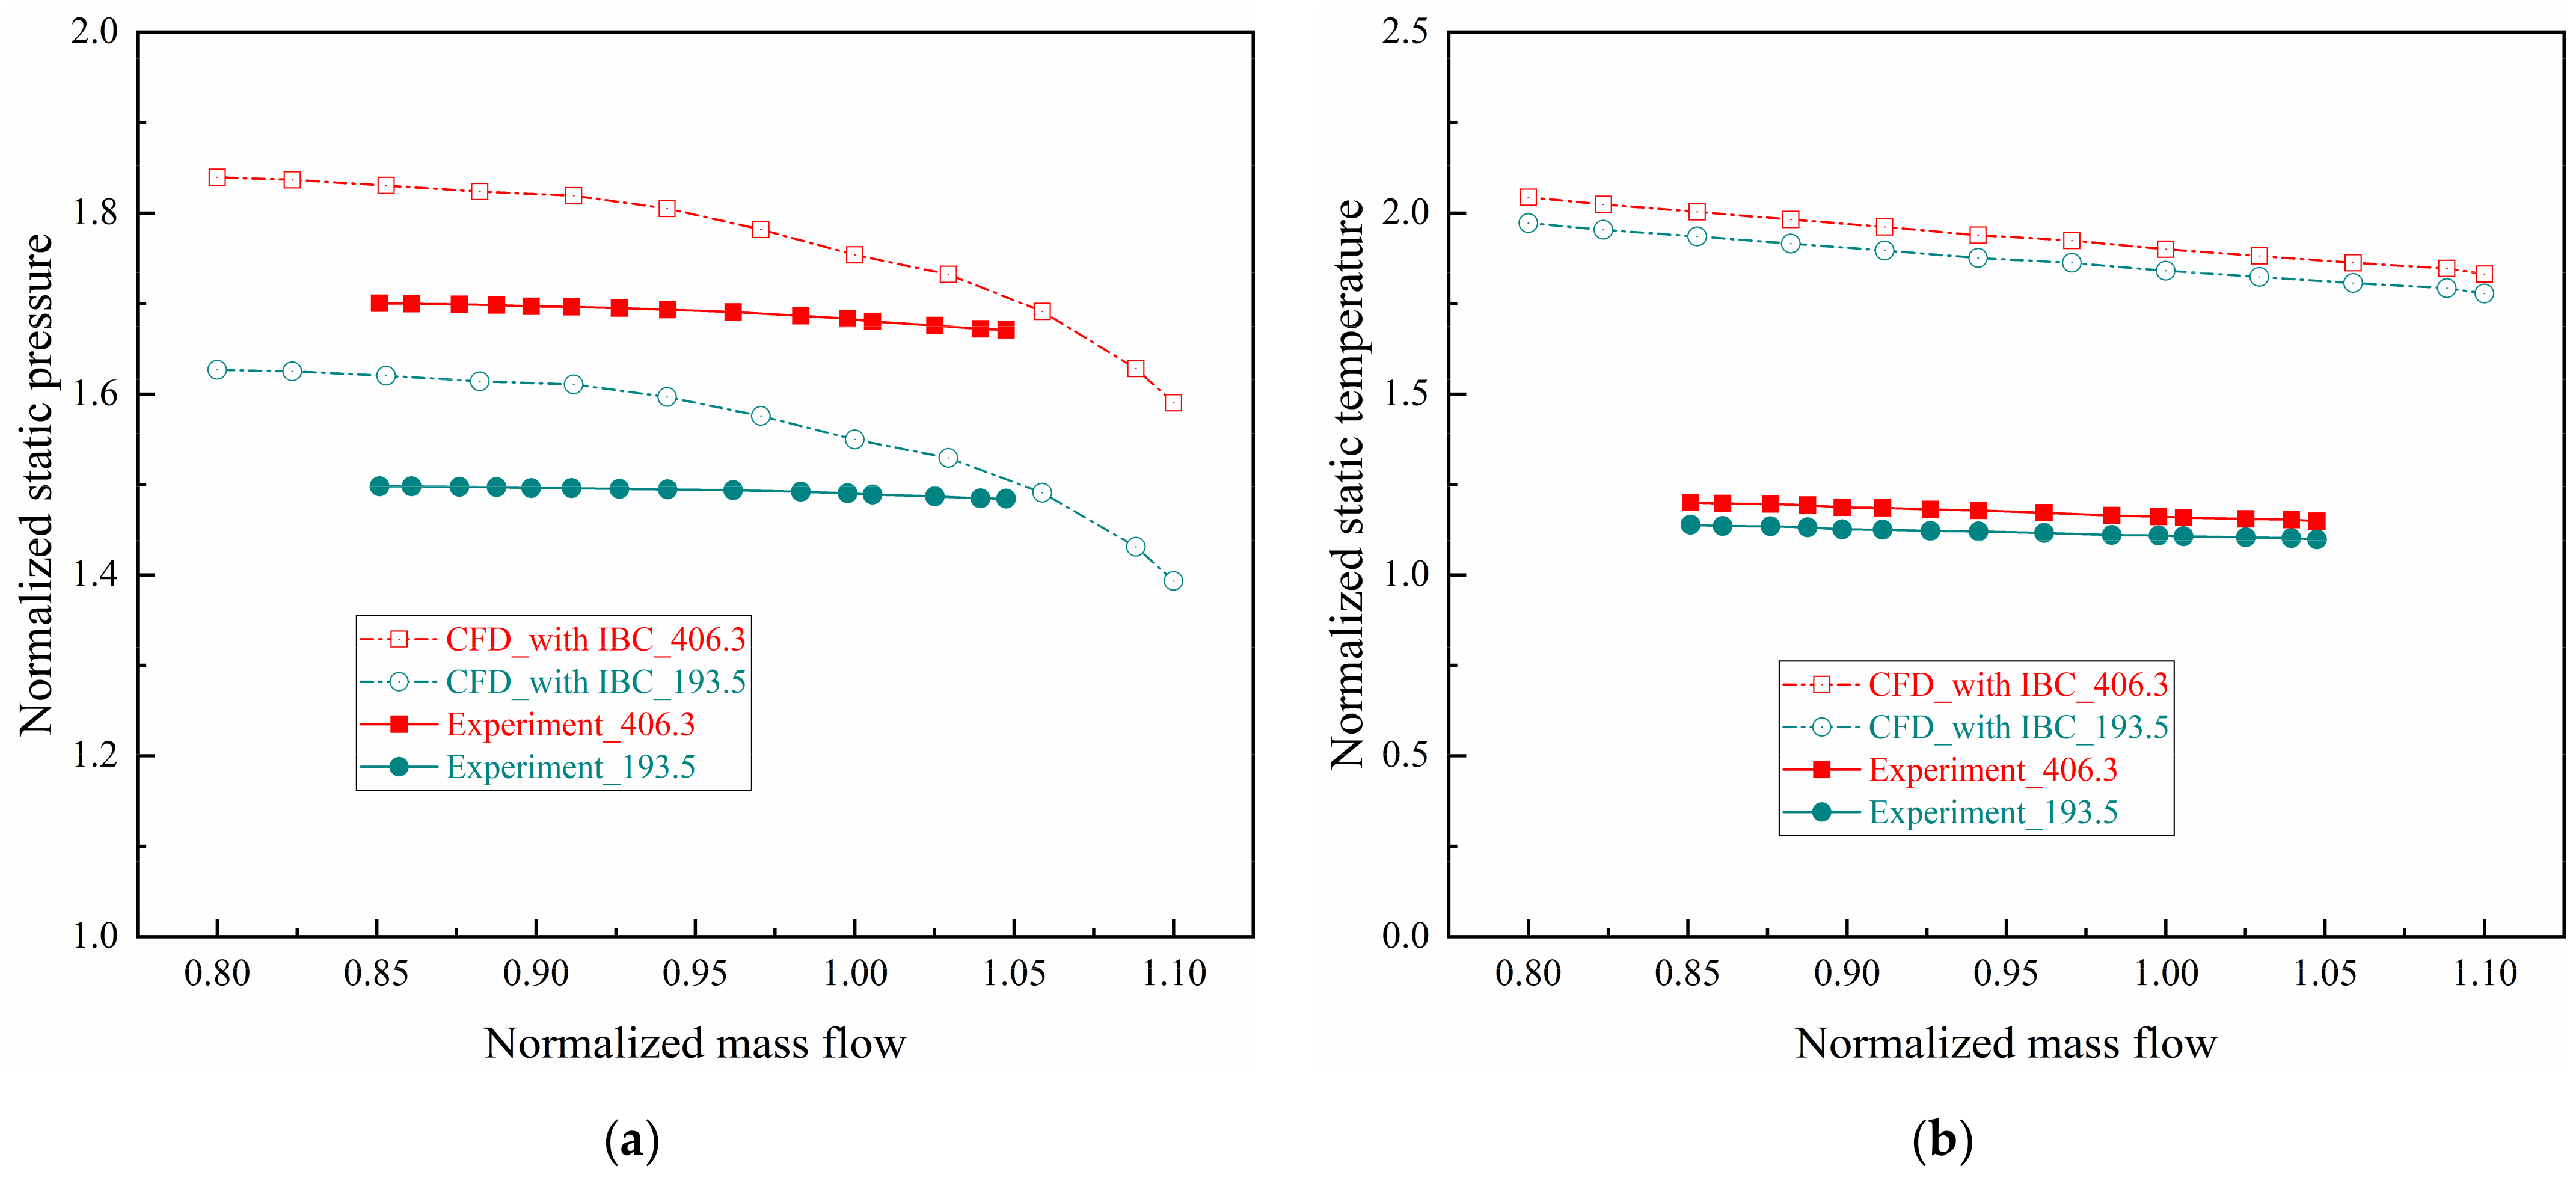
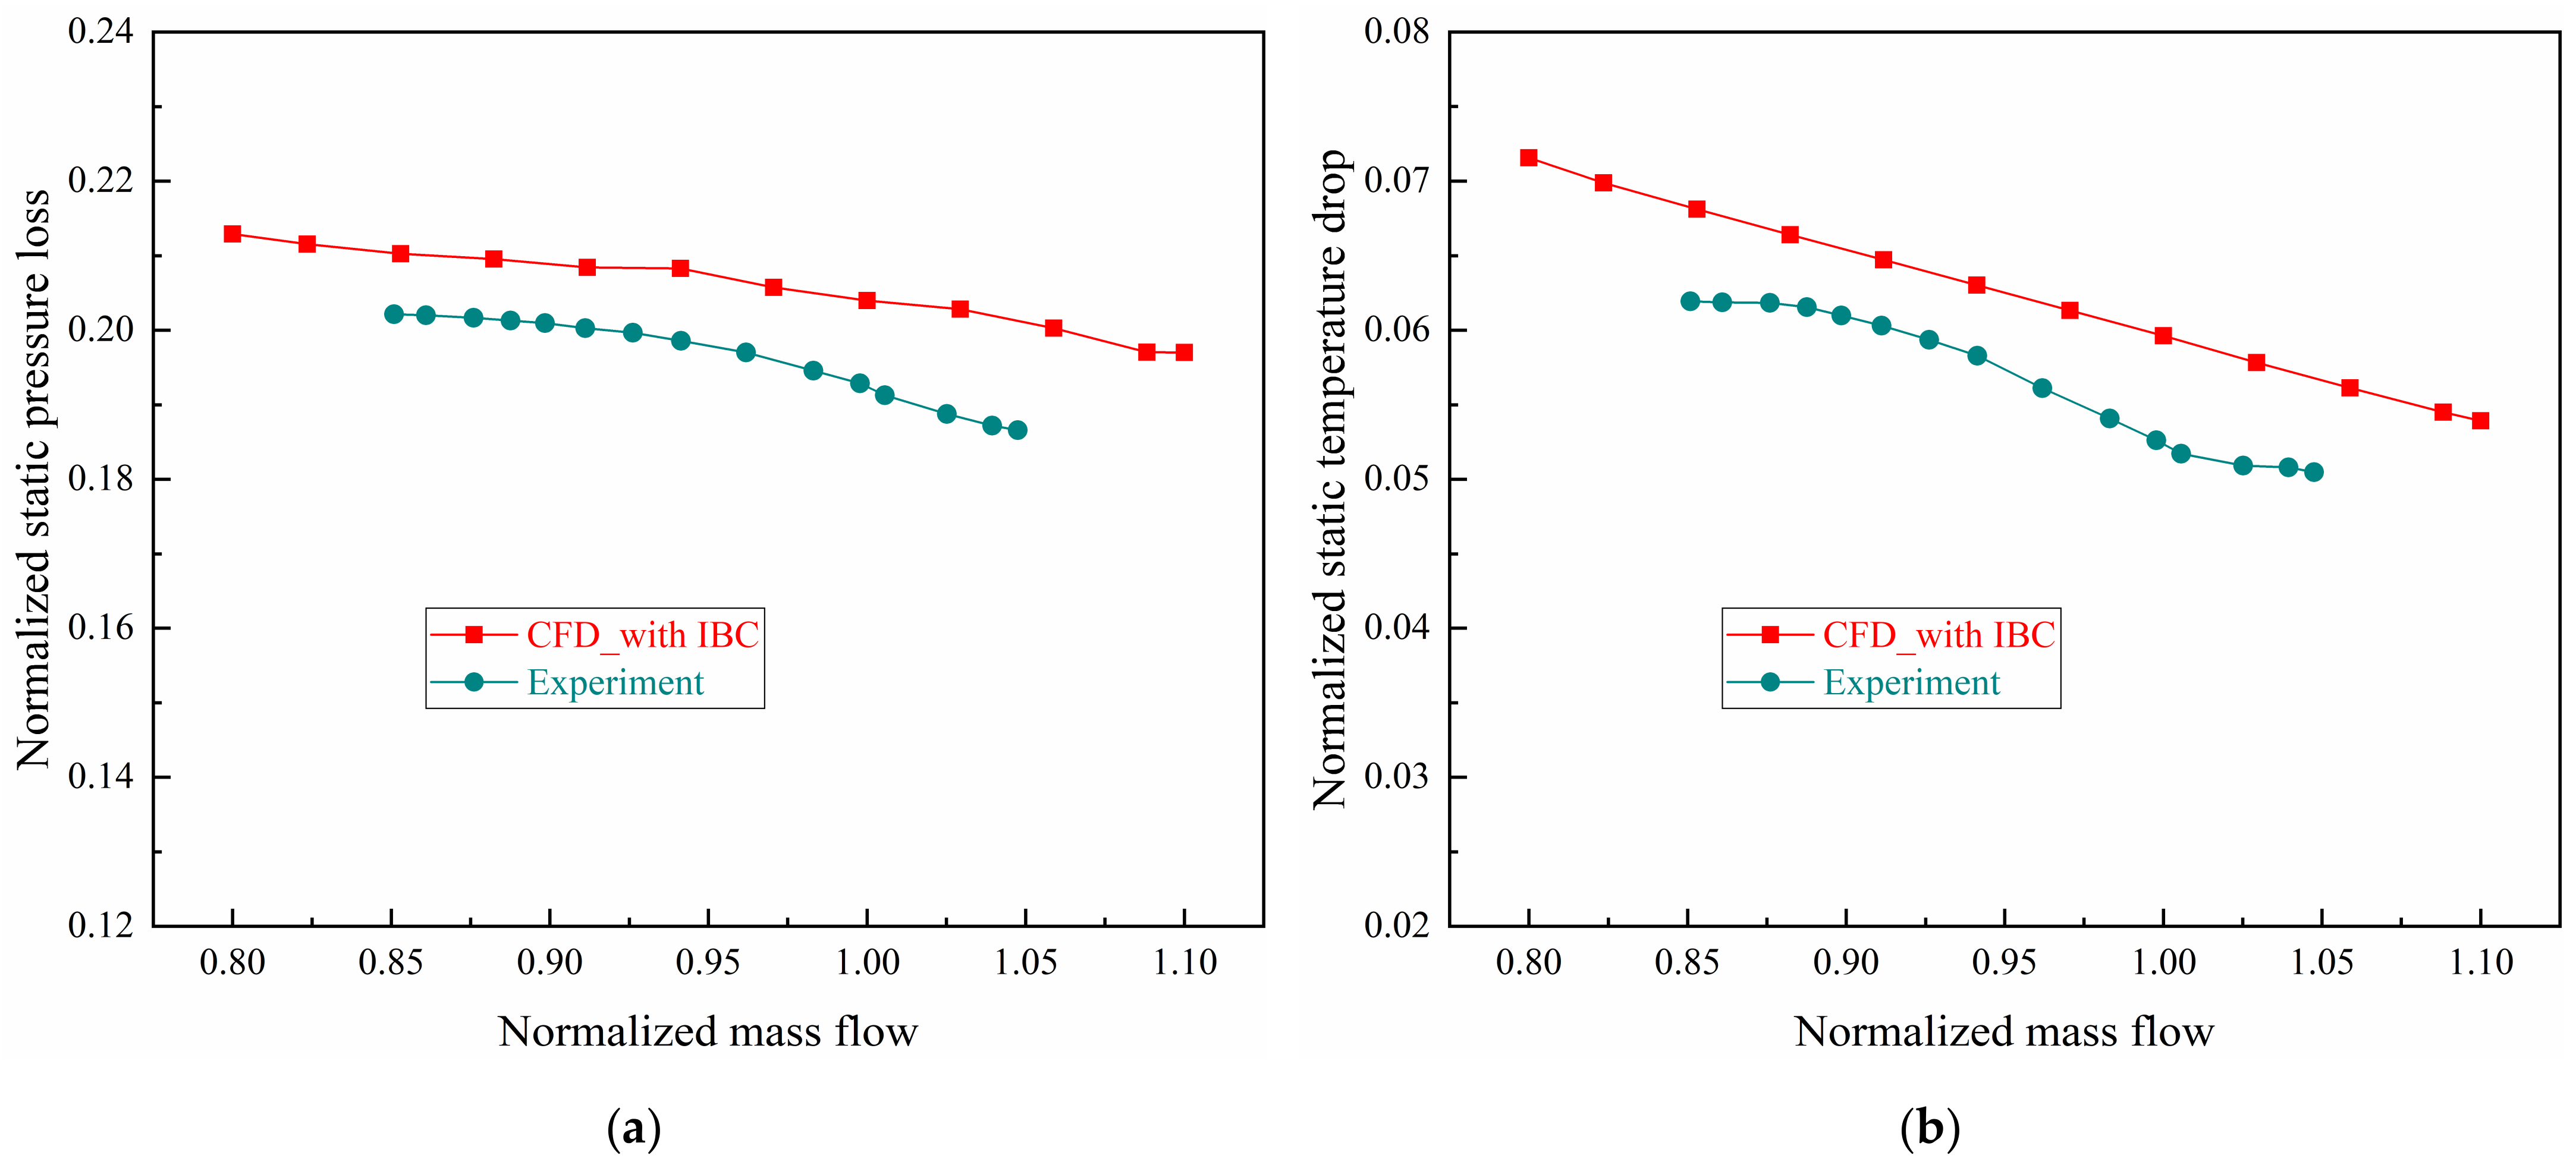
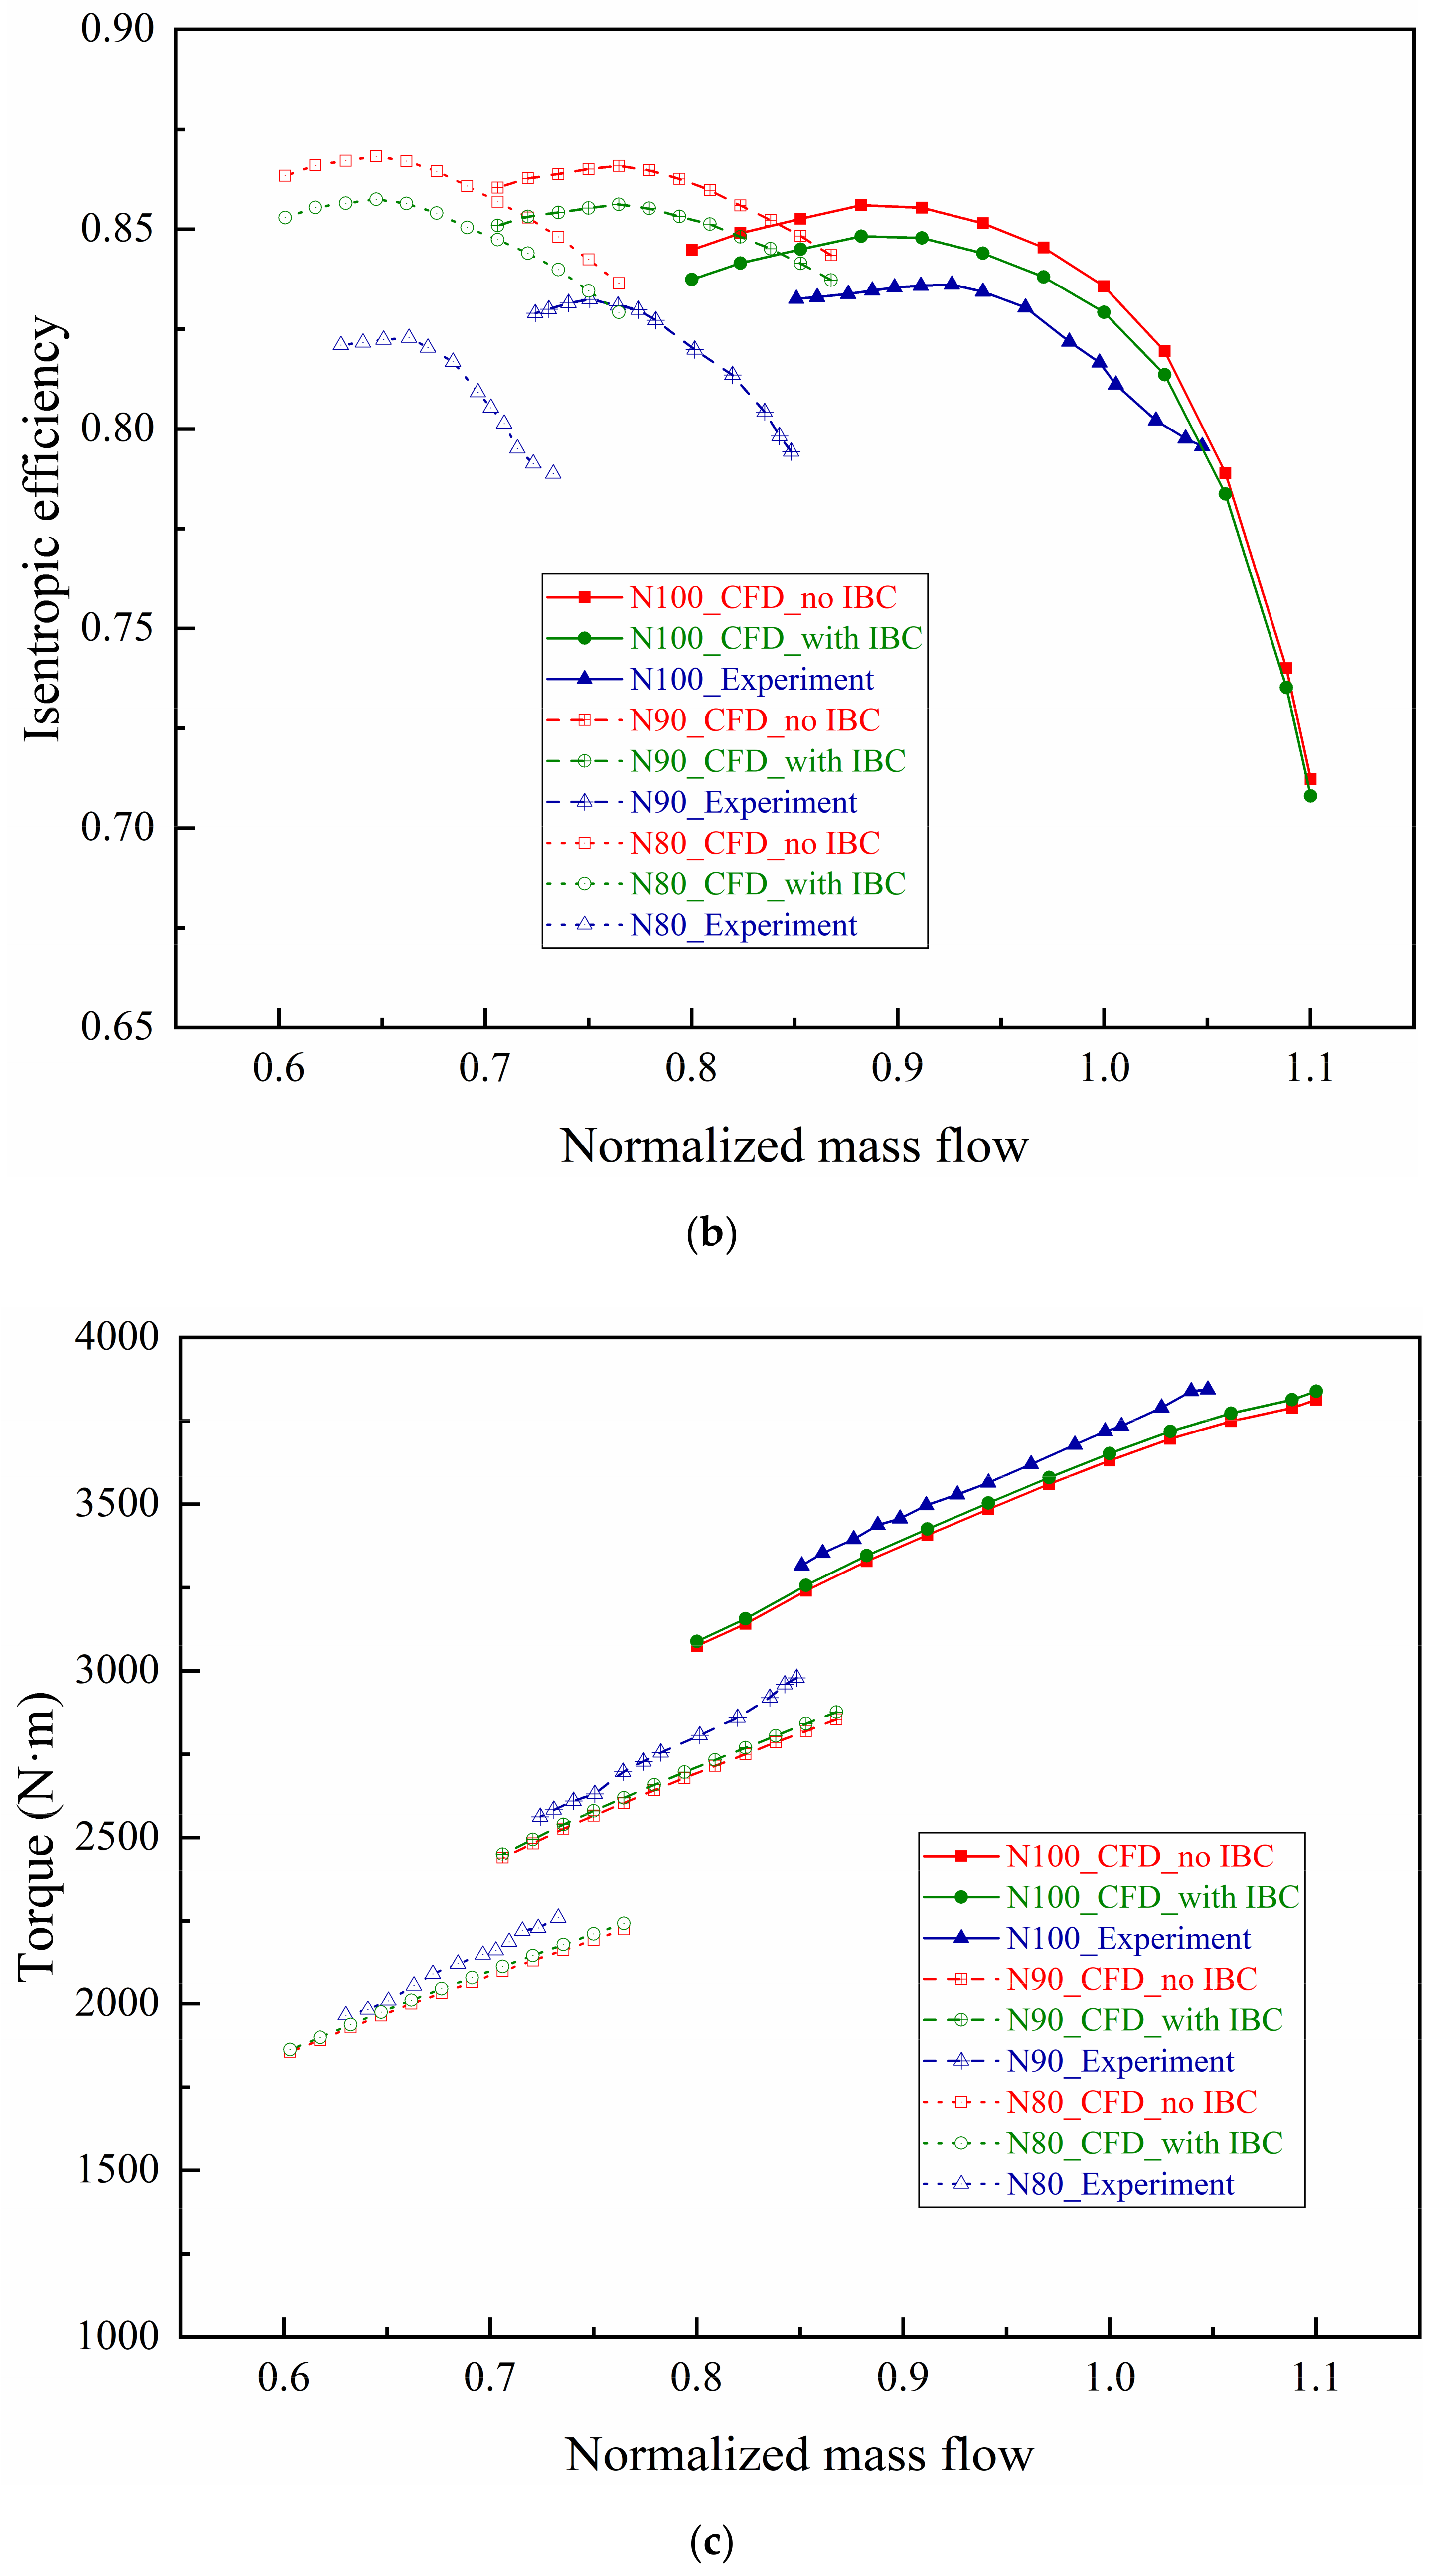
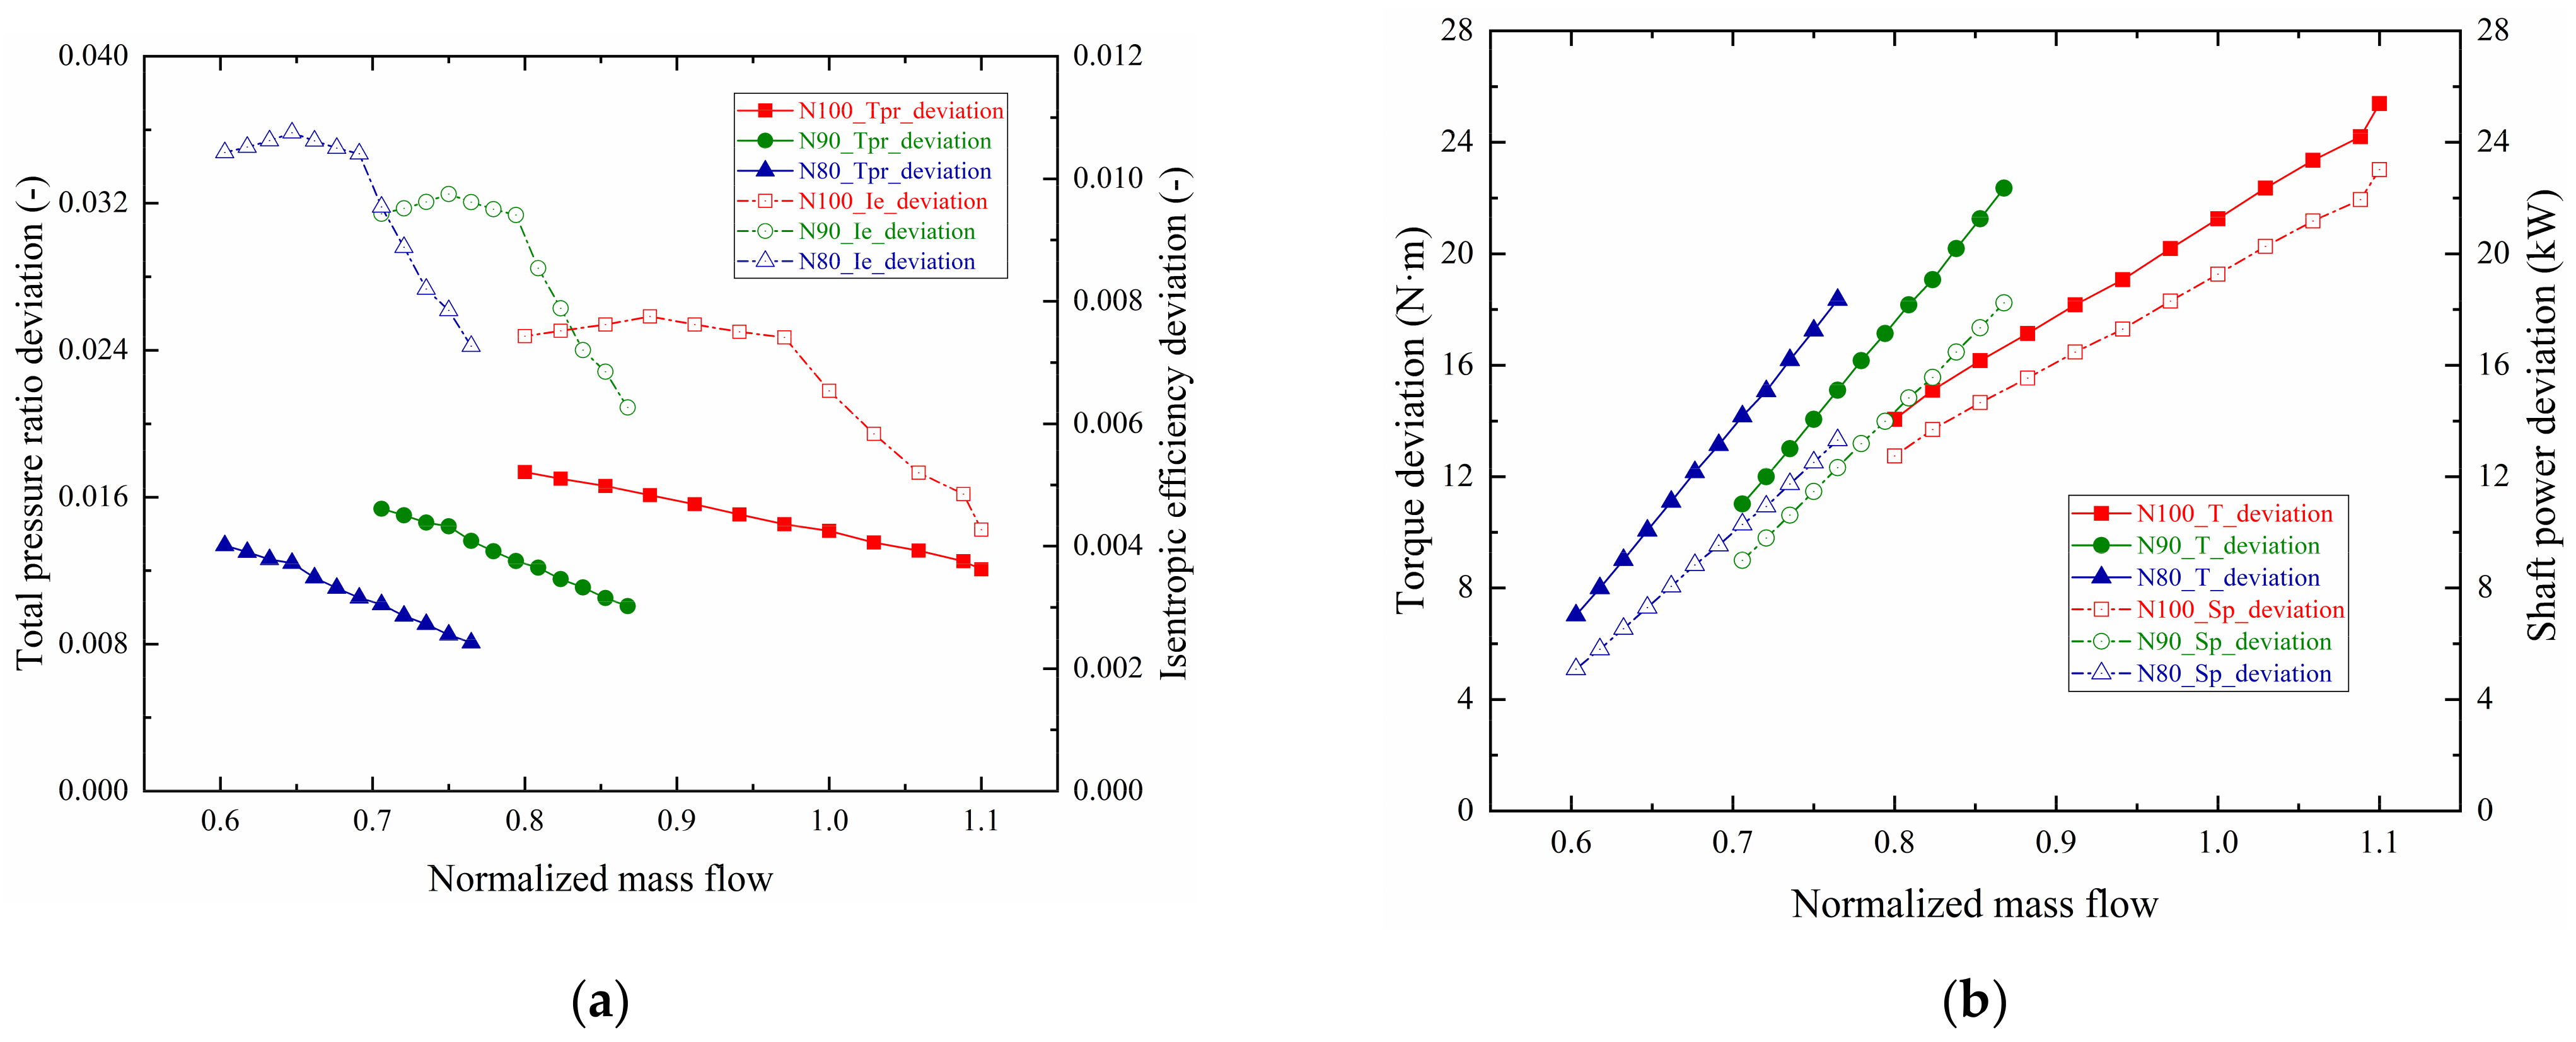
3.4. Model Validation

A comparison of the aerodynamic performances between numerical simulation and experimental testing is conducted to validate the calculation model. The measured results are obtained using the closed test platform in Figure 2, and the calculated results are extracted from two CFD models in Figure 3. The predicted and measured characteristic curves of aerodynamic performance parameters including PRt and isentropic efficiency (ηis) under design rotating speed are shown in Figure 4. It can be found that the design point experimental PRt is about 2.25, which are respectively 1.3% and 1.7% away from the numerical results of 2.28 and 2.29 with IBC or not; the design point ηis obtained in the experiment is about 81.50%, which are respectively 82.9% and 83.6% with deviations of 1.7% and 2.5% when considering IBC or not in the calculation. The above comparative analysis results are within the engineering permissible error range, which demonstrates the feasibility of the two CFD models and reflects the necessity of the coupled computations with IBC.

4. Results and Discussion

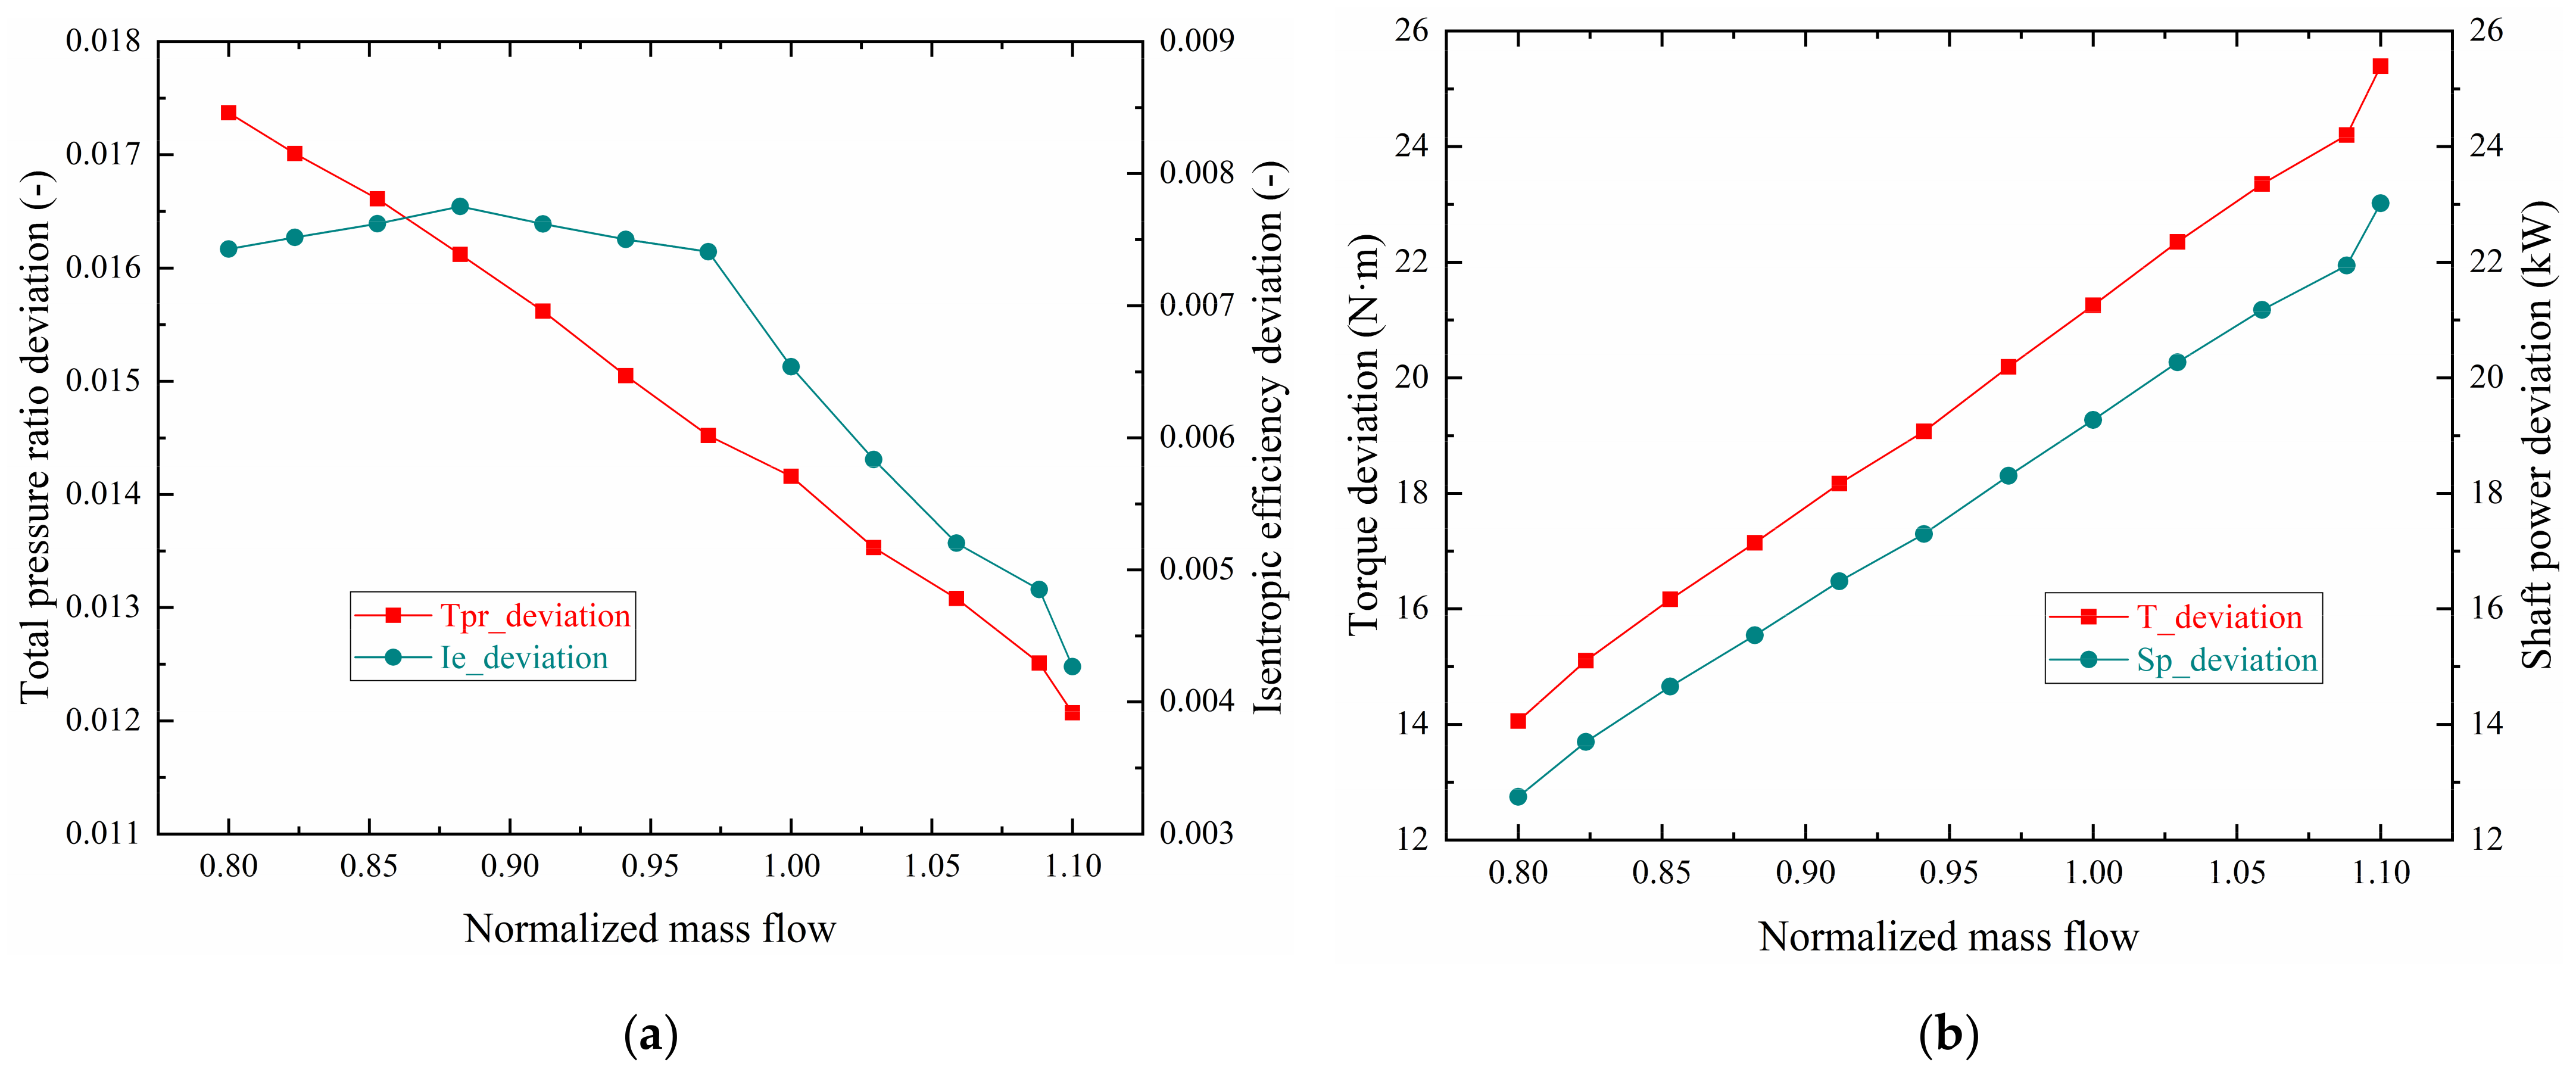
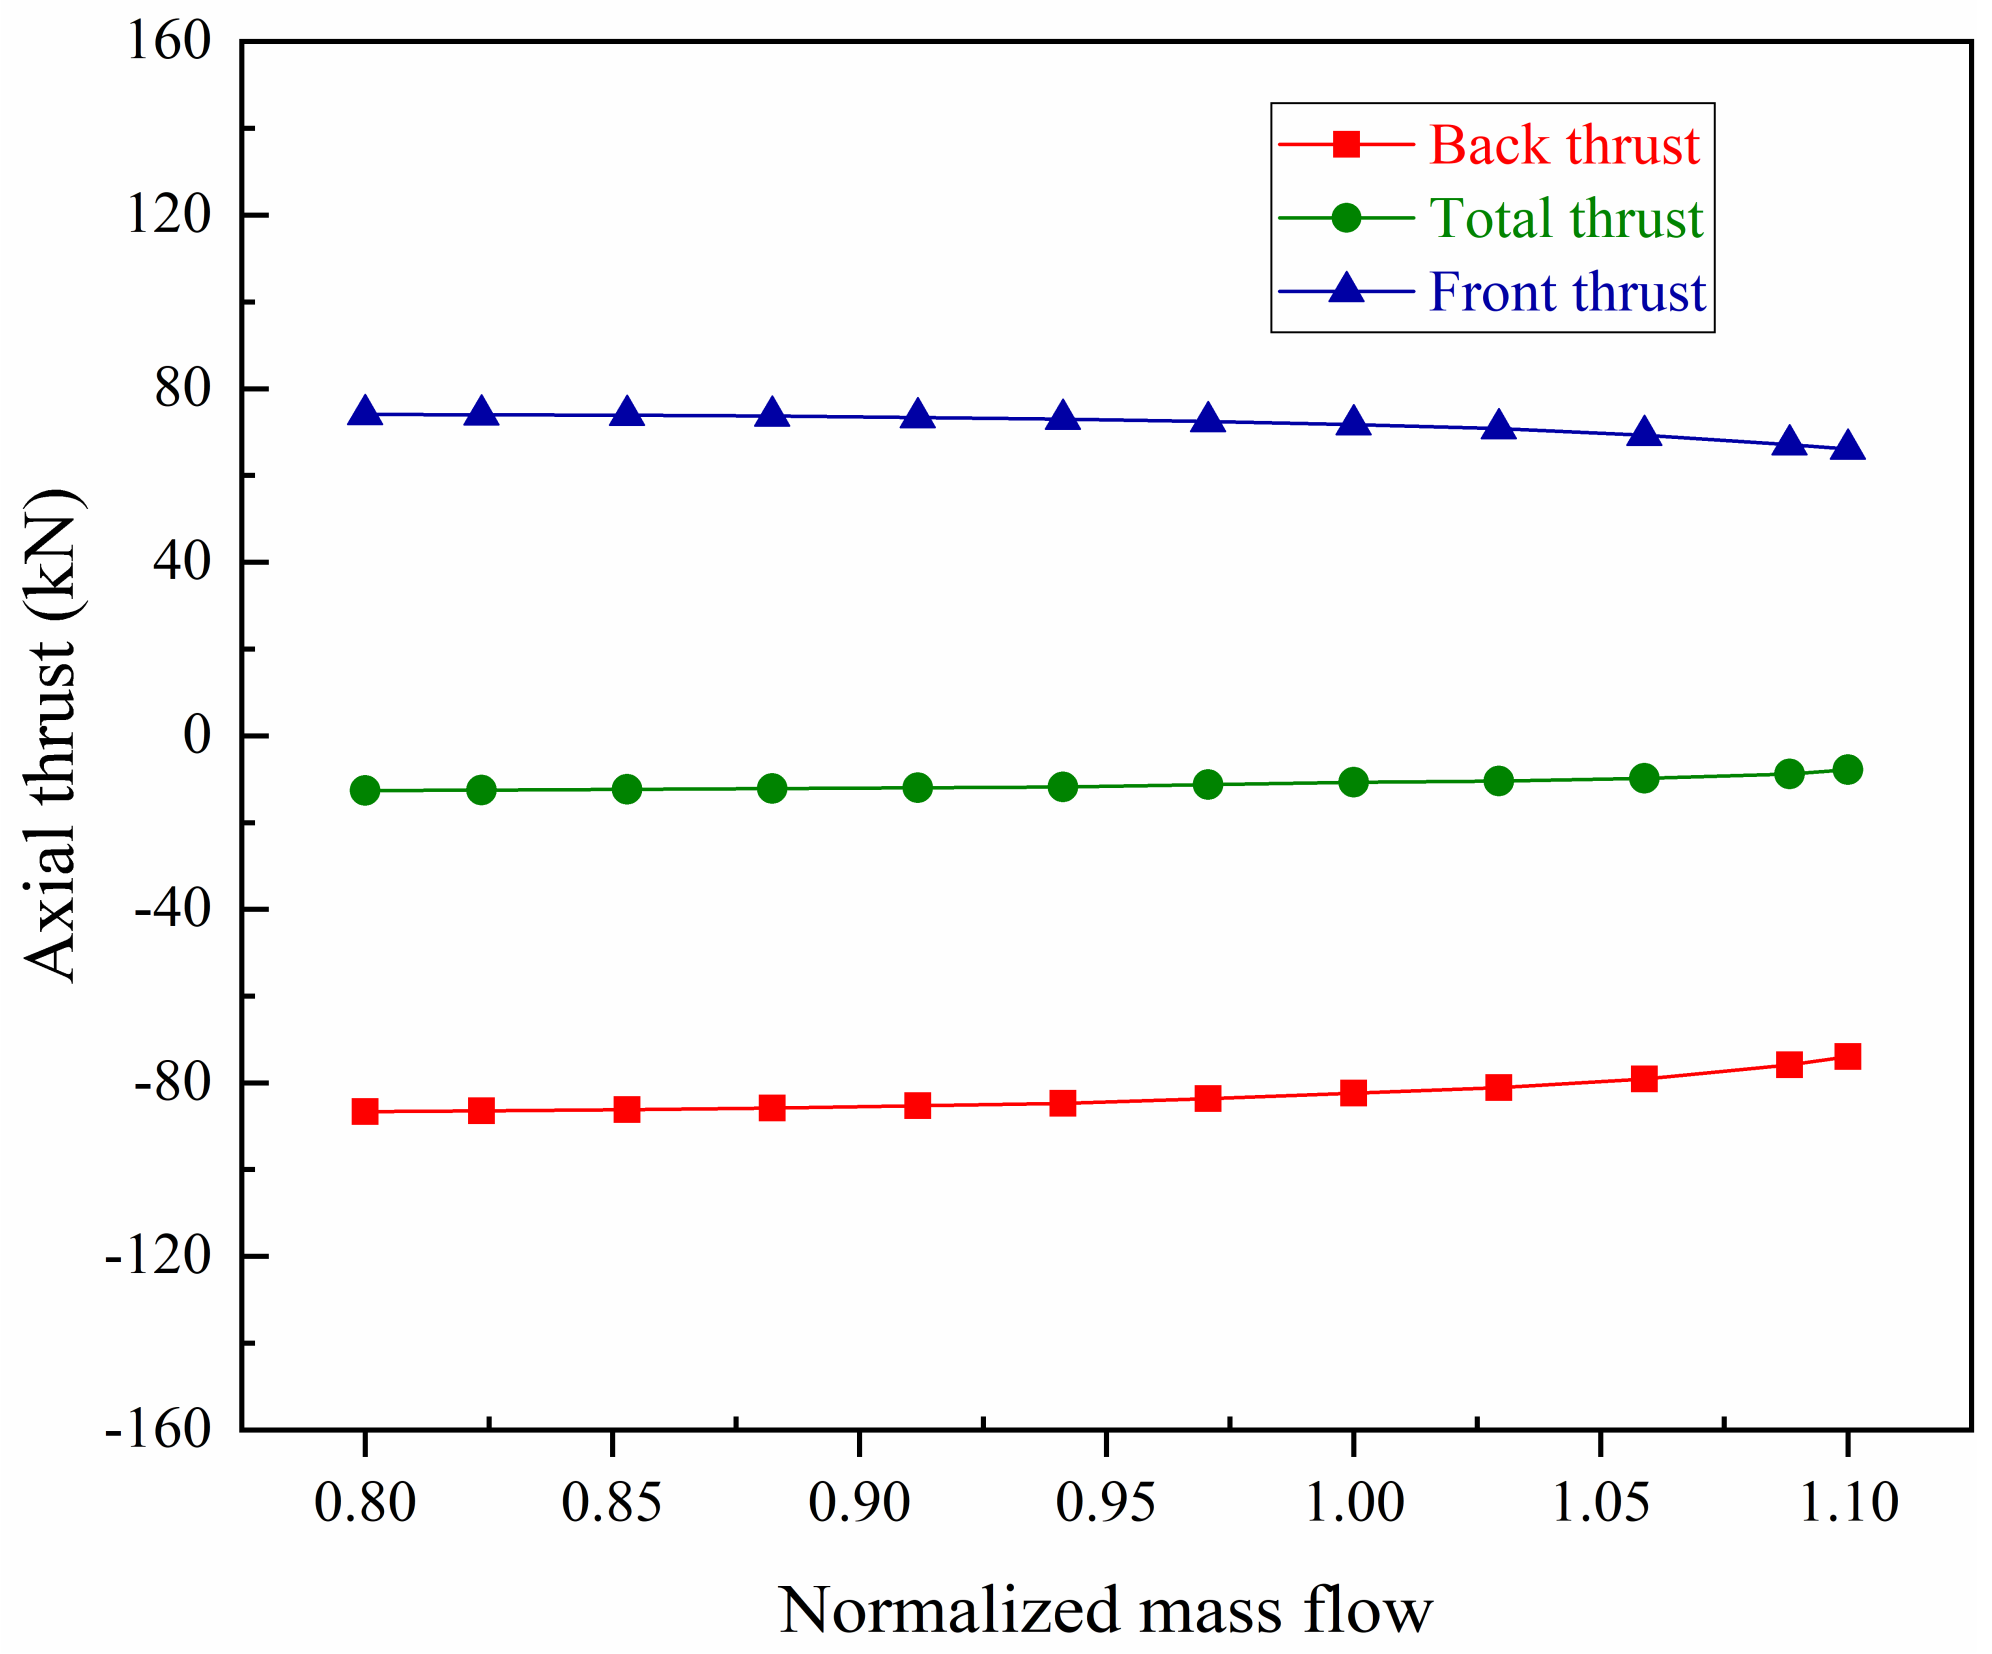
4.1. Coupling Characteristics with IBC

The characteristic curves of aerodynamic performance in Figure 4 show that PRt and ηis of the coupled calculations with IBC are closer to the experimental results than those without coupling. Furthermore, the predicted and measured characteristic curves of power consumption under design rotating speed are presented in Figure 5. Both torque and shaft power decrease with the decrease of the flow. The design point torque and shaft power are about 3723 N·m and 3374 kW, which are 2.5% and 2.4% away from the design point numerical values without IBC of 3631 N·m and 3292 kW, respectively, which are 1.9% and 1.8% away from the design point numerical values with IBC of 3652 N·m and 3312 kW. The reasons for the deviations between CFD and Exp. in Figure 4 and Figure 5 include several aspects. First, due to the difference of the single flow passage model in the numerical simulation and the accuracy of the algorithm itself without considering the surface roughness of blades and flow channels. Second, due to the deviation of the assumption of steady-state flow with no-slip adiabatic boundary in CFD and the actual three-dimensional viscous transient flow with slip nonadiabatic wall in experiment. Third, due to the influences of volute asymmetry on AVDs’ outlet airflow and compressor outlet spiral airflow parameters exacerbate errors from the sensor accuracy of measuring equipment.
The conventional numerical computation results of uncoupled IBC, as shown in Figure 3a, does not take into account the leakage and wind resistance losses of IBC. Therefore, based on the further coupled computations with IBC in Figure 3b, the effects of IBC on the predicted aerodynamic performance parameters under design rotating speed can be compared and analyzed in Figure 6. It can be seen that the deviations of PRt, ηis, T and Ps under different mainstream flows are all changed with the change of their respective experimental value in Figure 4 and Figure 5, which represent the fact that PRt or ηis predicted by coupled calculations will be lower, and T or Ps will be higher. All deviations fully show that numerical errors relative to experimental results always exist and the prediction results of the coupled calculations with IBC are more accurate and reliable.
In addition, simulations like Figure 3a can not accurately provide the axial thrust of the impeller because there is no pressure distribution on the back. Since it is difficult to measure the axial thrust on-site, as a substitute analysis, numerical analysis based on the model in Figure 3b is used to extract the front and back thrust of the impeller under design rotating speed in Figure 7. Both the front and back thrust increase with the decrease of mainstream flow and their direction is opposite along the axis, because their pressure distribution on relative working surfaces both rise as a whole, which is related to the increase in airflow pressure at the outlet of the impeller entering the cavity. Furthermore, the value of the back thrust is greater than the front thrust, resulting in the direction of the resultant force being the same as the direction of the back thrust, pointing toward the compressor inlet. The total axial thrust is equal to the sum of the front and back thrust, the magnitude of which increases as mainstream flow decreases.

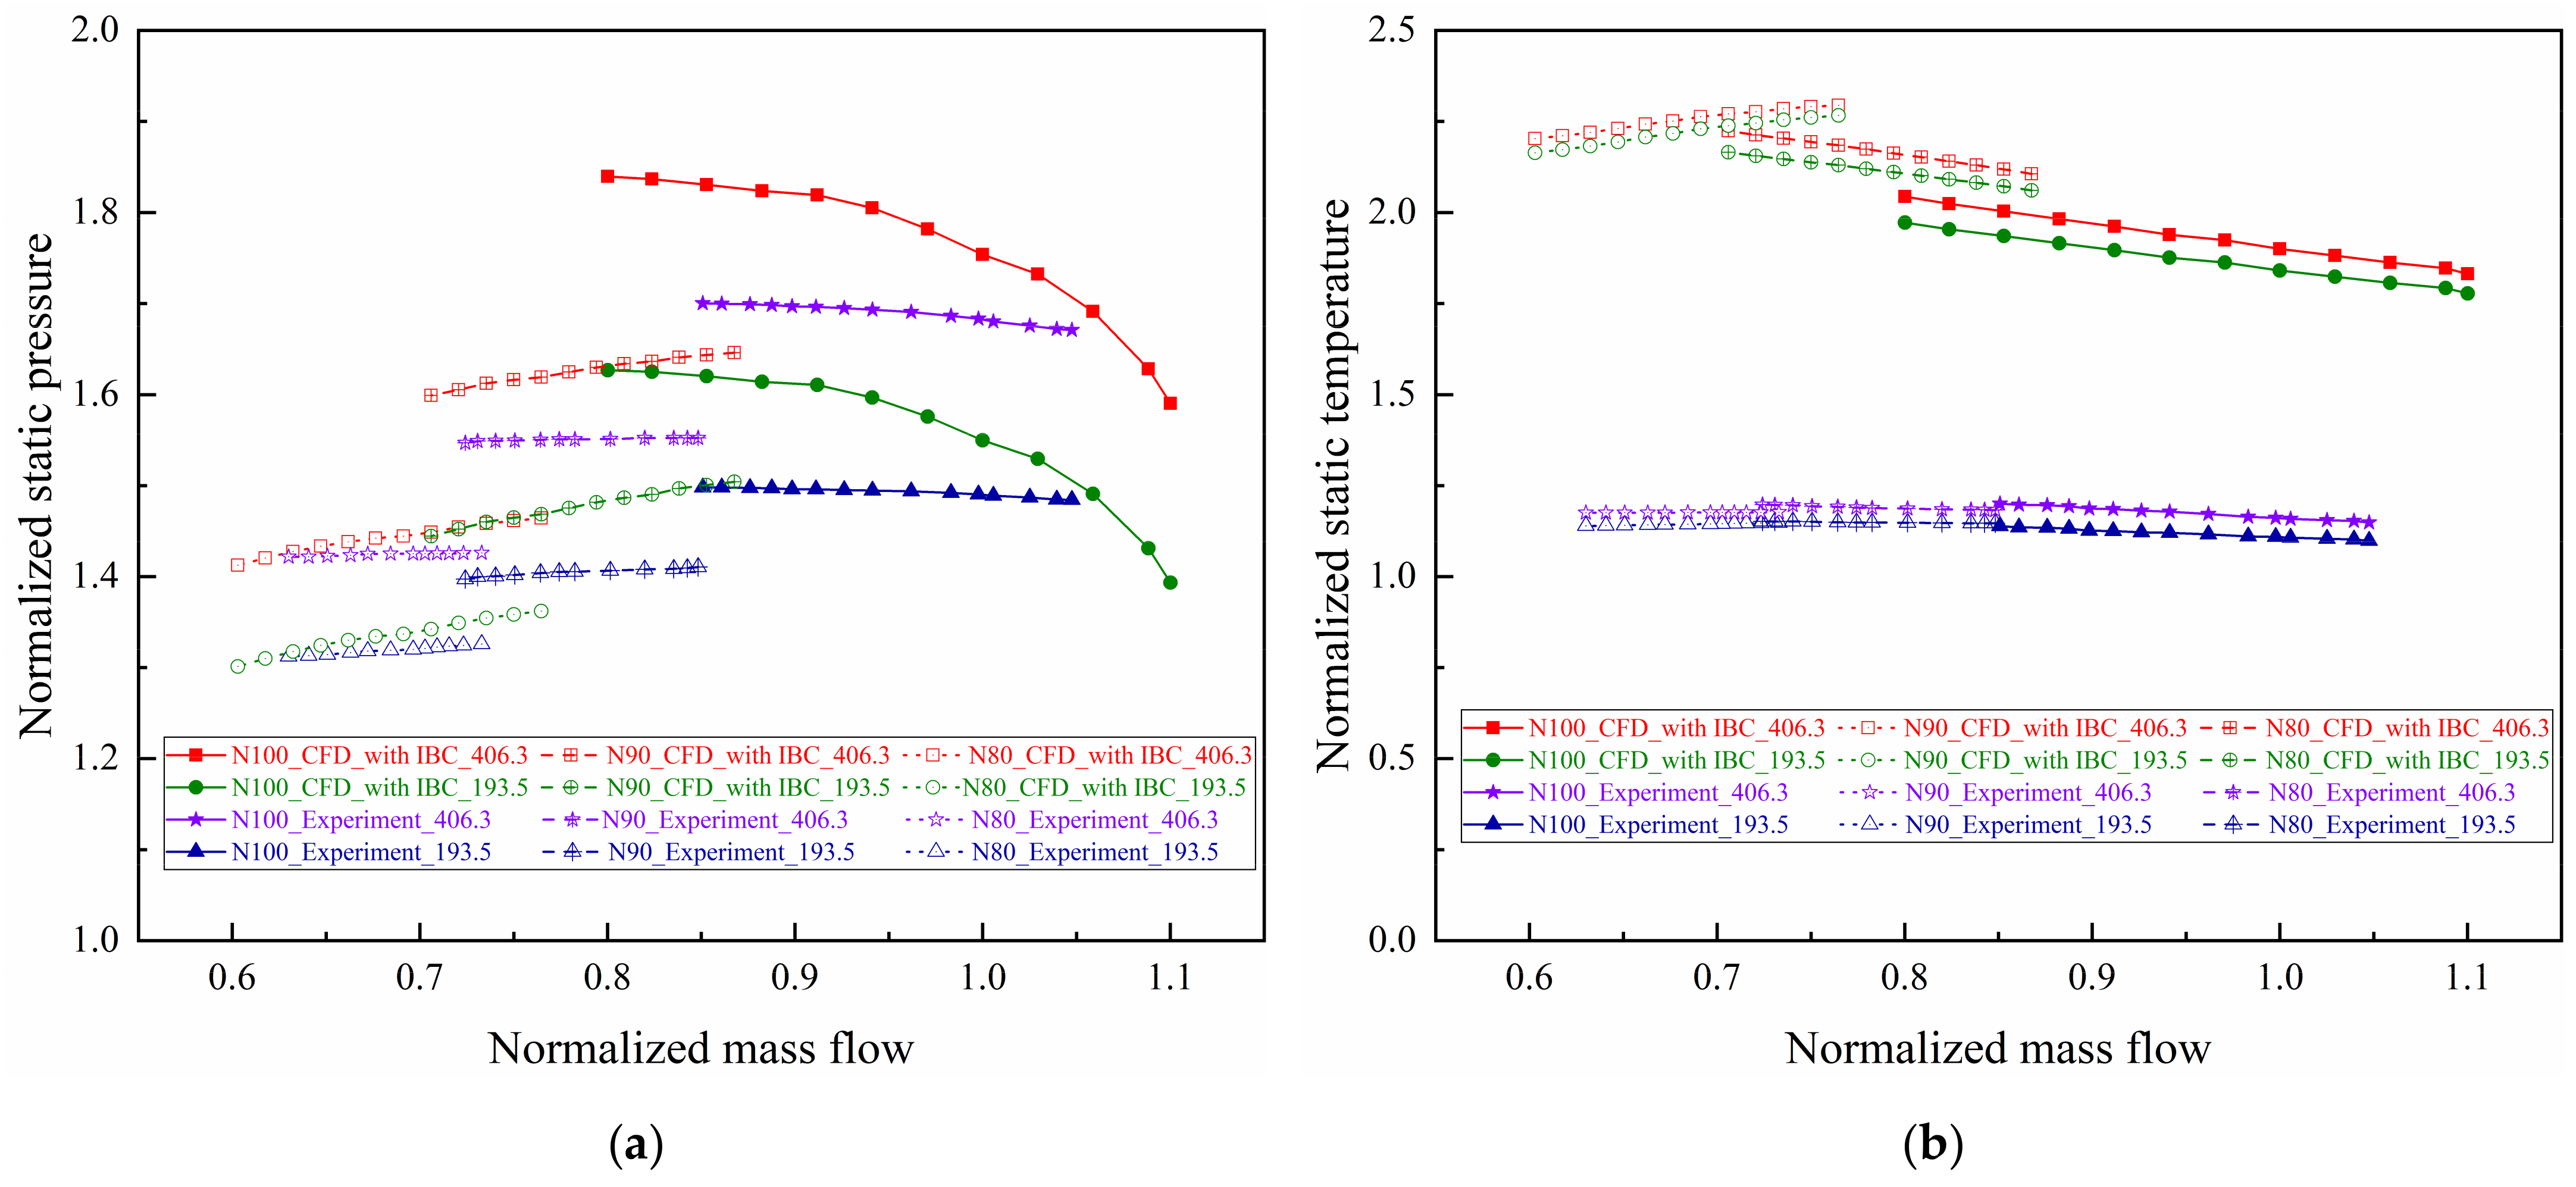
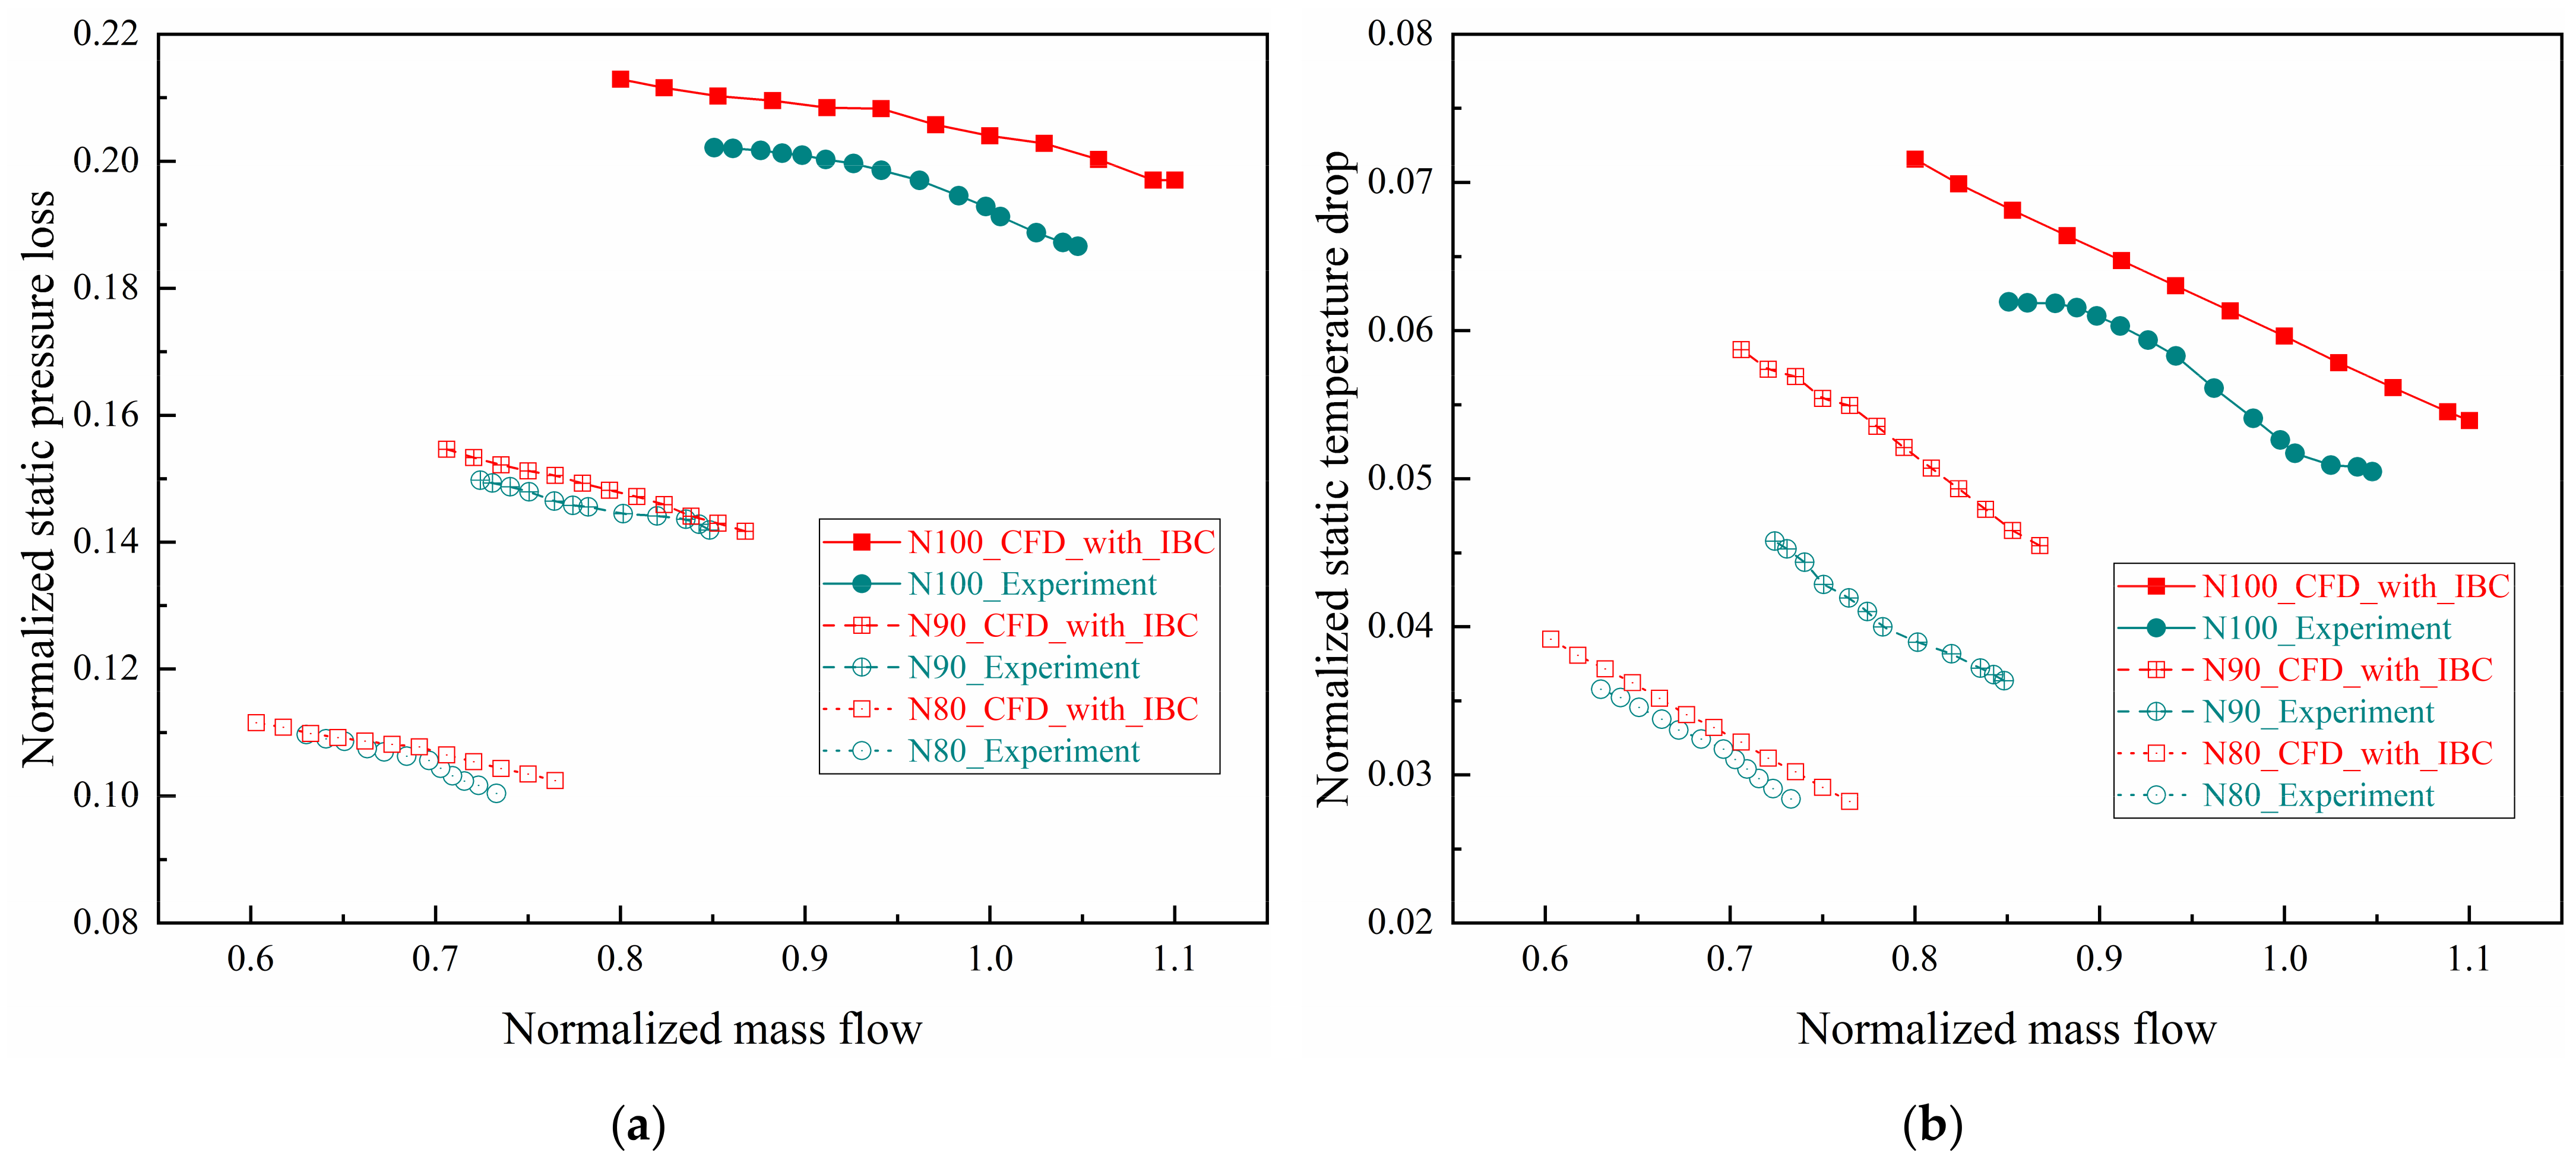
4.2. Aerodynamic Parameters Distributions in IBC

The above section has explained in detail that IBC has an important impact on the coupling characteristics, so it is necessary to study its internal flow field. The flow characteristics of IBC are mainly circular shear flow and radial differential pressure flow. Generally, aerodynamic parameters distributions in IBC are basically the same in the circumferential direction, and there are pressure and temperature gradients in the radial direction. In order to reflect the pressure loss and temperature drop of the cavity leakage flow along the centripetal movement on the static wall of IBC, the measurement value of ps or Ts on the maximum radius 406.3 mm and the minimum radius 193.5 mm are representatively analyzed from Figure 2. The detailed test data analysis of 16 measuring points can refer to the author’s previous research [25], and this article mainly analyzes the pressure loss and temperature drop of the two end points. The numerical results on the same positions in the cavity are also respectively extracted from Figure 3b to compare with the experimental data.
Figure 8 shows the characteristic curves of predicted and measured dimensionless ps and Ts at the maximum radius and the minimum radius on the static wall of IBC under design rotating speed. The experimental or computational dimensionless ps or Ts are the ratios of values of ps or Ts and compressor inlet pt or Tt. The specific mathematical expressions at the two end points are shown in Equations (1) and (2). We can see that the ps and Ts at two points in test or calculation both increase as mainstream flow decreases, but the numerical value of Ts is much higher than the experimental value as a whole. Because there is a varying radial heat flow distribution on the solid wall of the casing in test, resulting in heat transfer effect with the internal flow field in IBC, which is ignored in the simplified calculation using adiabatic boundary conditions.
C p i = p s , i p t , i n ( i = A , H )
C T i = T s , i T t , i n ( i = I , Q )
C p l o s s = p s , l o s s p t , i n ( p s , l o s s = p s , H p s , A )
C T l o s s = T s , l o s s T t , i n ( T s , l o s s = T s , Q T s , I )
Figure 9 shows the characteristic curves of the predicted and measured dimensionless ps loss and Ts drop on the static wall of IBC under design rotating speed. The experimental or computational dimensionless ps loss or Ts drop are the ratios of values of ps or Ts difference between the maximum and minimum radius and the compressor inlet pt or Tt. The specific mathematical expressions are shown in Equations (3) and (4). They essentially reflect the pressure loss and temperature drop of the airflow in the direction of centripetal movement along the decreasing radius, replacing the respective gradient for analysis. It can be seen that the ps loss and Ts drop in the tests and calculations both increase with the decrease of mainstream flow, meaning the radial ps and Ts gradients increase as the flow decreases.

4.3. Effect of Variable Rotating Speeds

When the rotating speed of the impeller changes, the parameters like Reω and β0 will change. Because the mainstream flow, pressure, and temperature of the gas exchange between the impeller outer edge and the cavity will change under variable rotating speeds, resulting in the flow coefficient, pressure, and temperature of the airflow entering the cavity also being different. To study the effect of variable rotating speeds on the internal flow field and aerodynamic parameters of IBC, the investigation needs to be based on the first analysis of coupling characteristics of the compressor and the change of the aerodynamic parameters of mainstream under variable rotating speeds.
The predicted and measured characteristic curves of the aerodynamic performance parameters including PRt, ηis, T and Ps under variable rotating speeds (100% N, 90% N, 80% N) are shown in Figure 10, whose changing law with the flow is almost the same as Figure 4 and Figure 5. As the speed decreases, the range of all characteristic curves moves to the left because of the decrease in flow coefficient, and all prediction and measurement characteristic curves of PRt, T and Ps move downward. Because the volute adopts a constant velocity design, which focuses on the design speed with a large design velocity at each section. At lower speeds, the exhaust flow of volute is smaller with low velocity, resulting in the deterioration of its internal flow and the increase in total pressure loss, meanwhile, the power consumption is reduced. However, the prediction and measurement characteristic curves of ηis move differently with the speed decreases, where the former moves to the upper left, and the latter moves to the lower left. Because this is related to the pipe network characteristics of the actual closed test rig, which is not considered in the numerical calculation. There is a greater pipe resistance loss at lower speeds in experiment, causing the test characteristic curves to move to the lower left. Moreover, the experimental efficiency of the choke point at lower speeds is lower than that at the design speed, and the “efficiency climb line” from the choke point to maximum efficiency point is steeper.
Effects of IBC on predicted aerodynamic performance parameters including PRt, ηis, T and Ps under variable rotating speeds (100% N, 90% N, 80% N) are shown in Figure 11, whose changing law with the flow is also similar to Figure 6. As the speed decreases, all characteristic curves of each parameter deviation move with the movements of their respective experimental values’ characteristic curves, and the common feature is to move in the direction of low flow.
The predicted characteristic curves of axial thrust under variable rotating speeds (100% N, 90% N, 80% N) are shown in Figure 12, whose changing law with the flow is the same as in Figure 7. As the speed decreases, both the magnitude of the front and back thrust is reduced, causing the resultant force to also decrease, whose direction still points to the compressor inlet. To sum up, the magnitude of the total axial thrust decreases as the rotating speed decreases or the mainstream flow increases.
Figure 13 shows the characteristic curves of predicted and measured dimensionless ps and Ts at the maximum radius and the minimum radius on the static wall of IBC under variable rotating speeds (100% N, 90% N, 80% N). From the comparative analysis, it can be seen that the ps and Ts distribution change laws in the tests and calculations are different under variable rotating speeds. On the whole, ps will decrease as the speed decreases, but the law of Ts change is related to the position in the cavity. Because at lower speeds, the mainstream pressure is lower with less gas exchange between IBC and mainstream, and resistance loss along the way increases with the decrease of mainstream flow. The wind resistance temperature rise effect is weakened as the speed decreases which is related to the radius of the location, and the temperature difference between IBC and impeller outlet temperature also decreases, causing the air-cooling effect to be weakened which decreases in the direction of decreasing radius. The changes in the mainstream aerodynamic parameters combine to produce special phenomena in the figure.
Figure 14 shows the characteristic curves of the predicted and measured radial dimensionless ps loss and Ts drop on the static wall of IBC under variable rotating speeds (100% N, 90% N, 80% N), whose changing law with the flow is similar to those in Figure 9. With the decrease of rotating speed, both the ps loss and Ts drop in the tests and calculations decrease in a whole with a tendency to move to the lower left. In short, both the radial ps and Ts gradients in the cavity increase with the decrease of mainstream flow or the increase of rotating speed.

5. Conclusions

Through the comparative analysis of the aerodynamic performances of a centrifugal compressor and the internal flow field in IBC in tests and calculations with IBC or not, which is carried out with different mainstream flows under variable rotating speeds, the results can be highly summarized as follows.
(1) The predicted aerodynamic performances of the coupled calculations with IBC are closer to the measured results than those without IBC under different mainstream flows or variable rotating speeds, which causing the losses of total pressure ratio and isentropic efficiency, and the increase of power consumption, also produce a great influence on the axial thrust (total axial thrust decreases as the flow increases or the speed decreases).
(2) The predicted or measured gradients of radial static pressure and static temperature in the cavity both increase as mainstream flow decreases or rotating speed increases, and their distributions’ changing law with the mainstream flow is distinct under variable rotating speeds on account of the change of the aerodynamic parameters in the gas exchange between IBC and mainstream.

Author Contributions

Conceptualization, Z.L.; methodology, Z.L.; software, Z.L.; validation, Z.L., W.L. and J.S.; formal analysis, Z.L.; data curation, Z.L.; writing—original draft preparation, Z.L.; writing—review and editing, Z.Z. and X.Z. (Xin Zhou); supervision, H.C. and X.Z. (Xuezhi Zhou); funding acquisition, H.C. All authors have read and agreed to the published version of the manuscript.

Funding

The present research was carried out under the support from the International Partnership Program, Bureau of International Cooperation of Chinese Academy of Sciences (182211KYSB20170029), the Guizhou Province Large Scale Physical Energy Storage Technology Research and Development Platform ([2019]4011), the Science and Technology Plan Program of Guizhou Province ([2019]1282).

Institutional Review Board Statement

Not applicable.

Informed Consent Statement

Not applicable.

Data Availability Statement

Not applicable.

Conflicts of Interest

The authors declare no conflict of interest.

Nomenclature

mMass flow (kg/s)
nRotating speed (r/min)
psStatic pressure (Pa)
ptTotal pressure (Pa)
PsShaft power (W)
PRtTotal pressure ratio
TTorque (N·m)
TsStatic temperature (K)
TtTotal temperature (K)
ηisIsentropic efficiency
Greek letter
ηEfficiency
Dimensionless number
CpDimensionless static pressure
CplossDimensionless static pressure loss
CTDimensionless static temperature
CTlossDimensionless static temperature loss
CwDimensionless mass flow
GGap ratio
GrGrashof number
ReωRotational Reynolds number
RezAxial Reynolds number
β0Inlet swirl ratio
λTTurbulent flow parameter
Subscript
iMarked measuring point
inCompressor inlet
isIsentropic
sStatic state or Shaft
tStagnation state
Abbreviation
AIGVsAdjustable Inlet Guide Vanes
ATAxial Thrust
AVDsAdjustable Vaned Diffusers
CAESCompressed Air Energy Storage
IBCImpeller Backside Cavity

References

  1. Chen, H.; Cong, T.N.; Yang, W.; Tan, C.; Li, Y.; Ding, Y. Progress in electrical energy storage system: A critical review. Prog. Nat. Sci. 2009, 19, 291–312. [Google Scholar] [CrossRef]
  2. Sun, Z.; Tan, C.; Zhang, D. Flow Field Structures of the Impeller Backside Cavity and Its Influences on the Centrifugal Compressor; ASME Paper No. GT2009-59879; American Society of Mechanical Engineers: New York, NY, USA, 2009. [Google Scholar]
  3. Guidotti, E.; Toni, L.; Rubino, D.; Tapinassi, L.; Naldi, G.; Koyyalamudi, V.V.N.K.S.; Prasad, S. Influence of Cavity Flows Modeling on Centrifugal Compressor Stages Performance Prediction across Different Flow Coefficient Impellers; ASME Paper No. GT2014-25830; American Society of Mechanical Engineers: New York, NY, USA, 2014. [Google Scholar]
  4. Jyothishkumar, V.; Mihaescu, M.; Semlitsch, B.; Fuchs, L. Numerical flow analysis in centrifugal compressor near surge condition. In Proceedings of the 43rd Aiaa Fluid Dynamics Conference, San Diego, CA, USA, 24–27 June 2013. [Google Scholar]
  5. Owen, J.M.; Pincombe, J.R. Vortex breakdown in a rotating cylindrical cavity. J. Fluid Mech. 1979, 90, 109–127. [Google Scholar] [CrossRef]
  6. Farthing, P.R.; Long, G.A.; Owen, J.M.; Pincombe, J.R. Rotating cavity with axial throughflow of cooling air: Flow structure. J. Turbomach. 1992, 114, 237–246. [Google Scholar] [CrossRef]
  7. Gantar, M.; Florjancic, D.; Sirok, B. Hydraulic axial thrust in multistage pumps-origins and solutions. J. Fluids Eng. 2002, 124, 336–341. [Google Scholar] [CrossRef]
  8. Zeng, Y.; Liu, J. Investigations on Three-Dimensional Coupled Flow of Secondary Air System and Main Flow Passages in a Micro Gas Turbine; ASME Paper No. GT2014-26582; American Society of Mechanical Engineers: New York, NY, USA, 2014. [Google Scholar]
  9. Dong, W.; Chu, W. Numerical investigation of the fluid flow characteristics in the hub plate crown of a centrifugal pump. Chin. J. Mech. Eng. 2018, 31, 64. [Google Scholar] [CrossRef] [Green Version]
  10. Qin, R.; Sun, Y.; Wang, S.; Ju, Y.; Zhang, C. Flow structure in impeller backside cavity and its effect on aerodynamic performance of the centrifugal compressor. Chin. J. Eng. Thermophys. 2016, 37, 2349–2354. [Google Scholar]
  11. Li, C.; Ji, C.; Shi, M.; Sun, Q. Influence of rotor–stator component partition structure on the aerodynamic performance of centrifugal compressors. Eng. Appl. Comput. Fluid Mech. 2019, 13, 1080–1094. [Google Scholar] [CrossRef] [Green Version]
  12. Liu, G.; Du, Q.; Liu, J.; Wang, P.; Wang, R.; Lian, Z. Computational investigation of flow control methods in the impeller rear cavity. Int. J. Aerosp. Eng. 2020, 2020, 2187975. [Google Scholar] [CrossRef]
  13. Qiao, B.; Ju, Y.; Zhang, C. Numerical investigation on labyrinth seal leakage flow and its effects on aerodynamic performance for a multistage centrifugal compressor. J. Fluids Eng. 2018, 141, 071107. [Google Scholar] [CrossRef]
  14. Hazby, H.; Casey, M.; Březina, L. Effect of leakage flows on the performance of a family of inline centrifugal compressors. J. Turbomach. 2019, 141, 18–1347. [Google Scholar] [CrossRef]
  15. Pitz, D.B.; Chew, J.W.; Marxen, O. Effect of an axial throughflow on buoyancy-induced flow in a rotating cavity. Int. J. Heat Fluid Flow 2019, 80, 108468. [Google Scholar] [CrossRef]
  16. Haaser, F.; Jack, J.; McGreehan, W. Windage rise and flowpath gas ingestion in turbine rim cavities. J. Eng. Gas Turbines Power 1988, 110, 78–85. [Google Scholar] [CrossRef]
  17. Farthing, P.R.; Long, G.A.; Owen, J.M.; Pincombe, J.R. Rotating cavity with axial throughflow of cooling air: Heat transfer. J. Turbomach. 1992, 114, 229–236. [Google Scholar] [CrossRef]
  18. Alexiou, A.; Hills, N.J.; Long, C.A.; Turner, A.; Millward, J. Heat transfer in high-pressure compressor gas turbine internal air systems: A rotating disc-cone cavity with axial throughflow. Exp. Heat Transf. 2000, 13, 299–328. [Google Scholar] [CrossRef]
  19. Young, C.; Sonwsill, G.D. CFD optimization of cooling air offtake passages within rotor cavities. J. Fluid Mech. 2003, 125, 380–386. [Google Scholar] [CrossRef]
  20. Owen, J.M.; Powell, J. Buoyancy-induced flow in a heated rotating cavity. J. Eng. Gas Turbines Power 2006, 128, 128–134. [Google Scholar] [CrossRef]
  21. Coren, D.; Childs, P.R.N.; Long, C.A. Windage sources in smooth-walled rotating disc systems. Proc. Inst. Mech. Eng. Part C J. Mech. Eng. Sci. 2009, 223, 873–888. [Google Scholar] [CrossRef] [Green Version]
  22. Luo, X.; Zhang, D.; Tao, Z.; Xu, G.; Wang, Q. Windage measurements in a rotor-stator system with superimposed cooling and rotor-mounted protrusions. J. Eng. Gas. Turb Power 2014, 136, 80. [Google Scholar] [CrossRef]
  23. Tao, Z.; Zhang, D.; Luo, X.; Xu, G.; Han, J. Windage heating in a shrouded rotor-stator system. J. Eng. Gas Turb Power 2014, 136, 0626021–6260210. [Google Scholar] [CrossRef]
  24. Antinori, G.; Arsenyev, I.; Fischersworring-Bunk, A. Robust Design Optimization of a Low Pressure Turbine Rotor Discs Secondary Air System; ASME Paper No. GT2017-63289; American Society of Mechanical Engineers: New York, NY, USA, 2017. [Google Scholar]
  25. Lin, Z.; Zuo, Z.; Guo, W.; Sun, J.; Liang, Q.; Chen, H. Experimental study on effects of adjustable vaned diffusers on impeller backside cavity of centrifugal compressor in CAES. Energies 2021, 14, 6187. [Google Scholar] [CrossRef]
  26. ASME. Test Uncertain. In PTC 19.1-2018; American Society of Mechanical Engineers: New York, NY, USA, 2019; Available online: https://www.asme.org/codes-standards/find-codes-standards/ptc-19-1-test-uncertainty (accessed on 12 June 2020).
  27. Menter, F.R. Two-equation eddy-viscosity turbulence models for engineering applications. AIAA J. 1994, 32, 1598–1605. [Google Scholar] [CrossRef] [Green Version]
Figure 1. Geometric structure and site map of the research object.
Energies 15 00420 g001
Figure 2. Measuring points and measurement sites of IBC.
Energies 15 00420 g002
Figure 3. Two groups of computational domains: (a) all mainstream domains without IBC; (b) all mainstream domains with IBC.
Energies 15 00420 g003
Figure 4. Predicted and measured aerodynamic performance parameters under design rotating speed: (a) total pressure ratio; (b) isentropic efficiency.
Energies 15 00420 g004
Figure 5. Predicted and measured power consumption under design rotating speed.
Energies 15 00420 g005
Figure 6. Effects of IBC on predicted aerodynamic performance parameters under design rotating speed: (a) PRt and ηis; (b) T and ps.
Energies 15 00420 g006
Figure 7. Predicted axial thrust under design rotating speed.
Energies 15 00420 g007
Figure 8. Predicted and measured static pressure and static temperature on the static wall of IBC under design rotating speed: (a) Static pressure; (b) Static temperature.
Energies 15 00420 g008
Figure 9. Predicted and measured radial ps loss and Ts drop of IBC under design rotating speed: (a) static pressure loss; (b) static temperature drop.
Energies 15 00420 g009
Figure 10. Predicted and measured aerodynamic performance parameters under variable rotating speeds: (a) total pressure ratio; (b) isentropic efficiency; (c) torque; (d) shaft power.
Energies 15 00420 g010aEnergies 15 00420 g010bEnergies 15 00420 g010c
Figure 11. Effects of IBC on predicted aerodynamic performance parameters under variable rotating speeds: (a) PRt and ηis; (b) T and Ps.
Energies 15 00420 g011
Figure 12. Predicted axial thrust under variable rotating speeds.
Energies 15 00420 g012
Figure 13. Predicted and measured static pressure and static temperature on the static wall of IBC under variable rotating speeds: (a) static pressure; (b) static temperature.
Energies 15 00420 g013
Figure 14. Predicted and measured radial ps loss and Ts drop of IBC under variable rotating speeds: (a) static pressure loss; (b) static temperature drop.
Energies 15 00420 g014
Table 1. Main structural parameters of mainstream components.
Mainstream ComponentsNumber of BladesTip ClearanceBlade Inlet RadiusInlet Installation AngleInlet Vane SpanBlade Outlet RadiusOutlet Installation AngleOutlet Vane Span
Impeller131.17 mm294.4 mm30°190.0 mm417.5 mm60°65.9 mm
AVDs11-466.2 mm27°55.4 mm564.3 mm31°55.4 mm
IGVsNumber of BladesTip ClearanceChannel RadiusBlade HeightHollow Radius
125 mm294.5 mm264.5 mm25 mm
VoluteInterface Entrance WidthInlet Circumference RadiusDiffuser Tube Inlet RadiusDiffuser Tube Outlet RadiusDiffuser Tube Length
55.4 mm720 mm656 mm946 mm1700 mm
Table 2. Uncertainties of some major sensors.
Sensor NameUncertainty
Total pressure probe comb±0.05% FS
WRN thermocouple total temperature probe comb±(0.15 + 0.004|t|)
UNIK5000 pressure sensor±0.04% FS BSL
WZPK thermal resistance PT100±(0.15 + 0.002|t|)
Flow sensor±1.5%
Speed sensor±0.05% FS ± 1 r/min
Torque sensor±0.3%
Static pressure sensor of IBC±0.05% FS
Static temperature sensor of IBC±0.1% FS
Publisher’s Note: MDPI stays neutral with regard to jurisdictional claims in published maps and institutional affiliations.

