Article

Energy and Economic Balance between Manure Stored and Used as a Substrate for Biogas Production

by
Jakub Mazurkiewicz
Ecotechnologies Laboratory, Department of Biosystems Engineering, Poznań University of Life Sciences, Wojska Polskiego 50, 60-627 Poznań, Poland
Energies 2022, 15(2), 413; https://doi.org/10.3390/en15020413
Submission received: 29 October 2021 / Revised: 26 November 2021 / Accepted: 13 December 2021 / Published: 6 January 2022

Abstract

:
The aim of the study is to draw attention to the fact that reducing methane and nitrous oxide emissions as a result of traditional manure storage for several months in a pile is not only a non-ecological solution, but also unprofitable. A solution that combines both aspects—environmental and financial—is the use of manure as a substrate for a biogas plant, but immediately—directly after its removal from the dairy barn. As part of the case study, the energy and economic balance of a model farm with dairy farming for the scenario without biogas plant and with a biogas plant using manure as the main substrate in methane fermentation processes was also performed. Research data on the average emission of ammonia and nitrous oxide from 1 Mg of stored manure as well as the results of laboratory tests on the yield of biogas from dairy cows manure were obtained on the basis of samples taken from the farm being a case study. The use of a biogas installation would allow the emission of carbon dioxide equivalent to be reduced by up to 100 Mg per year. In addition, it has been shown that the estimated payback period for biogas installations is less than 5 years, and with the current trend of increasing energy prices, it may be even shorter—up to 4 years.

1. Introduction

Global biomass harvested worldwide mostly ends up in the livestock subsystem as feed or bedding material (almost 60%) [1]. Reducing greenhouse gas (GHG) emissions is currently one of the biggest challenges for the livestock industry in terms of climate change. Using the life-cycle approach, it has been estimated that livestock accounts for approx. 14.5% to 16.5% of the world’s anthropogenic GHG emissions, with dairy production accounting for about 20% of this value [2,3,4]. The problem is, however, quite complicated because it requires the simultaneous provision of sufficient food for more and more people in the world, and on the other hand, not so much as not increasing, but even reducing the environmental burden associated with food production [5].
Dairy farms are a major contributor to the total life cycle greenhouse gas emissions of milk and other dairy products. About 70–85% of the GHG emissions occurred in the processes preceding the milk leaving the farm, i.e., cradle-to-farm gate emissions [6,7]. This means that already proper management inside the dairy farm can significantly reduce greenhouse gas emissions.
Methane is a gas whose emissions from animals are mainly related to enteric fermentation and the storage of manure without adequate protection, is a gas that contributes 25–28 times more to global warming than carbon dioxide (CO2) [8,9,10]. Nitrous oxide (N2O), resulting from the improper storage of manure and the use of various types of fertilizers, it is a compound whose negative impact on climate change is 265–298 times higher than CO2 [5,8,9,10]. Carbon dioxide equivalent is the standard unit used to calculate the global warming potential [11]. It is estimated that the mere use of manure for fertilization to obtain animal feed and leaving the manure on pastures contributes to the production of N2O in such an amount that it can account for about half of the total global imissions. [3]. Reducing direct nitrous oxide emissions during storage may result in more significant nitrate leaching and ammonia volatilization during field use.
The overall impact of changing the feed source on the total greenhouse gas emissions of a farm is not clear-cut. For example, elements of undigested feed may generate emissions at a later stage (e.g., during storage [12,13]), or planting a given type of feed may reduce GHG from agriculture by sequestering CO2 in agricultural soils [6,14]. Changes in soil carbon content and their impact on GHG emissions (and carbon footprint) are currently not sufficiently defined, mainly due to the lack of a uniform methodology and the high complexity of the various cultivation processes [2].
While the impact of feed or appropriate cultivation emissions is complex, and the effect on the carbon and economic footprint is difficult to predict, even averaged calculations for proper manure management show much better results. There are indications in the literature [15] that emissions of gases from animal production, such as CH4, N2O and NH3, come largely from the storage of manure, which is a common practice in livestock farms. In addition, such storage of manure not only has a negative impact on the environment, but also leads to a loss of manure quality as a source of nutrients. Such a situation causes a decrease in the value of manure as a soil enrichment substance, which is also associated with a decrease in its price [16].
In this article, on the basis of a farm in Poland (similar to others in east Europe, above 61% [17]), the differences in the emission of CH4, N2O in the traditional manner of its storage and using it immediately as a substrate for biogas production are presented.
In the 2015/2016 agricultural season, approximately 674 thous. farmers used natural fertilizers, of which 662 thous. used manure, and 116 thous. slurry. This corresponds to the proportion of solid and liquid livestock keeping systems in which constants predominate [18]. This means that the emissions of CH4 alone from manure heaps could be over 0.5 million Mg per year.
The origination mechanism is related to the usual practices for forming solid manure piles. Most often, this fertilizer is spread, and then piles are formed. Commonly, their compressing is not performed—as is the case, for example, when forming piles of chopped fresh maize for silage. As a consequence, the oxygen present in the manure is used by the microorganisms to decompose the organic matter and generate heat [19]. The possible temperature inside such a prism is even 40–60 °C, which can be reached in several dozen hours. During the period, the oxygen contained inside the heap is used up, which creates conditions for the anaerobic decomposition of organic matter. During this process, bacteria emit energy no longer in the form of heat (as is the case with aerobic decomposition), but in the form of a chemical—methane. Such conditions are characteristic of those prevailing in typical biogas reactors [20]. On the other hand, nitrous oxide increases especially when no methane formation is observed (possibly its level is very low). It is formed as a result of changes (nitrification and denitrification) of nitrogen present in manure. This mainly concerns organic forms (e.g., protein) and, to a much lesser extent, inorganic forms (e.g., NH3 and NH4+), from which, with the participation of oxygen, nitrites and then nitrates are formed. In contrast, denitrification takes place anaerobic conditions where nitrates are converted to N2O and N2 [21]. The pH significantly influences on the balance between ammonium and ammonia, with the level of ammonia increases as the pH increases.
The share of manure in GHG depends mainly on the chemical composition of the manure (and therefore primarily on the feed) and on the storage conditions. One of the main factors predicting of CH4 emissions from manure is volatile solids content [22], and in the case of the N2O emissions is nitrogen content of excreta [5]. If manure were to be used as a substrate or co-substrate in anaerobic digestion processes, the higher content of organic matter (OM) in its composition results in higher biogas production. In anaerobic digestion processes, the substrate is transformed into CH4, which can be used as a renewable energy source [23,24].
Poland is currently one of the largest producers of manure in the EU. As demonstrated by Kozłowski [25], in Poland, over 112 million Mg of manure is produced annually, and only less than 1% is used to produce biogas. This is a surprisingly small amount, as the digestate is quite often used in crops, mainly due to its rich elemental composition, i.e., nitrogen, potassium and phosphorus [26,27]. It has been proven in many cultivation studies that the addition of digestate to the soil has a positive effect on the quality of crops [26,28,29,30,31,32]. Apart from providing plants with nutrients, it has been noticed that the use of digestate inhibits the growth of harmful insects and plant pathogens (i.e., bacteria and fungi) [33]. The effect of using digestates in crops is their greater resistance to various diseases, which was found on the basis of many years of research with the participation of farmers [26,34]. Alternatively, the digestate could also be used as solid biofuels, e.g., as pellets. Then its calorific value is similar to that of biofuels made from sawdust [35].
The paper presents how the emission of methane and nitrous oxide will change if, instead of its traditional storage for several months, solid manure is immediately used for energy purposes in a biogas plant. Energy and economic calculations were made for a real farm with dairy cattle breeding. Two basic scenarios were developed without a biogas plant and with a biogas plant using solid manure (and manure with addition of straw) as a substrate for anaerobic digestion processes. This approach is recommended in the Strategic Plan for Poland—common agricultural policy (CAP) reform [36] and is consistent with the EU climate change mitigation framework, which includes, inter alia, the carbon dioxide emissions trading system.
For the calculation of gaseous emissions, research data were used to determine the average emission of methane and nitrous oxide from 1 Mg of stored manure and the laboratory studies on the biogas efficiency on manure from dairy cows collected from a farm which is a case study.

2. Materials and Methods

The energy and economic calculations presented in the paper were based on data from an average farm with dairy cows in Poland. It was chosen because of the characteristic size for which until now it seemed unreasonable to use methane fermentation to recover energy (heat and electricity) and the potential ecological benefits in the form of a significant reduction in CO2 equivalent production.
The presented case study concerns one of the Experimental Farms of the Poznań University of Life Sciences (Poland)—in Brody. On the area of approx. 900 ha, there is approx. 500 ha of commercial area and approx. 400 ha of forage area, as well as 600 cattle and 900 sheep. The breeds are adapted to the difficult environment (wet and periodically flooded areas). Despite such unfavorable conditions, manure is still piled up here due to the lack of appropriate investments. The estimated calculations presented in the paper can be used to plan appropriate solutions for this and similar farms in Central and Eastern Europe.
The basic cattle feeding system is the feed in the barn. Overall, GHG emissions are higher from the manure into the barn feed subsystem compared to the grazing feed subsystem [37]. Within the feed subsystem, cattle are kept indoors and eat mainly preserved grass silage. The manure produced by the cattle in the barn feed subsystem and other waste is stored and mechanically returned to the soil when field conditions are right in spring and early summer.
Greenhouse gas emissions from the dairy farming system can be distinguished between those that arise within the physical boundaries of the dairy farm (GHG emissions on the farm) and those that arise before the dairy farm section (indirect GHG emissions). The main sources of greenhouse gas emissions on the farm are cultivated soil, enteric fermentation, manure management, and energy consumption [38,39].
This work focuses on manure management, so far not treated as a source of heat, electricity, and income related to the reduction of carbon dioxide equivalent emissions.
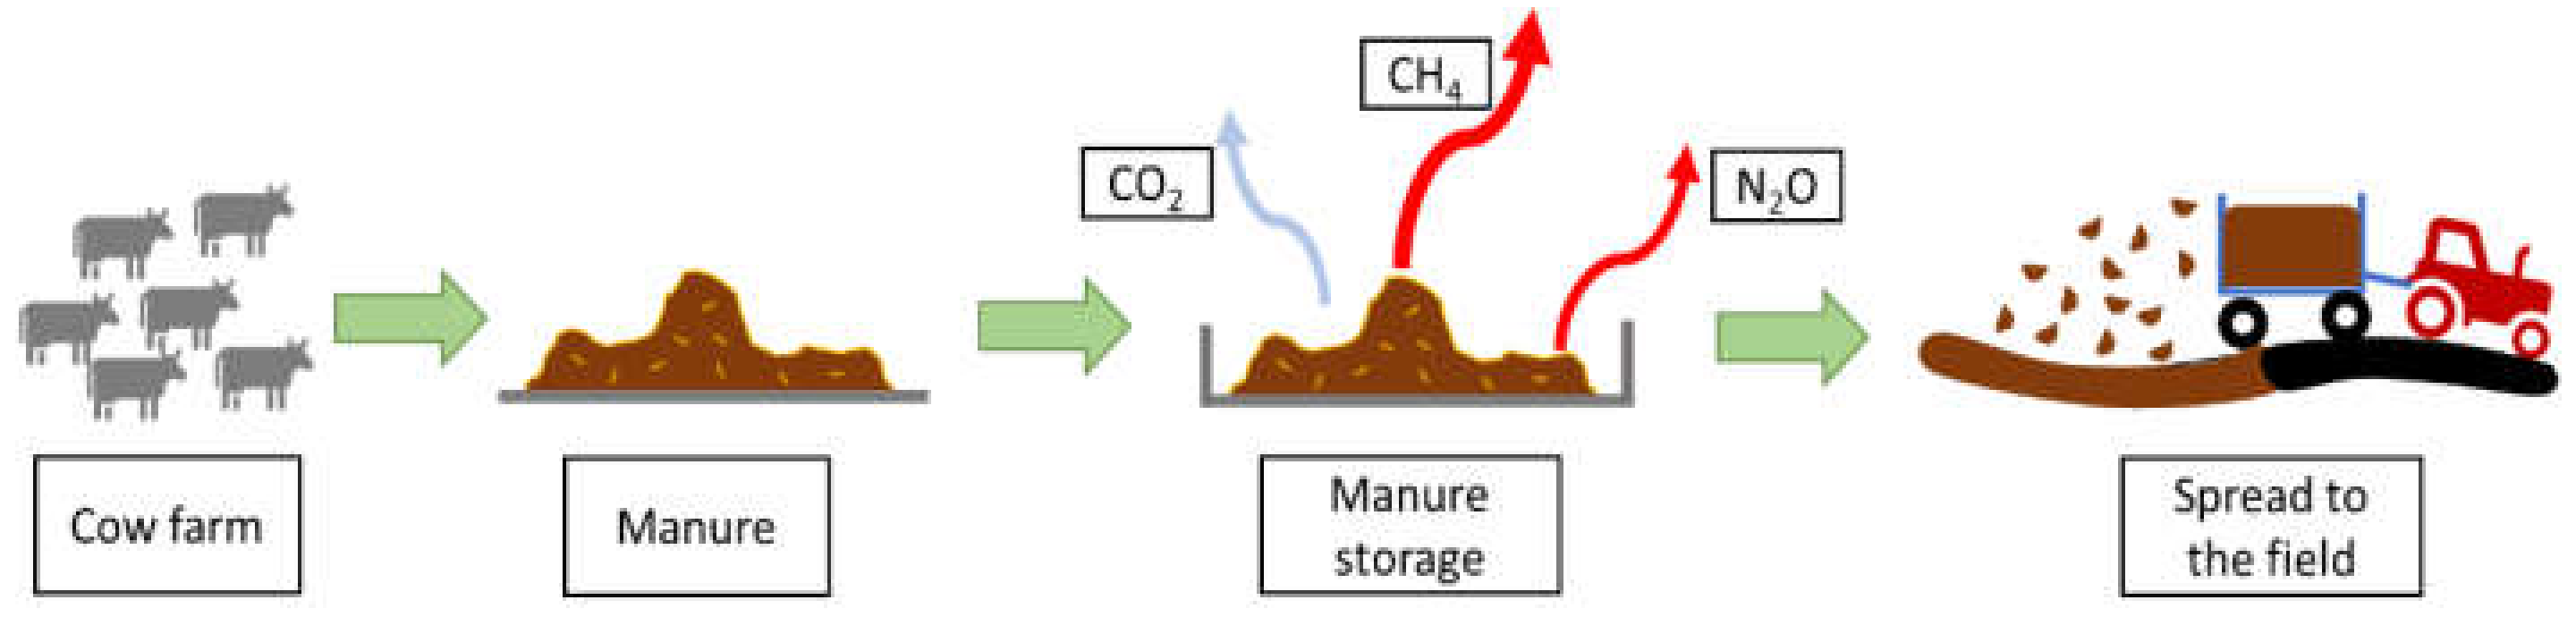
Two scenarios were considered:
I—storage the manure on the stockpile, and then scattering them on the field (high GHG emissions), Figure 1.
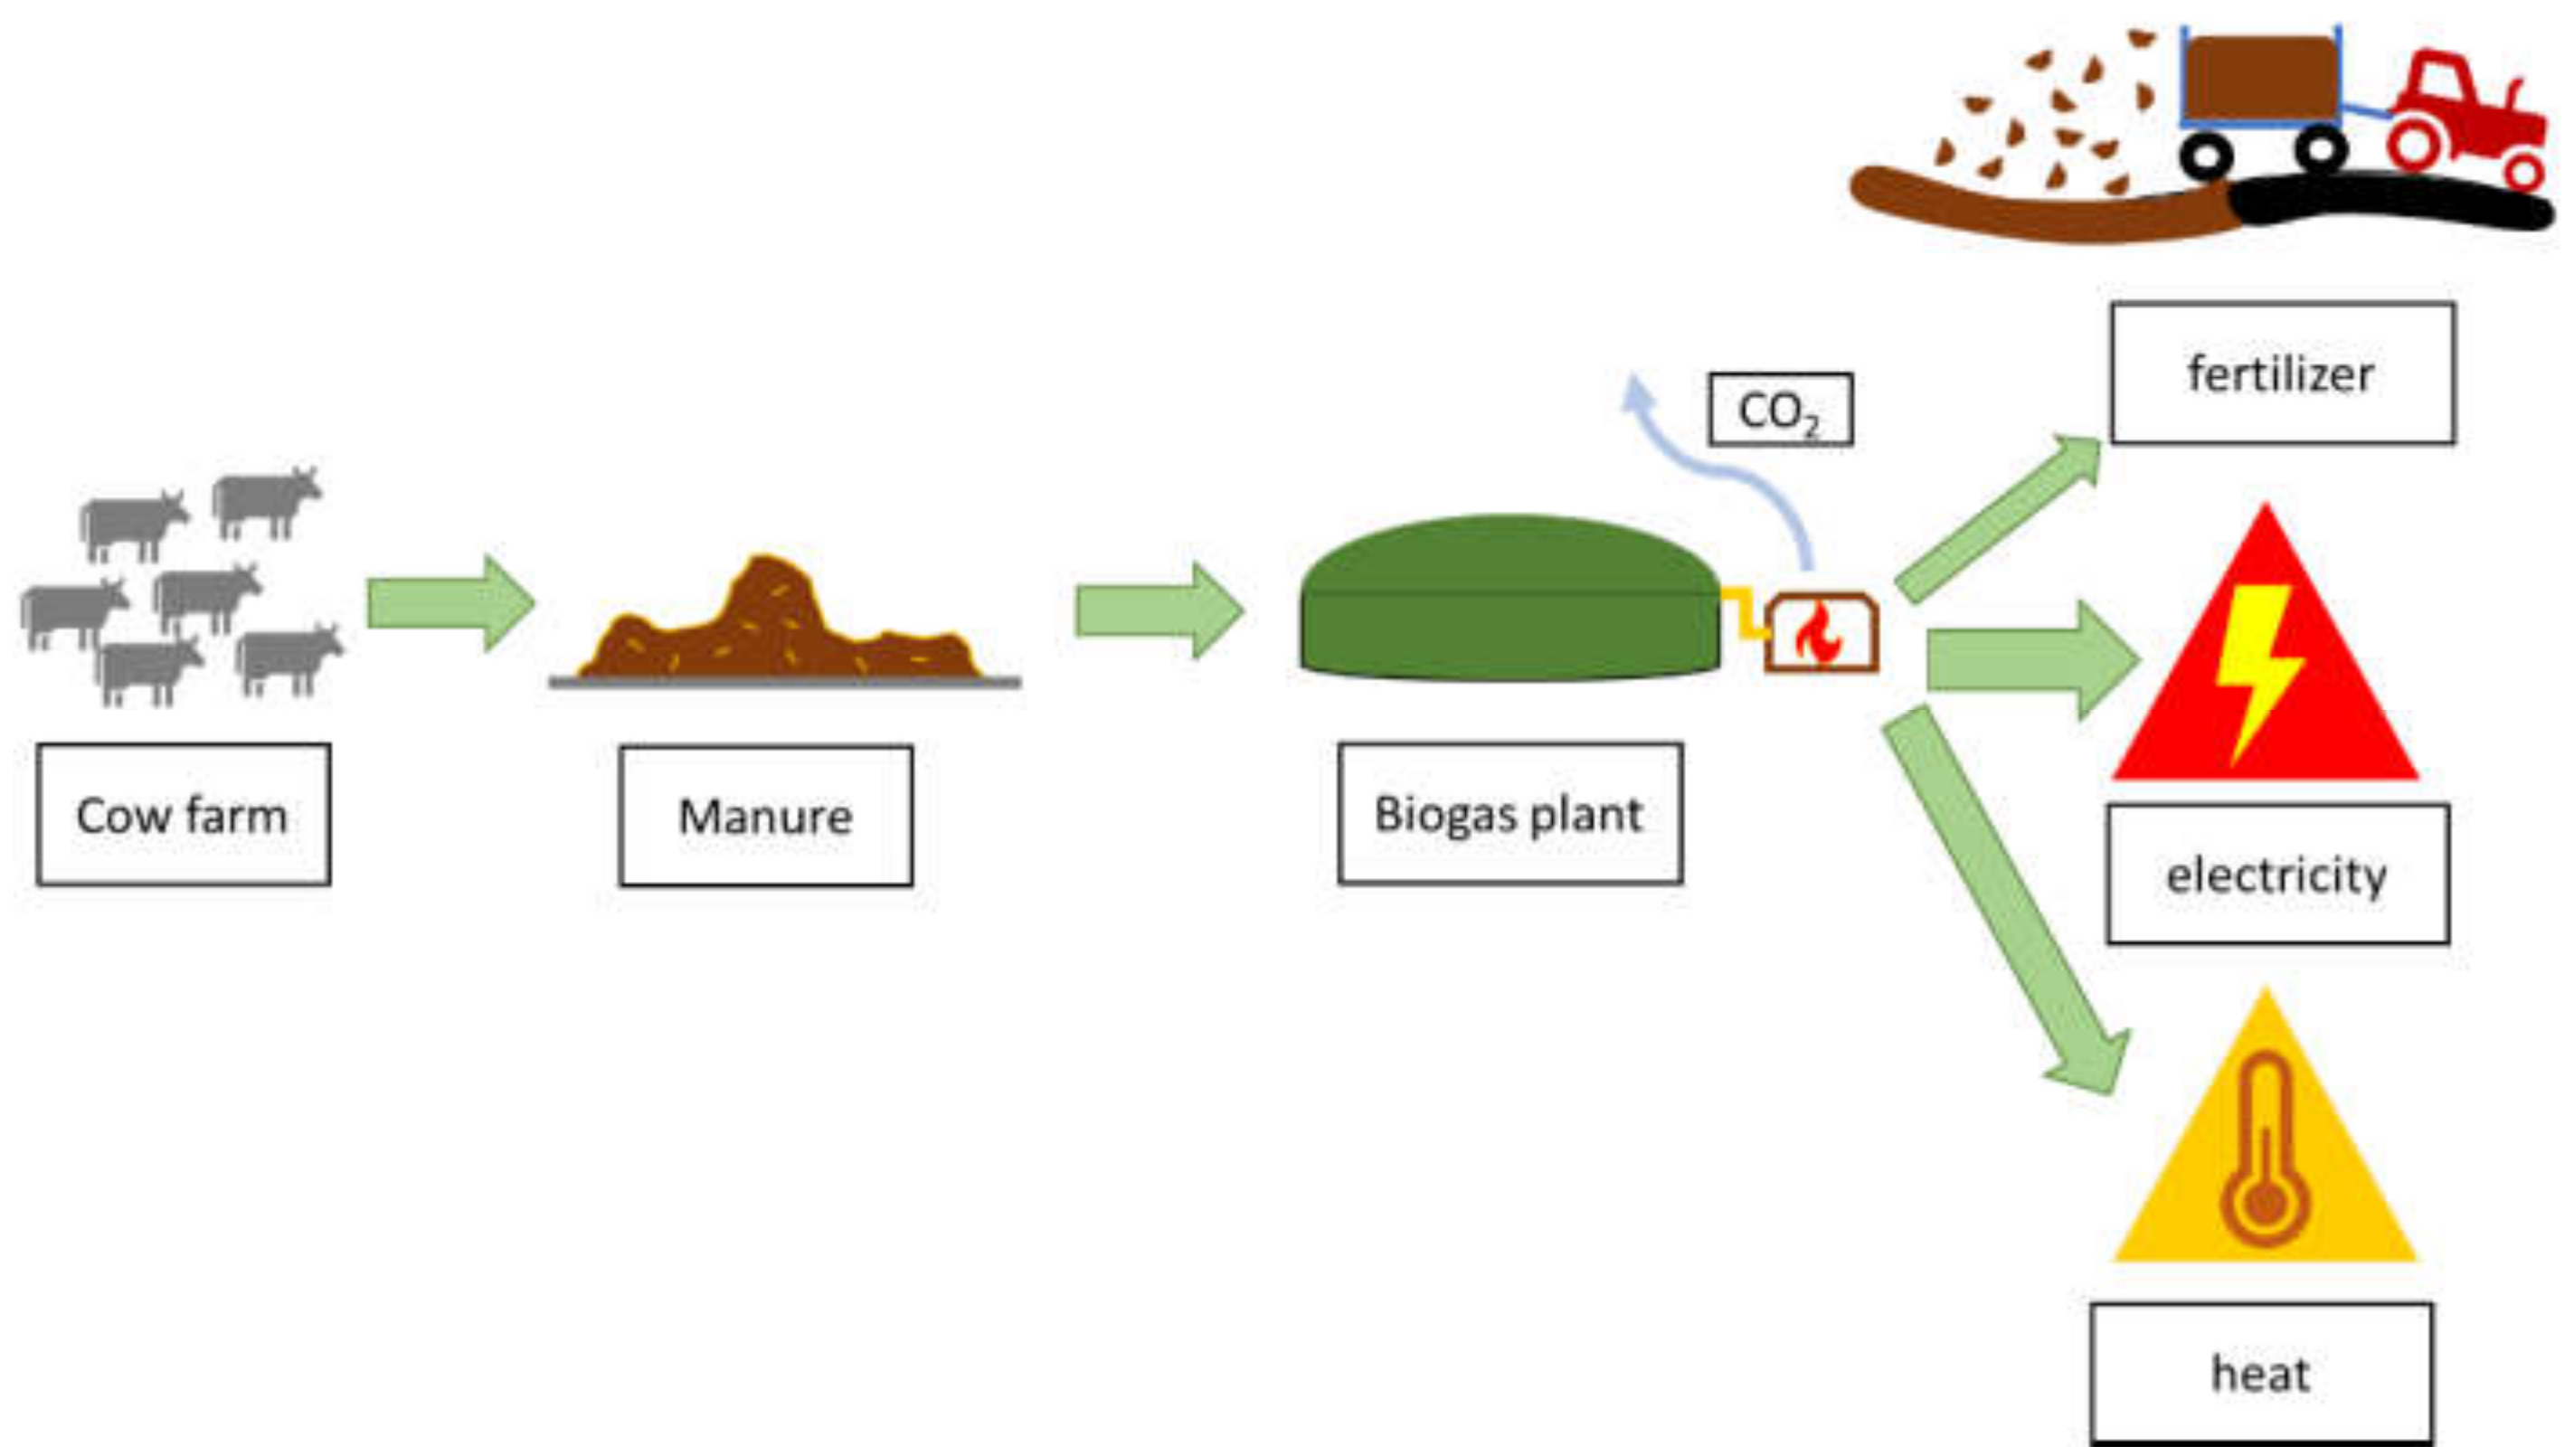
II—anaerobic digestion of solid manure, the field spreading of digestate (almost no GHG emissions, large revenues from electricity, heat and, savings from charges for CO2 equivalent emissions), Figure 2.

2.1. Estimation of CH4 Emissions from Manure Management

The Tier 2 methodology was used to establish domestic CH4 emission factors for cattle [41]:
EF = VS · D/Y · BO · CF · MCF · MS
where:
  • EF—emission factor,
  • VS—average daily volatile excreted solids,
  • D/Y—the number of days taken for the calculation during the year,
  • BO—maximum CH4 production capacity for manure produced by animal,
  • CF—conversion factor from kg to m3,
  • MCF—methane conversion factors for each manure management system for cool climate [42],
  • MS—a fraction of livestock category manure.
For cattle, volatile solids (VS) and maximum CH4 producing capacity (BO) were estimated based on equations in 2019 and 2006 IPCC [41,42] and Poland’s national inventory report 2021 [10].
Above mentioned parameters and emission factors used for the calculation of CH4 emissions from manure management for livestock are shown in Table 1.
Methane conversion factor (MFC)—2%, for solid systems was taken from Table 10.17 of the IPCC 2006 Guidelines for cool climate ≤10 °C [41]. Due to calculations only for dairy cattle solid manure, MS—a fraction of livestock category manure was 100%.
Methane combusted in biogas plants, including agricultural biogas plants, is classified as eco-energy. The separation of methane emissions from anaerobic digesters based, in particular on animal faeces, is under investigation [10]. The IPCC 2006 guidelines contain an ambiguous methodology for anaerobic digesters where the MCF for anaerobic digesters is not specified and ranges from 0 to 100%.

2.2. Estimation of Direct N2O Emissions from Manure Management

Direct nitrous oxide emissions from manure management were estimated based on recommended IPCC methodology [41] using the same MS data as for CH4 emissions:
N2OD(mm) = Nex · MS · EF3 · CFN
where:
  • N2OD(mm)—direct N2O emissions from manure management in the country (kg N2O/animal/year),
  • Nex—annual average N excretion per head of livestock,
  • MS—fraction of total annual nitrogen excretion for dairy cow managed in solid manure management system,
  • EF3—emission factor for direct N2O emissions from solid manure management system,
  • CFN—conversion of (N2O−N) (mm) emissions to N2O (mm) emissions, 44/28
The parameters for Nex cattle were based on the IPCC methodology [41], but for calculation, data from national studies were taken, such as the crude protein content in the diet was adopted according to national research [43,44].
Above mentioned parameters and emission factors used for calculation of N2O emissions from manure management for livestock are shown in Table 2.
Based on default animal mass, Nex values for cattle category, were chosen—70.26 kg N/animal [41]. The fraction of N consumption which is retained by the animal (Nretention) was taken according to the IPCC guidelines [41], for dairy cows, it is 0.2. Due to calculations only for dairy cattle solid manure MS—a fraction of livestock category manure was 100%.

2.3. Calcultion of CO2 Equivalents and Carbon Emissions Allowances Prices

Emissions of each gas (CH4 and N2O) were converted to CO2eq emissions based on the global warming potential (GWP) conversion factor of 25 for CH4 and 298 for N2O [8,9,10].
EU Carbon Permits increased EUR 26.72 or 81.66% since the beginning of 2021, according to trading on a contract for difference (CFD) that tracks the benchmark market for this commodity [45]. Trading Economics Carbon Emissions Allowances Prices are sourced from the European Union Emissions Trading System (EU ETS), the world’s largest cap and trade greenhouse gas emissions market [45]. Allowances for carbon emissions are first allocated considering EU directives for the maximum amount of greenhouse gases that can be emitted. Allowances for carbon emissions are then auctioned and traded. On 14 October, the EUA was EUR 61.41 [45,46] for 1 Mg CO2eq.

2.4. Price for Energy in FIT (Feed-in-Tariff System) and for Heat

Aid schemes for small RES energy producers for the resale of unused electricity at a fixed price or the right to subsidize the electricity market price under so-called FIT system will function for at least the next 5 years. This means the guaranteed price for the energy produced is approx. EUR 160 per 1 MWh [47]. It is almost 3 times more than 1 MWh currently costs on the market (average EUR 56 in Q2) [47].
Average sales prices of heat generated in regional generation units oscillated around EUR 10 per 1 GW [48].

2.5. Biogas Production Efficiency from Substrates

The analysis of the efficiency of biogas production from solid manure was performed at the Ecotechnologies Laboratory of the University of Life Sciences in Poznań (PULS), the largest Polish biogas laboratory. The research methodology was based on the German standards DIN 38414/S8 [49] and VDI 4630 [50], which are currently the most frequently used laboratory procedure in Europe. Our Ecotechnologies Laboratory was the first in Poland to receive a certificate confirming the qualitative proficiency in biogas testing. Such an award is given, only after a series of tests, by the German organization Verband Deutscher Landwirtschaftlicher Untersuchungs- und Forschungsanstalten (VDLUFA [51]) and the Kuratorium für Technik und Bauwesen in der Landwirtschaft e.V. (KTBL [52]).
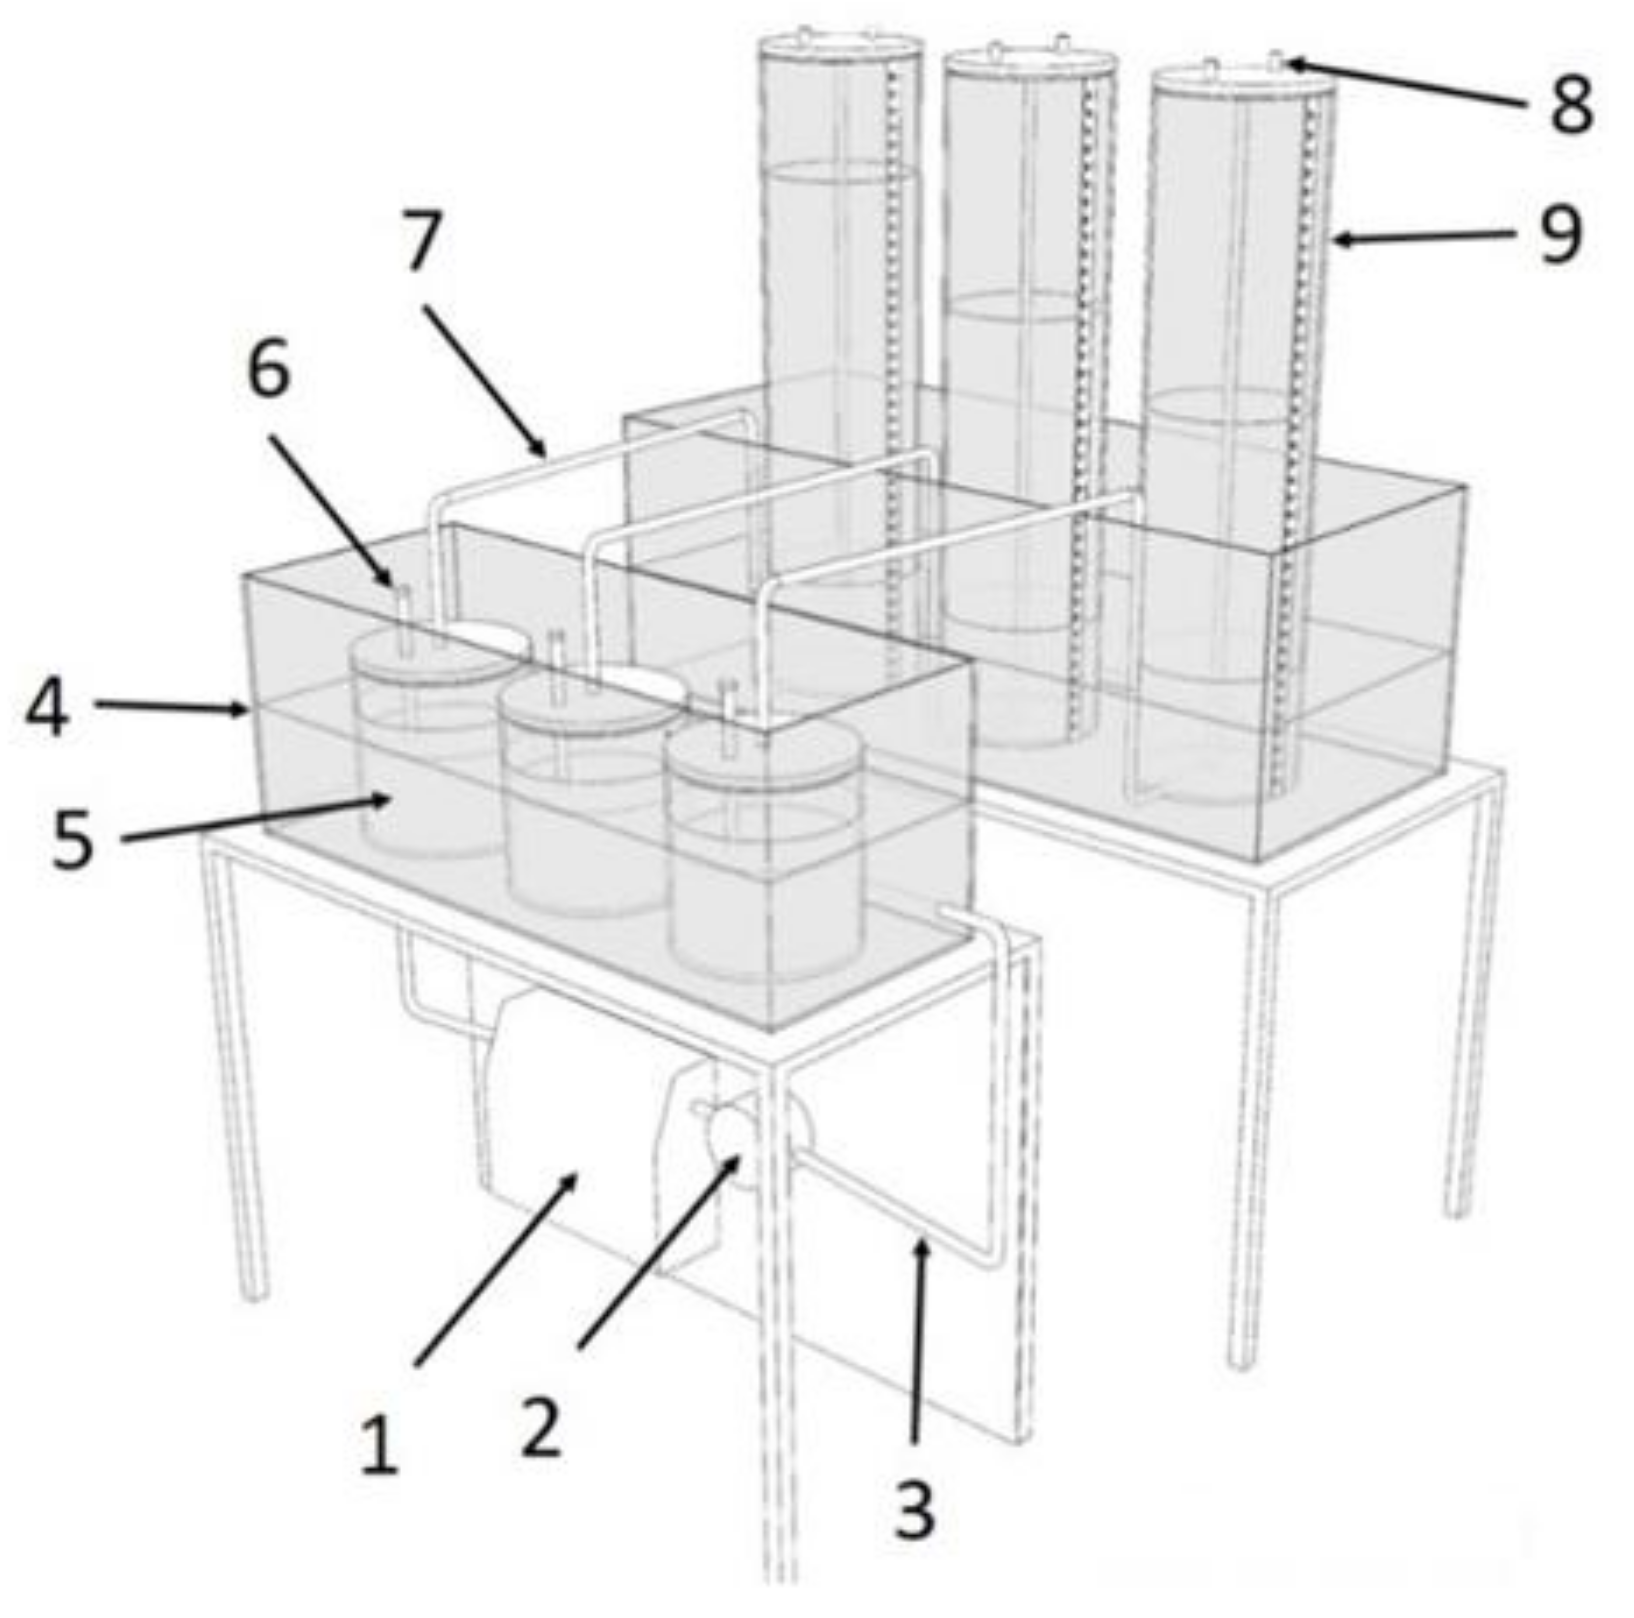
The experiment of manure samples anaerobic digestion has proceeded in a special 3-chambers biofermentor. The simple version of the fermenter’s 3-chambers section is shown in Figure 3.
The fermentation process occurs in glass reactors (capacity 2 dm3), well-closed with a can system. The reactors are kept at a stable temperature (39 °C) by placing them inside an aquarium with warm water. The samples (about 50 g of organic dry matter) are placed in the reactors (always in triplicate) and then filled with the inoculum of fermentation microorganisms. Control samples, for comparison, are filled only with the inoculum (3 replicates). The bacterial inoculum comes from the liquid part of the digestate taken from a typical, well-functioning biogas plant. The analyzed substrates were put inside each reactor with the weight-related to VS content and then mixed with inoculum standardized with DIN [49] and (VDI) norms [50]. Reactors were flushed with nitrogen gas to remove air and immediately create anaerobic conditions (oxygen is an inhibitor for methanogenic bacteria).
The biogas production measurements were taken every 24 h with accuracy of 0.01 dm3 by connecting gas reservoirs (9) (Figure 3) through sampling valve (8) with gas analyzer Geotech GA5000. This analyzer possesses quality certifications such as ATEX II 2G Ex ib IIA T1 Gb (Ta = −10 °C to +50 °C), IECEx, CSA, and calibration certificate UKAS ISO 17025. The measurement ranches for the Geotech analyzer are: O2 0–25%; CO2 0–100%; CH4 0–100%; NH3 0–1000 ppm and H2S 0–10,000 ppm. GA5000 was usually calibrated once a week using calibration gases (from the Air Product company) in the concentrations: 65% CH4, 35% CO2 (in one mixture); 500 ppm H2S, 100 ppm NH3 and O2 using synthetic air.
The generated results for each material are reduced by the production from control samples, and then converted into the production of biogas and methane from 1 Mg of fresh mass (FM) and converted to dry mass (TS) and organic mass (VS) of the analysed sample. Final data on methane production efficiency from the substrates analyzed in laboratory tests, sent from the Ecotechnologies Laboratory to contractors, are expressed in CH4 m3 with 1 Mg FM. This approach enables further energy calculations for the planned investment or operation of a biogas plant.

2.6. Energetic and Economic Calculations

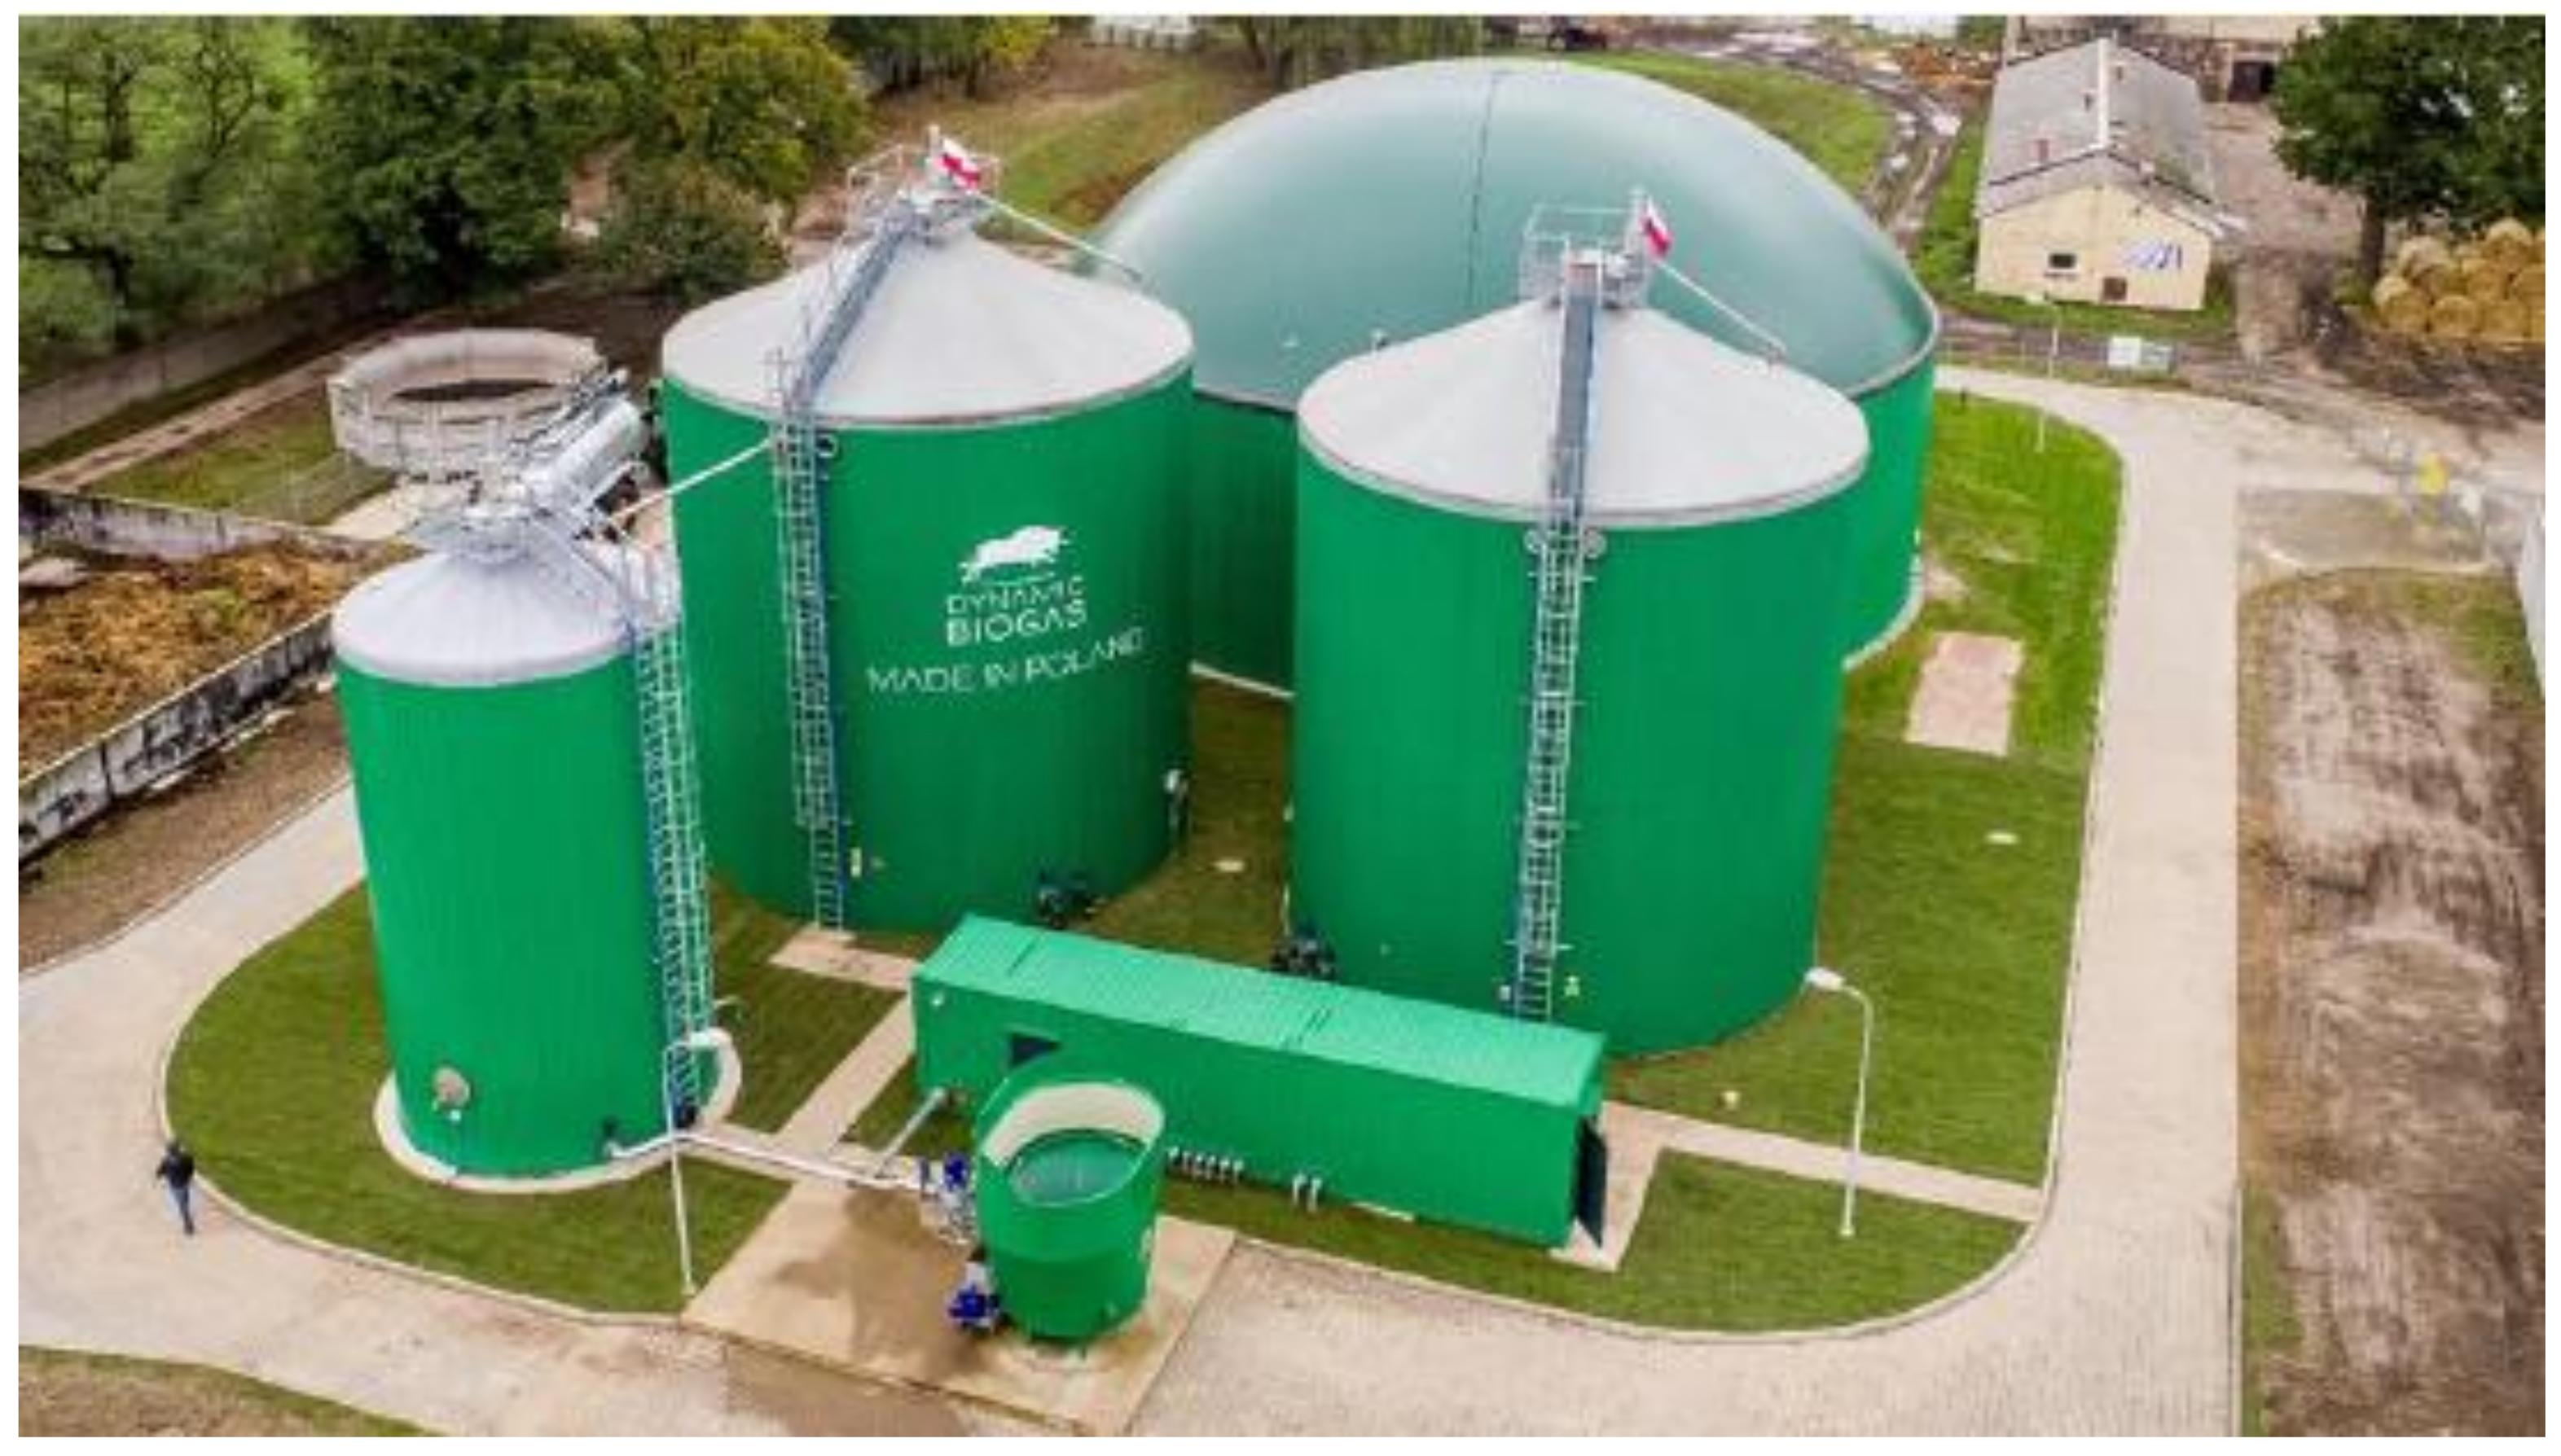
Based on data obtained from a similar working biogas plan in an experimental university farm (25 km west of Poznan) “Przybroda” the following energy calculations were made. The installation working in Przybroda (Dynamic Biogas Technology) (Figure 4) mainly uses: bio-waste (including food waste and agri-food industry waste) as the main substrates [54]. However, it should be noted that apart from the cost of the substrates, all other operating data will be almost identical for the presented case study in Brody (the same fermentation technology and the same installation power).
Production of the electric energy (Ee) by cogeneration—combined heat and power (CHP) unit from methane produced yearly from manure was calculated as follow:
Ee = VCH4 · WCH4 · ƞe (MWh)
where:
  • VCH4—volume of methane produced from digested manure (m3);
  • WCH4—energetic value of 1 cubic meter of methane;
  • ƞe—electric efficiency of CHP unit.
Production of the thermal energy (Et) by CHP unit from methane produced yearly from manure was calculated as follow:
Et = VCH4 · WCH4 · ƞt (MWh)
where:
  • VCH4—volume of methane produced from digested substrates (m3);
  • WCH4—energetic value of 1 cubic meter of methane;
  • ƞt—thermal efficiency of CHP unit.
The calculation of the electric power of a biogas plant (Pe) is based on the amount of electricity produced throughout the year in relation to the operation of the cogeneration unit, in accordance with the formula:
Pe = Ee/t (MW)
where:
  • Ee—amount of electric energy produced yearly (MWh);
  • t—working time of CHP during the whole year of exploitation.
For thermal power (Pt), a similar equation was used:
Pt = Et/t (MW)
where:
  • Et—amount of heat produced yearly (MWh);
  • t—working time of CHP during the whole year of exploitation.
The analyzed parameters and coefficients used for energy calculations are summarized in Table 3.
It should be emphasized that currently operating biogas plants show the actual working time in the range 7100–8500 h/year. Here, the value is close to the maximum—in the order of 8200 h/year. Such high reliability is due to technological changes introduced over several decades. In the case study, it would also be possible to use the value of 8400 h/year, which corresponds to the Biogas Dynamic technology [54]. However, it was decided to choose values that take into account more frequent operational problems and interruptions in biogas production so that the example could be reproduced in most modern technologies available on the market.
Since the most frequently used unit by enterprises and people to determine the amount of heat is GJ, the value in these units can be presented using a standard conversion factor—1 MWh equals 3.6 GJ.

3. Results

3.1. CH4 and N2O Emission and Economic Calculations for Scenario I—Manure Storage in Pils

For the presented case study farm of the Experimental Units of the University of Life Sciences in Poznań (Poland), the emissions, energetics and economics factors were calculated using the previously mentioned formulas from 1 to 2. The calculations are presented for the current inventory, i.e., Brody farm—600 livestock units (LSU) (Table 4).
Cow manure from the Brody farm is stored in piles on special reinforced concrete slabs. According to the fertilization schedule, it is spread on the field from 1 March to 31 October. The weight of fresh manure produced annually is, on average approx. 12,000 Mg per year (liquid and mainly solid). During this time, the total emissions can be estimated at the minimum level (here, “cool climate” has been adopted [41]) 183.4 Mg CO2eq only from solid part (5365.5 Mg). Although almost 10 times more methane than nitrous oxide is produced in this type of solid manure management, the equivalent total carbon dioxide emissions are similar. It is related to the previously described conversion factor, which for nitrous oxide is more than 10 times higher than the conversion factor for methane.

3.2. CH4 and N2O Emission, Energetic and Economic Calculations for Scenario II—Anaerobic Digestion of the Solid Manure

The fermentation of cattle solid manure process was carried out correctly for 22 days. During this period, no temporary inhibition of the methane fermentation process was observed.
The analysis of among others: dry mass (TS) and organic dry mass (VS), carbon to nitrogen ratio and methane productivity are shown in Table 5.
Scenario II involves the use of all collected solid manure during the year and using it for the production of biogas as the only substrate. In line with this assumption, it was calculated that the volume of methane produced annually would be over 247.461 m3 (Table 6).
When using cogeneration installations, it can be estimated that the amount of this methane production per year is sufficient to produce approx. 987 MWh, which would correspond to an electrical capacity of 0.12 MW (Table 7).
Currently, estimating that for 1 MWh can be approx. EUR 160 (along with subsidies from the state), the generated energy will bring almost EUR 158,000. The methodology for calculating the amount of heat and thermal power was based on the same method as for electricity, which means that the thermal power was determined at almost 4000 GJ. With the assumed average price of heat in the region (approx. EUR 10), it is possible to expect an annual income of almost EUR 40,000 (Table 7).
By analyzing the basic costs and revenues, it is possible to estimate the economic balance of both scenarios (Table 8).
On the one hand, at a price of EUR 61.41 per Mg CO2eq, the scenario I results in a cost charge of EUR 11,262.54 per year. On the other hand, the use of approx. 5365.5 Mg of solid manure as a fertilizer, with the average price in the region of EUR 10.4 per Mg, gives an income of approx. EUR 55,801 per year. That is over three times more than for a digestate. However, it should be noted that digestate has 4 times less dry matter, although it is twice as expensive.
However, the investor plans to invest in a biogas installation with 500 kW power. For the assumed capacity of the biogas plant, approx. 75% is still needed. This means that the manure has to be co-substrate with other waste material available on the farm. For this purpose, it was planned to transfer 2950 Mg of wheat straw for energy production (Table 9) similar to that described in another article for this farm [54].
The use of wheat straw will enable the acquisition of an additional over 3 thous. MWh of electricity and over 3.5 thous. MWh of thermal energy per year. Assuming the same energy prices as in the previous calculations, it expect additional income in the amount of over EUR 500 thous. electricity and over EUR 126 thous. for heat.
The biogas plant proposed in that study would cost around EUR 1.97 million [54]. For such an investment depreciation cost for 15-year period of exploitation results EUR 131,580 per year. The remaining costs are straw as a substrate for the biogas plant as well as costs related to the maintenance and service and depreciation of the plant. Other costs are straw (approx. PLN 150/Mg, which is approx. EUR 34/Mg) as a substrate for biogas plants and costs related to maintenance, service and depreciation of the installation (EUR 77 thousand per year) [54].
For scenario I (without biogas plant) and scenario II + (0.5 MW) with the addition of wheat straw as a substrate, it is possible to estimate the balance of costs and revenues and payback period calculated as return on investment (Table 10).
The simplified economic balance for the tree presented scenarios clearly shows that the variant with a biogas plant is much more favorable, and a solution with an increased power of up to 0.5 MW—a biogas plant with additional straw as a substrate, allows for a return on investment within a little more than 4 years. The estimated payback period was calculated as the time after which the present value, total capital expenditure and costs incurred during operation, were covered from the current benefits generated by the investment. However, not only the economic result matters. Additionally, the negative impact on the environment will be reduced (significantly reducing the emission of carbon dioxide equivalent from the farm). Such a solution is also important for organizational and perspective reasons, as it limits dependence on external sources of heat and electricity (local generation from RES).

4. Discussion

In the presented work, an analysis was performed that shows that reducing the emission of carbon dioxide equivalent brings significant benefits in the economic and ecological balance. Reducing emissions from manure (through methane digestion) is an approach that is frequently analyzed today. The present publication, however, presents a new aspect, which is the introduction to the economic balance of investments in biogas plants, the savings resulting from the lack of fees for N2O and CH4 emissions from improper manure management.
According to 9 studies discussed in Grossi [5] (Table 11), the mitigation effects refer to the percentage change from “standard practice”, the greatest potential is solid-liquid separation followed by solids fermentation in a biogas plant. It can be particularly effective when combined with synergistic actions such as: shortening the storage time and frequent manure removal.
However, the increased productivity listed in the table may not be such a favorable solution. While the total number of dairy cattle might not increase, but only milk production per cow, gas emissions may increase due to higher feed consumption of cows, which in turn results in higher intestinal methane (CH4) emissions [6]. Although some studies emphasize that especially animal faeces should be subjected to anaerobic digestion, these this type of waste characterized by a low biogas productivity [55,56]. This was also the case in similar study [54], because the entire manure production could cover not even 50% of the estimated capacity. Therefore, additional substrates are sometimes required for use [57,58]. The wheat straw was used in this study due to its ease of harvesting and high biogas efficiency. Many researchers emphasized the high energy value of various types of straw as a substrate for anaerobic digestion, such as corn straw [59,60] or cereal straw [54,61]. Importantly, straw as a material for energy purposes does not cause a conflict between food production and biofuel (biomethane) [62]. In contrast with maize silage (which is often used as a substrate for biogas plants in place of forage), straw is only a by-waste. The above-described approach was applied to the analysis performed in this work. Reducing carbon dioxide equivalent emissions has been shown to bring additional significant economic and environmental benefits.
Of course, the entire balance sheet should include the costs associated, inter alia, land purchase and administration fees. On the other hand, the profits should consider the savings resulting from the reduced transmission fee for electricity and heat, charge for ordered power, lower fertilization costs (digestate is a more valuable product than manure).
In the analysis presented in the paper, current prices were taken into account, including the costs of energy and heat consumed as well as the costs of CO2eq emissions. However, as indicated by market analyses, a significant increase in the above-mentioned costs should be expected in the coming year, which would additionally significantly accelerate the return on investment in biogas plants. The use of a local installation for production as a RES to a large extent makes it independent of the wave of the energy crisis that is currently taking place across the continent. Europe’s leading benchmark reports that prices have risen from EUR 16 MWh in early January to EUR 98 by late September, a six-fold hike in less than one year [63]. The willingness of East Asian countries to pay more for fuel has exacerbated the trend.
Very high volatility and subsequent records of CO2eq emission allowances prices are already a constant trend for the allowances market this year. In January this year, allowances were valued at around EUR 31, while in April, they approached EUR 49. These are increases at the level of approx. 60%. Noteworthy is the extremely high price volatility that has been maintained since February, which on average amounted to approx. EUR 6 per month (EUR 6.36 in April) [64]. This shows that price stability in the allowances market is unlikely to happen in the near future. In line with Trading Economics ‘global macro models and analysts’ expectations, by the end of this quarter, the EU’s carbon allowances will amount to EUR 64.75. The published predictions indicate mean values at the level of EUR 73.63 [45]. This situation means that the return on investment in biogas plants will be even faster, so the solution will be financially more favorable by up to 20% from the next year (EUR 61.45 to EUR 73.63).
Apart from the benefits of the energetic, economic and environmental points mentioned by many scientists [65,66,67], the use of manure as a substrate for biogas plants has another important aspect. During anaerobic digestion, a significant proportion of the antibiotics present in manure is broken down [68]. A consequence of the direct use of manure, which currently contains significant amounts of antibiotics used in animal production, results in the uncontrolled release of drugs into the environment via animal (and human) faeces. This phenomenon is the main cause of the emergence of “super worms”—resistant to all known antibiotics [54].
Unfortunately, due to a considerable dependence and on many factors (air humidity and temperature and its variability, wind speed, formation of the surface crust, length and method of storage) [69], there are no unambiguous data in the literature about the emission of methane, e.g., from 1 m3 or 1 Mg of cow manure.
The analysis presented in the paper is based on the use of the international IPCC methodology [41] and the indicators adopted therein. Only a few places use national data.
However, national and regional sources can be found that rely on slightly different data that significantly increase the benefits of using a biogas plant for manure processing.
Single information can be found in the literature review by Chianese et al. [70], who determined the average annual emissions from solid manure in heaps for methane at 2.3 kg CH4/m3, and for N2O equal to 0.1 kg N2O/m3. These values are estimated 4 times higher than in this study, i.e., the annual methane production would amount to approx. 12 Mg per year. However, as shown by other sources, the aforementioned value is burdened with a very substantial error, e.g., in different regions, the same breed of cows differed by 300% [70]. In turn, the values given in other literature are, for example, emission of manure is 20% of biogas efficiency, i.e., as much as 15 m3 CH4/Mg of manure [71]. The adoption of such values would mean an almost 6 times higher result than the previously quoted one and several times higher than this work, with one reservation—it was not stated whether this only applies to the solid fraction. Such imprecision is common, which complicates a meaningful comparison very much. Grossi et al. [5] points that manure (liquid and solid fractions) may be responsible for 8% of methane emissions and 7% of N2O.
By Moral et al. [72] the cumulative CH4–C emission was determined as approx. 0.54 kg C/Mg in relation to the starting weight of the initial manure fresh mass, approx. 0.6% of the total C in the pile at the beginning of manure storage, which corresponds to the results of this study—0.6% of the starting carbon content would account for approx. 2.8 Mg of CH4 emitted annually, and the study determined this value at approx. 3.4 Mg/year.
On the other hand, generally, the estimation of Chadwick [73] is that total losses of CH4–C ranged from 0.4% to 9.7%, which is in line with the results of this work. However, most of his results (from three conventionally stored periods) were within limits of 1.8% to 4.4% of the initial carbon content of cattle manure. Chadwick [73] noted that covering and thickening the piles is not as important as might be expected and works primarily in the initial phase. Alternatively, frequent rotation of the pile should be introduced to reduce methane emissions. This action introduces oxygen into the manure and reduces the compaction (“loosens the pile”), allowing better air flow inside the manure. Such a solution may result in the loss of methane at the level of approx. 0.5% of the original carbon content in the manure [74,75].

5. Conclusions

As a result of the conducted research, it can be concluded that:
1. The solution variant assuming the use of solid manure as a substrate for a biogas plant equipped with a cogeneration system is definitely more advantageous in economic and ecological terms.
2. The payback period assumed for the presented biogas installation does not exceed 5 years, and with the current trend of increasing energy prices, it can be estimated that it will shorten to even 4 years.
3. To properly determine the economic balance, it would be necessary to conduct energy and economic analyses for additional waste streams (dairy waste, agri-food industry waste, etc.) that could increase the biogas plant’s power, thus its efficiency.
4. The use of solid manure as a source of chemical energy (biogas) enables the reduction of carbon dioxide equivalent emissions by up to 100 Mg per year.
5. The use of a renewable energy source such as biogas can be an essential aspect when determining the LCA or carbon footprint for farm dairy products.

Funding

This research was funded by The National Centre for Research and Development in the framework of the project “Decision support system for sustainable and GHG optimised milk production in key European areas” project number—SUSAN/II/MILKEY/02/2020, Acronym MilKey, No. ICT AGRI 3 ID 39288.

Institutional Review Board Statement

Not applicable.

Informed Consent Statement

Not applicable.

Data Availability Statement

Not applicable.

Acknowledgments

This paper was created in the framework of 2018 Joint Call FACCE ERA-GAS, SusAn and ICT-AGRI2 on “Novel technologies, solutions and systems to reduce greenhouse gas emissions in animal production systems” of the project “Decision support system for sustainable and GHG optimized milk production in key European areas” No. ICT-AGRI-3 ID 39288, Acronym MilKey, realized at Poznan University of Life Sciences.

Conflicts of Interest

The author declares no conflict of interest.

References

  1. Krausmann, F.; Erb, K.H.; Gingrich, S.; Lauk, C.; Haberl, H. Global patterns of socioeconomic biomass flows in the year 2000: A comprehensive assessment of supply, consumption and constraints. Ecol. Econ. 2008, 65, 471–487. [Google Scholar] [CrossRef]
  2. Twine, R. Emissions from Animal Agriculture—16.5%. Is the New Minimum Figure. Sustainability 2021, 13, 6276. [Google Scholar] [CrossRef]
  3. Gerber, J.P.; Steinfeld, H.; Henderson, B.; Mottet, A.; Opio, C.; Dijkman, J.; Falcucci, A.; Tempio, G. Tackling Climate Change through Livestock: A Global Assessment of Emissions and Mitigation Opportunities. Rome: FAO. 10. 2013. Available online: http://www.fao.org/3/a-i3437e.pdf (accessed on 14 October 2021).
  4. FAO. The Future of Food and Agriculture—Alternative Pathways to 2050. Rome. 224. 2018. Available online: https://www.fao.org/3/I8429EN/i8429en.pdf (accessed on 14 October 2021).
  5. Grossi, G.; Goglio, P.; Vitali, A.; Williams, A.G. Livestock and climate change: Impact of livestock on climate and mitigation strategies. Anim. Front. 2019, 9, 69–76. [Google Scholar] [CrossRef] [PubMed] [Green Version]
  6. Little, S.M.; Benchaar, C.; Janzen, H.H.; Kröbel, R.; McGeough, E.J.; Beauchemin, K.A. Demonstrating the Effect of Forage Source on the Carbon Footprint of a Canadian Dairy Farm Using Whole-Systems Analysis and the Holos Model: Alfalfa Silage vs. Corn Silage. Climate 2017, 5, 87. [Google Scholar] [CrossRef] [Green Version]
  7. Thoma, G.; Popp, J.; Shonnard, D.; Nutter, D.; Matlock, M.; Ulrich, R.; Kellogg, D.; Kim, D.; Neiderman, Z.; Kemper, N.; et al. Regional analysis of greenhousegas emissions from USA dairy farms: A cradle to farm-gate assessment of the American dairy industrycirca 2008. Int. Dairy J. 2013, 31, S29–S40. [Google Scholar] [CrossRef] [Green Version]
  8. Wang, C.; Amon, B.; Schulz, K.; Mehdi, B. Factors That Influence Nitrous Oxide Emissions from Agricultural Soils as Well as Their Representation in Simulation Models: A Review. Agronomy 2021, 11, 770. [Google Scholar] [CrossRef]
  9. ME 2020. Ministry for the Environment. 2020. Measuring Emissions: A Guide for Organisations: 2020 Detailed Guide. Welling-ton: Ministry for the Environment. 2020. Available online: https://environment.govt.nz/publications/measuring-emissions-detailed-guide-2020/ (accessed on 14 October 2021).
  10. NIR 2021. Poland. 2021 National Inventory Report. Available online: https://unfccc.int/documents/274762 (accessed on 14 October 2021).
  11. Stocker, T.F.; Qin, D.; Plattner, G.K.; Tignor, M.; Allen, S.K.; Boschung, J.; Nauels, A.; Xia, Y.; Bex, V.; Midgley, P.M. (Eds.) Contribution of Working Group I to the Fifth Assessment Report of the Intergovernmental Panel on Climate Change. In Climate Change 2013: The Physical Science Basis; Cambridge University Press: Cambridge, UK; New York, NY, USA; p. 1535. Available online: https://www.ipcc.ch/pdf/assessment-report/ar5/wg1/WGIAR5_SPM_brochure_en.pdf (accessed on 14 October 2021).
  12. Hristov, A.N.; Oh, J.; Giallongo, F.; Frederick, T.W.; Harper, M.T.; Weeks, H.L.; Branco, A.F.; Moate, P.J.; Deighton, M.H.; Williams, S.R.; et al. An inhibitor persistently decreased enteric methane emission from dairy cows with no negative effect on milk production. Proc. Natl. Acad. Sci. USA 2015, 112, 10663–10668. [Google Scholar] [CrossRef] [Green Version]
  13. Møller, H.B.; Moset, V.; Brask, M.; Weisbjerg, M.R.; Lund, P. Feces composition and manure derived methane yield from dairy cows: Influence of diet with focus on fat supplement and roughage type. Atmos. Environ. 2014, 94, 36–43. [Google Scholar] [CrossRef]
  14. Follett, R.F. Soil management concepts and carbon sequestration in cropland soils. Soil Tillage Res. 2001, 61, 77–92. [Google Scholar] [CrossRef]
  15. Sommer, S.G.; Feilberg, A. Gaseous Emissions of Ammonia and Malodorous Gases. In Animal Manure Recycling; Sommer, S.G., Christensen, M.L., Schmidt, T., Jensen, L.S., Eds.; John Wiley & Sons: Hoboken, NJ, USA, 2013. [Google Scholar] [CrossRef]
  16. Nan, S.; Li, H.; Li, J.-Z.; Ng, E.L.; Yan, M.A.; Wang, L.-G.; Chen, Q. A major pathway for carbon and nitrogen losses—Gas emissions during storage of solid pig manure in China. J. Integr. Agric. 2019, 18, 190–200. [Google Scholar] [CrossRef] [Green Version]
  17. Petersen, S.; Blanchard, M.; Chadwick, D.; Del Prado, A.; Edouard, N.; Mosquera, J.; Sommer, S.G. Manure management for greenhouse gas mitigation. Animal 2013, 7, 266–282. [Google Scholar] [CrossRef] [Green Version]
  18. GUS. Characteristics of Agricultural Holdings in 2016. GUS, Warsaw. 2017. Available online: https://stat.gov.pl/files/gfx/portalinformacyjny/pl/defaultaktualnosci/5507/5/5/1/charakterystyka_gospodarstw_rolnych_2016.pdf (accessed on 14 October 2021).
  19. Sneath, R.W.; Beline, F.; Hilhorst, M.A.; Peu, P. Monitoring GHG from manure stores on organic and conventional dairy farms. Agric. Ecosyst. Environ. 2006, 112, 122–128. [Google Scholar] [CrossRef]
  20. Hollas, C.E.; Bolsan, A.C.; Chini, A.; Venturin, B.; Bonassa, G.; Cândido, D.; Antes, F.G.; Steinmetz, R.L.R.; Prado, N.V.; Kunz, A. Effects of swine manure storage time on solid-liquid separation and biogas production: A life-cycle assessment approach. Renew. Sustain. Energy Rev. 2021, 150, 111472. [Google Scholar] [CrossRef]
  21. Saggar, S. Estimation of nitrous oxide emissions from ecosystems and its mitigation technologies. Agri. Ecosyst. Environ. 2010, 136, 189–191. [Google Scholar] [CrossRef]
  22. Ramin, M.; Chagas, J.C.; Smidt, H.; Exposito, R.G.; Krizsan, S.J. Enteric and Fecal Methane Emissions from Dairy Cows Fed Grass or Corn Silage Diets Supplemented with Rapeseed Oil. Animals 2021, 11, 1322. [Google Scholar] [CrossRef] [PubMed]
  23. Van den Oever, A.E.M.; Cardellini, G.; Sels, B.F.; Messagie, M. Life cycle environmental impacts of compressed biogas production through anaerobic digestion of manure and municipal organic waste. J. Clean. Prod. 2021, 306, 127156. [Google Scholar] [CrossRef]
  24. Sommer, S.G.; Petersen, S.O.; Møller, H.B. Algorithms for calculating methane and nitrous oxide emission from manure management. Nutr. Cycl. Agroecosyst. 2004, 69, 143–154. [Google Scholar] [CrossRef]
  25. Kozłowski, K.; Dach, J.; Lewicki, A.; Malinska, K.; Paulino, I.E.; Czekala, W. Potential of biogas production from animal manure in Poland. Arch. Environ. Prot. 2019, 45, 99–108. [Google Scholar] [CrossRef]
  26. Lu, Z.; Marand, A.P.; Ricci, W.A.; Ethridge, C.L.; Zhang, X.; Schmitz, R.J. The prevalence, evolution and chromatin signatures of plant regulatory elements. Nat. Plants 2019, 5, 1250–1259. [Google Scholar] [CrossRef]
  27. Marks, S.; Dach, J.; Morales, F.J.F.; Mazurkiewicz, J.; Pochwatka, P.; Gierz, L. New trends in substrates and biogas systems in Poland. J. Ecol. Eng. 2020, 21, 19–25. [Google Scholar] [CrossRef]
  28. Wentzel, S.; Joergensen, R.G. Effects of biogas and raw slurries on grass growth and soil microbial indices. J. Plant Nutr. Soil Sci. 2016, 179, 215–222. [Google Scholar] [CrossRef]
  29. Zheng, X.; Fan, J.; Cui, J.; Wang, Y.; Zhou, J.; Ye, M.; Sun, M. Effects of biogas slurry application on peanut yield, soil nutrients, carbon storage, and microbial activity in an Ultisol soil in southern China. J. Soils Sediments 2016, 16, 449–460. [Google Scholar] [CrossRef]
  30. Zhang, S.; Hua, Y.; Deng, L. Nutrient Status and Contamination Risks from Digested Pig Slurry Applied on a Vegetable Crops Field. Int. J. Environ. Res. Public Health 2016, 13, 406. [Google Scholar] [CrossRef] [PubMed] [Green Version]
  31. Bougnom, B.P.; Niederkofler, C.; Knapp, B.A.; Stimpfl, E.; Insam, H. Residues from renewable energy production: Their value for fertilizing pastures. Biomass Bioenergy 2012, 39, 290–295. [Google Scholar] [CrossRef]
  32. Ahmad, M.Z.; Zahir, Z.A.; Jamil, M.; Nazli, F.; Latif, M. Integrated use of plant growth promoting rhizobacteria, biogas slurry and chemical nitrogen for sustainable production of maize under salt-affected conditions. Pak. J. Bot. 2014, 46, 375–382. [Google Scholar]
  33. Cao, Y.; Chang, Z.; Wang, J.; Ma, Y.; Fu, G. The fate of antagonistic microorganisms and antimicrobial substances during anaerobic digestion of pig and dairy manure. Bioresour. Technol. 2013, 136, 664–671. [Google Scholar] [CrossRef]
  34. Heuer, H.; Schmitt, H.; Smalla, K. Antibiotic resistance gene spread due to manure application on agricultural fields. Curr. Opin. Microbiol. 2011, 14, 236–243. [Google Scholar] [CrossRef]
  35. Czekała, W.; Bartnikowska, S.; Dach, J.; Janczak, D.; Smurzyńska, A.; Kozłowski, K.; Bugała, A.; Lewicki, A.; Cieślik, M.; Typańska, D.; et al. The energy value and economic efficiency of solid biofuels produced from digestate and sawdust. Energy 2018, 159, 1118–1122. [Google Scholar] [CrossRef]
  36. EC 2020. CAP Strategic Plans European Commission. Available online: https://ec.europa.eu/info/food-farming-fisheries/key-policies/common-agricultural-policy/cap-strategic-plans_en (accessed on 14 October 2021).
  37. Schils, R.L.M.; Verhagen, A.; Aarts, H.F.M.; Šebek, L.B.J. A farm level approach to define successful mitigation strategies for GHG emissions from ruminant livestock systems. Nutr. Cycl. Agroecosyst. 2005, 71, 163–175. [Google Scholar] [CrossRef] [Green Version]
  38. Lahart, B.; Shalloo, L.; Herron, J.; O’Brien, D.; Fitzgerald, R.; Boland, T.M.; Buckley, F. Greenhouse gas emissions and nitrogen efficiency of dairy cows of divergent economic breeding index under seasonal pasture-based management. J. Dairy Sci. 2021, 104, 8039–8049. [Google Scholar] [CrossRef]
  39. O’Brien, D.; Shalloo, L.; Grainger, C.; Buckley, F.; Horan, B.; Wallace, M. The influence of strain of Holstein-Friesian cow and feeding system on greenhouse gas emissions from pastoral dairy farms. J. Dairy Sci. 2010, 93, 3390–3402. [Google Scholar] [CrossRef] [PubMed] [Green Version]
  40. Bojarski, W.; Czekała, W.; Mazurkiewicz, J.; Dach, J. The impact of a biogas investment on the reduction of greenhouse gas emissions in a farm. In Proceedings of the 7th Scientific and Technical Conference New Directions of Research in Environmental Engineering, Energy, Geodesy and Forestry, Zwierzyniec, Poland, 6–8 October 2021. [Google Scholar]
  41. IPCC. 2006 IPCC Guidelines for National Greenhouse Gas Inventories. Available online: https://www.ipcc.ch/report/2006-ipcc-guidelines-for-national-greenhouse-gas-inventories/ (accessed on 14 October 2021).
  42. IPCC (2019). Refinement to the 2006 IPCC Guidelines for National Greenhouse Gas Inventories. Available online: https://www.ipcc.ch/report/2019-refinement-to-the-2006-ipcc-guidelines-for-national-greenhouse-gas-inventories/ (accessed on 14 October 2021).
  43. Walczak, J. Assessment of livestock population and its animal waste management systems in Poland in 2010–2011 based on database of the National research Institute of Animal Production for the purpose of GHG and other pollutants inventories. Inst. Zootech. Cracow Poland 2012, unpublished work. [Google Scholar]
  44. Walczak, J. Elaboration of activity data and GHG emission factors in Polish agriculture. Inst. Zootech. Cracow Poland 2006, unpublished work. [Google Scholar]
  45. TE 2021. EU Carbon Permits. Available online: https://tradingeconomics.com/commodity/carbon (accessed on 14 October 2021).
  46. PSE 2021. Polish Power System. Available online: https://www.pse.pl/home (accessed on 14 October 2021).
  47. URE 2021. Available online: https://www.ure.gov.pl/pl/urzad/informacje-ogolne/aktualnosci/9791,W-drugim-kwartale-2021-roku-srednia-cena-sprzedazy-energii-elektrycznej-na-rynku.html (accessed on 14 October 2021).
  48. Veolia 2021. Tariff for Heat. Available online: https://energiadlapoznania.pl/strefa-klienta/taryfy/taryfa-dla-ciepla/ (accessed on 14 October 2021).
  49. DIN. DIN 38 414/S8; German Standard Methods for the Examination of Water, Waste Water and Sludge; Sludge and Sediments (Group S); Determination of the Amenability to Anaerobic Digestion (S 8). DIN Deutches Institut für Normung e. V. Beuth Verlag GmbH: Berlin, Germany, 2012.
  50. VDI. VDI 4630. Fermentation of Organic Materials. Characterization of the Substrate, Sampling, Collection of Material Data, Fermentation Tests; Verein Deutscher Ingenieure e.V.: Düsseldorf, Germany, 2016. [Google Scholar]
  51. VDLUFA. Available online: https://www.vdlufa.de/de/ (accessed on 14 October 2021).
  52. KTBL. Available online: https://www.ktbl.de/ (accessed on 14 October 2021).
  53. Cieślik, M.; Dach, J.; Lewicki, A.; Smurzyńska, A.; Janczak, D.; Pawlicka-Kaczorowska, J.; Boniecki, P.; Cyplik, P.; Czekała, W.; Jóźwiakowski, K. Methane fermentation of the maize straw silage under meso- and thermophilic conditions. Energy 2016, 115, 1495–1502. [Google Scholar] [CrossRef]
  54. Pochwatka, P.; Kowalczyk-Juśko, A.; Sołowiej, P.; Wawrzyniak, A.; Dach, J. Biogas Plant Exploitation in a Middle-Sized Dairy Farm in Poland: Energetic and Economic Aspects. Energies 2020, 13, 6058. [Google Scholar] [CrossRef]
  55. Li, Y.; Zhao, J.; Achinas, S.; Zhang, Z.; Krooneman, J.; Euverink, G.J.W. The biomethanation of cow manure in a continuous anaerobic digester can be boosted via a bioaugmentation culture containing Bathyarchaeota. Sci. Total Environ. 2020, 745, 141042. [Google Scholar] [CrossRef] [PubMed]
  56. Ahmed, S.; Einfalt, D.; Kazda, M. Co-Digestion of Sugar Beet Silage Increases Biogas Yield from Fibrous Substrates. Biomed Res. Int. 2016, 2016, 2147513. [Google Scholar] [CrossRef] [Green Version]
  57. Dach, J.; Boniecki, P.; Przybył, J.; Janczak, D.; Lewicki, A.; Czekała, W.; Witaszek, K.; Rodríguez Carmona, P.C.; Cieslik, M. Energetic efficiency analysis of the agricultural biogas plant in 250 kWe experimental installation. Energy 2014, 69, 34–38. [Google Scholar] [CrossRef]
  58. Koryś, K.A.; Latawiec, A.E.; Grotkiewicz, K.; Kuboń, M. The Review of Biomass Potential for Agricultural Biogas Production in Poland. Sustainability 2019, 11, 6515. [Google Scholar] [CrossRef] [Green Version]
  59. Mazurkiewicz, J.; Marczuk, A.; Pochwatka, P.; Kujawa, S. Maize Straw as a Valuable Energetic Material for Biogas Plant Feeding. Materials 2019, 12, 3848. [Google Scholar] [CrossRef] [Green Version]
  60. Zbytek, Z.; Dach, J.; Pawłowski, T.; Smurzy´nska, A.; Czekała, W.; Janczak, D. Energy and economic potential of maize straw used for biofuels production. In MATEC Web of Conferences; EDP Sciences: Ullis, France, 2016; Volume 60, p. 4008. [Google Scholar]
  61. Sieborg, M.U.; Jønson, B.D.; Larsen, S.U.; Vazifehkhoran, A.H.; Triolo, J.M. Co-Ensiling of Wheat Straw as an Alternative Pre-Treatment to Chemical, Hydrothermal and Mechanical Methods for Methane Production. Energies 2020, 13, 4047. [Google Scholar] [CrossRef]
  62. Dach, J.; Mazurkiewicz, J.; Janczak, D.; Pulka, J.; Pochwatka, P.; Kowalczyk-Jusko, A. Cow Manure Anaerobic Digestion or Composting—Energetic and Economic Analysis. In Proceedings of the 2020 4th International Conference on Green Energy and Applications, ICGEA 2020, Singapore, 7–9 March 2020; Institute of Electrical and Electronics Engineers Inc.: Piscataway, NJ, USA, 2020; pp. 143–147. [Google Scholar]
  63. Euronews 2021. Available online: https://www.euronews.com/2021/10/04/europe-divided-over-response-to-soaring-unbearable-energy-prices (accessed on 14 October 2021).
  64. KOBiZE 2021. Available online: https://www.kobize.pl/uploads/materialy/materialy_do_pobrania/raport_co2/2021/KOBiZE_Analiza%20rynku%20CO2_kwiecie%C5%84_2021.pdf (accessed on 14 October 2021).
  65. Díaz-Vázquez, D.; Alvarado-Cummings, S.C.; Meza-Rodríguez, D.; Senés-Guerrero, C.; de Anda, J.; Gradilla-Hernández, M.S. Evaluation of biogas potential from livestock manures and multicriteria site selection for centralized anaerobic digester systems: The case of Jalisco, Mexico. Sustainability 2020, 12, 3527. [Google Scholar] [CrossRef]
  66. Achinas, S.; Willem Euverink, G.J. Rambling facets of manure-based biogas production in Europe: A briefing. Renew. Sustain. Energy Rev. 2020, 119, 109566. [Google Scholar] [CrossRef]
  67. Zareei, S. Evaluation of biogas potential from livestock manures and rural wastes using GIS in Iran. Renew. Energy 2018, 118, 351–356. [Google Scholar] [CrossRef]
  68. Hosseini Taleghani, A.; Lim, T.-T.; Lin, C.-H.; Ericsson, A.C.; Vo, P.H. Degradation of Veterinary Antibiotics in Swine Manure via Anaerobic Digestion. Bioengineering 2020, 7, 123. [Google Scholar] [CrossRef]
  69. Rotz, C.A. Modeling greenhouse gas emissions from dairy farms. J. Dairy Sci. 2018, 101, 6675–6690. [Google Scholar] [CrossRef] [PubMed]
  70. Chianese, D.S.; Rotz, C.A.; Richard, T.L. Whole-farm greenhouse gas emissions: A review with application to a Pennsylvania dairy farm. Appl. Eng. Agric. 2013, 25, 431–442. [Google Scholar] [CrossRef]
  71. ICAR 2020. Section 20—Recording Dairy Cattle Methane Emission for Genetic Evaluation. Available online: https://www.icar.org/Guidelines/20-Recording-Dairy-Cattle-Methane-Emission-for-Genetic-Evaluation.pdf (accessed on 14 October 2021).
  72. Moral, R.; Bustamante, M.A.; Chadwick, D.R.; Camp, V.; Misselbrook, T.H. N and C transformations in stored cattle farmyard manure, including direct estimates of N2 emission. Resour. Conserv. Recycl. 2012, 63, 35–42. [Google Scholar] [CrossRef]
  73. Chadwick, D.R. Emissions of ammonia, nitrous oxide and methane from cattle manure heaps: Effect of compaction and covering. Atmos. Environ. 2005, 39, 787–799. [Google Scholar] [CrossRef]
  74. Amon, B.; Amon, T.; Boxberger, J.; Alt, C. Emissions of NH3, N2O and CH4 from dairy cows housed in a farmyard manure tying stall (housing, manure storage, manure spreading). Nutr. Cycl. Agroecosyst. 2001, 60, 103–113. [Google Scholar] [CrossRef]
  75. Amon, B.; Boxberger, J.; Amon, T.H.; Zaussinger, A.; Pollinger, A. Emission data of NH3, CH4 and N2O from fattening bulls, milking cows, and during different ways of storing solid manure. In Ammonia and Odour Control from Animal Production Facilities; Amon, B., Boxberger, J., Amon, T.H., Zaussinger, A., Pollinger, A., Eds.; Elsevier: Amsterdam, The Netherlands, 1997; pp. 397–404. [Google Scholar]
Figure 1. Scheme of Scenario I, manure storage [40].
Energies 15 00413 g001
Figure 2. Scheme of Scenario II, manure storage [40].
Energies 15 00413 g002
Figure 3. Diagram of the biogas fermenter (3-chamber section): 1—water heater with temperature regulator, 2—water pump, 3—insulated conductors of calefaction liquid, 4—water coat, 5—biofermentor with charge capacity 2 dm3, 6—sampling tubes, 7—biogas transporting tube, 8—gas sampling valve, 9—biogas volume-scale reservoir [53].
Energies 15 00413 g003
Figure 4. View of the 0.5 MW biogas installation working at Przybroda PULS experimental farm [54].
Energies 15 00413 g004
Table 1. Parameters used for calculation of CH4 emissions from manure management for cattle (based on [10]).
ParametersVSD/YBoCFMCFMSEF
Unitkg/animal/daydaysm3 CH4/kg Vs-%%kg CH4/animal/year
Value4.813650.240.6721005.65
EF—emission factor, VS—average daily volatile excreted solids, D/Y—the number of days taken for the calculation during the year, Bo—maximum CH4 production capacity for manure produced by animal, CF—conversion factor from kg to m3, MCF—methane conversion factors for each manure management system for cool climate [42], MS—a fraction of livestock category manure.
Table 2. Parameters used for calculation of N2O emissions from manure management for cattle (based on [10]).
ParametersNexCFNMSEF
Unitkg N/animal/year-%kg N2O−N/kg N
Value70.26 44/281000.005
Table 3. Parameters and factors used for energetic calculation of manure fermentation.
ParametersWCH4ƞeƞtt
UnitkWh/m3--h/year
Value9.9680.40.458200
Table 4. Masses of methane and nitrous oxide and conversion to the equivalent of carbon dioxide.
ParametersMCH4CO2eq - CH4N2OCO2eq - N2O
Unitkg CH4/yearMg CO2eq/yearkg N2O/yearMg CO2eq/year
Value3387.7084.69331.2398.71
Table 5. The initial parameters and methane productivity of solid manure.
ParametersTSVSTotal NTotal CC/N RatioBiogas YieldMethane ContentMethane Production
Substrate% FM% TS% TS% TS-m3/Mg FM%m3/Mg FM
Solid cattle manure22.89 ± 0.645 *85.77 ± 0.144 *2.7737.6922/180.49 ± 3.02 *57.3046.12
* Standard deviation.
Table 6. Annually produced methane of solid manure.
Methane ProductionNumber of AnimalsManure ProductionsD/YFarm Methane Production per Year
m3/Mg FManimalkg FM/animal/daydaysm3 CH4
46.1260024.5365247,460.99
Table 7. Energetic and economic calculations of produced methane.
EeEtPePtElectricity IncomeHeat Income
MWh/yearMWEUR/year
986.6761110.0110.1200.135157,868.23439,960.397
Table 8. Economic balance of the analyzed scenarios (with or without biogas plant).
ParametersScenario IScenario II
Income or Costs kEUR/Year
Manure as fertilizer55.8
Digestate as fertilizer 17.36
Electricity 157.87
Heat 39.96
Carbon emissions allowances−11.263
Economic balance44.54215.19
Table 9. Energetic and economic calculations of produced methane using straw as a substrate.
ParametersValueUnite
Mass of straw2950Mg/year
Methane yield265.72m3/Mg
Methane production783,874m3
Ee3125.50MWh/year
Et3516.15MWh/year
Et12,658.12GJ/year
Pe0.38MW
Pt0.43MW
Electricity income500,074EUR/year
Heat income126,581EUR/year
Table 10. Economic balance for manure management with and without biogas plant.
ParametersScenario IScenario II + (0.5 MW)
Income or Costs kEUR/Year
Manure as fertilizer55.8
Digestate as fertilizer 42.16
Electricit 657.94
Heat 126.58
Straw cost −100.30
Service costs and others −77.00
Depreciation −131.58
Carbon emissions allowances−11.26-
Economic balance44.54517.81
Profit of Scenario II +473.27
kEUR
Investment1970
year
Payback period4.2
Table 11. Emissions reduction on potential of various strategies of the manure affecting.
Strategy Affecting the ManurePotential Mitigating Effect *
CH4N2O
Solid-liquid separation+
Anaerobic digestion++
Decreased storage time++
Frequent manure removal++
Phase feedingxx
Reduced dietary proteinx~
Nitrification inhibitorsx~/+
No grazing on wet soil
Increased productivity++
* + = ≥30% mitigating effect; ~ = 10–30% mitigating effect; − = ≤10% mitigating effect; x—no data enabling an unambiguous assessment; based of Grossi [5].
Publisher’s Note: MDPI stays neutral with regard to jurisdictional claims in published maps and institutional affiliations.

