Article

Energetic and Economic Performances of the Energy Community of Magliano Alpi after One Year of Piloting

1
Department of Electrical and Electronic Engineering, University of Cagliari, 09123 Cagliari, Italy
2
Nesosnet, Via Bacco 5, Elmas, 09030 Cagliari, Italy
3
Energy Center Politecnico di Torino, Via Paolo Borsellino 38, 10138 Turin, Italy
4
GoCER, Via Langhe 91, Magliano Alpi, 12060 Cuneo, Italy
*
Author to whom correspondence should be addressed.
Energies 2022, 15(19), 7439; https://doi.org/10.3390/en15197439
Submission received: 3 August 2022 / Revised: 28 September 2022 / Accepted: 7 October 2022 / Published: 10 October 2022
(This article belongs to the Special Issue Energy Communities Implementation)

Abstract

:
Italy’s first renewable energy community, located in the municipality of Magliano Alpi, was established under Italian Law 8/2020 on Energy Communities in December 2020. The community is composed of eight stakeholders and involves, in addition to public buildings in the municipality of Magliano Alpi, some residential users and small and medium-sized enterprises, realizing public–private cooperation aimed at reducing energy dependence on the public grid and, at the same time, contributing to the decarbonization of the energy sector. This article provides an analysis of the economic and energy performance during the first year of renewable community piloting. The study analyzes data collected with the community energy management system and introduces a number of key performance indices useful for evaluating further development and optimization options.

1. Introduction

Energy communities play a key role in the energy transition program outlined by the European community as they can attract private sector investment and contribute to the process of public acceptance of energy projects aimed at harnessing renewable resources. In addition, the benefits to community members cover multiple areas and are not only limited to alleviating electricity bills, but also to reducing pollution and revitalizing local economies through the creation of new jobs. Before the European directives, energy communities were already included in one form or another in the regulatory framework of some European countries. Some energy cooperatives were already actively involving citizens, and examples useful to understand and facilitate their development are dislocated all around Europe [1,2,3]. In the United Kingdom (UK), the term “energy community” has been used since the 1990s [4]. For a proper realization of such projects, the skills of professionals from different fields of investigation are required [5]. A crucial part of renewable energy projects concerns the acceptance by local community members [6,7], and social acknowledgement is to be considered a key driver to properly and fully realize renewable energy projects. These are going to require proper financing mechanisms [8,9] since the desired benefits of the energy transition come at a cost [10] given that the new installation of assets implies upfront costs that some users need to pay. Renewable energy communities (RECs) are a recent socio-technical paradigm with the ability to involve heterogeneous disciplines that bring together the digitization and development of the electricity system with the possibility to create and develop new business models that can actively engage users generating economic and environmental benefits [11,12].
RECs are entities capable of widespread penetration of solar renewable energy production, contributing significantly to the increase in installed capacity and the goals of the energy and ecological transition. At the moment of writing, in Italy, the photovoltaic (PV) installed power is approximately 22 GW [13], and in 2020, approximately 11% of the electricity generation was attributable to such technology [14]. By 2050, the installed photovoltaic capacity in Italy is expected to be more than 200 GW [15]. A relevant part of this future renewable generation is likely to be achieved by the creation of novel energy communities. This expected development could lead to a condition similar to that of Germany, where there are approximately 800 energy cooperatives (similar to RECs in Italy) with more than 200,000 members. In 2020, these renewable plants produced 8.8 TWh of renewable energy, or 31.7% of the country’s total photovoltaic production.
This paper is specifically focused on the Magliano Alpi (Cuneo, CN, Italy) renewable energy community, established in December 2020, which partnered with eight stakeholders, and its strategic objective is to use local electricity production as a catalyst for sustainable development of the municipality [16]. According to the goals of the Renewable Energy Directive (RED II) [17] and the Electricity Market Directive (IEM) [18], stakeholders, particularly citizens, are expected to play an increasingly active role in the development of energy projects. It has been assessed that through their cooperation they can foster the inclusiveness and acceptance of the project [19,20,21,22,23], with the aim to exploit locally produced renewable energy. With the new regulations, it will also be possible to leverage public–private partnerships to achieve goals related to the decarbonization of the electricity system, as well as boosting the digitization of the energy system and encouraging peer-to-peer energy exchange [24,25]. It is believed that the process of democratizing energy dictated by the energy transition can act as a driver for social transformations and technological innovations [19,26]. To reach such objectives, thorough planning, design, and governance of the RECs are required [27,28].
The REC in Magliano Alpi was built in compliance with Law 8/2020 [29], which specified precise requirements for the establishment of experimental energy communities and included limits on the location of consumers and producers, which had to be connected to the same medium/low-voltage (MV/LV) electrical substation. The maximum production power of 200 kW of the facilities serving the community was also put as a constraint. During the past year, some legal requirements have been revised; in fact, the maximum power of the individual plant eligible for incentives serving energy communities has been increased up to 1 MW. The geographical perimeter of the REC has been extended as well to include the entire range of the primary high/medium-voltage (HV/MV) cabin feeding the energy community users [30]. With the removal of the limitations of the initial regulatory barriers, RECs can now also take part to achieve more extensive objectives regarding energy efficiency [31] and can also provide flexible services to the grid [32] and other benefits to its members [33]. Magliano Alpi’s experience is particularly interesting as it provides insight into the avoided energy costs that its members benefit from and demonstrates the role that RECs could play in a scenario where energy prices are soaring, in part due to the rising costs of gas and fossil fuel. This increase started well before the conflict in Ukraine, but a critical threshold for end users has been reached and EU member states are now required to take additional measures for energy supply and security. If produced locally, electricity may not be conceived as a commodity, but as an added value to the local territory, and as such, it is important to produce and use as much of it as possible.
In the paper, the authors provide a detailed analysis of the electrical energy production and consumption of the energy community. The energy and economic analyses presented are carried out based on data collected during the year 2021, also for the purpose of verifying the soundness of the preliminary studies and forecasts made during the REC design phase and the number of users involved in the original community core. The comparison between the “as-is” situation and the expectations anticipated during the planning phase is also of relevance for identifying improvement actions to define the future “to-be” scenario. The analysis presented has been conducted considering the community’s point of view, although point of delivery (POD) data from each utility were retrieved and used to calculate the statistics that characterize the community. The authors decided not to conduct analyses related to individual loads to respect users’ privacy. However, personal load profiles and user statistics are necessary to calculate the metrics that could generate useful insights and be helpful during the process of redistributing economic revenues among the members of the REC. Of undoubted importance for community performance is the behavior of active users who, by adapting their consumption attitudes, can significantly contribute to the improvement of the community’s energy statistics, which, consequently, leads to an increase in perceived economic benefits. Other solutions to retain the locally generated value, i.e., the renewable energy produced by the production facilities, have been provided in the discussion section. To achieve such objectives, the locally produced energy should be consumed within the perimeter of the REC. A series of new key performance indicators (KPIs) have been expressly designed to evaluate the REC performance, and a comparison between the “as-is” scenario and a “could-be” scenario, generated by applying a load shifting function to the members’ loads, has been realized. The assessment of the performance of the first Italian REC is of utmost importance to validate the feasibility of such innovative forms of local production and consumption in the Italian context.
The next sections of the manuscript will summarize the general characteristics of the REC of Magliano Alpi. Then, the dataset obtained from the REC’s energy management platform is presented and analyzed. Finally, the results are discussed, and important insights related to the results of the study are presented.

2. Materials and Methods

In this section, an overview of the main features of the Magliano Alpi energy community is presented. Then, the quantities of interest and the metrics employed in the following sections of the article to assess the community’s performance will be presented and analyzed.

2.1. Magliano Alpi REC General Characteristics

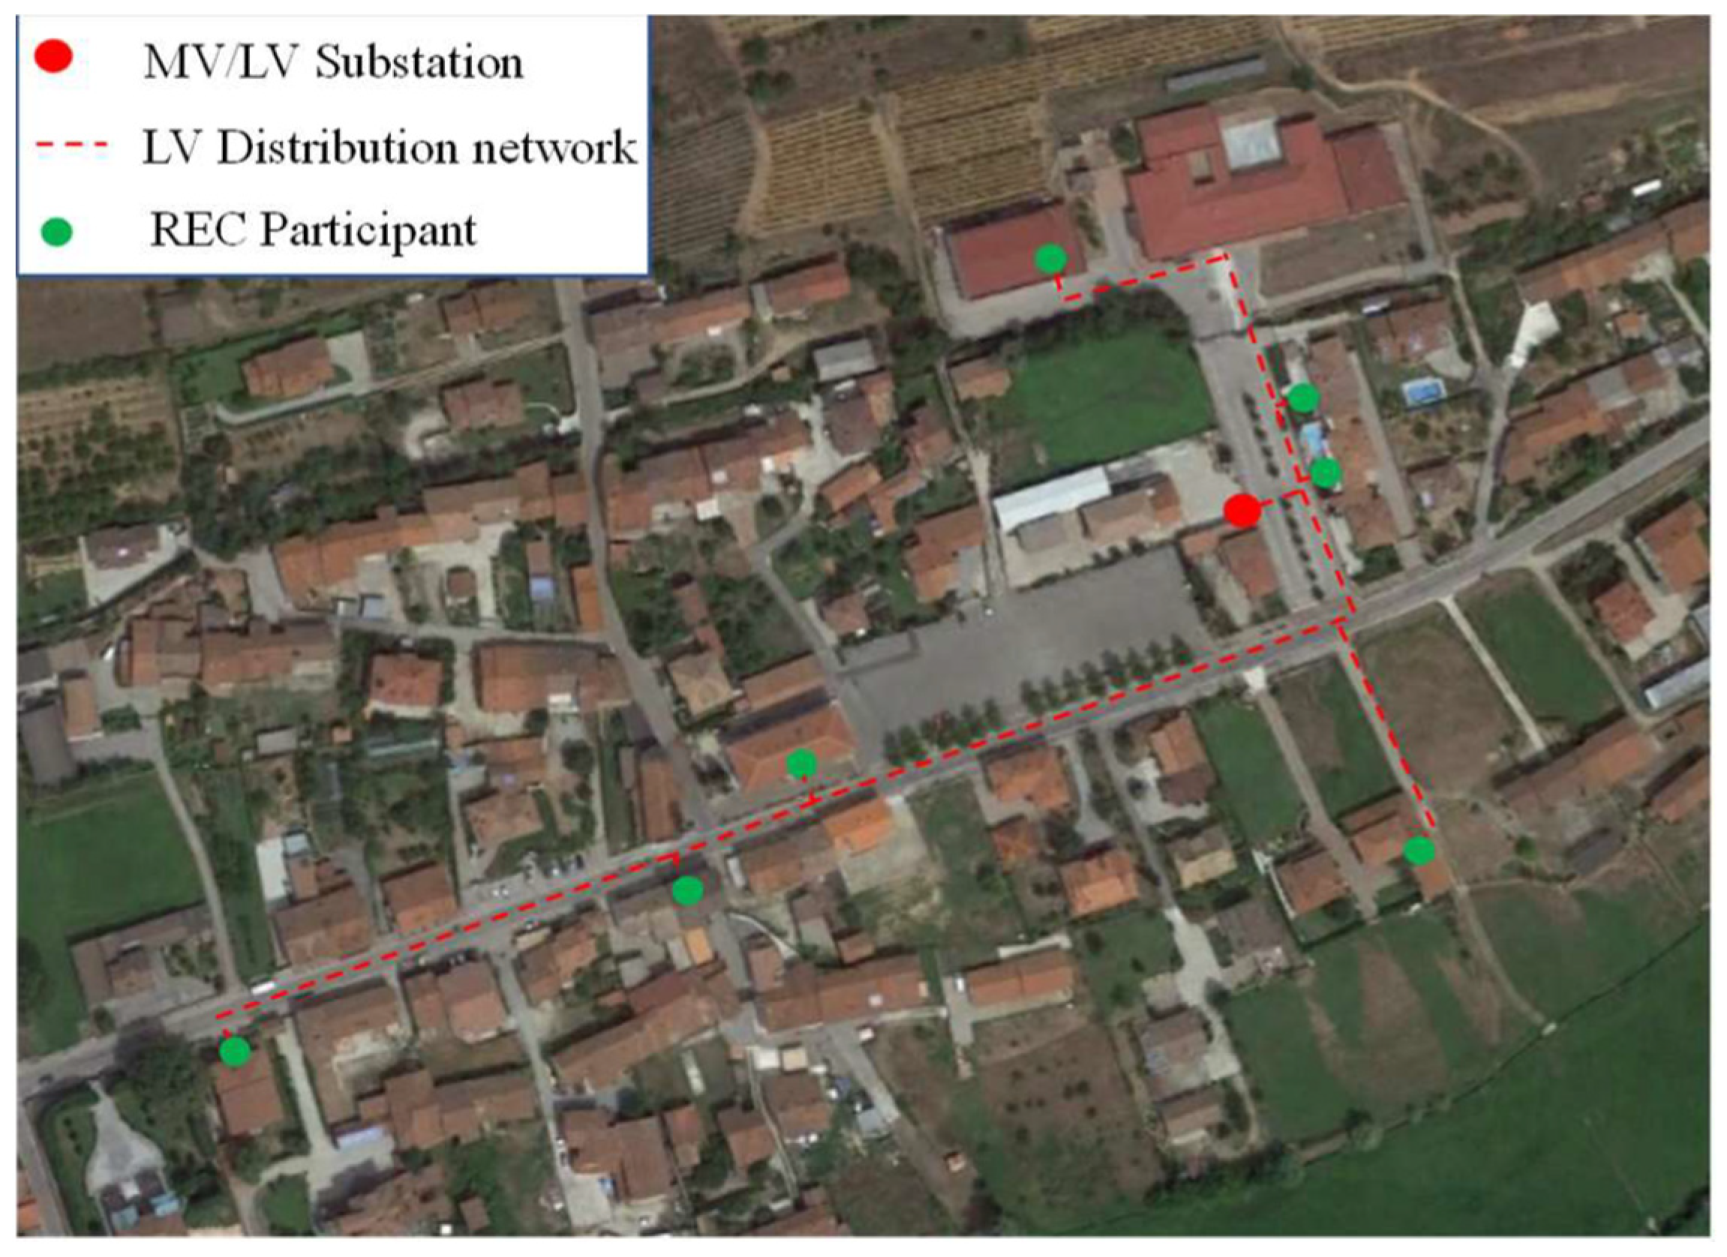
Figure 1 presents an aerial view of the REC of Magliano Alpi where the distribution network, the MV/LV substation, and the location of the participants are highlighted. 
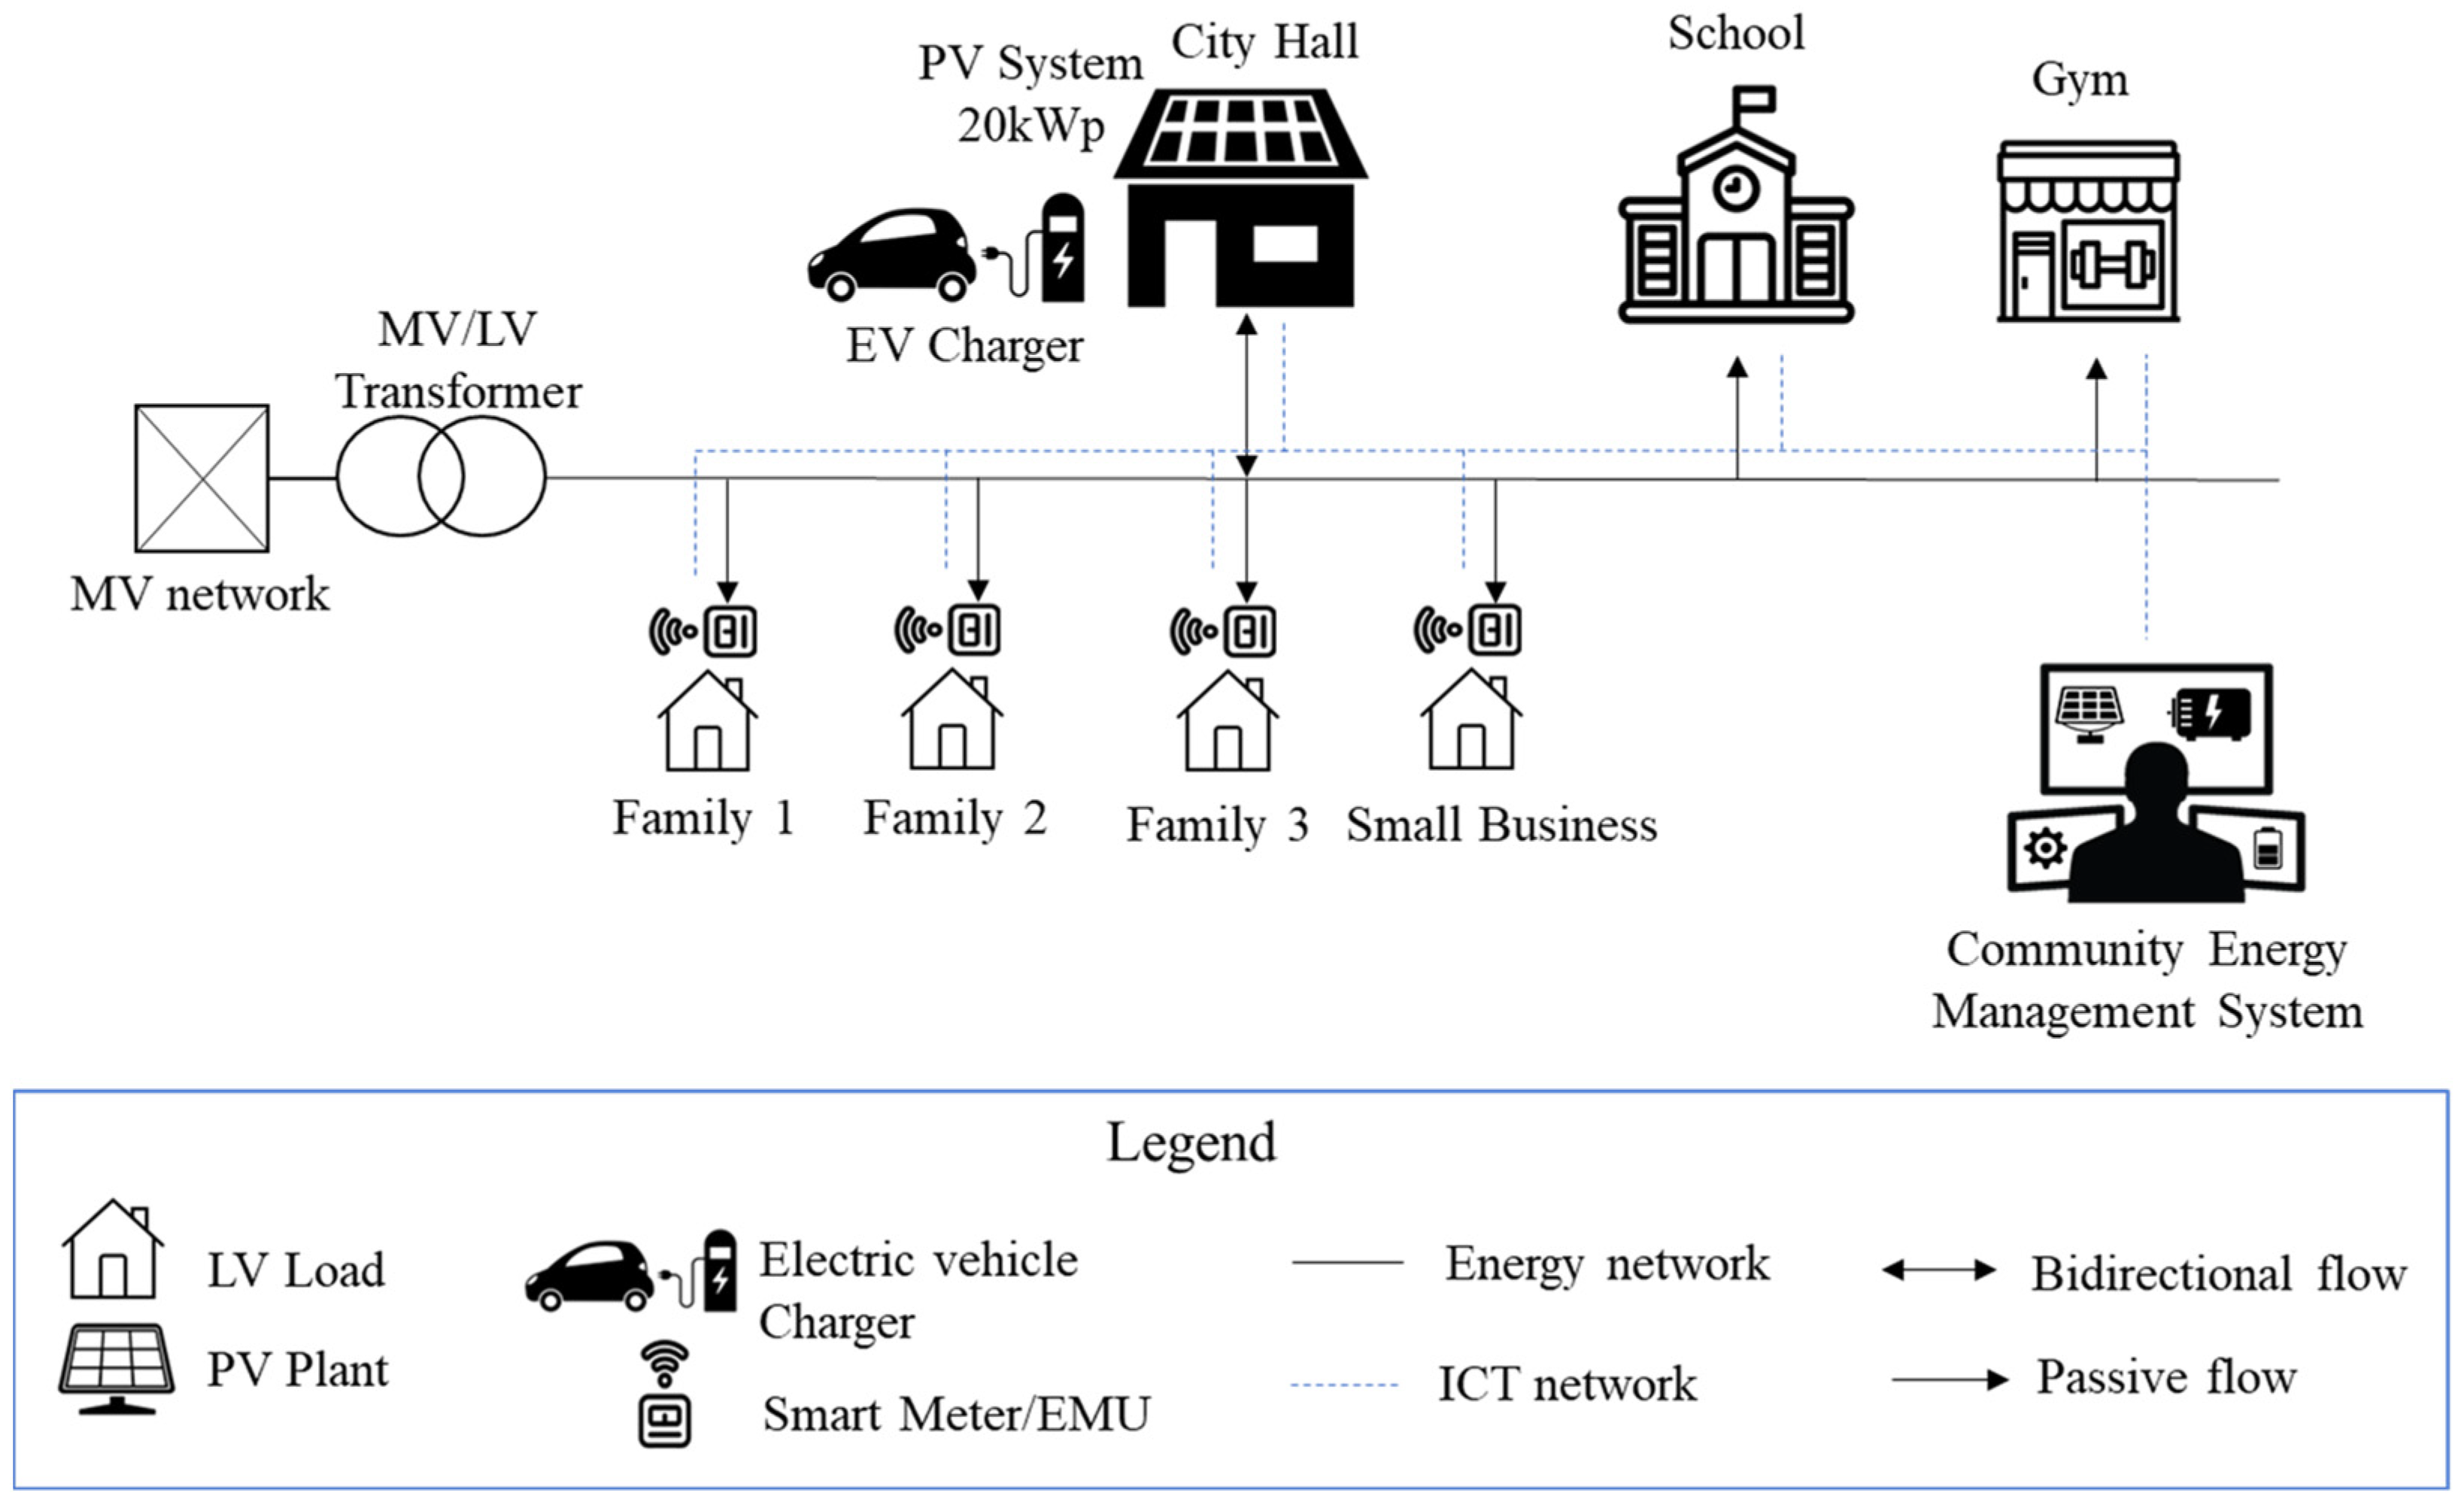
Figure 2 shows a simplified scheme of the distribution network and the users of the REC.
The energy community manages a photovoltaic system whose energy is shared with some municipal buildings, a small manufacturing company, and three families that joined the REC under the call of the municipality. The PV system is installed on the rooftop of the town hall. The energy production is used to power the load of the building, as well as an electric vehicle (EV) charging plug, which can be used by the citizens free of charge. The PV plant is composed of 60 modules of 330 kWp each for a nominal power of 19.80 kWp. The total annual energy output was estimated at 24,198 kWh/year. Table 1 summarizes the annual energy consumption and the bill paid by the members of the community.
The data on which this analysis is based were recorded with smart meters (SM) installed at end users’ premises. SMs are crucial in the implementation of a REC as they allow one to increase the knowledge of energy usage and production for the purpose of energy and market management [34]. Smart metering systems allow the implementation of effective demand response and flexibility, enabling an interaction among the user, third parties (e.g., aggregators), and network and market operators [35,36,37]. The SMs are used to continuously save bidirectional information on active and reactive power and phase angle measurements, both in single and three-phase modes. The measurements were performed according to the European MID directive [38]. Data are accessible via a software platform that allows the exchange of information with internet of things (IoT) appliances and the energy management system.
Data were provided in an excel file and analyzed using Python programming language using the Pandas and Scipy libraries. The SMs registered the initial raw data, which consist of measurements of active energy fed to and withdrawn from the grid detailed per POD code, but also in an aggregated form already summarized for the community. A dedicated meter was installed to measure the PV production. Data registered from the individual SMs went through a control and cleaning procedure. Then, data relative to the measurements of the single SM were aggregated to obtain information at a community level. Said information was then compared to those registered to verify for any discrepancies. The consistency between measured and stored information was the object of assessment. Power consumption and production data were stored hourly as a cumulative quantity. To perform evaluations on different periods. it was necessary to proceed to the calculation of differential quantities. It was then possible thanks to the fact that an SM was installed in correspondence with the PV plant to compute the self-consumption of the REC members. In the case under analysis, only the municipality building can self-consume the energy produced since the only production plant is located on its roof.

2.2. Performance Metrics Used to Evaluate the Energy Community

One of the objectives of the present paper was to provide a focus on a broader perspective, suitable for an evaluation of the Magliano Alpi REC, that can be generalized for other energy communities with similar characteristics that have been implemented according to Italian regulations. For this reason, the authors defined and used some key performance indexes in this study that can be generalized and used to analyze and compare the energetic and economic performance of any energy community. To analyze the energetic performance of the REC, the parameters are defined and calculated in Table 2 for the REC.
In the case under analysis, the connection points were the REC’s users and the metrics were calculated according to the technical rules [39] provided by the GSE (“Gestore dei Servizi Energetici”—Energy Services Manager). 
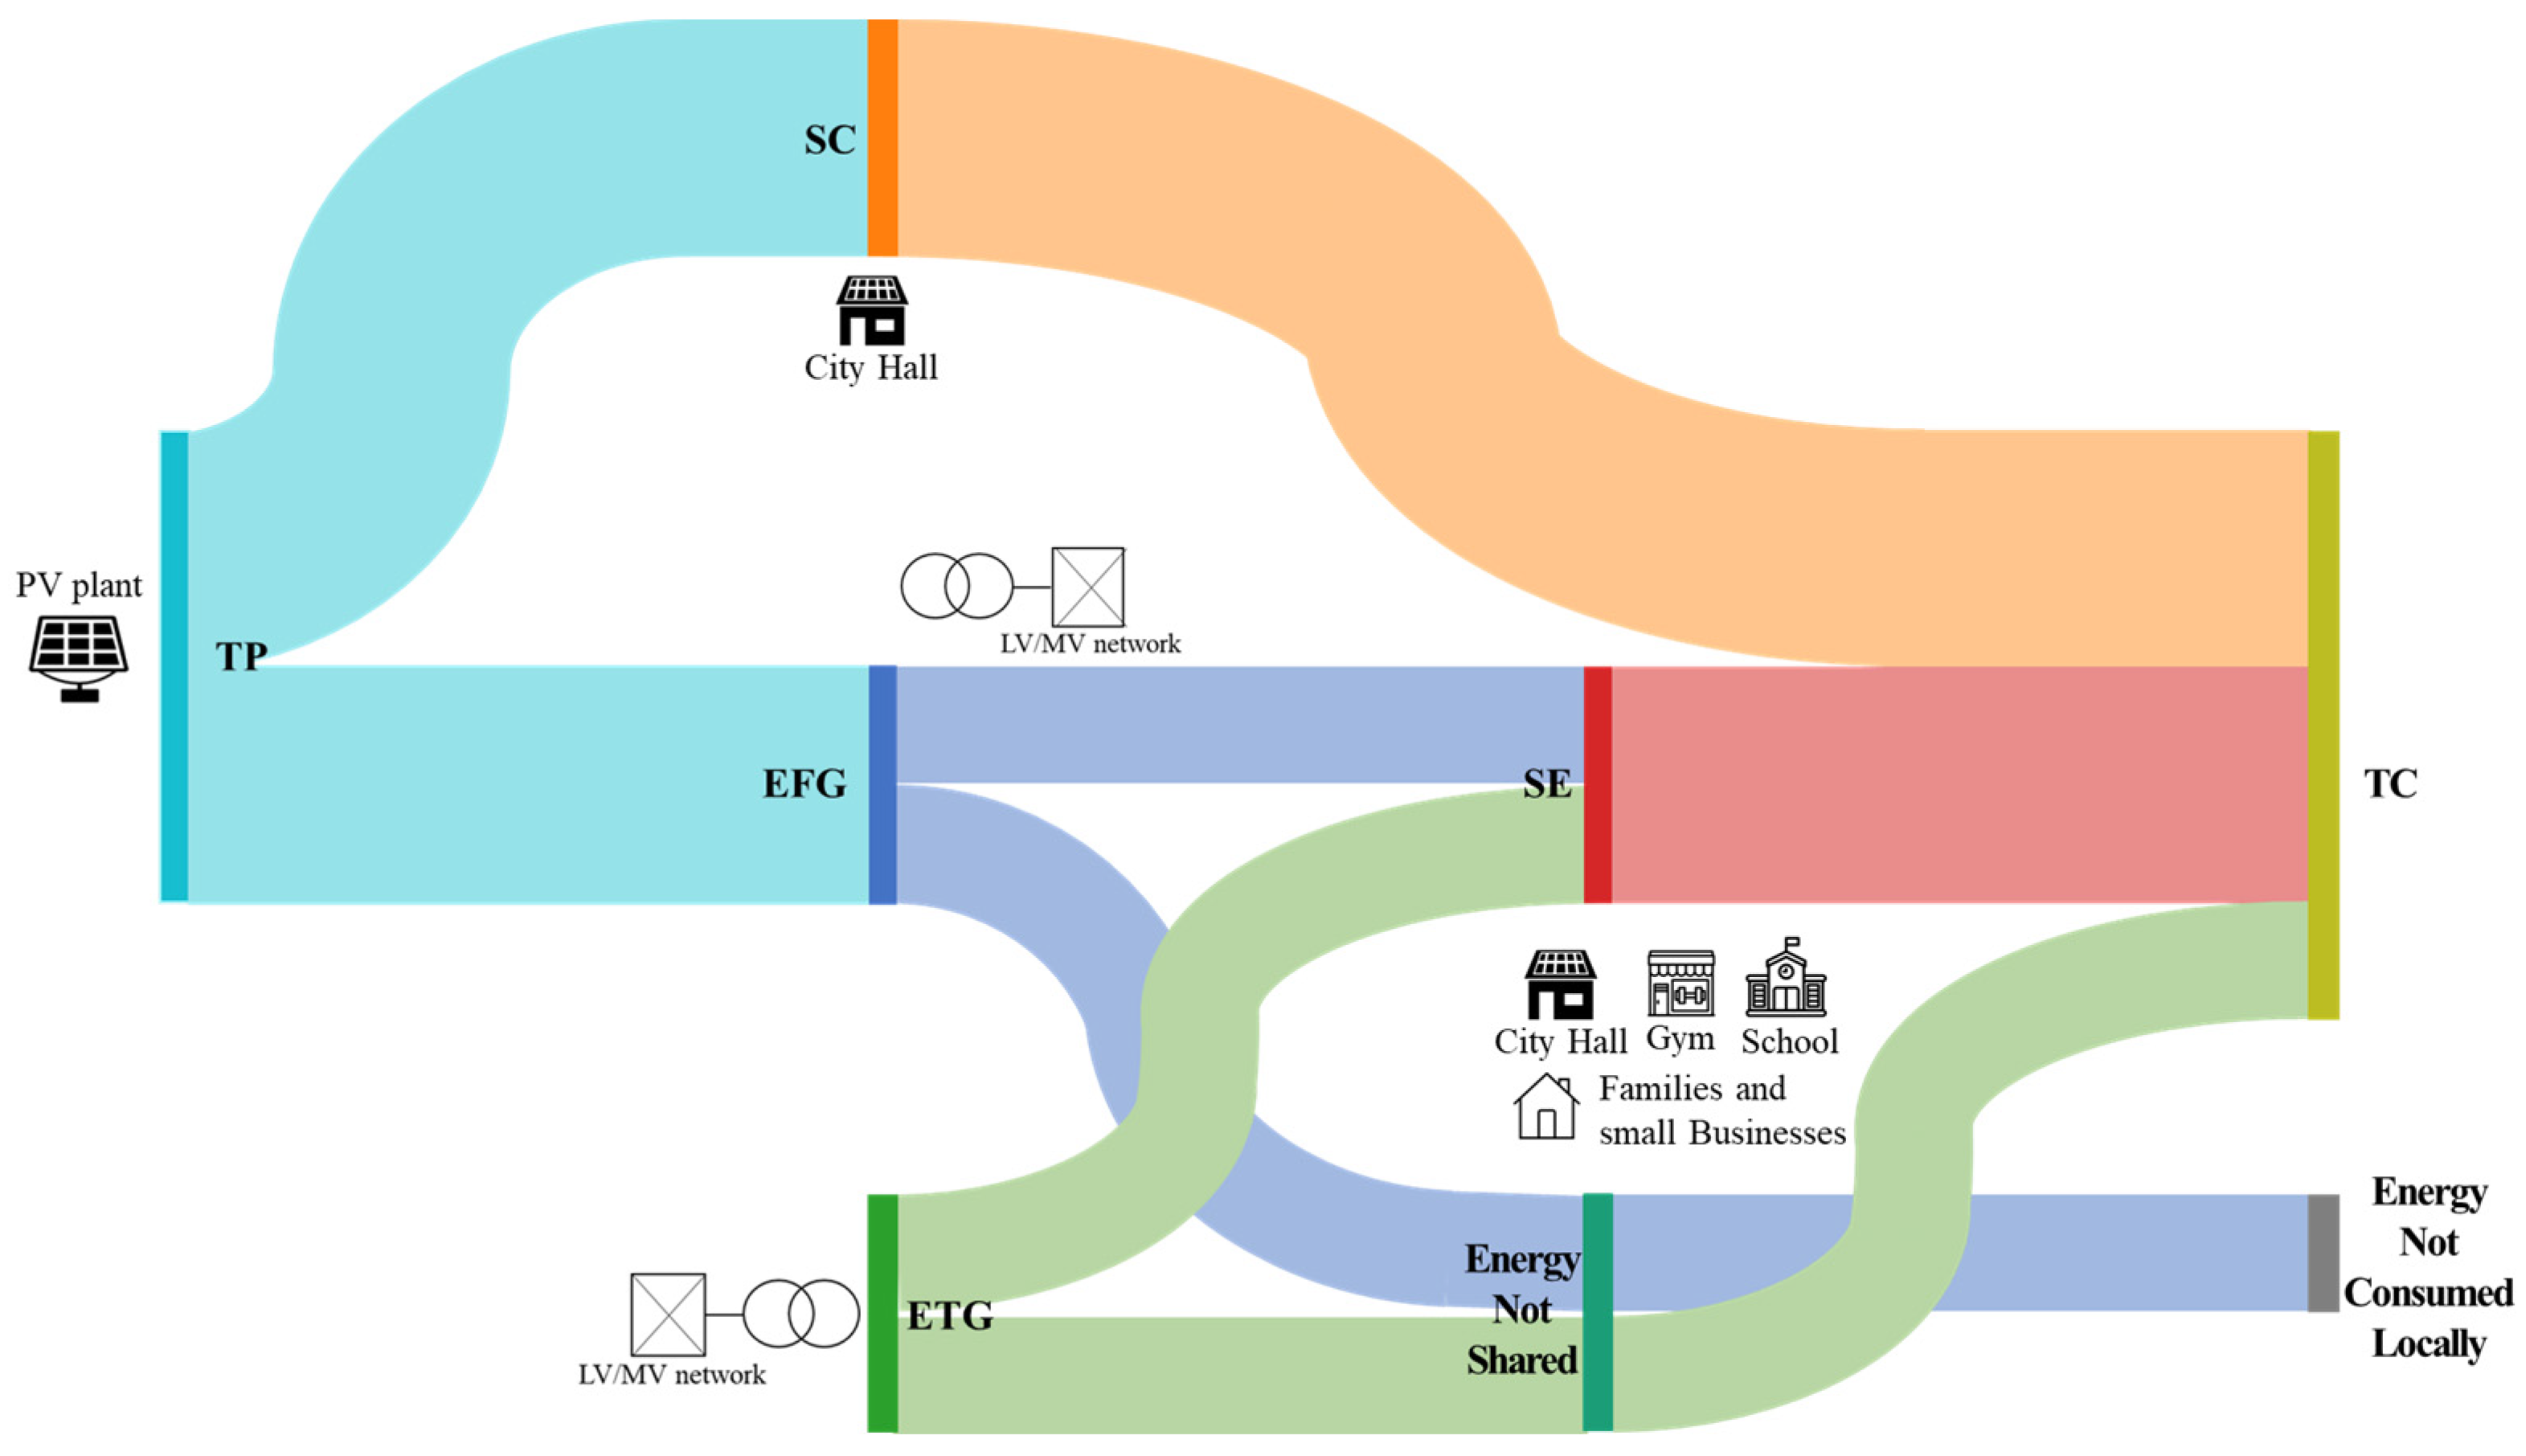
Figure 3 presents an explanatory graph of the REC’s energy flows in which the parameters of interest presented in Table 2 are reported. The graph also displays the constituents of the REC itself in terms of facilities and members in proximity to the quantities to which they contribute.
Let CP b the number of connection points in the REC (i.e., the number of members). It is possible to define TCh, the total consumed energy for the h-th hour, as the sum of the energy withdrawn from the grid and the self-consumed energy over the same period:
T C h = y = 1 C P E T G y , h + S C y , h
The total energy consumed by a single user, TCy,h can then be calculated by fixing the y-th index. The energy self-consumed by the y-th connection point (i.e., a user in the community) on the h-th hour can be expressed as the difference between the energy produced and the energy it injects into the grid.
S C y , h = T P y , h E F G C P y , h
The total energy self-consumed by the community, over the h-th hour, can then be calculated as:
S C h = y = 1 C P T P y , h E F G C P y , h ,
The energy exported to the grid by the community, relevant to our studies, during the hour h can be expressed as the sum of the energy exported by every y-th connection point:
E F G h = y = 1 C P E F G C P y , h ,
The energy withdrawn from the grid during the hour h is the sum of the energy withdrawn from each connection point in the configuration:
E T G h = y = 1 C P E T G C P y , h ,
Thus, the shared energy at the h-th hour is calculated as:
S E H h = min ( y = 1 C P E F G C P y , h ; y = 1 C P E T G C P y , h ) ,
The first argument of the min function in Equation (6) is the total energy injected into the grid by the REC, whilst the second term is the energy withdrawn from the grid. Hence, for example, the shared energy for month “M” can be calculated by computing the shared energy of every single hour for every single day of the month as in (5):
S E M = d = 0 D M h = 0 23 S E H h d ,
where DM is the number of days in the M-th month.
It is essential to understand that the designed metrics can be obtained for different time frames and, within this scope, have been computed mostly over a monthly interval. In the following, SEj will be used to indicate the shared energy for the general period, depending on the granularity of the conducted analysis. It is important to point out that in the above equations, the value for the shared energy (SEj) at the j-th period is computed by aggregating the values calculated with definition (6).
In general, the locally produced energy is self-consumed by the city hall, and the production excess is fed into the grid. The community meets its electrical demand by withdrawing electricity from the grid. This can either be produced locally or produced and fed into the grid by third parties. The law for determining the amount of shared energy is formulated in Equation (6). The total energy consumption of the community is calculated as the sum of the self-consumption and the withdrawals from the grid. The energy that is withdrawn from the grid can be referred to as either shared energy or non-shared energy, depending on the governing law. The energy injected into the grid that is not counted in the shared energy is effectively an excess of production and can be considered a loss of local value since it is not consumed locally. To maximize the local retention of value, i.e., the energy produced by the REC’s facility, it is necessary to maximize the shared energy. This goal, as is well known, can be achieved by synchronizing production and consumption, but also by introducing storage systems that allow the consumption of locally produced green energy to be deferred. However, in the case under consideration during the financial planning and design phase and of the community, storage systems were not considered. Such systems would undoubtedly allow for a substantial increase in the community’s energy performance, but not necessarily in the economic performance given the high investment costs.
Table 3 briefly summarizes the KPIs that have been developed and employed to conduct the analysis of the REC.
A more thorough description of the equations employed to compute the parameters used in the study is reported in the following:
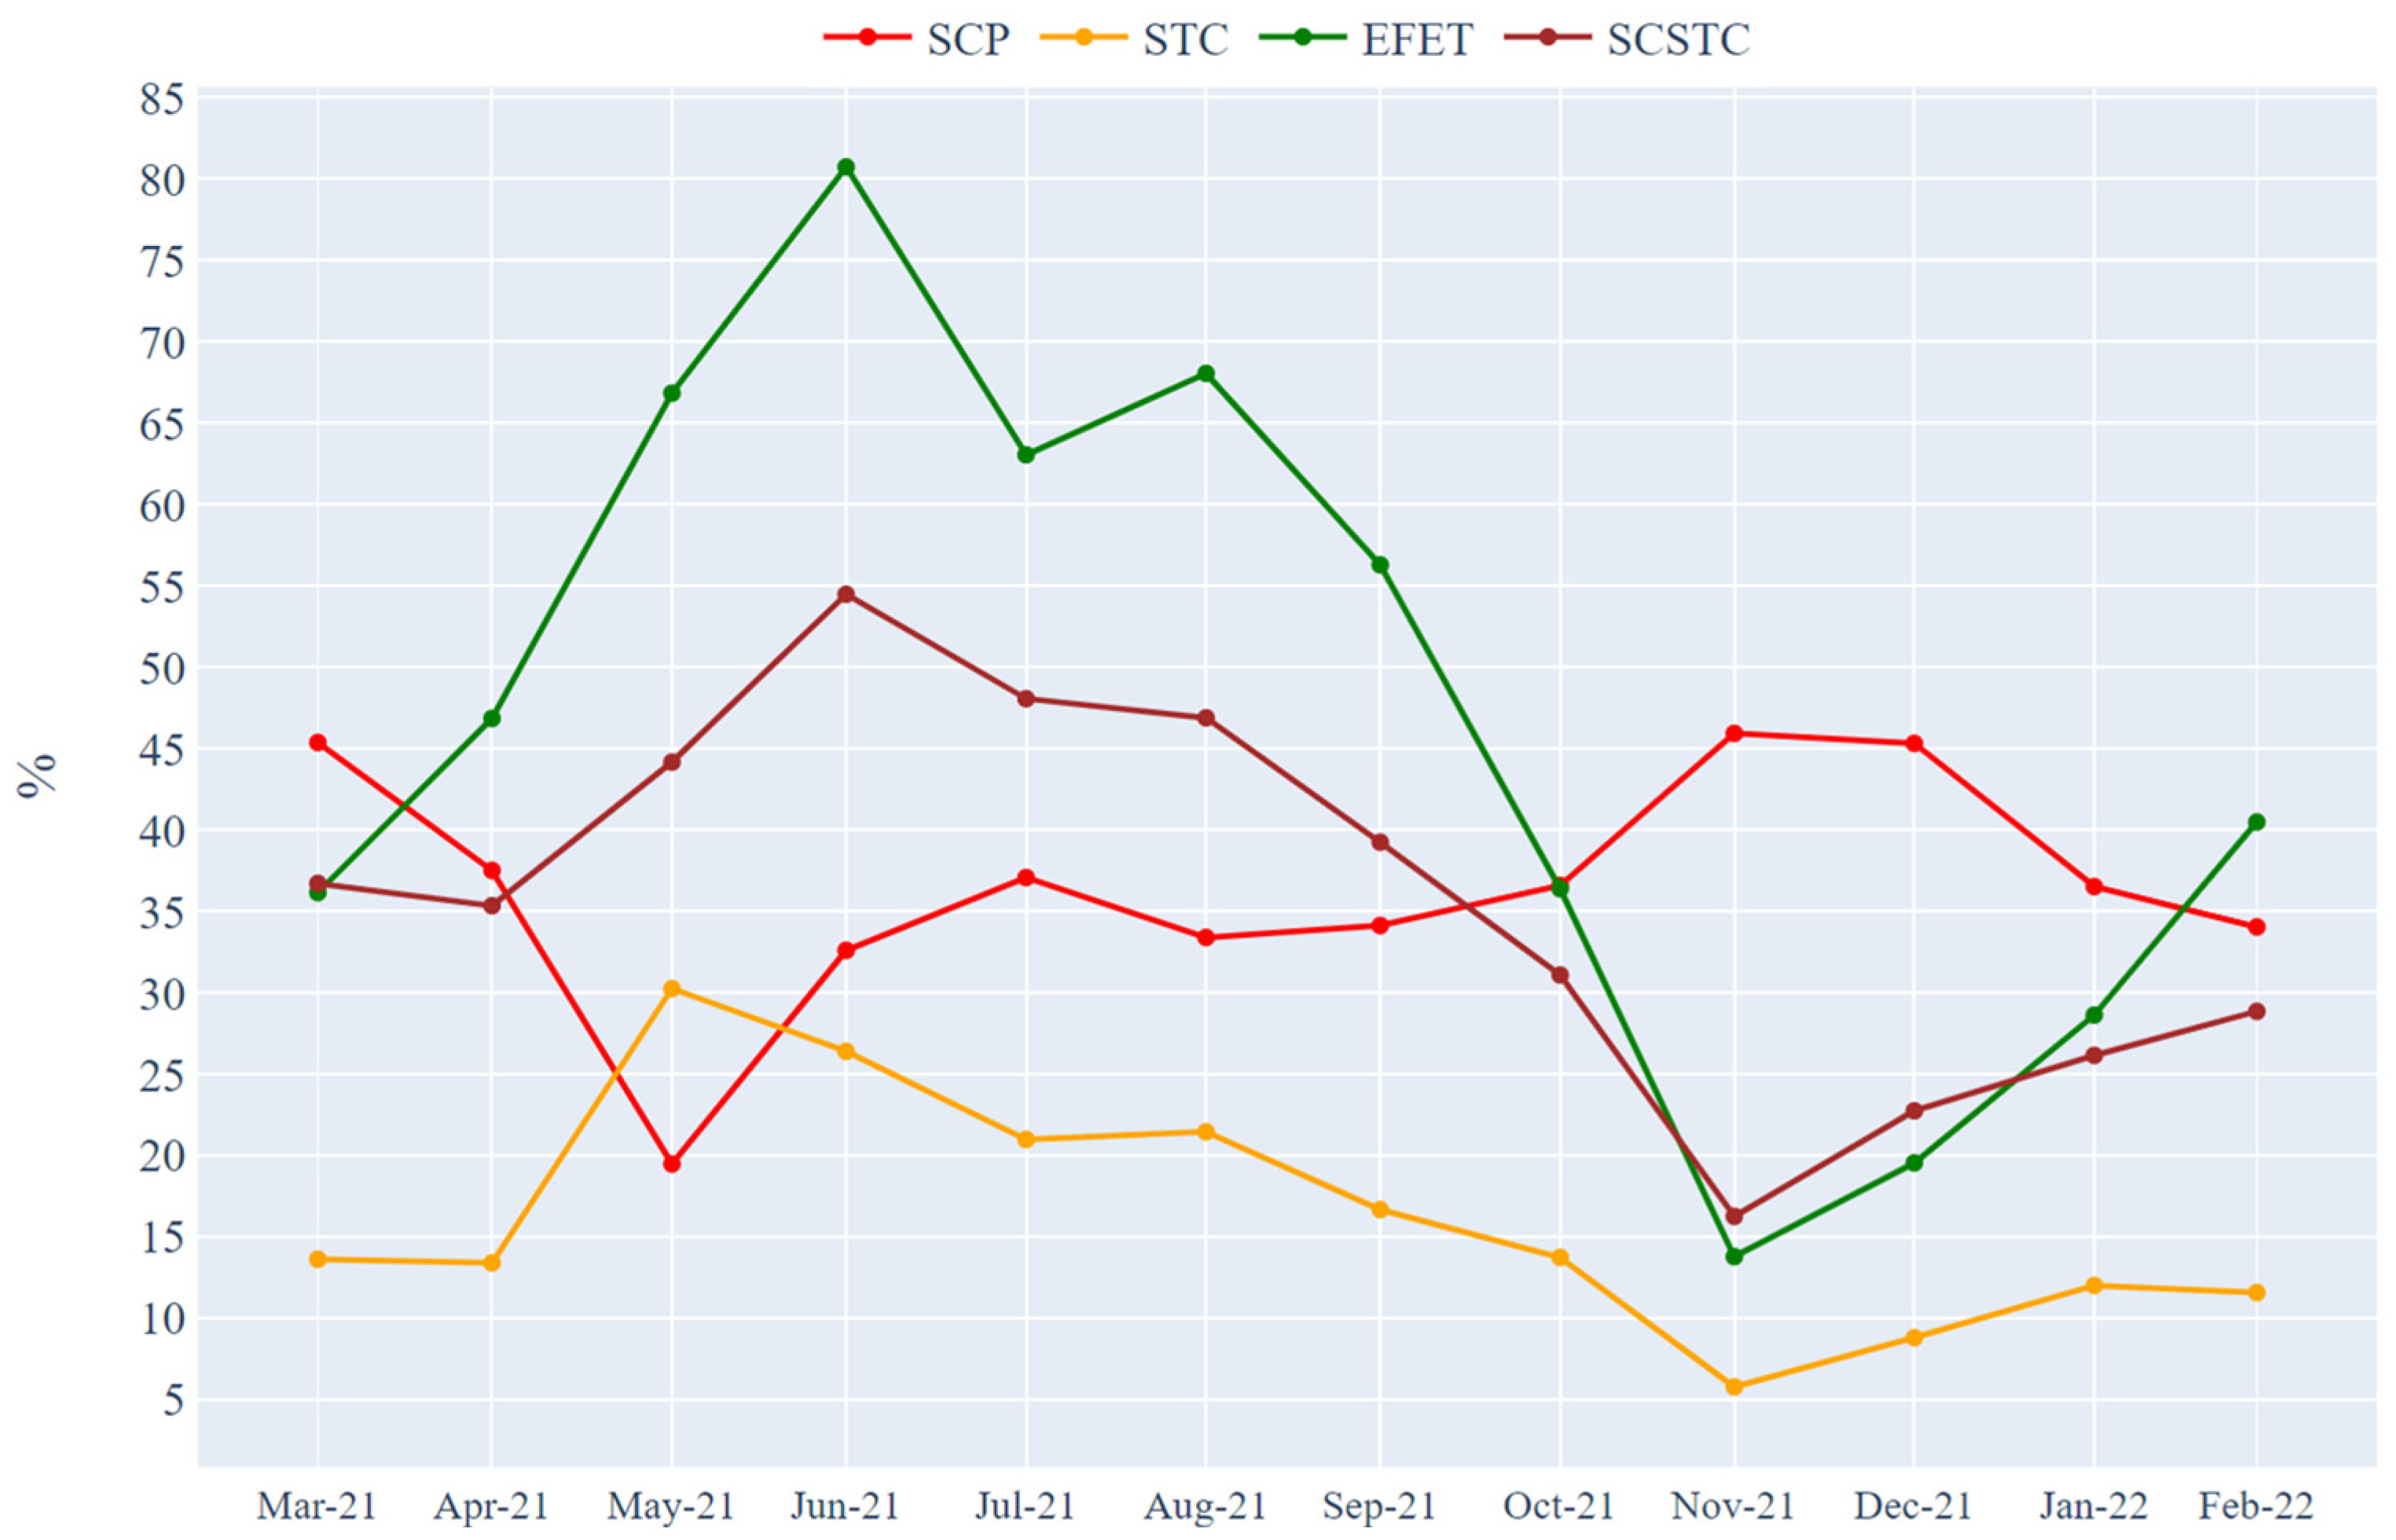
  • SCP is defined as the total energy self-consumed over the total energy produced by the PV plant for the general j-th period in analysis. This metric is informative about the ability of instant physical self-consumption of the energy produced by the PV plant.
    S C P = j N S C j   j N T P j · 100 ,
    where N is the number of periods over which the parameter is computed, SCj (kWh) is the self-consumed energy over the j-th period, and TPj (kWh) is the total energy produced over the j-th period.
  • STC is defined as the shared energy over the total energy consumed by the community. The parameter thus defined provides information about the ability of the community to meet its energy needs through locally produced energy.
    S T C = j N S E j   j N T C j · 100 ,
    where SEj is the total energy shared over the j-th period and TCj is the total energy consumed over the same period.
  • EFET is defined as the energy fed to the grid over the energy withdrawn from the grid. If greater than 100, the energy fed to the grid exceeds that withdrawn. This parameter provides a general idea of whether the PV plant for the community is balanced.
    E F E T = j N E F G j   j N E T G j · 100 ,
    where EFGj (kWh) and ETGj (kWh) are, respectively, the energy fed and withdrawn to and from the grid over the j-th period.
  • SCSTC is defined as the ratio of the sum of the total self-consumed energy and the shared energy over the total energy needs.
    S C S T C = j N S C j + S E j   j N T C j · 100 ,
SCSTC has been designed with the aim to evaluate the ability of the community to satisfy its energy demand with valorized and incentivized energy. Self-consumption can be considered an avoided expense whilst the shared energy is incentivized by the State. Hence, the KPI relates quantities that can provide economic benefits to the community in relation to its total consumption. On the other hand, if the interest is to evaluate the sustainability of the REC, it is possible to achieve such a result by jointly considering the EFET and SCSTC KPIs to understand whether the community is taking advantage of the economic incentives in relation to the energy locally produced. Ideally, the maximum incentive for shared energy is received when the energy (on an hourly basis) supplied by the grid equals the energy injected. The EFET determines the maximum theoretical achievable percentage for the period. If EFET is equivalent to 100 for each month, the REC would (theoretically) be able to balance its grid withdrawals with its inputs while maximizing the perceived sharing incentive. The SCSTC parameter, on the other hand, considers both physically self-consumed energy and energy valid for the sharing incentive to relate them to the energy needs. Moreover, in this case, a value as high as possible is preferred as it means a greater saving for the community and, at the same time, the ability to maximize the shared energy.
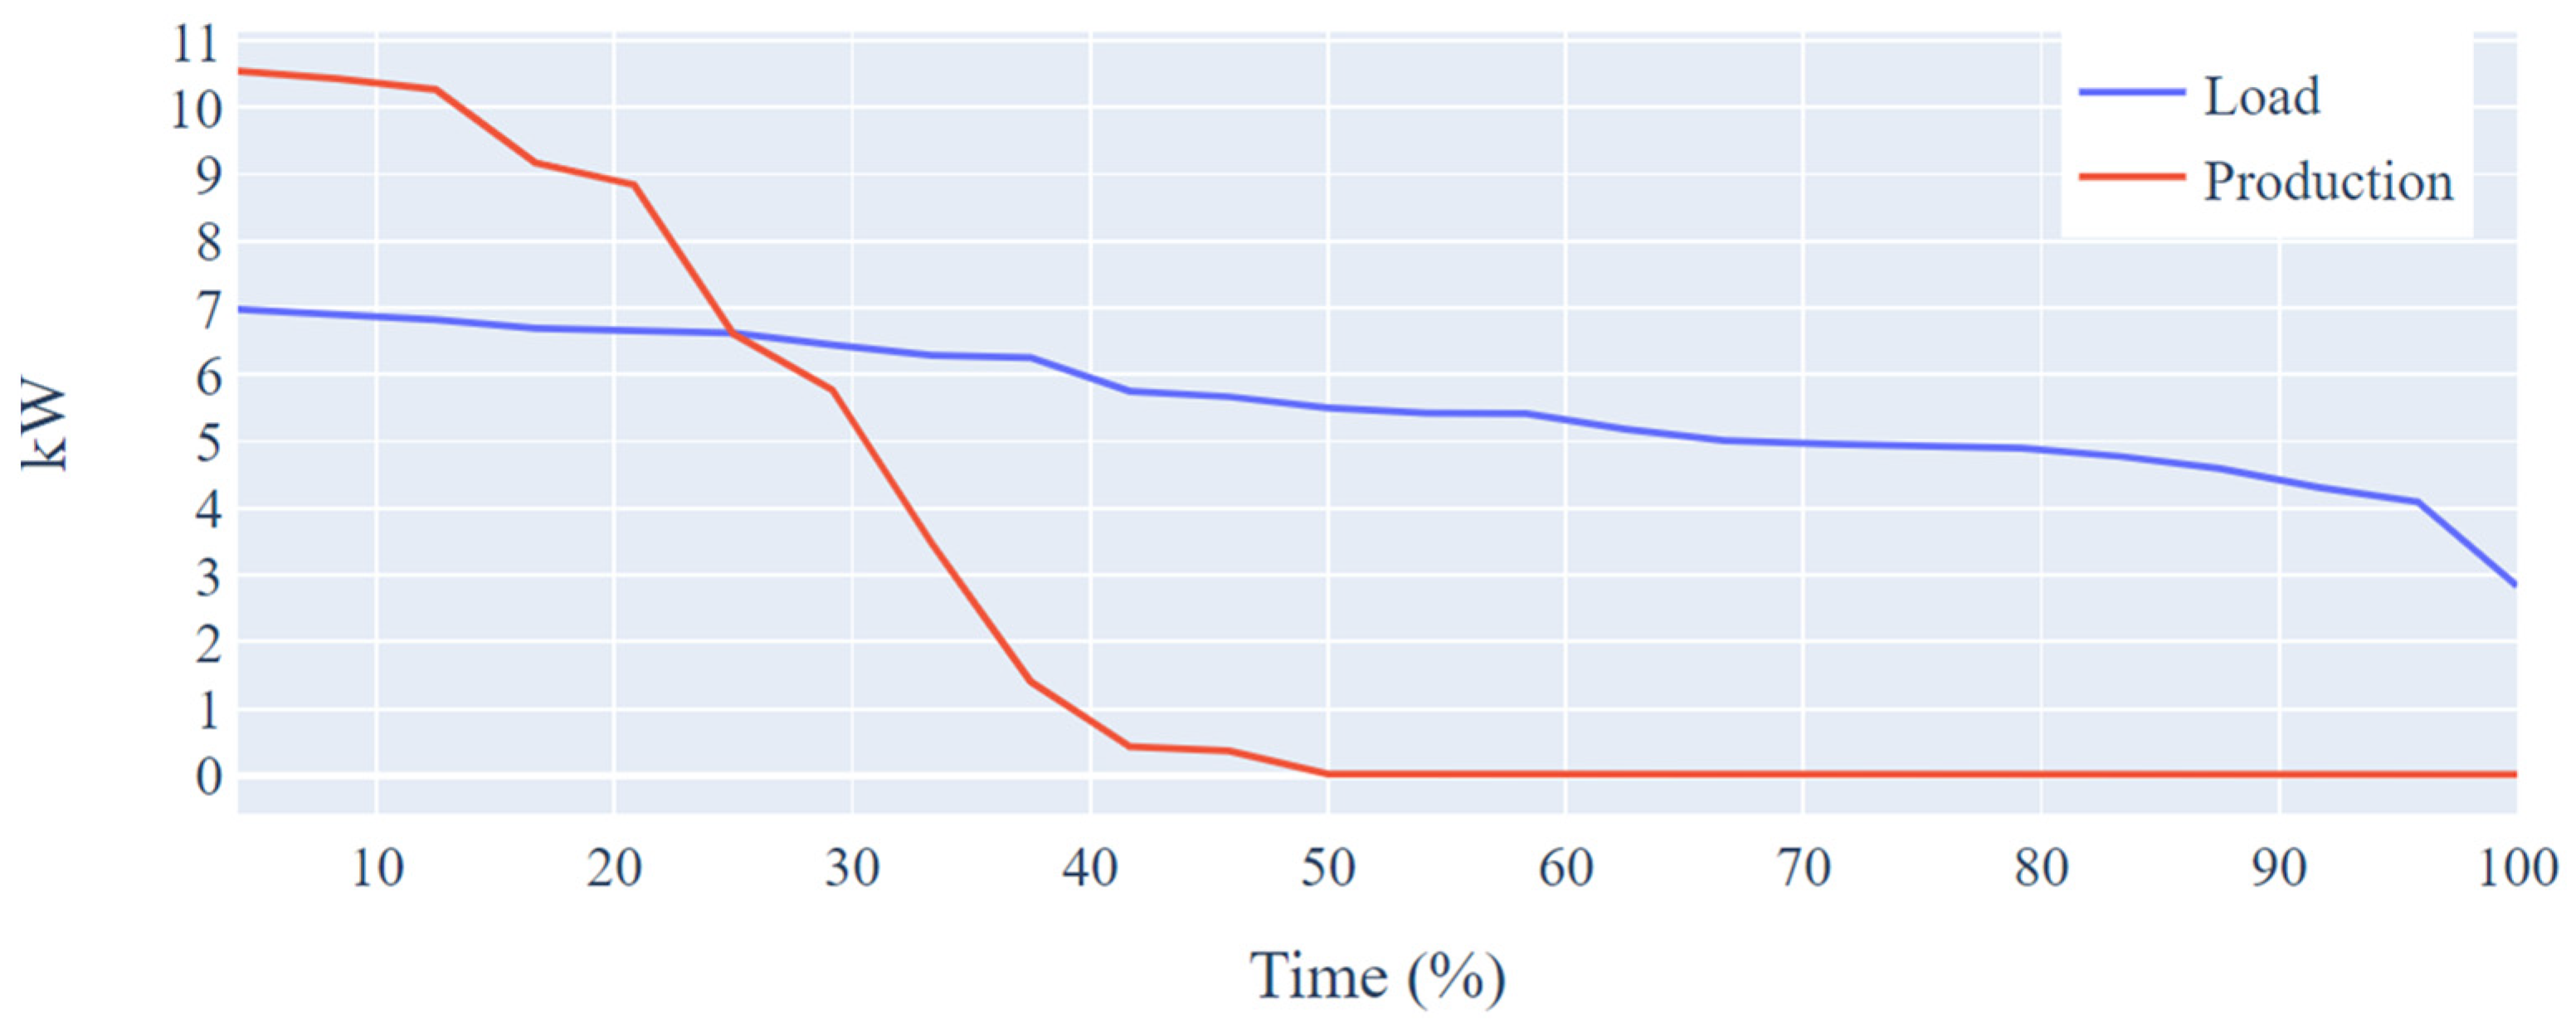
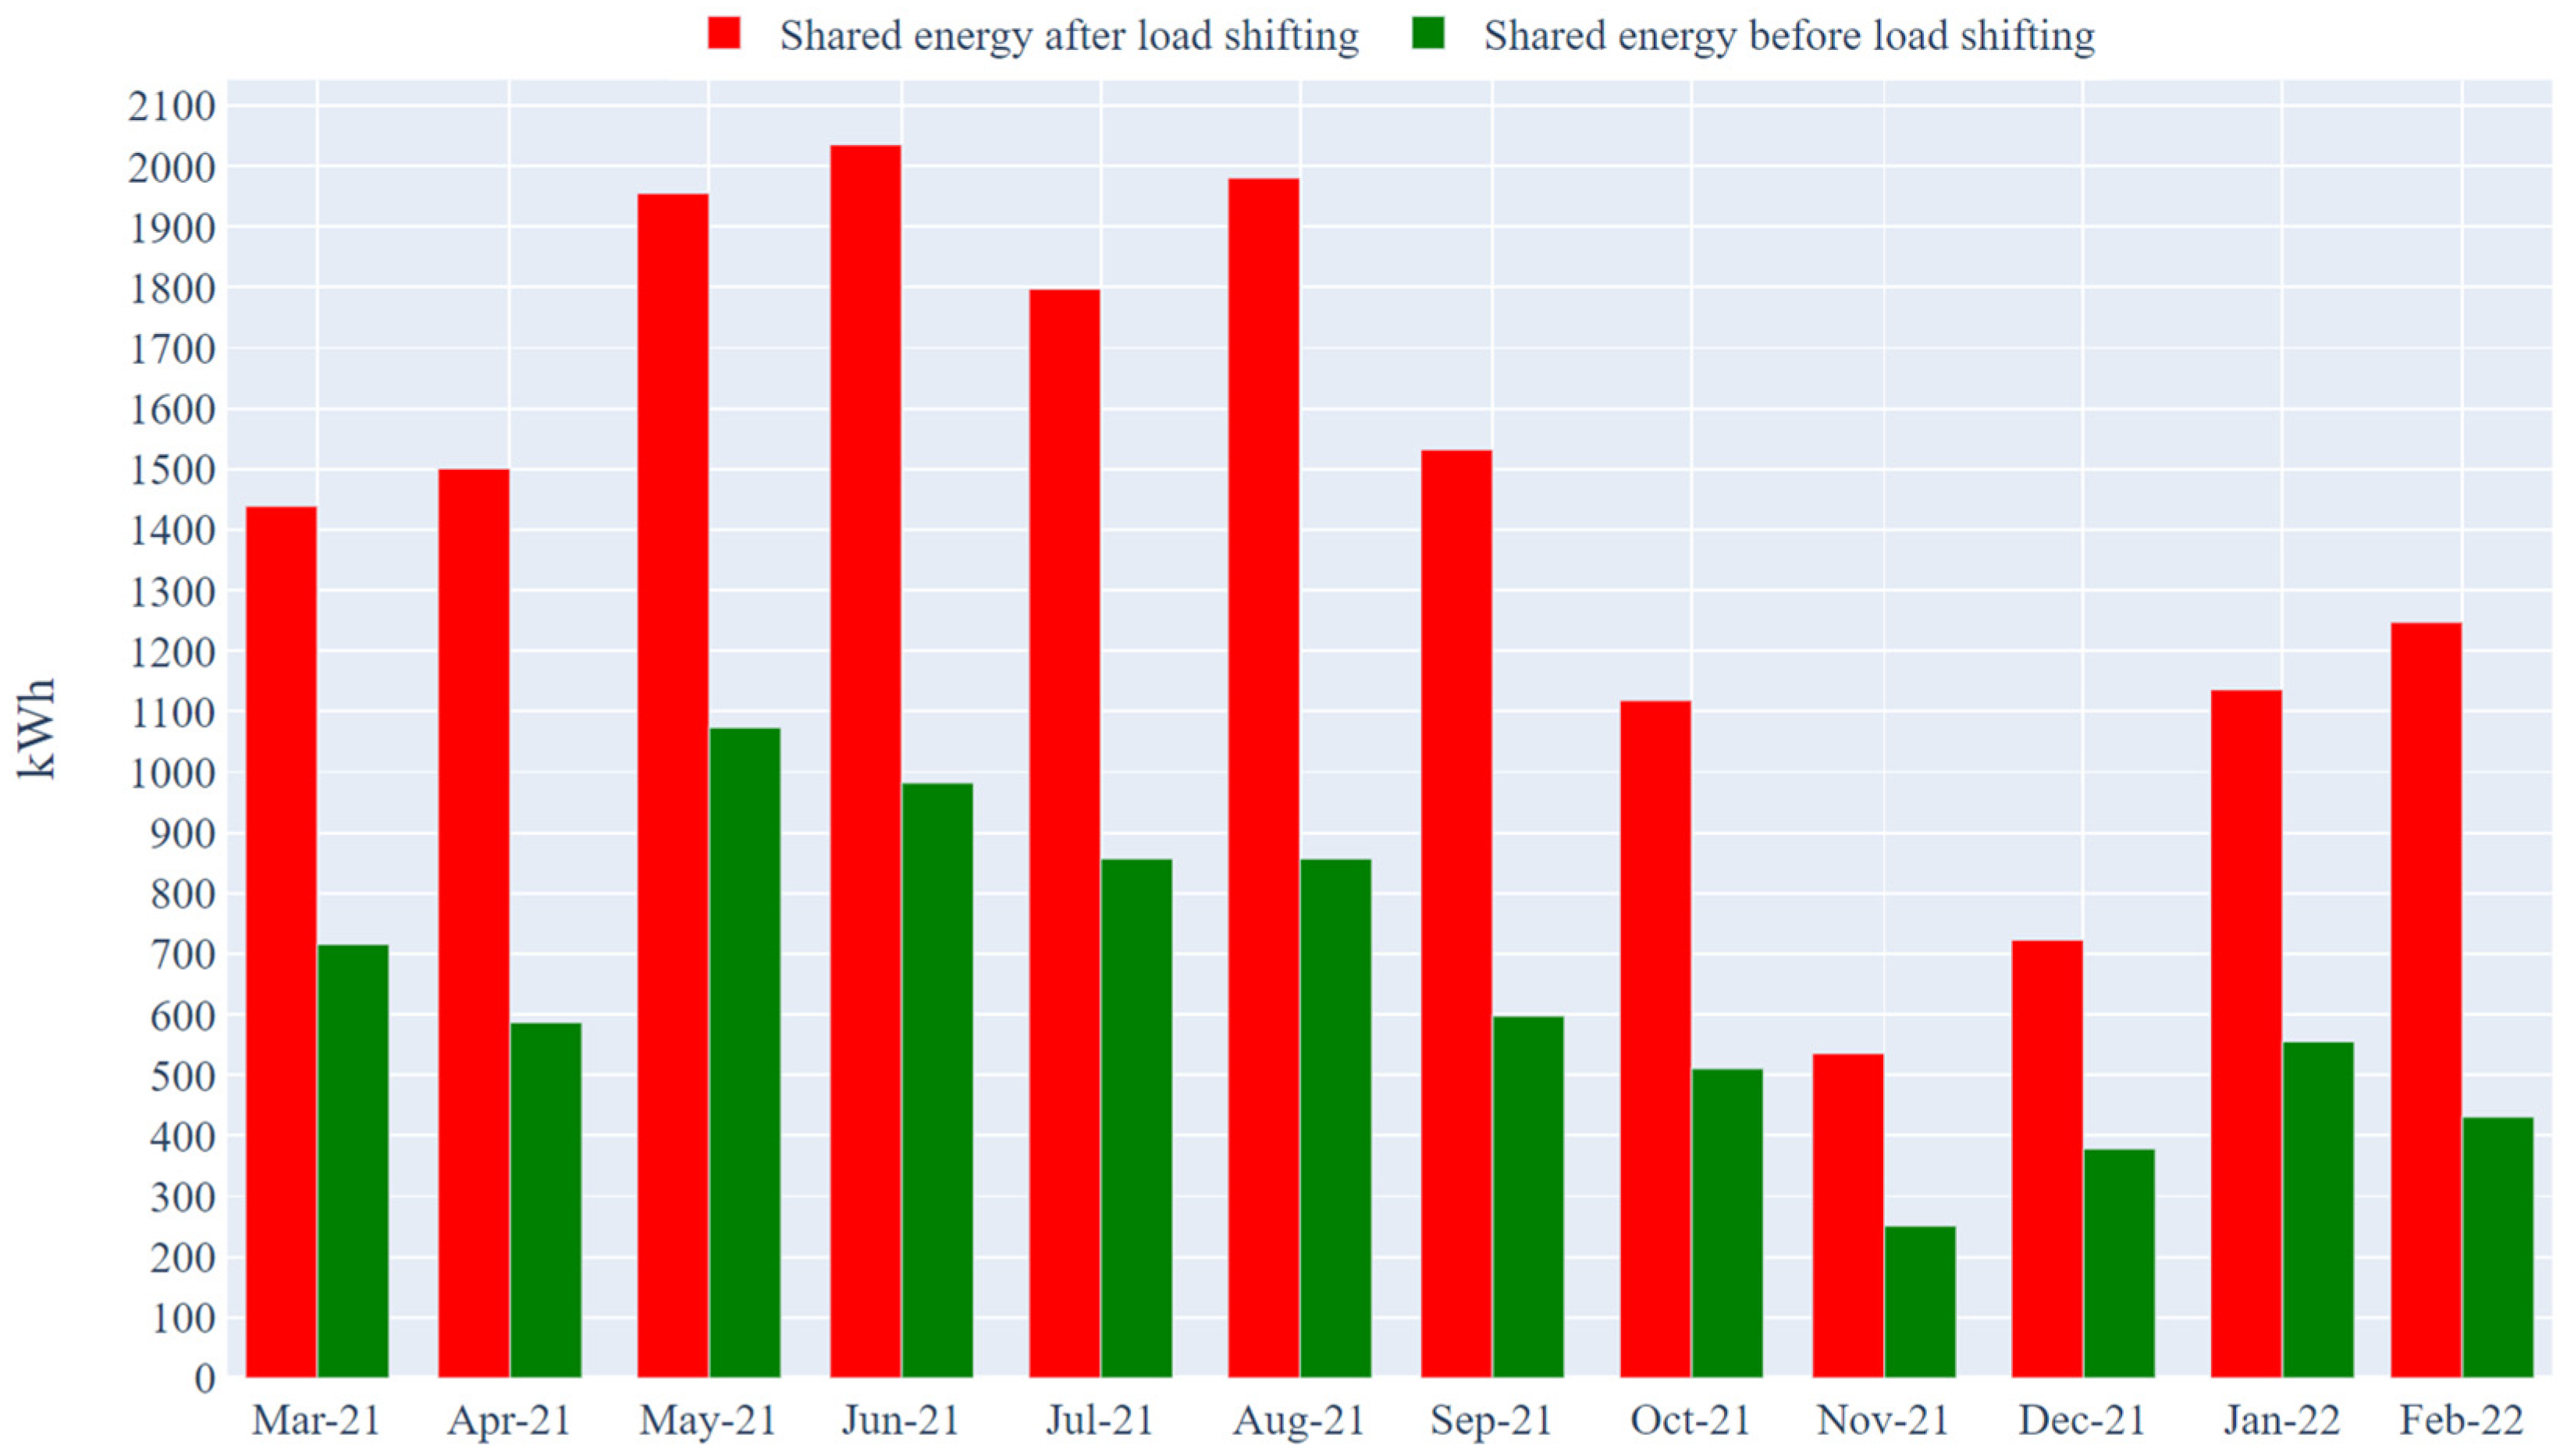
The following analysis was performed considering data aggregated over a year and over a month: These time frames have been preferred to others (weekly, hourly, and daily) for the impact capabilities of providing significant information to interpret the REC performance. Hourly data have been used to compute the shared energy by the community as specified in the technical regulations provided by the GSE and to realize a load shifting simulation. which will be presented in the following sections of the manuscript. The results obtained from the performed analysis are presented in the following section.

3. Results

This section will present the results of the analysis conducted on annual and monthly bases. Energetic and economic statistics and related KPIs are then presented.

3.1. Magliano Alpi REC Performance Analysis

The renewable energy community entered full operativity in March 2021 as the work needed to realize the PV plant and the metering infrastructure ended in late February. The period between March 2021 and February 2022 was analyzed. The next subsection provides a complete overview of the community performance over the year under consideration.

3.1.1. Annual Statistics

In Table 4, we provide the actual figures relative to energy consumption and energy production registered by the measurement infrastructure installed for the REC. The previously introduced parameters are reported as well.
During the 12 months that have been considered, the energy consumed by the community is approximately 50 MWh. The photovoltaic system installed would be able to meet more than 50% of the total energy needs, but it is clear that it is also necessary to change the habits of members to achieve this result or introduce new members who consume during times when the energy produced is not adequately exploited. The energy self-consumed by the community corresponds to 35% of the production, while the STC, i.e., the ratio between shared energy and consumed energy. is limited to 15%. This value shows margins for improvement as the energy exported to the grid is much more than the shared energy. This indicates that the withdrawals of energy set the majority of the lower boundary of formula (6). Other interesting information is provided by the EFET index. In fact, this value can be interpreted as a performance indicator of the burden of the energy community on the external network. If it were worth 100%, the energy fed into the network would be equal to that withdrawn by the community. The SSTC parameter for the period considered is 35% and it represents, among the others, the community’s ability to reduce energy costs. In this case, 35% of total needs are met through self-consumed and shared energy, which, as previously reported, are an avoided expense and an incentive.
Figure 4 shows the duration curves obtained by averaging the hourly production and load. As can be seen, the average power demand of the community over the period considered was always greater than approximately 2.8 kW, while 50% of the time it was greater than 5.5 kW. Only approximately 30% of the time did power demand exceed 6.5 kW. The power produced by the photovoltaic system exceeded the load developed by the community 25% of the time. Thanks to the characteristic trend of the production curve, it is also possible to assert that the plant worked regularly as it recorded energy production for more than 50% of the time under consideration.
In Italy, energy that is fed into the grid can access a valorization mechanism called “Ritiro Dedicato” (RID). This consists of the sale to the GSE of the electricity fed into the grid by plants that can access it. The GSE pays a certain tariff for each kWh fed into the grid. The tariff that is paid amounts to the hourly zonal price, which is formed on markets. In this instance, it was decided to use the single national price (PUN—“Prezzo Unico Nazionale”), i.e., the average nationwide zonal price.
Thanks to the available data and the realized calculations, it was possible to calculate the incentive paid to the shared energy and the amount paid for the valorization of the energy injected into the grid by the community. For the calculation of the latter, the historical average prices paid by the GSE in the time slots of each month for energy fed into the grid have been obtained. Table 5 reports the economic values associated with the corresponding revenue stream.
The sharing incentive has been calculated as the shared energy multiplied by 0.119 €/kWh, which is the economic value per kWh shared paid by the GSE and incorporates the incentive for the energy shared (110 €/MWh) and the compensation for the energy grid tariffs (9 €/MWh).
As highlighted above, the performance of the community in the use of energy fed into the network for the purpose of receiving the incentive is quite poor and has considerable room for improvement. In this case, the weak performance is reflected in a particularly low perceived incentive.

3.1.2. Monthly Statistics

The following section provides statistics calculated on a monthly basis to understand and explore the energy community in a deeper level of detail.
Figure 5 shows a bar graph in which the estimated production and the actual registered production are compared. The measured production exceeds expectations since the monthly average relative error (calculated as the mean of the absolute value of the measured monthly production minus the expected monthly production, over the measured monthly production) is 15.71%. The total kWh produced between March 2021 and February 2022 is 27,137 kWh. This monthly output was estimated during a preliminary study by using PVGIS with the PVGIS-ERA5 database.
As shown in Figure 5, the most productive month was June 2021, with 3205 kWh produced. In the same graph, it is possible to notice a decrease in production in correspondence with the winter months, as also predicted in the simulation phase. Figure 6 shows a graph that provides more details about the energy imported, exported, produced, and self-consumed within the community. It is noted that, in general, in the months of greater production, the community imports less energy from the net and exports a greater quantity, favoring therefore the sharing. During the month of November 2021, the lowest production (991 kWh) was recorded, and consequently, the minimum amount of energy was exported. It should also be noted that the instantaneous self-consumed energy is relatively low compared to the production because in the configuration under analysis, the only user that is able to self-consume is the town hall.
The energetic insights shown in Figure 6 are also reported in tabular format in Table 6, whilst the economic quantities relative to the RID and shared incentive generated incomes are reported in Table 7.
Figure 7 shows the trend of the previously defined parameters computed for each month. The EFET, SCSTC, and STC parameters show similar trends, albeit with completely different magnitudes. The great excursion of the EFET parameter is immediately noticeable, which is the ratio between energy exported and energy fed into the grid. In the month of June, which is also the month in which production was at its highest, this parameter reaches 80%, almost double the corresponding value calculated on an annual basis.
The SCP parameter reaches its maximum in November, the same month in which the lowest production is recorded. It is worth noting that November’s SCP is the same as in March, although, in March, there is not a drop in production. This drop in productivity recorded in November is also the cause of the drastic drop in EFET and SCSTC parameters.
The duration curves realized for each month are proposed in Figure 8. In general, there is a certain regularity over the months, but it is worth noting that January and February 2022 are the only months where there is no intersection between the load and the production line. This signifies a production that largely exceeds the energy required by the community. In this case, also considering the information about energy production previously provided, it can be concluded that this is not an issue related to the decrease in energy demand, but rather a decrease in energy production during the winter months. The phenomenon of the seasonality of production is well represented in this graph, as during the winter months, the production plant develops power for approximately 40% of the time; this percentage increases during the summer months up to 60%. Furthermore, the generated energy is remarkably higher during summer, as can be seen from the difference between the production line in February and June.
Figure 9 shows a graph in which the bars represent the total revenue generated by RID during each month with the average PUN value for the same month. As can be seen, since October 2021, the PUN has undergone an exponential increase and, consequently, the RID increased in value month by month.

4. Discussion

The main objective of the energy community is to provide environmental, economic, or social benefits at the community level to its shareholders or members, which is why it is necessary to analyze, in detail, how energy exchanges within the REC work and make sure that the benefits to users are maximized. An increase in REC performance can be achieved, in general, using three approaches. The first involves inclusion in the community of users whose electricity demand peaks during times of maximum production of the photovoltaic system. As shown in the previous section, in the Magliano Alpi REC, there is a net surplus of production compared to the total energy demand of the users. The addition of further consumers allows for improving both the energy performance and the economic performance of the community since the amount of shared energy would be higher, though the trade-off between the increase in the number of users and the variation of the economic benefit per capita must be considered. In the case that an excessive number of consumer users is included, the economic benefit resulting from the participation in the community saturates and eventually decreases, risking reaching lower levels than the initial state. The maximization of the shared energy incentive is reached when the energy withdrawal from the grid exceeds the input in the instance of photovoltaic production. The energy exported in this situation acts as an upper limit to the perception of the shared energy incentive. The introduction of users into the community body who consume during the phases of maximum production must be evaluated after the analysis of their characteristic load curves. Another option to increase the local self-consumption performance could involve the use of car batteries as potential storage (e.g., PV may be produced during the day and the extra production is stored to be released at nighttime), and the possibility of pushing for more electricity usage during the daytime (laundry machine, fridge, TV, etc.) by means additional devices and building automation systems able to re-shape the load curve. A third option is the introduction of a centralized community storage system to defer self-consumption and the sharing of locally produced energy from the community’s PV system. Such a solution can undoubtedly bring benefits with respect to all energy statistics; however, a higher investment for the implementation of such a system must be considered and is therefore not necessarily economically viable. Furthermore, the current legislation at the time of writing is not clear on the possibility of accessing the incentive for shared energy from energy storage plants, particularly regarding energy withdrawn and then fed back for self-consumption. At this juncture, there are difficulties regarding the calculation of the energy that would be incentivized and not subject to grid charges; this indecision does not allow for certain planning of investment in a storage system that considers both the benefits of self-consumption and energy sharing. Battery storage systems can be used to provide flexibilities services [40,41,42], which are remunerated in a competitive market, hence a more thorough analysis of such possibilities should be conducted when considering the introduction of BESS, whether it be a centralized community ESS or provided by batteries equipped in electric vehicles. However, the introduction of a storage system is not necessary if synchronization of electricity demand and production is technically feasible [43]; this is another reason why a careful study phase is necessary before the implementation of a REC [44].
These options can help to improve the performance of the renewable energy community, but investments are required for the installation of the required equipment. The cheapest solution, i.e., to leverage the users’ consumption habits, is illustrated in the following.

Load Shifting for Performance Improvement

As previously stated, conceptually, to maximize the perception of the shared energy incentive, it is better to consume at times of maximum production. This objective can be achieved not only by introducing new users, but also by varying the habits of existing members and, therefore, shifting their demand at times of maximum production. For this purpose, a function has been realized to simulate the shift of the demand of the users at instants of greater production and will be analyzed in depth in this section. The amount of energy that does not count toward the energy sharing incentive in the initial state, i.e., before the load shifting, is 9697 kWh/year. This value represents the upper limit of the increment in shared energy. Ideally, considering the first option of adding consumers to the configuration, the energy requirements of those consumers could not exceed this value during production hours. Alternatively, leveraging the habits of the REC participants to maximize the incentive received requires increasing the consumption of 9697 kWh/year during peak PV production hours and, at the same time, reducing the consumption of the same quantity at times when the production facility is not generating power.
The defined logic foresees the identification of the periods in which there is a high energy input in the network by the community plants and the instances in which the community load is maximum. The displacement of the community demand is operated in instances in which the energy input in the grid is maximum. The load that is shifted corresponds to the minimum between the energy exported to the grid and demand. With such considerations, the total energy demand of the community does not vary. The optimization is conducted on an hourly basis: For each time interval, the difference between energy fed into the network and energy withdrawn from the network has been calculated. In the case that this difference is positive, then in that time frame, the community can increase its consumption, while in the case that this difference is negative, in that time frame, the community withdraws more energy than it is injecting into the grid. The algorithm proceeds to the iterative reallocation of the energy deficit peaks in correspondence with the instances in which the input of the productive surplus in the grid is maximum.
The simulation’s goal is to illustrate that by simply varying the periods of withdrawal from the network, economic and energetic performances can be improved. It has been decided not to vary the instantaneous auto-consumption. Thus, the energy injected into the grid will be the same as before during every period. Consequently, the parameters that depend solely on the total energy consumed, the total energy produced, and the energy that is fed to the grid do not vary.
By applying this algorithm to the entire available dataset, the energy statistics and parameters were obtained and are shown in Table 8.
The effects of load shifting can be appreciated on the amount of energy shared, which sees a 118% increase (+9203 kWh). By virtue of this increase, the STC and SCSTC parameters improve by approximately 18%.
In Figure 10, we propose a bar graph with a comparison of the energy shared before and after the load shifting.
Because of this operation, the economic benefit for the community is enhanced. Other benefits are referrable to the power grid at the local level as the community can balance its energy withdrawals and inputs more efficiently.
Thanks to the data on quarterly final energy prices available on the website of the Regulatory Authority for Energy Networks and Environment (ARERA) [45], it was possible to calculate the community’s energy expenditure for each quarter of the period under consideration (Table 9). The total expenditure for energy over the 12 months amounts to 11,130 €. Thanks to the information previously presented in Table 8, it was possible to realize a synthetic comparison of the community’s economic performance (Table 10) before and after having performed the load shifting operation. In view of a 118% increase in the incentive received, the overall community’s economic performance increases by 13.9%, a significant increase in the avoided cost.

5. Conclusions

This paper performs a detailed analysis of the first year of operation of the energy community implemented in Italy in the municipality of Magliano Alpi (CN) and provides an overview of the economic and energy performance of the REC based on the definition of innovative KPIs proposed by the authors and designed for energy communities built according to the Italian model. In light of the results presented and taking into account the latest developments and state of the art in the technological and regulatory fields, the paths to be followed to improve the energy and economic efficiency of the REC are identified. The results presented can provide useful support indications in the decision-making process aimed at increasing the future benefits associated with the operation and management of the energy community.
The KPIs implemented in the paper were used to assess the performance of the energy community in the management of the energy locally produced and evaluate the economic impact of self-consumed and shared energy among REC users. Specifically, the energy produced by the PV system of the Magliano Alpi CER allows us to meet 35% of the energy demand, of which 19% can be referred to as self-consumed energy in the municipal house and 15.82% to energy shared with other energy community users. The possibility of introducing energy storage systems was also considered in the study. Such systems were not envisaged during the design phase of the REC due to ongoing regulatory uncertainties and high installation costs. Additional storage systems may provide relevant benefits to the energy performance of the REC, but not necessarily economic performance.
The analysis of the consumption and production curves shows that the average power produced is 25% higher than the power demand of the community. This suggests that it is possible to increase the number of members in the community without particularly affecting the pro-capita economic benefit if proper analysis is performed. Demand flexibility should also be considered, and community users could shift their load consumption to the peak hours of PV generation. Assuming the demand management approach proposed by the authors would result in a significant improvement in the performance of the energy community, which would be able to meet up to approximately 54% of its annual energy consumption with renewable energy.

Author Contributions

Conceptualization, E.G., R.T., G.L.R. and S.O.; methodology, E.G. and R.T.; software, R.T.; validation, E.G., R.T., G.L.R. and S.O.; writing—review and editing, E.G., R.T., G.L.R., S.O. and L.B. All authors have read and agreed to the published version of the manuscript.

Funding

This research received no external funding.

Data Availability Statement

The data presented in this study are available on request from the author Riccardo Trevisan (email: [email protected]).

Acknowledgments

The authors want to thank Marco Bailo, mayor of Magliano Alpi, for providing a fundamental push for the creation of the energy community, showing great sensibility to environmental sustainability issues and technological and regulatory innovation for the management and exploitation of energy produced from renewable sources.

Conflicts of Interest

The authors declare that they have no known competing financial interest or personal relationships that could have appeared to influence the work reported in this paper.

References

  1. Wierling, A.; Schwanitz, V.J.; Zeiß, J.P.; Bout, C.; Candelise, C.; Gilcrease, W.; Gregg, S.J. Statistical Evidence on the Role of Energy Cooperatives for the Energy Transition in European Countries. Sustainability 2018, 10, 3339. [Google Scholar] [CrossRef] [Green Version]
  2. Heras-Saizarbitoria, I.; Sáez, L.; Allur, E.; Morandeira, J. The emergence of renewable energy cooperatives in Spain: A review. Renew. Sustain. Energy Rev. 2018, 94, 1036–1043. [Google Scholar] [CrossRef]
  3. Seyfang, G.; Park, J.J.; Smith, A. Community Energy in the UK, University of East Anglia. 3S Working Paper. 2013. Available online: https://grassrootsinnovations.wordpress.com/2012/10/09/working-paper-community-energy-in-the-uk/ (accessed on 15 September 2022).
  4. UK Energy Research Centre. Evolution of Community Energy in the UK. Working Paper. Available online: https://ukerc.ac.uk/publications/evolution-of-community-energy-in-the-uk/ (accessed on 15 September 2022).
  5. Özgür, Y.; Rommel, J.; Debor, S.; Holstenkamp, L.; Mey, F.; Müller, J.R.; Radtke, J.; Rognli, J. Renewable energy cooperatives as gatekeepers or facilitators? Recent developments in Germany and a multidisciplinary research agenda. Energy Res. Soc. Sci. 2015, 6, 59–73. [Google Scholar]
  6. Schreuer, A. Energy cooperatives and local ownership in the field of renewable energy—Country Cases Austria and Germany. In Research Reports/RICC, 2; WU Vienna University of Economics and Business: Wien, Vienna, 2012. [Google Scholar]
  7. Haggett, C.; Creamer, E.; Harnmeijer, J.; Parsons, M.; Bomberg, E. Community Energy in Scotland: The Social Factors for Success; Commissioned repot; University of Edinburgh: Edinburgh, UK, 2013. [Google Scholar]
  8. Klagge, B.; Meister, T. Energy cooperatives in Germany—An example of successful alternative economies? Local Environ. 2018, 23, 697–716. [Google Scholar] [CrossRef]
  9. Meister, T.; Schmid, B.; Seidl, I.; Klagge, B. How municipalities support energy cooperatives: Survey results from Germany and Switzerland. Energy Sustain. Soc. 2020, 10, 18. [Google Scholar] [CrossRef] [PubMed]
  10. Bohnerth, J.C. Energy Cooperatives in Denmark, Germany and Sweden: A Transaction Cost Approach. Ph.D. Thesis, Uppsala University, Uppsala, Sweden, 2015; p. 55. [Google Scholar]
  11. Rossetto, N.; Verde, S.F.; Bauwens, T. A Taxonomy of Energy Communities in Liberalized Energy Systems, Energy Communities; Academic Press: Cambridge, MA, USA, 2022; pp. 3–23. [Google Scholar]
  12. Minuto, F.D.; Lanzini, A. Energy-sharing mechanisms for energy community members under different asset ownership schemes and user demand profiles. Renew. Sustain. Energy Rev. 2022, 168, 112859. [Google Scholar] [CrossRef]
  13. Gestore Servizi Energetici. Solare Fotovoltaico—Rapporto Statistico 2021. 2022. Available online: https://www.gse.it/documenti_site/Documenti%20GSE/Rapporti%20statistici/Solare%20Fotovoltaico%20-%20Rapporto%20Statistico%202021.pdf (accessed on 15 September 2022).
  14. International Energy Agency. Renewables 2020—Analysis and Forecast to 2025. 2020. Available online: https://iea.blob.core.windows.net/assets/1a24f1fe-c971-4c25-964a-57d0f31eb97b/Renewables_2020-PDF.pdf (accessed on 15 September 2022).
  15. Terna. Piano di Sviluppo—Evoluzione Rinnovabile. 2021. Available online: https://download.terna.it/terna/Evoluzione_Rinnovabile_8d940b10dc3be39.pdf (accessed on 15 September 2022).
  16. Olivero, S.; Ghiani, E.; Rosetti, G.L. The first Italian Renewable Energy Community of Magliano Alpi. In Proceedings of the 2021 IEEE 15th International Conference on Compatibility, Power Electronics and Power Engineering (CPE-POWERENG), Florence, Italy, 14–16 July 2021; pp. 1–6. [Google Scholar]
  17. Directive (EU) 2018/2001 of the European Parliament and of the Council—Of 11 December 2018—On the Promotion of the Use of Energy from Renewable Sources. Available online: https://eur-lex.europa.eu/legal-content/EN/TXT/?uri=uriserv:OJ.L_.2018.328.01.0082.01.ENG (accessed on 15 September 2022).
  18. Directive (EU) 2019/944 of the European Parliament and of the Council of 5 June 2019—On Common Rules for the Internal Market for Electricity and Amending Directive 2012/27/EU. Available online: https://eur-lex.europa.eu/legal-content/EN/TXT/?uri=CELEX%3A32019L0944 (accessed on 15 September 2022).
  19. Van Veelen, B. Negotiating energy democracy in practice: Governance processes in community energy projects. Environ. Politics 2018, 27, 644–665. [Google Scholar] [CrossRef] [Green Version]
  20. Kunze, C.; Becker, S. Energy Democracy in Europe: A Survey and Outlook; Rosa Luxemburg Stiftung: Bruxelles, Brussels, 2014; Available online: https://www.rosalux.de/fileadmin/rls_uploads/pdfs/sonst_publikationen/Energy-democracy-in-Europe.pdf (accessed on 15 September 2022).
  21. Vansintjan, D. The Energy Transition to Energy Democracy; REScoop: Antwerp, Belgium, 2015; Available online: https://rescoop.eu/system/files/REScoopEnergyTransitiontoEnergyDemocracy-English.pdf (accessed on 4 August 2022).
  22. John, D. Energy, Democracy, Community, The Democracy Collaborative. 2015. Available online: https://medium.com/@JohnDuda/energy-democracy-community-320660711cf4#.3kdoufsmw (accessed on 15 September 2022).
  23. Weinrub, A.; Giancatarino, A. Toward a Climate Justice Energy Platform: Democratizing Our Energy Future; Local Clean Energy Alliance: Oakland, CA, USA, 2015; Available online: http://www.localcleanenergy.org/files/ClimateJusticeEnergyPlatform.pdf (accessed on 15 September 2022).
  24. Sousa, T.; Soares, T.; Pinson, P.; Moret, F.; Baroche, T.; Sorin, E. Peer-to-peer and community-based markets: A comprehensive review. Renew. Sustain. Energy Rev. 2019, 104, 367–378. [Google Scholar] [CrossRef] [Green Version]
  25. Ghiani, E.; Mureddu, M.; Galici, M.; Troncia, M.; Pilo, F. The Digitalization of Peer-to-Peer Electricity Trading in Energy Communities; Löbbe, S., Sioshansi, F., Robinson, D., Eds.; Energy Communities; Academic Press: Cambridge, MA, USA, 2022; pp. 211–227. [Google Scholar]
  26. Schlosberg, D. Theorising environmental justice: The expanding sphere of a discourse. Environ. Politics 2013, 22, 37–55. [Google Scholar] [CrossRef]
  27. Coletta, G.; Pellegrino, L. Optimal Design of Energy Communities in the Italian Regulatory Framework. In Proceedings of the AEIT International Annual Conference, Milan, Italy, 4–8 October 2021; pp. 1–6. [Google Scholar]
  28. Fioriti, D.; Frangioni, A.; Poli, D. Optimal sizing of energy communities with fair revenue sharing and exit clauses: Value, role and business model of aggregators and users. Appl. Energy 2021, 299, 117328. [Google Scholar] [CrossRef]
  29. Italian Government Decree no. 162/2019. Publication in the Italian Official Gazette on 29 February 2020. Law 8/2020 in Force on 1 March 2020. Available online: https://www.ashurst.com/en/news-and-insights/legal-updates/milleproroghe-decree-converted-into-law-by-the-italian-parliament---the-focus-on-roads-and-motorways/ (accessed on 15 September 2022).
  30. DECRETO LEGISLATIVO 8 November 2021, n. 199. Available online: https://www.gazzettaufficiale.it/eli/id/2021/11/30/21G00214/sg (accessed on 15 September 2022).
  31. Good, N.; Mancarella, P. Flexibility in Multi-Energy Communities With Electrical and Thermal Storage: A Stochastic, Robust Approach for Multi-Service Demand Response. IEEE Trans. Smart Grid 2019, 10, 503–513. [Google Scholar] [CrossRef]
  32. Fereidoon, S. (Ed.) Variable Generation, Flexible Demand; Academic Press: Cambridge, MA, USA, 2020. [Google Scholar]
  33. Repo, S.; Holttinen, H.; Björkqvist, T.; Lummi, K.; Valta, J.; Peltonen, L.; Järventausta, P. Toward smarter and more flexible grids. In Electrification; Academic Press: Cambridge, MA, USA, 2021; pp. 125–147. [Google Scholar]
  34. Barai, G.R.; Krishnan, S.; Venkatesh, B. Smart metering and functionalities of smart meters in smart grid—A review. In Proceedings of the Electrical Power and Energy Conference (EPEC), London, ON, Canada, 26–28 October 2015; pp. 138–145. [Google Scholar] [CrossRef]
  35. Pitì, A.; Verticale, G.; Rottondi, C.; Capone, A.; Lo Schiavo, L. The Role of Smart Meters in Enabling Real-Time Energy Services for Households: The Italian Case. Energies 2017, 10, 199. [Google Scholar] [CrossRef] [Green Version]
  36. Kochański, M.; Korczak, K.; Skoczkowski, T. Technology Innovation System Analysis of Electricity Smart Metering in the European Union. Energies 2020, 13, 916. [Google Scholar] [CrossRef] [Green Version]
  37. Chakraborty, S.; Das, S.; Sidhu, T.; Siva, A.K. Smart meters for enhancing protection and monitoring functions in emerging distribution systems. Int. J. Electr. Power Energy Syst. 2021, 127, 106626. [Google Scholar] [CrossRef]
  38. Directive (EU) 2004-722/EC of the European Parliament and of the Council. Available online: https://eur-lex.europa.eu/legal-content/en/ALL/?uri=CELEX%3A32004L0022 (accessed on 15 September 2022).
  39. GSE. Technical Rules for Access to the Service of Valorisation and Incentivisation of Shared Electricity. Available online: https://www.gse.it/documenti_site/Documenti%20GSE/Servizi%20per%20te/AUTOCONSUMO/Gruppi%20di%20autoconsumatori%20e%20comunita%20di%20energia%20rinnovabile/Regole%20e%20procedure/Regole%20Tecniche%20per%20accesso%20al%20servizio%20di%20valorizzazione%20e%20incentivazione%20energia%20elettrica%20condivisa.pdf (accessed on 15 September 2022).
  40. Arghandeh, R.; Woyak, J.; Onen, A.; Jung, J.; Broadwater, R.P. Economic optimal operation of Community Energy Storage systems in competitive energy markets. Appl. Energy 2014, 135, 71–80. [Google Scholar] [CrossRef] [Green Version]
  41. Wang, H.; Good, N.; Mancarella, P. Modelling and valuing multi-energy flexibility from community energy systems. In Proceedings of the 2017 Australasian Universities Power Engineering Conference (AUPEC), Melbourne, VIC, Australia, 19–22 November 2017; pp. 1–6. [Google Scholar] [CrossRef]
  42. Rancilio, G.; Bovera, F.; Merlo, M. Revenue Stacking for BESS: Fast Frequency Regulation and Balancing Market Participation in Italy. Int. Trans. Electr. Energy Syst. 2022, 2022, 1–18. [Google Scholar] [CrossRef]
  43. Jelić, M.; Batić, M.; Tomašević, N.; Barney, A.; Polatidis, H.; Crosbie, T.; Abi Ghanem, D.; Short, M.; Pillai, G. Towards Self-Sustainable Island Grids through Optimal Utilization of Renewable Energy Potential and Community Engagement. Energies 2020, 13, 3386. [Google Scholar] [CrossRef]
  44. Zatti, M.; Moncecchi, M.; Gabba, M.; Chiesa, A.; Bovera, F.; Merlo, M. Energy Communities Design Optimization in the Italian Framework. Appl. Sci. 2021, 11, 5218. [Google Scholar] [CrossRef]
  45. Arera. Electricity Price Trends for the Typical Domestic Consumer under Regulated Tariffs. Available online: https://www.arera.it/it/dati/eep35.htm (accessed on 15 September 2022).
Figure 1. Aerial view of the REC.
Energies 15 07439 g001
Figure 2. Simplified scheme of the participants of the REC.
Energies 15 07439 g002
Figure 3. Energy flows, relevant parameters, facilities, and members of the community.
Energies 15 07439 g003
Figure 4. Duration curves for the period in consideration—computed on average yearly data.
Energies 15 07439 g004
Figure 5. Forecasted and measured production in the period under analysis.
Energies 15 07439 g005
Figure 6. Monthly details about energy imported, exported, produced, and self-consumed, and total energy consumption.
Energies 15 07439 g006
Figure 7. SCP, STC, EFET, and SCSTC parameters—monthly details.
Energies 15 07439 g007
Figure 8. Monthly average duration curves for the period in consideration—computed on average data.
Energies 15 07439 g008
Figure 9. RID and PUN—monthly statistics.
Energies 15 07439 g009
Figure 10. Shared energy comparison before and after the load shifting simulation.
Energies 15 07439 g010
Table 1. Users of the Magliano Alpi REC—annual consumption and energy bill details.
User TypeAnnual Consumption (kWh)Energy Bill (€)
Public Building16,8253386
Public Building15,4233317
Public Building2026538
Small Business78713058
Residential776533
Residential3532702
Residential4735849
Table 2. Parameters of interest for the REC performance analysis.
ParameterAcronymDefinition
Energy consumed (kWh)TCThe total energy consumed by the users of the REC.
Energy produced (kWh)TPThe total energy produced by the production plants feeding the REC.
Energy self-consumed (kWh)SCThe energy simultaneously produced and consumed by each user of the REC on his/her premises.
Energy shared (kWh)SEThe energy simultaneously produced and consumed by all the users of the REC (collective self-consumption).
Energy exported (kWh)EFGThe total energy exported from the REC to the grid.
Energy imported (kWh)ETGThe energy imported from the grid.
Energy exported (kWh) by the “y-th” connection pointEFGCPy,hThe energy exported to the grid by the “y-th” connection point during the “h-th” hour.
Energy withdrawn (kWh) by the “y-th” connection pointETGCPy,hThe energy withdrawn from the grid by the “y-th” connection point during the “h-th” hour.
Table 3. Performance indicators used to analyze the REC performance.
Performance IndicatorDescription
SCP (%)Calculated as the ratio of self-consumed over the total energy produced over a set period
STC (%)Calculated as the ratio of shared energy over total energy consumption of the community over a set period.
EFET (%)Calculated as the ratio between energy fed to the grid and energy withdrawn from the grid over a set period.
SCSTC (%)Calculated as the ratio between the sum of self-consumed and shared energy over the total energy consumption of the community over a set period.
Table 4. Energy statistics and key performance indexes calculated for the period from March 2021 and February 2022.
Value
Energy consumed (kWh)49,288
Energy produced (kWh)27,137
Energy exported (kWh)17,495
Self-consumed energy (kWh)9642
Energy shared (kWh)7797
SCP (%)35
STC (%)15
EFET (%)44
SCSTC (%)35
Table 5. Economic inflows derived from the RID and the incentive for the shared energy.
Value
RID (€)2326
Sharing incentive (€)927
Table 6. Energetic quantities for each month under consideration.
PeriodTotal Consumed (kWh)Imported (kWh)PV Production (kWh)Self-Consumed (kWh)Exported (kWh)Shared (kWh)
31 March 202152554042267412131461716
30 April 20214380341925639611601586
31 May 202135493055253649320421,073
30 June 202137212676320510442160982
31 July 202140862979298511061878857
31 August 202139962980304410162027857
30 September 20213585277623718091562597
31 October 20213718307317636451118510
30 November 202143463890991455536251
31 December 2021430037011322599723378
31 January 20224623396917896531136555
28 February 20223724308018906431247430
Table 7. Economic quantities for each month under consideration.
PeriodRID (€)Shared Incentive (€)
31 March 202187.0285.20
30 April 2021109.3869.81
31 May 2021145.81127.76
30 June 2021183.25116.87
31 July 2021193.94102.01
31 August 2021217.45102.00
30 September 2021247.1971.12
31 October 2021250.5560.77
30 November 2021129.6729.87
31 December 2021225.0745.04
31 January 2022272.2966.06
28 February 2022264.8851.27
Table 8. Energy statistics and parameters after applying the load-shifting function.
Value
Energy consumed (kWh)49,288
Energy produced (kWh)27,137
Energy fed to the grid (kWh)17,495
Self-consumed energy (kWh)9642
Energy shared (kWh)17,000
SCP (%)35
STC (%)34 (+18.68%)
EFET (%)44
SCSTC (%)54 (+18.67%)
Table 9. Revenue and expenditure.
PeriodEnergy Price (€/kWh)Withdrawals from Grid (kWh)Expenditure (€)
Q1—20210.204042810
Q2—20210.2191511906
Q3—20210.2387361999
Q4—20210.3010,6653167
Q1—20220.4670503245
Table 10. Energy expenditure for the community.
Before LSAfter LS
Total energy expenditure (€)11,13011,130
RID income (€)23262326
Sharing incentive income (€)9272023
Balance (€)−7875−6780
Publisher’s Note: MDPI stays neutral with regard to jurisdictional claims in published maps and institutional affiliations.

