Article

Challenges of Phasing out Emergency Diesel Generators: The Case Study of Lacor Hospital’s Energy Community

1
Electric Vehicle and Energy Research Group (EVERGI), Mobility, Logistics and Automotive Technology Research Centre (MOBI), Department of Electrical Engineering and Energy Technology, Vrije Universiteit Brussel, 1050 Ixelles, Belgium
2
Technical Department, St. Mary’s Hospital Lacor, Gulu P.O. Box 180, Uganda
*
Author to whom correspondence should be addressed.
Energies 2023, 16(3), 1369; https://doi.org/10.3390/en16031369
Submission received: 22 December 2022 / Revised: 20 January 2023 / Accepted: 23 January 2023 / Published: 28 January 2023
(This article belongs to the Special Issue Energy Communities Implementation)

Abstract

:
Power outages of the electricity grid threaten the proper operation of critical infrastructure such as hospitals. To cope with this problem, emergency diesel generators (DGs) are often used to guarantee continuous and resilient electricity supply, resulting in increased costs and greenhouse gas (GHG) emissions. Thus, this study aims to investigate the economic feasibility of both reducing and replacing emergency diesel generators with solar photovoltaic (PV) systems, battery energy storage systems (BESS) and demand-side management. A mixed-integer quadratically constrained program is used to find the optimal configuration in terms of capacities of new assets, as well as the optimal scheduling of both BESS and flexible loads, that minimises the levelised cost of energy (LCOE). The model is applied to an existing hospital and its surrounding community located in Gulu, Uganda. The results show that full replacement of the DGs will require an additional 500 kWp of PV and 1591 kWh of BESS. This new configuration will decrease LCOE by 26% compared to the actual situation, with a simple payback time of 6.2 years and a reduction of 74% in GHG emissions.

1. Introduction

Hospital facilities are considered as one of the major electricity consumers in the building sector [1]. The electricity supply issue in hospitals is particularly important due to its direct impact on people’s health and on vital treatments [2]. For this reason, hospitals must be equipped with emergency generators, which in most cases are diesel generators (DG), to ensure a continuous supply of electricity in the event of power network failure. The importance of these backup systems increases even more in locations where the power network is regularly unstable. This is the case in Sub-Saharan Africa (SSA), where more than 40% of the population lack access to electricity [3], and when a grid connection exists, it is often unreliable. Farquharson et al. [4] indicated that power outages in SSA countries occur for between 50 and 4600 h per year, which are mostly mitigated by backup DGs that lead to a dramatic increase in greenhouse gas emissions (GHG) and energy provision costs. Mitigation of DG usage can be done via increasing renewable energy sources (RES), especially solar, due to the high potential in SSA. However, the instability of the electrical grid is also detrimental to grid-connected solar photovoltaic (PV) systems; a lot of energy produced needs to be curtailed because of the unavailability of the network or the impossibility of the grid to absorb excess production.
Previous authors have looked into the advantages offered by hybrid energy systems combining renewable generation, BESS and DGs, covering a variety of applications. As per backup power generation, the complete replacement of the DG by BESS was studied in [5], resulting in a cut of operating costs by 59.5% and GHG emissions by 28.4% with the new design. Coping strategies with the gradual integration of PV and BESS and reinvestment of savings were studied in [6], demonstrating an investment cost of 3.8% of the total life cycle cost of the original design only with DG. However, the hybridisation of BESS and DG was also studied as a relevant design strategy to increase the fuel efficiency of DG in [7]. With most DGs deployed being fixed speed engines, BESS was able to increase the flexibility of fossil fuel-powered generators by increasing fuel savings by 40%.
In this study, we investigate the economic feasibility of reducing and replacing DGs with PV, BESS and flexibility demand in Lacor Hospital’s energy community. The work presented here is based on activities carried out during the EU Horizon 2020 RENAISSANCE project [8]. More specifically, an onsite workshop was organised with the major stakeholders of the hospital in order to discuss regulatory aspects of energy communities and to propose and analyse scenarios for the integration of more renewable energy sources in the hospital’s community [9]. This study is then an extension and a more detailed version of the work presented during the workshop. After data collection and curation, a set of representative scenarios for future energy systems is created to be analysed. The evaluation of the scenarios is achieved using an optimisation model based on a mixed-integer quadratically constrained programme. This model is used to find the optimal configuration with regard to the new assets’ capacities, as well as to find the optimal operation of both BESS and flexible loads to minimise levelised energy costs (LCOE) and GHG emissions.

2. Materials and Methods

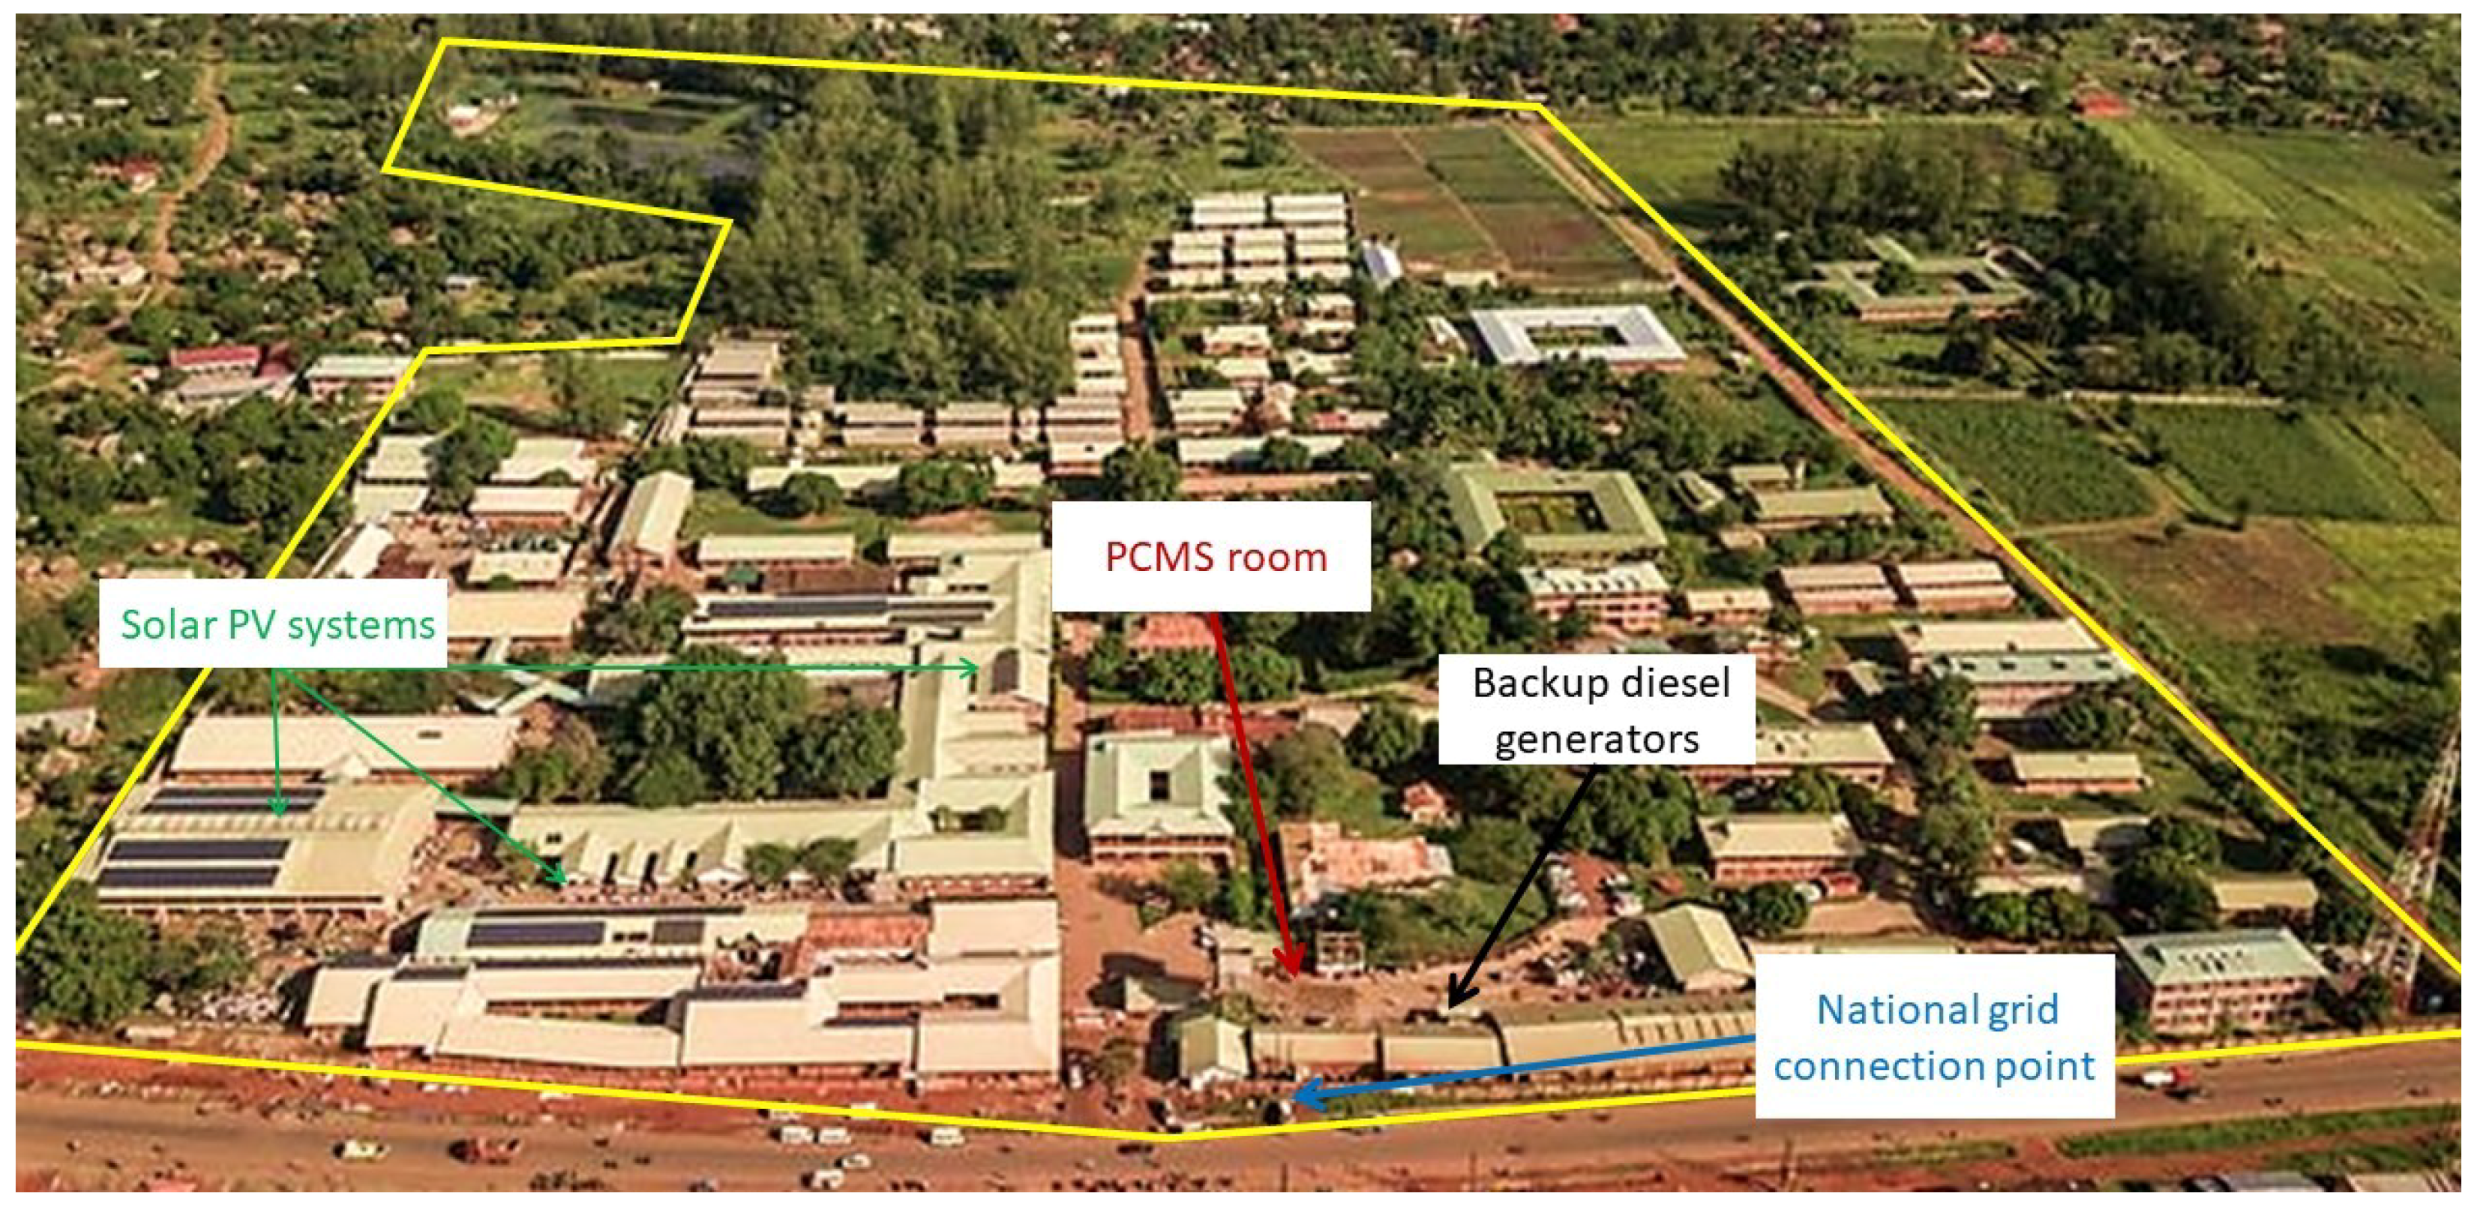
2.1. St. Mary’s Hospital Lacor and Its Power System

St. Mary’s hospital Lacor (Lacor hospital, LH) is located in Gulu, Northern Uganda. It is the second biggest hospital by the number of beds in Uganda and the largest non-governmental hospital in eastern Africa. Its compound extends over an area of about 180,000 sqm, including the hospital wards and annexed structures, schools for nurses and clinical technicians, the faculty of medicine of Gulu University, staff quarters and receptive structures to accommodate national and international hosts, among others. As such, an estimated 2000 people live within the hospital compound, plus an average of 500 students and a variable number of inpatients. Together, they constitute the LH’s community. The power system of LH is configured as a distributed hybrid microgrid [10], with four main components (Figure 1): (i) connection to the national grid infrastructure, (ii) backup DGs, (iii) a distributed photovoltaic system and (iv) a centralised Power Monitoring Control System (PCMS).
The hospital is connected to the national grid through a three-phase 11 kV link. The voltage is then reduced to 400 V using a 1 MW transformer owned and operated by LH. A second transformer is on standby for redundancy. The hospital has displaced three main DGs, which can be operated one at a time to allow for redundancy in the event of any faults. A generator is always set to start automatically in case of failure of the national grid, thanks to a grid monitoring system and an automatic power transfer switch. LH has a total of 315 kWp of PV systems distributed on some of the buildings’ roofs. Three-phase inverters inject power into the LH internal grid. The inverters are controlled through the PCMS, which modulates the power injected by the PV systems to avoid reverse power flows to the national grid or the DGs and optimises self-consumption.
The hospital consumes an average of 1000 MWh per year, with a peak power of around 250 kW. The typical load curve is shown in Figure 2. Photovoltaic systems help cover a significant share of the load, up to 35%. However, due to the absence of a storage unit and the impossibility of injecting excess power into the national grid, the control system curtails a portion of the power potentially generated by the PV systems. An example of the PV production curve during a sunny day is given in Figure 3. It is possible to observe the effect of curtailment in the central hours of the day, where the production curve is flattened in between 10 a.m. and 4 p.m.; the maximum power is around 130 kW, while the PV systems could potentially produce more than 250 kW. On the other hand, the national grid remains quite unreliable; power is unavailable or out of acceptable voltage ranges for at least 10–15% of the time. Consequently, 8–10% of the energy consumption is covered by the DGs.
In terms of costs, the figures from the latest financial year 2021/22 show a total expense for electricity of about UGX 630 million (ca. EUR 170,000, Table 1). About UGX 550 million (ca. EUR 150,000) was due to the consumption from the national grid, while the remaining UGX 80 million (ca. EUR 20,000) was attributable to the diesel consumed by the DGs. The average unit cost of the electricity from the grid was UGX 891/kWh, while the unit cost of the electricity from the DGs was much higher, equal to UGX 1570/kWh considering the cost of the diesel only, thus not including the costs associated with the maintenance of the machines. Referring in a conservative way to the average purchase cost of electricity from the national grid only, the PV production allowed to save nearly UGX 200 million during the last financial year.

2.2. Data Collection and Preparation

Electric power consumption and production in the whole community are monitored by an extensive set of meters installed throughout the hospital distribution line. Data collected from meters are stored on a server that is remotely accessible by different IP addresses from the hospital network. Measurements of the total hospital consumption, generators and flexible load were retrieved for this analysis. Reliable data are available from May 2022 to October 2022 with a five-minute resolution. A full-year set of quarter-hourly data was created based on the 6 months of measurements and by exploiting the low seasonality of the consumption and production profiles. The quarter-hourly time resolution was chosen instead of the available 5 min resolution to reduce the computational cost of optimisation. The region where the community is located experiences one wetter season between March and October and a drier one from November to February. Therefore, data from September and October (end of the wet season) are used to recreate the month of November and December by applying a random factor between 0.95 and 1.05 to each value. January is also constructed based on October, February and September, while March and April are based on May. Total annual values are shown in Table 2, comparing them with the values of the financial year 2021/22 presented in Table 1.
Two key inputs for the optimisation model are the electrical consumption profiles and the generator production profile. The total sum of the reconstructed electrical consumption data was 20% higher than in the last financial year, which can be explained by the limits of the reconstruction method, the random factor applied and a general increase in demand. The resulting average daily profile is shown in Figure 4. The same approach was used to reconstruct the flexible demand profile. Sterilisation machines are identified as the most suitable candidates to be steered, and they also have their own meters, so it was possible to extract their demand from the total load. Their maximum power is 70 kW for a total consumption of 80 MWh/year and their aggregated average daily profile is presented in Figure 5. The total production of the backup diesel generator differed only by less than 5% compared to the past year. This profile is used only to retrieve the distribution of hours in a year when the public network is unavailable. Regarding solar PV production, it was simulated using historical weather data of the community’s region and by knowing the installed capacities, inclination and orientation of the various PV installations (Table 3). This is because the available data on PV production represents the power produced “after” curtailment. For our analysis, we will need the total power that the PV panels can produce in order to coordinate the flexible loads and the future BESS with the aim of reducing the curtailment. A photovoltaic production simulation was carried out using the Python library pvlib [11], together with weather data from the ERA5-land database [12]. The combination of the pvlib library with the ERA5-land data for multiple installations was validated by Ramirez Camargo et al. [13]. pvlib is a model that converts time series of weather data into AC solar power generation for a given PV system and location. The weather data used as inputs were the global horizontal irradiance, the wind speed and temperature. The tool also provides the ability to choose between different types of PV modules and inverters which have their own specific parameters. We stuck to the reference module suggested by the tool, namely a mono-C-Si module. The simulation output is a production profile for the modules already installed. At the same time, for future installations, it will be a normalised profile for a 1 kWp installation that will be scaled up with the optimal size chosen by the optimisation model presented in Section 2.4.

2.3. Scenarios Construction

Four potential scenarios for the investment and operation of future energy systems were developed. Each of these scenarios was analysed two times: one with diesel prices for the financial year 2021/22 and one with higher diesel prices registered at the time of writing (November 2022). To assess the impacts of the proposed measures, a comparison with the business-as-usual (BAU) situation for the two fuel prices is also presented. The Flex scenarios introduced demand-side management (DSM) of the selected flexible loads, while the BESS scenarios also added the possibility of installing a battery together with DSM. In the RES scenarios, all combinations of assets were allowed: DSM, BESS, DG and additional PV installation. Finally, NoGen scenarios included all the possibilities of the RES scenarios except the diesel generator. For both the RES and the NoGen scenarios, the maximum size allowed for the new PV installations was limited to an additional 500 kWp, half facing South and half facing North (dictated by the roof configuration). This will lead to a total of five scenarios for each diesel price, summarised in Table 4.
The proposed scenarios aim to gradually reduce the generators’ dependency and, at the same time, increase PV self-consumption. The difference in the assets present in the scenario allowed also to compare different levels of investment. For example, the Flex scenarios will require no costs compared to the larger investments needed to completely replace the generators with renewable sources, as in the NoGen scenarios. The technical and economic parameters used in the analysis are shown in Table 5.

2.4. Optimisation Problem Formulation

In this section, the formulation of the optimisation problem is presented. The main structure of the model follows the previous work of the authors presented in [19]. The model was written in Python by means of the Pyomo framework [20], while the Gurobi solver [21] was used to solve the optimisation problem. The objective function for all scenarios is the minimisation of the yearly LCOE, defined as:
L C O E = E A C + C o p t T d t · Δ t
where E A C is the equivalent annual cost of investment, C o p is the total operational cost over the year and t T d t is the total demand for electricity during the year. The equivalent annual cost represents the sum of the annual cost of owning every new asset over its entire lifetime, and it is defined as:
E A C = a A y a · C a p a · C a · d 1 ( 1 + d ) L a
where y a is a binary variable that indicates if the asset a is newly installed, hence included in the calculation, or was already existing. C a p a is the installed capacity of asset a included in the set A, which contains PV and BESS assets. The yearly operational cost is defined as the sum of the cost of import of electricity from the national grid and the diesel consumed over the time horizon T:
C o p = t T ( P t i m p · λ g r i d + F t D G · λ f u e l ) · Δ t
where P t i m p is the power imported from the national grid at each time step t, λ g r i d is the price of electricity, F t D G is the fuel consumption of the DG and λ f u e l is the fuel cost. Equation (4) links imported power to the consuming assets, in this case, the demand and potentially the BESS charging:
P t i m p = P t g 2 d + P t g 2 b t T
where P t g 2 d is the power directly consumed from the grid and P t g 2 b is the power from the grid that goes into the battery, if any, for every time step t. Electrical demand must be satisfied at all times by power either imported from the grid or produced by the assets present in the community:
d t b a s e + d t f l e x = P t g 2 d + P t p v 2 d + P t b 2 d + P t d g 2 d t T
with d t b a s e being the base load demand, d t f l e x the flexible load demand, P t p v 2 d the self-consumed PV power, P t b 2 d the power discharged from the battery to the load and P t d g 2 d the power produced from the diesel generator. Additional constraints are needed to represent the power output of the various assets. Battery state-of-charge balance is formulated as follows:
e t + 1 b = e t b + Δ t · ( P t c h · η c h P t d i s c h η d i s c h ) t T
where e t b is the energy content of the battery, P t c h is the charging power and P t d i s c h is the discharging power. Furthermore, the charging and discharging powers are limited by the maximum C-rate values (Equations (7) and (8)), the state-of-charge is bound (Equation (9)) and charging and discharging cannot occur simultaneously (Equation (10)).
P t c h p c h ¯ · C a p b t T
P t d i s c h p d i s c h ¯ · C a p b t T
S O C m i n e t b C a p b t T
P t c h · P t d i s c h = 0 t T
Diesel generator power output is linked to the fuel input by its efficiency η D G :
P t D G = F t D G · η D G
and has to be always running above its minimum partial load:
P m i n D G · y o n D G P t D G t T
where y o n D G is a binary variable indicating if the generator is on or off. The flexible load is modelled by optimising its power consumption, d t f l e x , at every time step to satisfy its daily demand, D d f l e x :
D d f l e x = h d d h f l e x d D
where D is the set of days in a year and h represents the quarterly-hour time steps of every day, d. To complete the set of constraints, additional equations were required to balance the output of the various assets. Solar PV production is divided in the self-consumed power, P t p v 2 d , curtailed power, P t c u r t , or power for charging the battery, P t p v 2 b :
P t p v = P t p v 2 d + P t p v 2 b + P t c u r t
The power to charge the battery can come from the grid or PV:
P t c h = P t p v 2 b + P t g 2 b
The discharging power can only be directly consumed by the demands, since no injection into the national grid is allowed:
P t d i s c h = P t b 2 d
At the end of the optimisation, with all power flow variables and asset capacities known, it is possible to calculate various key performance indicators that will help to understand the results. Equation (17) represents the annual CO 2 emissions per kWh consumed (g CO 2 /kWh), which is the sum of all emissions that includes the carbon content of the electricity from the grid, the burning of fuel and the annualised carbon footprint of the production of PV and BESS:
E C O 2 = t T ( P t i m p · E g r i d + F t D G · E f u e l ) · Δ t + C a p P V · E P V / L P V + C a p B E S S · E B E S S / L B E S S t T d t · Δ t
the self-consumption ratio is defined as the ratio between the renewable self-consumed energy and the total renewable energy produced:
S C R = 100 · t T ( P t p v P t c u r t ) · Δ t t T P t p v · Δ t
while the self-sufficiency ratio is the ratio between the renewable self-consumed energy and the total demand:
S S R = 100 · t T ( P t p v P t c u r t ) · Δ t t T d t · Δ t
The yearly savings, Δ C s , expressed in UGX/year, of each scenario, are defined as the difference between their operational cost and those of the scenario BAU:
Δ C s = C o p B A U C o p s
The total investment is simply the sum of the capital expenditure for all the assets a:
C A P E X = a A C a p a · C a
Finally, the simple payback time is defined as the ratio between the CAPEX and the yearly savings Δ C s :
S P T = C A P E X Δ C s

2.5. Stakeholder Engagement Workshop

All relevant stakeholders were invited to a workshop to look into potential future energy solutions at St. Mary’s Hospital. All participants received a survey a couple of weeks beforehand, in which they could indicate which elements are important to their organisation regarding energy supply. Three groups of stakeholders responded to the survey: representatives of the hospital itself, the residential area on site and the hospital school. The energy distributor UMEME decided not to fill out this survey, but to make their views clear during the workshop. The output of this exercise was used in the workshop itself, in which a total of 12 stakeholders were present. The detailed methodology of the stakeholder engagement workshop has been described in the work of Lode et al. [22], where the same approach was used for seven different potential energy communities.

3. Results

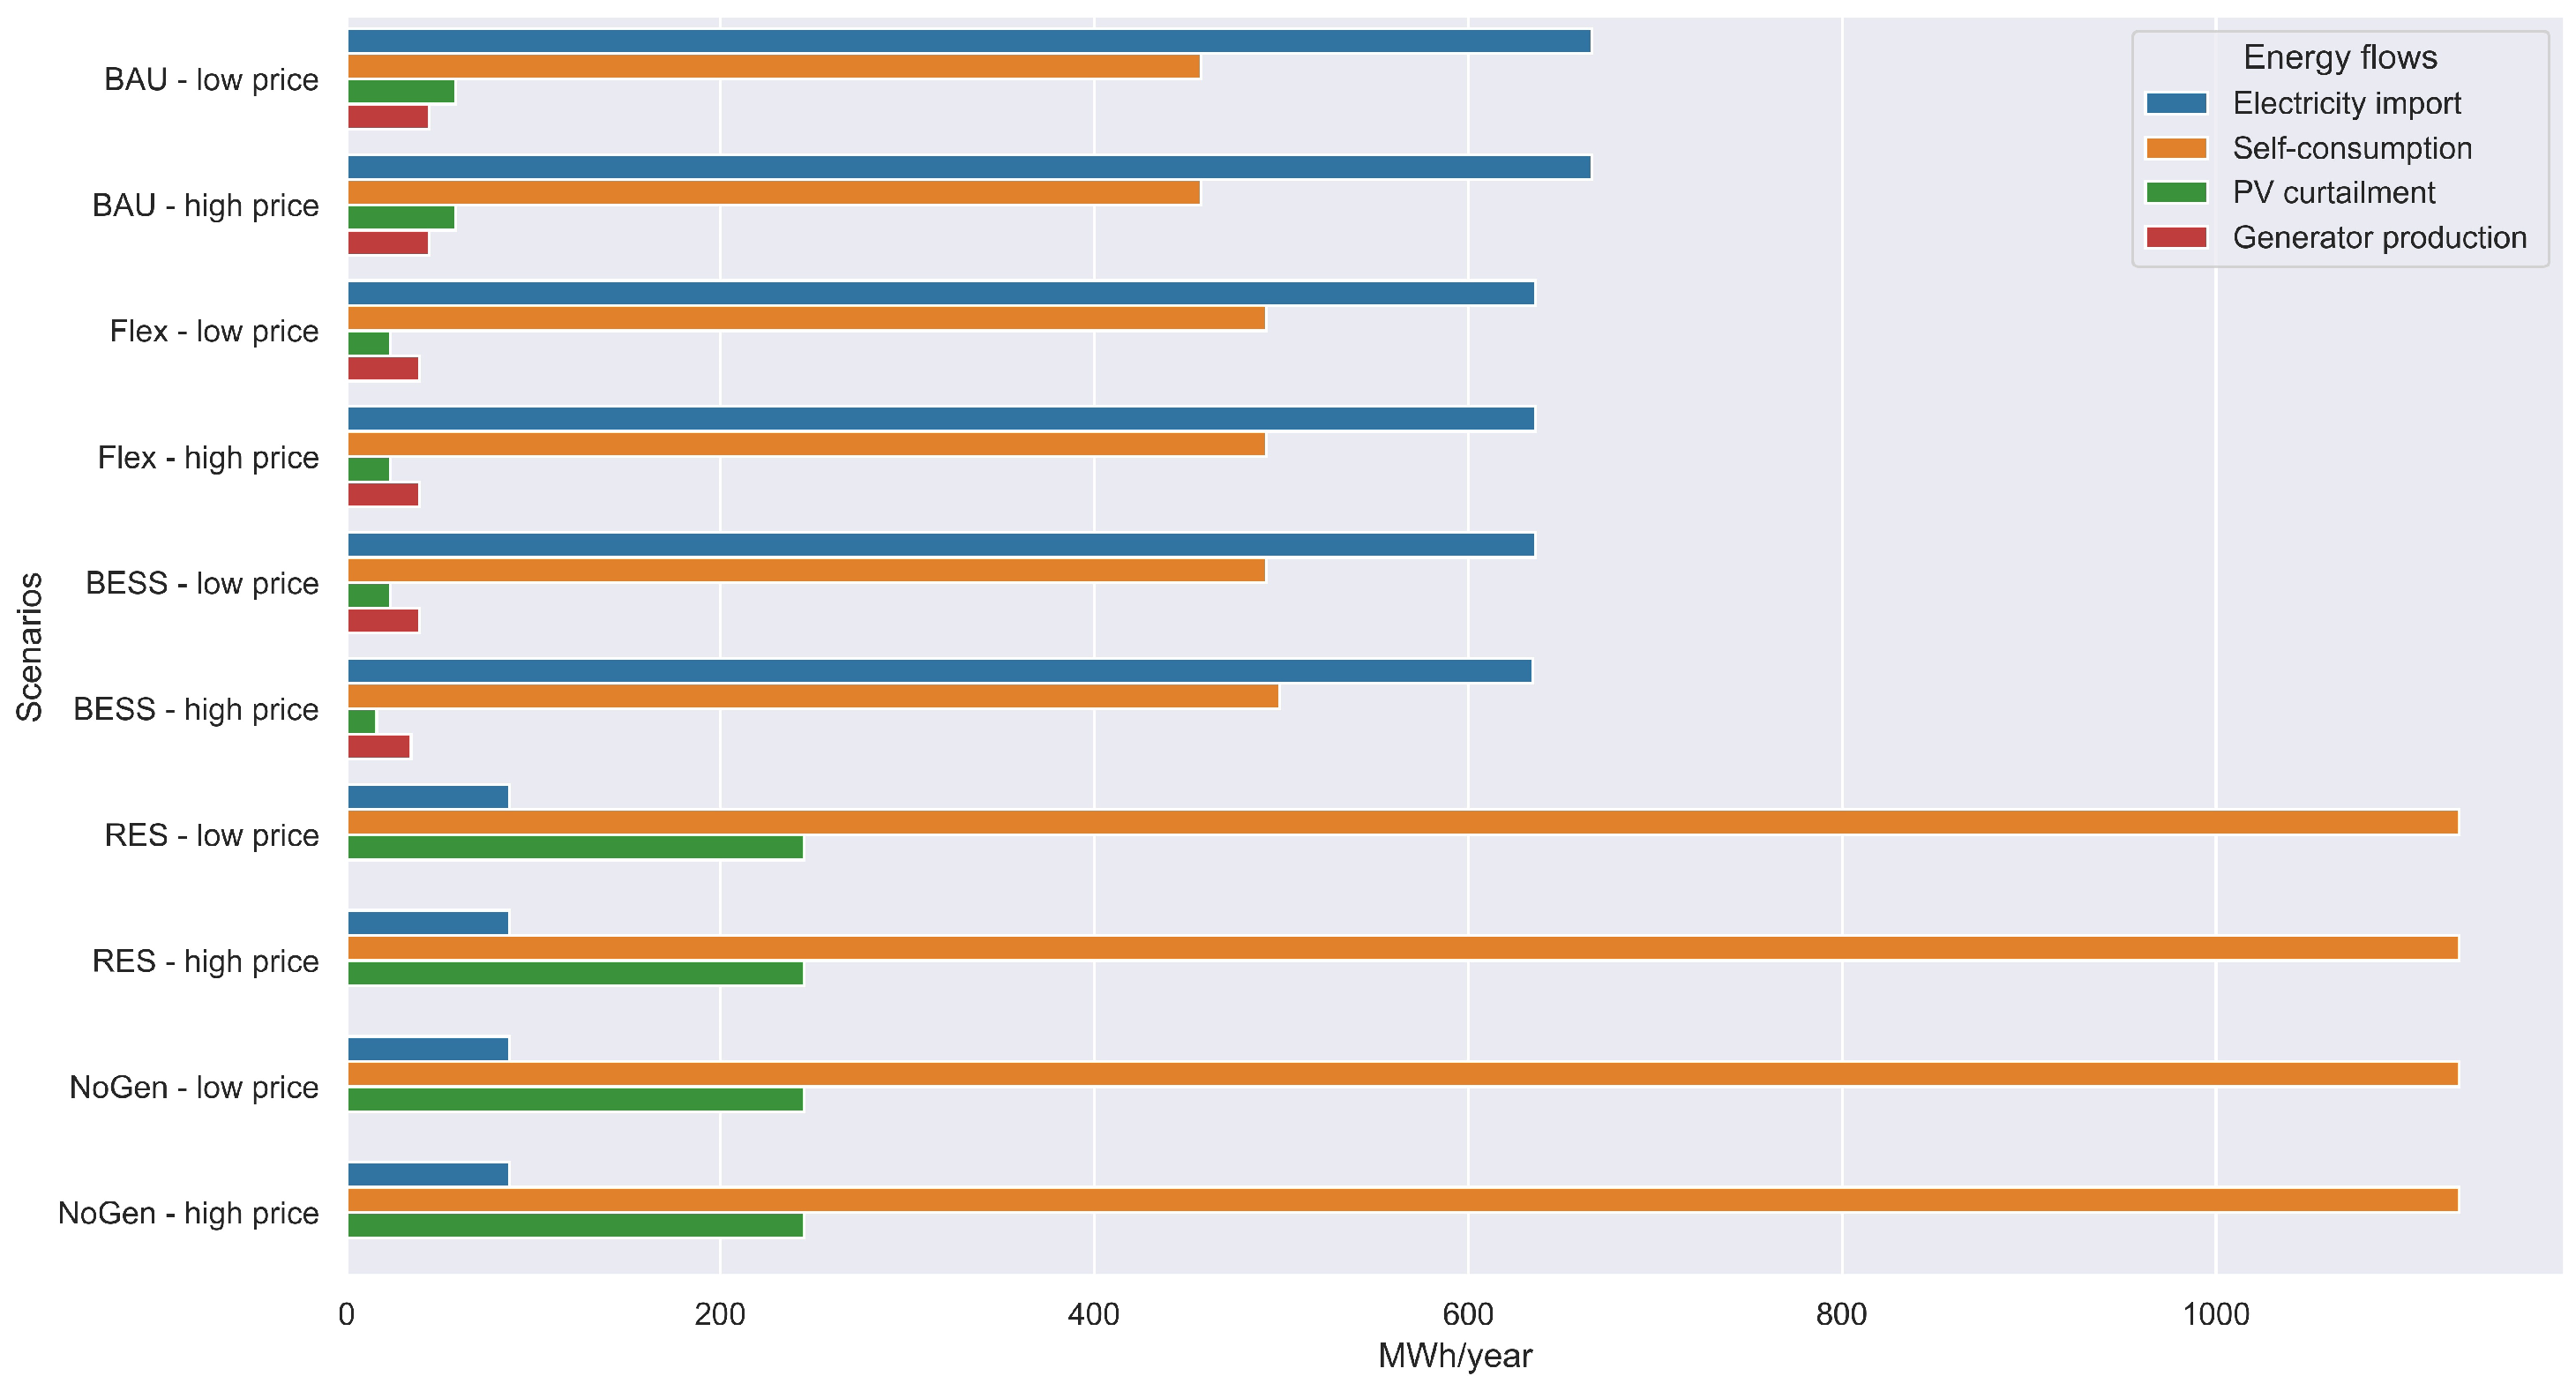
3.1. Optimisation Results

This section will present the results of the optimisation problem. Technical, economic and environmental KPIs were compared for all the scenarios. Table 6 and Table 7 show the optimal capacities of PV and BESS for both price scenarios. It can be seen that, except for the BESS scenario where a 50 kWh is optimal with a higher price of diesel, all other results in terms of capacities are the same for the two diesel prices. The equal results for scenarios RES and NoGen mean that phasing out the diesel generator is the cost-optimal solution even when its use is still allowed. This is achieved by maximising the photovoltaic installation coupled with a battery of more than 1.5 MWh.
The change in the various energy sources that cover the final demand is shown in Figure 6. The introduction of DSM results in an increase in self-consumption at the expense of PV curtailment. Consequently, it also leads to a slight reduction in imports from the grid (−5%) and DG utilisation (−12%). In the BESS scenarios, battery installation is convenient only in the case of higher diesel prices. This leads to a further small decrease in grid imports (−1%) and generator usage (−12%) compared to the Flex scenarios. Moving toward scenarios with higher use of photovoltaic energy and the introduction of storage options, we see a dramatic increase (+130%) in self-consumed energy produced from the combination of photovoltaic energy and BESS compared to scenario Flex. This drastically reduces the electricity imported from the national grid (−86%). However, an augmentation of the curtailed energy by almost ten-fold can also be observed. This is a consequence of the high PV capacity needed to satisfy demand when the grid is unavailable, which will result in a high amount of overproduction during low-demand periods. The fact that in the RES scenario, where DG usage is allowed, the generator is not used, means that purely from an economic point of view, it is better to “oversize” the PV and BESS installation and consequently waste energy by curtailment rather than burning diesel for the generator.
The energy results detailed above have different economic consequences, as presented in Table 8 for low diesel prices and in Table 9 for higher diesel prices. For the first set of scenarios, the results for the scenarios Flex and BESS are the same, since no battery is installed. The yearly savings are limited to just above 5% compared to the reference case. Still, the main advantage is that the savings come at no cost, just by introducing the steering of the sterilisation machines. Regarding RES and NoGen scenarios, which also have the same results due to the same optimal configuration, the annual savings reach over 25% compared to the reference case. However, the initial investment cost for reaching these annual savings is over UGX 3.6 billion, which still results in a limited simple payback time of 6.2 years.
The increase in diesel price obviously results in higher LCOE for BAU, Flex and BESS scenarios, while for the last two, no difference in LCOE is seen due to not using the DG. The higher price of fuel also means opportunities to further increase savings by switching to renewable energy sources, as can be seen by comparing the results between Table 8 and Table 9. The introduction of DSM once again results in cost savings of more than 5%, while the introduction of the battery in the BESS scenario has very little impact on the final LCOE and savings, and comes with a moderate investment cost that will be paid back in less than 2 years. The LCOE and the total investment needed to reach it are the same for both fuel price scenarios, but in the case of a higher diesel price, the savings increase to almost 30% compared to the reference case, while the simple payback time goes below 6 years.
Table 10 presents the self-consumption ratio, self-sufficiency ratio and CO 2 emission results for the lower price of diesel. Following the trends in the other indicator of results, the Flex scenario achieves a reduction in emissions of more than 5% compared to the BAU scenarios due to an increase in both self-consumption and self-sufficiency. For the RES ad NoGen scenarios, the emissions reduction reaches a considerably higher value, over 74% less than the reference case. This is due to the fact that the community has almost become independent of the national grid without using a diesel generator, reaching 96.83% self-sufficiency. Again, it can be seen that this comes at the cost of increasing curtailment because, in these scenarios, the self-consumption ratio drops to 82.2%, the lowest value among all scenarios.

3.2. Workshop Results

In the survey section that enquired about the essential objectives concerning energy supply, the hospital representatives indicated that the stability and reliability of the network were their main concerns. Being a non-profit institution, the hospital is guided by its mission of providing the best service possible to the needy, and a reliable power supply is essential for that. A lower energy bill, reducing expenses for the hospital and the users, was considered the second most important objective, followed by a reduction in emissions. Gaining more autonomy from the central grid can be nice to have but was not considered essential. The representatives of the residential area explained that they placed a clear emphasis on safety for themselves and their families above all else. New systems, therefore, need to be installed properly and maintained well to ensure this. A lower energy bill was next on their list of important objectives, followed by grid reliability and applicability, which are not considered essential as long as safety is guaranteed. Respondents also mentioned some additional important boundary conditions and concerns. The first is the fact that a new installation must come with training opportunities for energy technicians to ensure a secure and efficient installation as well as maintenance. The evaluation of the scenarios, based on each stakeholder’s needs, showed that the scenario in which current generators are replaced by a more sustainable alternative of additional PV with batteries scored better for all hospital stakeholder groups. This was mainly due to the resulting emissions reduction, lower cost of energy and higher energy reliability. The major disadvantage of this scenario was the big initial investment cost that is required, even though the payback time is quite short (around 6 years). The hospital cannot pay this amount upfront, so other solutions would have to be found.

4. Discussion

Before discussing the results presented in the previous section, an explanation of the limitations of the proposed method is necessary. The study is a techno-economic analysis considering some basic environmental indicators, but we did not perform a full life-cycle analysis. Therefore, for example, costs, environmental impact and technical challenges concerning assets disposal (PV panels and batteries) were not taken into consideration. The optimisation model utilised in this work was purely deterministic. Hence, the results presented are optimal only under the same exact conditions (e.g., the same number of hours of grid failure). Nevertheless, the results presented here are of valuable importance for a quick assessment of the financial feasibility of investing in new energy assets. Our results show an interesting potential of DSM techniques; optimally displacing only 7% of total demand will achieve a reduction in cost and emissions of 5%. A detailed analysis of all the loads and activities in the hospital could potentially identify new dispatchable loads and increase the flexibility potential and the economic and environmental benefits, without or with contained additional costs due to extra control systems needed. However, due to the critical activities conducted at the hospital, it may be difficult to find such additional dispatchable loads. With the actual size of the PV system, the investment in BESS makes sense only with the current high price of diesel, even though the combination of BESS and DSM provides less than 1% of gains compared to the situation with only DSM. The results for the RES and the NoGen scenarios are identical, which means that purely from an economic point of view, it is better to avoid using a diesel generator and replace it completely with a combination of PV and a battery storage system. However, this result is not practical because of both the high initial investment needed and the high capacity needed for both PV and BESS, which will risk overloading the hospital LV grid. One potential solution for coping with the high investment cost is applying for project funds from external sources, which could be key to overcoming the entry barrier of RES development in SSA. Another potential solution is to implement the system in a modular way, as presented in [6], in which new assets can be added each year depending on available financial resources and the continuous evolution of energy needs. This second option can also tackle another problem that comes from the optimal configuration: the resulting sizes of new assets are mostly needed to cope with the moments when the grid is unavailable, leaving plenty of energy for the other moments. This will lead to an increase in curtailed energy as well as a dramatic decrease in imports from the national grid. The last point, even if positive from an economic point of view, is not the goal of either the hospital stakeholders or the grid operator UMEME. Representatives from the grid operator stated their concerns about potentially losing their main customer in the area. The gradual increase in the RES assets would also cover the already planned increase in electricity consumption of the hospital; namely, the expansion of the staff quarters, electrification of the waste disposal system and partial electrification of cooking, which to this day is mostly done by burning firewood. During the workshop, it was also discussed that further cooperation between UMEME and the hospital could produce additional advantages for both. With new assets, the latter could, for example, also offer services such as grid balancing and/or signing a Power Purchase Agreement to sell the excess of power to the national grid, that under current regulations can only be done for a producing capacity of at least 500 kWp.
In conclusion, this study demonstrates the technical and economic potential of RES to reduce or phase out costly and polluting diesel generators as well as assure a more stable supply of energy. However, the entry cost remains the main barrier to the decarbonisation of the energy supply system.

Author Contributions

Conceptualisation, A.F. and J.B.; methodology, A.F.; software, A.F.; validation, A.F., J.B., A.M.A., M.M. and T.C.; formal analysis, A.F., J.B. and A.M.A.; investigation, A.F., J.B. and A.M.A.; resources, J.B., M.M. and T.C.; data curation, A.F., J.B. and A.M.A.; writing—original draft preparation, A.F., J.B. and A.M.A.; writing—review and editing, A.F., J.B., A.M.A., M.M. and T.C.; visualisation, A.F.; supervision, J.B., M.M. and T.C.; project administration, M.M. and T.C.; funding acquisition, M.M. and T.C. All authors have read and agreed to the published version of the manuscript.

Funding

This research was funded by the European Union’s Horizon 2020 research and innovation program under grant agreement no. 824342 as well as from VLAIO in the ICON project MAMUET (grant number HBC.2018.0529). The APC was funded by VLAIO in the ICON project MAMUET (grant number HBC.2018.0529).

Data Availability Statement

The data presented in this study are openly available in Lacor Hospital’s energy community—Power data at https://doi.org/10.5281/zenodo.7466652 (accessed on 21 December 2022).

Conflicts of Interest

The authors declare that they have no known competing financial interests or personal relationships that could have appeared to influence the work reported in this paper.

References

  1. Singer, B.C.; Tschudi, W.F. High Performance Healthcare Buildings: A Roadmap to Improved Energy Efficiency; Lawrence Berkeley National Laboratory: Berkeley, CA, USA, 2009. [Google Scholar]
  2. Wang, T.; Li, X.; Liao, P.C.; Fang, D. Building energy efficiency for public hospitals and healthcare facilities in China: Barriers and drivers. Energy 2016, 103, 588–597. [Google Scholar] [CrossRef]
  3. IEA. Africa Energy Outlook 2022; IEA: Paris, France, 2022. [Google Scholar] [CrossRef]
  4. Farquharson, D.V.; Jaramillo, P.; Samaras, C. Sustainability implications of electricity outages in sub-Saharan Africa. Nat. Sustain. 2018, 1, 589–597. [Google Scholar] [CrossRef]
  5. Li, J.; Niu, D.; Wu, M.; Wang, Y.; Li, F.; Dong, H. Research on Battery Energy Storage as Backup Power in the Operation Optimization of a Regional Integrated Energy System. Energies 2018, 11, 2990. [Google Scholar] [CrossRef] [Green Version]
  6. Rodríguez-Gallegos, C.D.; Gandhi, O.; Bieri, M.; Reindl, T.; Panda, S.K. A diesel replacement strategy for off-grid systems based on progressive introduction of PV and batteries: An Indonesian case study. Appl. Energy 2018, 229, 1218–1232. [Google Scholar] [CrossRef]
  7. Kiray, V.; Orhan, M.; Chijioke, J.N. Significant Increase in Fuel Efficiency of Diesel Generators with Lithium-Ion Batteries Documented by Economic Analysis. Energies 2021, 14, 6904. [Google Scholar] [CrossRef]
  8. RENAISSANCE EU H2020. Renaissance H2020 Project towards Sustainable Energy Communities. Available online: https://www.renaissance-h2020.eu/ (accessed on 20 December 2022).
  9. Coosemans, T.; Brosius, W.; Ramirez Camargo, L.; Heuninckx, S.; Luisa Lode, M.; Felice, A.; Martinez Alonso, A.; Arapoglou, S.; Hueting, R.; Meitern, M. D6.3 Report on Replication Validation—Renaissance H2020 Project; Technical Report, EC Grant Agreement No 824342. 2022. Available online: https://www.renaissance-h2020.eu/resource/d6-3-report-on-replication-validation/ (accessed on 20 December 2022).
  10. Mandelli, S.; Barbieri, J.; Mereu, R.; Colombo, E. Off-grid systems for rural electrification in developing countries: Definitions, classification and a comprehensive literature review. Renew. Sustain. Energy Rev. 2016, 58, 1621–1646. [Google Scholar] [CrossRef]
  11. Holmgren, W.F.; Hansen, C.W.; Mikofski, M.A. pvlib python: A python package for modeling solar energy systems. J. Open Source Softw. 2018, 3, 884. [Google Scholar] [CrossRef] [Green Version]
  12. Copernicus. Copernicus Climate Data Store. Available online: https://cds.climate.copernicus.eu/#!/home (accessed on 20 December 2022).
  13. Ramirez Camargo, L.; Schmidt, J. Simulation of multi-annual time series of solar photovoltaic power: Is the ERA5-land reanalysis the next big step? Sustain. Energy Technol. Assessments 2020, 42, 100829. [Google Scholar] [CrossRef]
  14. Romare, M.; Dahllöf, L. The Life Cycle Energy Consumption and Greenhouse Gas Emissions from Lithium-Ion Batteries. A Study with Focus on Current Technology and Batteries for Light-Duty Vehic; Number C. 2017, p. 58. Available online: https://www.ivl.se/download/18.694ca0617a1de98f473b98/1628417788414/FULLTEXT01.pdf (accessed on 20 December 2022).
  15. Wild-Scholten. Solar resources and carbon footprint of photovoltaic power in different regions in europe. Katalog BPS 2014, XXXIII, 81–87. [Google Scholar] [CrossRef]
  16. Uganda Diesel Prices. Available online: https://www.globalpetrolprices.com/ (accessed on 7 November 2022).
  17. IRENA. Uganda—Country Indicators and Sdgs; Technical Report; IRENA: Deblin, Poland, 2019. [Google Scholar]
  18. UBA. Umweltbundesamt|Für Mensch und Umwelt; UBA: Seoul, Republic of Korea, 2022. [Google Scholar]
  19. Felice, A.; Rakocevic, L.; Peeters, L.; Messagie, M.; Coosemans, T.; Ramirez Camargo, L. Renewable energy communities: Do they have a business case in Flanders? Appl. Energy 2022, 322, 119419. [Google Scholar] [CrossRef]
  20. Hart, W.E.; Laird, C.D.; Watson, J.P.; Woodruff, D.L.; Hackebeil, G.A.; Nicholson, B.L.; Siirola, J.D. Pyomo—Optimization Modeling in Python. In Springer Optimization and Its Applications; Springer International Publishing: Cham, Swizerland, 2017; Volume 67. [Google Scholar] [CrossRef]
  21. Gurobi Optimization, LLC. Gurobi Optimizer Reference Manual. Available online: https://www.gurobi.com/wp-content/plugins/hd_documentations/documentation/9.0/refman.pdf (accessed on 20 December 2022).
  22. Lode, M.L.; Heuninckx, S.; te Boveldt, G.; Macharis, C.; Coosemans, T. Designing successful energy communities: A comparison of seven pilots in Europe applying the Multi-Actor Multi-Criteria Analysis. Energy Res. Soc. Sci. 2022, 90, 102671. [Google Scholar] [CrossRef]
Figure 1. Overview of the hospital community.
Energies 16 01369 g001
Figure 2. Typical hospital load curve.
Energies 16 01369 g002
Figure 3. Example of PV production curve.
Energies 16 01369 g003
Figure 4. Average daily consumption profile and its standard deviation.
Energies 16 01369 g004
Figure 5. Average daily profile of the flexible load and its standard deviation.
Energies 16 01369 g005
Figure 6. Yearly details on the composition of energy consumption for all scenarios.
Energies 16 01369 g006
Table 1. Electricity costs of the hospital for financial year 2021/22.
Electricity SourceCost
UMEMEUGX 555,063,000
Backup DGsUGX 72,650,000
PV (savings)(UGX 203,845,000)
Total expenditureUGX 627,613,000
Table 2. Comparison of final energy consumption and production in the financial year 2021–2022 and reconstructed data.
DataFinancial Year 21/22Reconstructed Data
Total load945 MWh/year1154 MWh/year
Backup DGs46 MWh/year48 MWh/year
Table 3. Characteristics of solar PV of community installations.
Capacity (kWp)OrientationTilt (°)
155North6
110South6
25East20
25West20
Table 4. Summary of scenarios per diesel price.
Scenario NameDG AllowedDemand-Side ManagementBESS InvestmentAdditional PV Investment
BAU×××
Flex××
BESS×
RES
NoGen×
Table 5. Techno-economic parameters.
ParameterSymbolValue
DG efficiency η D G 22%
DG minimum partial load P m i n D G 80 kW
Maximum power of flexible load m f l e x 70 kW
BESS efficiencies η c h / η d i s c h 95%
BESS minimum SOC S O C m i n 0.1
Maximum charging C-rate p c h ¯ 0.5 h 1
Maximum discharging C-rate p d i s c h ¯ 0.5 h 1
BESS CAPEX C B E S S UGX 1,688,000 /kWh
BESS lifetime L B E S S 10 years
BESS carbon content E B E S S 90 kg CO 2 /kWh [14]
PV CAPEX C P V UGX 1,875,684 /kWp
PV lifetime L P V 25 years
PV carbon content E P V 1798 kg CO 2 /kWp [15]
Electricity price λ g r i d UGX 891 /kWh
Higher diesel price λ f u e l ¯ UGX 532 /kWh [16]
Lower diesel price λ f u e l ̲ UGX 345 /kWh
Ugandan average grid carbon content E g r i d 106 g CO 2 /kWh [17]
Diesel carbon content E f u e l 270 g CO 2 /kWh [18]
Discount rated5%
Table 6. PV and BESS optimal capacity results with lower diesel price.
Scenario NameTotal PV Capacity (kWp)Additional PV Capacity (kWp)BESS Capacity (kWh)
BAU315××
Flex315××
BESS315×0
RES8155001591
NoGen8155001591
Table 7. PV and BESS optimal capacity results with higher diesel price.
Scenario NamePV Capacity (kWp)Additional PV Capacity (kWp)BESS Capacity (kWh)
BAU315××
Flex315××
BESS315×50
RES8155001591
NoGen8155001591
Table 8. Summary of economic results with a lower price of diesel.
Scenario NameLCOE (UGX/kWh)Yearly Savings (%)Total Investment (MUGX)Simple Payback Time (years)
BAU567.81---
Flex538.035.2500
BESS538.035.2500
RES421.6425.7436246.20
NoGen421.6425.7436246.20
Table 9. Summary of economic results with a higher price of diesel.
Scenario NameLCOE (UGX/kWh)Yearly Savings (%)Total Investment (MUGX)Simple Payback Time (Years)
BAU599.91---
Flex566.365.5900
BESS564.815.85851.63
RES421.6429.7236245.82
NoGen421.6429.7236245.82
Table 10. Self-consumption ratio, self-sufficiency ratio and CO 2 emission results with lower diesel price.
Scenario NameSelf-Consumption Ratio (%)Self-Sufficiency Ratio (%)Emissions (g CO 2 /kWh)Emissions Reduction (%)
BAU89.5939.15288.35-
Flex95.8242.16272.045.65
BESS95.8242.16272.045.65
RES82.2096.8374.7374.08
NoGen82.2096.8374.7374.08
Disclaimer/Publisher’s Note: The statements, opinions and data contained in all publications are solely those of the individual author(s) and contributor(s) and not of MDPI and/or the editor(s). MDPI and/or the editor(s) disclaim responsibility for any injury to people or property resulting from any ideas, methods, instructions or products referred to in the content.

