Article

How Can Sustainable Public Transport Be Improved? A Traffic Sign Recognition Approach Using Convolutional Neural Network

1
School of Management, Shandong Technology and Business University, Yantai 264005, China
2
School of Computer Science and Technology, Dalian University of Technology, Dalian 116024, China
3
Key Laboratory of Ministry of Education for Efficient Mining and Safety of Metal Mines, School of Civil and Resource Engineering, University of Science and Technology Beijing, Beijing 100083, China
4
Western Australian School of Mines: Minerals, Energy and Chemical Engineering, Curtin University, Perth, WA 6845, Australia
*
Authors to whom correspondence should be addressed.
Energies 2022, 15(19), 7386; https://doi.org/10.3390/en15197386
Submission received: 8 September 2022 / Revised: 2 October 2022 / Accepted: 4 October 2022 / Published: 8 October 2022
(This article belongs to the Special Issue Advances in Energy and Resource Efficiency and Sustainable Policy)

Abstract

:
Sustainable public transport is an important factor to boost urban economic development, and it is also an important part of building a low-carbon environmental society. The application of driverless technology in public transport injects new impetus into its sustainable development. Road traffic sign recognition is the key technology of driverless public transport. It is particularly important to adopt innovative algorithms to optimize the accuracy of traffic sign recognition and build sustainable public transport. Therefore, this paper proposes a convolutional neural network (CNN) based on k-means to optimize the accuracy of traffic sign recognition, and it proposes a sparse maximum CNN to identify difficult traffic signs through hierarchical classification. In the rough classification stage, k-means CNN is used to extract features, and improved support vector machine (SVM) is used for classification. Then, in the fine classification stage, sparse maximum CNN is used for classification. The research results show that the algorithm improves the accuracy of traffic sign recognition more comprehensively and effectively, and it can be effectively applied in unmanned driving technology, which will also bring new breakthroughs for the sustainable development of public transport.

1. Introduction

With the rapid development of urbanization, transportation has gradually become an important issue affecting human living environments around the world. At the first United Nations Global Conference on Sustainable Transport held in 2016, it was proposed that sustainable transport development is critical to addressing climate change, reducing air pollution and improving road safety. The Sustainable Transport Report issued by the second United Nations Global Conference on Sustainable Transport held in Beijing in 2021 pointed out that sustainable transport is still the key to achieving the global sustainable development goal (https://www.un.org/zh/desa/2nd_global_sd_transport (accessed date 14 October 2021)). Because sustainable transportation has a wide and important impact on society in terms of the environment, economy and other aspects [1,2,3], many scholars have studied this from different aspects. Buyukozkan et al. [4] proposed an aggregation method for selecting a sustainable transportation scheme based on the intelligent fuzzy Choquet integral and group decision-making technology. Hatefi [5] used the fuzzy composite proportion evaluation method to study the urban transportation system strategy. Eliasson et al. (2015) considered that a sustainable transport policy may be overstated without considering the market and public responses [6]. Barfod [7] studied how stakeholders participate in the process of transportation planning and evaluation. From the perspective of environmental protection, some scholars believe that sustainable transportation should minimize carbon emissions while considering speed control, and they propose corresponding solutions [8]. Some scholars focus on clean and sustainable fuels that can be used for vehicles to reduce carbon emissions [9]. Although scholars have studied the theme of sustainable transportation from many aspects, few have studied sustainable public transport, which is an important aspect of sustainable transport [10]. Dubey et al. [11] believed that a sustainable supply chain could achieve long-term sustainable growth, which was focused on environmental, social and economic stability.
The research on sustainable public transport has attracted the attention of scholars since the 1990s. In the early stage, relevant research mainly focused on the concept, model, business strategy [12] and policy system of sustainable public transport [13,14]. However, there is little research on the application of technologies that can promote the sustainable development of public transport. Autonomous vehicles have the potential to improve public transport safety, climate change and air pollution by addressing road challenges, and they will be a key technological breakthrough for safe and sustainable cities. Studies have shown that the sustainable development of public transport can immensely reduce carbon emissions [15,16], while driverless transport is produced under the premise of ensuring safety and saving energy in the world’s low carbon economy. Statistics show that if we can combine driverless public transport, electric vehicles and public transport, by 2050, car travel will be cut by more than half, the number of cars will be cut by nearly three quarters, and global carbon emissions will be greatly reduced As shown in Figure 1, the carbon emissions of a car are an important part of the total carbon emissions. If the number of cars can be reduced, carbon emissions can be decreased. One of the main ways is to develop public transport, which can replace cars. A bus can be used by approximately 40 people, which can greatly abate the total number of cars. For public transport companies, costs are an important factor affecting their development, and labor costs are the main component.
The existing research on driverless public transport rarely involves sustainable transport research. Technical problems, especially traffic recognition technology, are an important obstacle to its development. Therefore, this paper provides a theoretical reference for the optimization of sustainable public transport by studying the road traffic sign recognition method as the key technology of driverless public transport. Road traffic sign recognition is the key technology of driverless public transport, which determines whether it can be implemented. However, traffic sign recognition is based on the recognition of natural scenes, and the recognition performance is highly susceptible to factors such as illumination, gas, motion blur, rotational tilt, and man-made damage. To solve these problems, convolutional neural network (CNN) began to be gradually used for road traffic sign recognition [17,18,19]. Most of the algorithms with high accuracy on the GTSRB (German Traffic Sign Recognition Benchmark) data set are CNN algorithms. In a CNN algorithm, the choice of the activation function has a very important influence on the final effect of the algorithm. Research has shown that different activation functions have great impacts on network performance [20]. Researchers have also developed a variety of activation functions, such as the sigmoid, tanh, and rectified linear units (ReLU). The network types and application fields for each activation function are different. At present, the choice of the activation function is still based on experience or experimentation. On the one hand, the choice based on experience may not be accurate; on the other hand, there may be cases where no prior knowledge can be learned. When the activation function is selected through an experiment, the other parameters of the training algorithm also need to be selected, which results in greatly increased test time for determining the optimal parameters, and this reduces the efficiency of the algorithm. Goodfellow et al. [21] creatively proposed the maxout neural network, taking the maximum value of a series of linear functions as its activation value and fitting multiple linear functions to the local linear activation function. The author also theoretically showed that when the number of linear functions tends to infinity, the method can be fit to any function. Cai further applied the maxout method to the field of speech recognition [22], and the experimental results showed that maxout could achieve good results even without dropout [23]. Rueda et al. [24] used maxout to combine neurons into more complex convex functions. Jin et al. [25] introduced maxout neurons based on the Bi-LSTM model to construct a Bi-LSTMM model to solve the gradient dispersion problem in the stochastic gradient descent algorithm and better optimize the training process. However, maxout has a disadvantage: its activation value distribution does not have the property of sparsity, which reduces the effect of the algorithm. This paper introduces ReLU to it and proposes a sparse maxout CNN.
Excellent learning algorithms have a significant impact on network performance. The traditional CNN adopts a supervised training method. However, there are too many parameters that need to be trained. In many cases, the number of available training samples is exceeded, and using the parameters makes it difficult to learn the optimal value. To solve the above problems, researchers proposed layer-by-layer unsupervised learning. Although this learning method can solve the problems of insufficient training samples and disappearing gradients, it also has problems. The characteristics are independent of the task and cannot be well applied to the specific problem to be solved, and the layer-by-layer unsupervised learning needs to be determined after the previous layer of parameters is determined. The whole process is relatively cumbersome, and the training time is also longer. Zhu et al. [26] proposed a deeply supervised CNN for prostate segmentation. Chen et al. [27] proposed an SS-HCNN for image classification. Jog et al. [28] proposed a CNN-based segmentation algorithm and studied it in a supervised manner. Laskar et al. [29] proposed a semi-supervised learning framework. Garg et al. [30] proposed an unsupervised CNN for single view depth estimation. Darugar et al. [31] used an unsupervised CNN for feature extraction. In this paper, an unsupervised learning algorithm is combined with a supervised learning algorithm. Using the k-means unsupervised learning algorithm, a CNN based on the k-means is proposed. On the one hand, it reduces the parameters of supervised training and eliminates the problem of gradient dispersion. On the other hand, it also makes the training characteristics related to specific tasks, which can improve the accuracy of classification.
Maxout’s activation value distribution does not have sparse properties, and sparse features have better effects than nonsparse features. Therefore, this paper uses the ReLU to introduce sparsity into maxout and to achieve the goal of reducing the dimension at the same time. The learning mode has a great influence on the effect of the CNN. This paper combines the unsupervised learning algorithm with the supervised learning algorithm and puts forward the CNN based on the k-means unsupervised learning algorithm.
In general, despite all the progress in the study of sustainable transport, the research on driverless technology in sustainable transport is still lacking, and the study of driverless technology in sustainable public transport is even less frequently researched. Because driverless technology can greatly reduce the number of bus drivers, it can greatly reduce the costs of public transport companies and promote the development of public transport. The development of public transport can greatly reduce the number of private cars, thus reducing carbon emissions. Road traffic sign identification is the key technology of driverless public transport, and the aim of this paper is to use a CNN to improve the road traffic recognition of driverless public transport. The recognition of road traffic signs is divided into a rough classification stage and a fine classification stage. In the rough classification stage, the proposed k-means CNN is used for feature extraction, and then, the SVM is used to classify the identifiers. In the fine classification stage, in order to improve the recognition accuracy, the sparse maxout CNN is used for classification.
The overall structure of this study takes the form of the following five sections: After the introduction section, Section 2 presents the material and proposed methods, Section 3 presents the research results, and Section 4 includes a discussion of the implications of the findings. Section 5 draws research conclusions.

2. Materials and Methods

2.1. Methods

We will improve the traditional CNN algorithm and develop two new CNN algorithms that carry out the rough and fine classification of road traffic signs in order to identify them. The accurate recognition of road traffic signs will promote the development of driverless public transport and its sustainable development. The algorithm flow chart is shown in Figure 2.

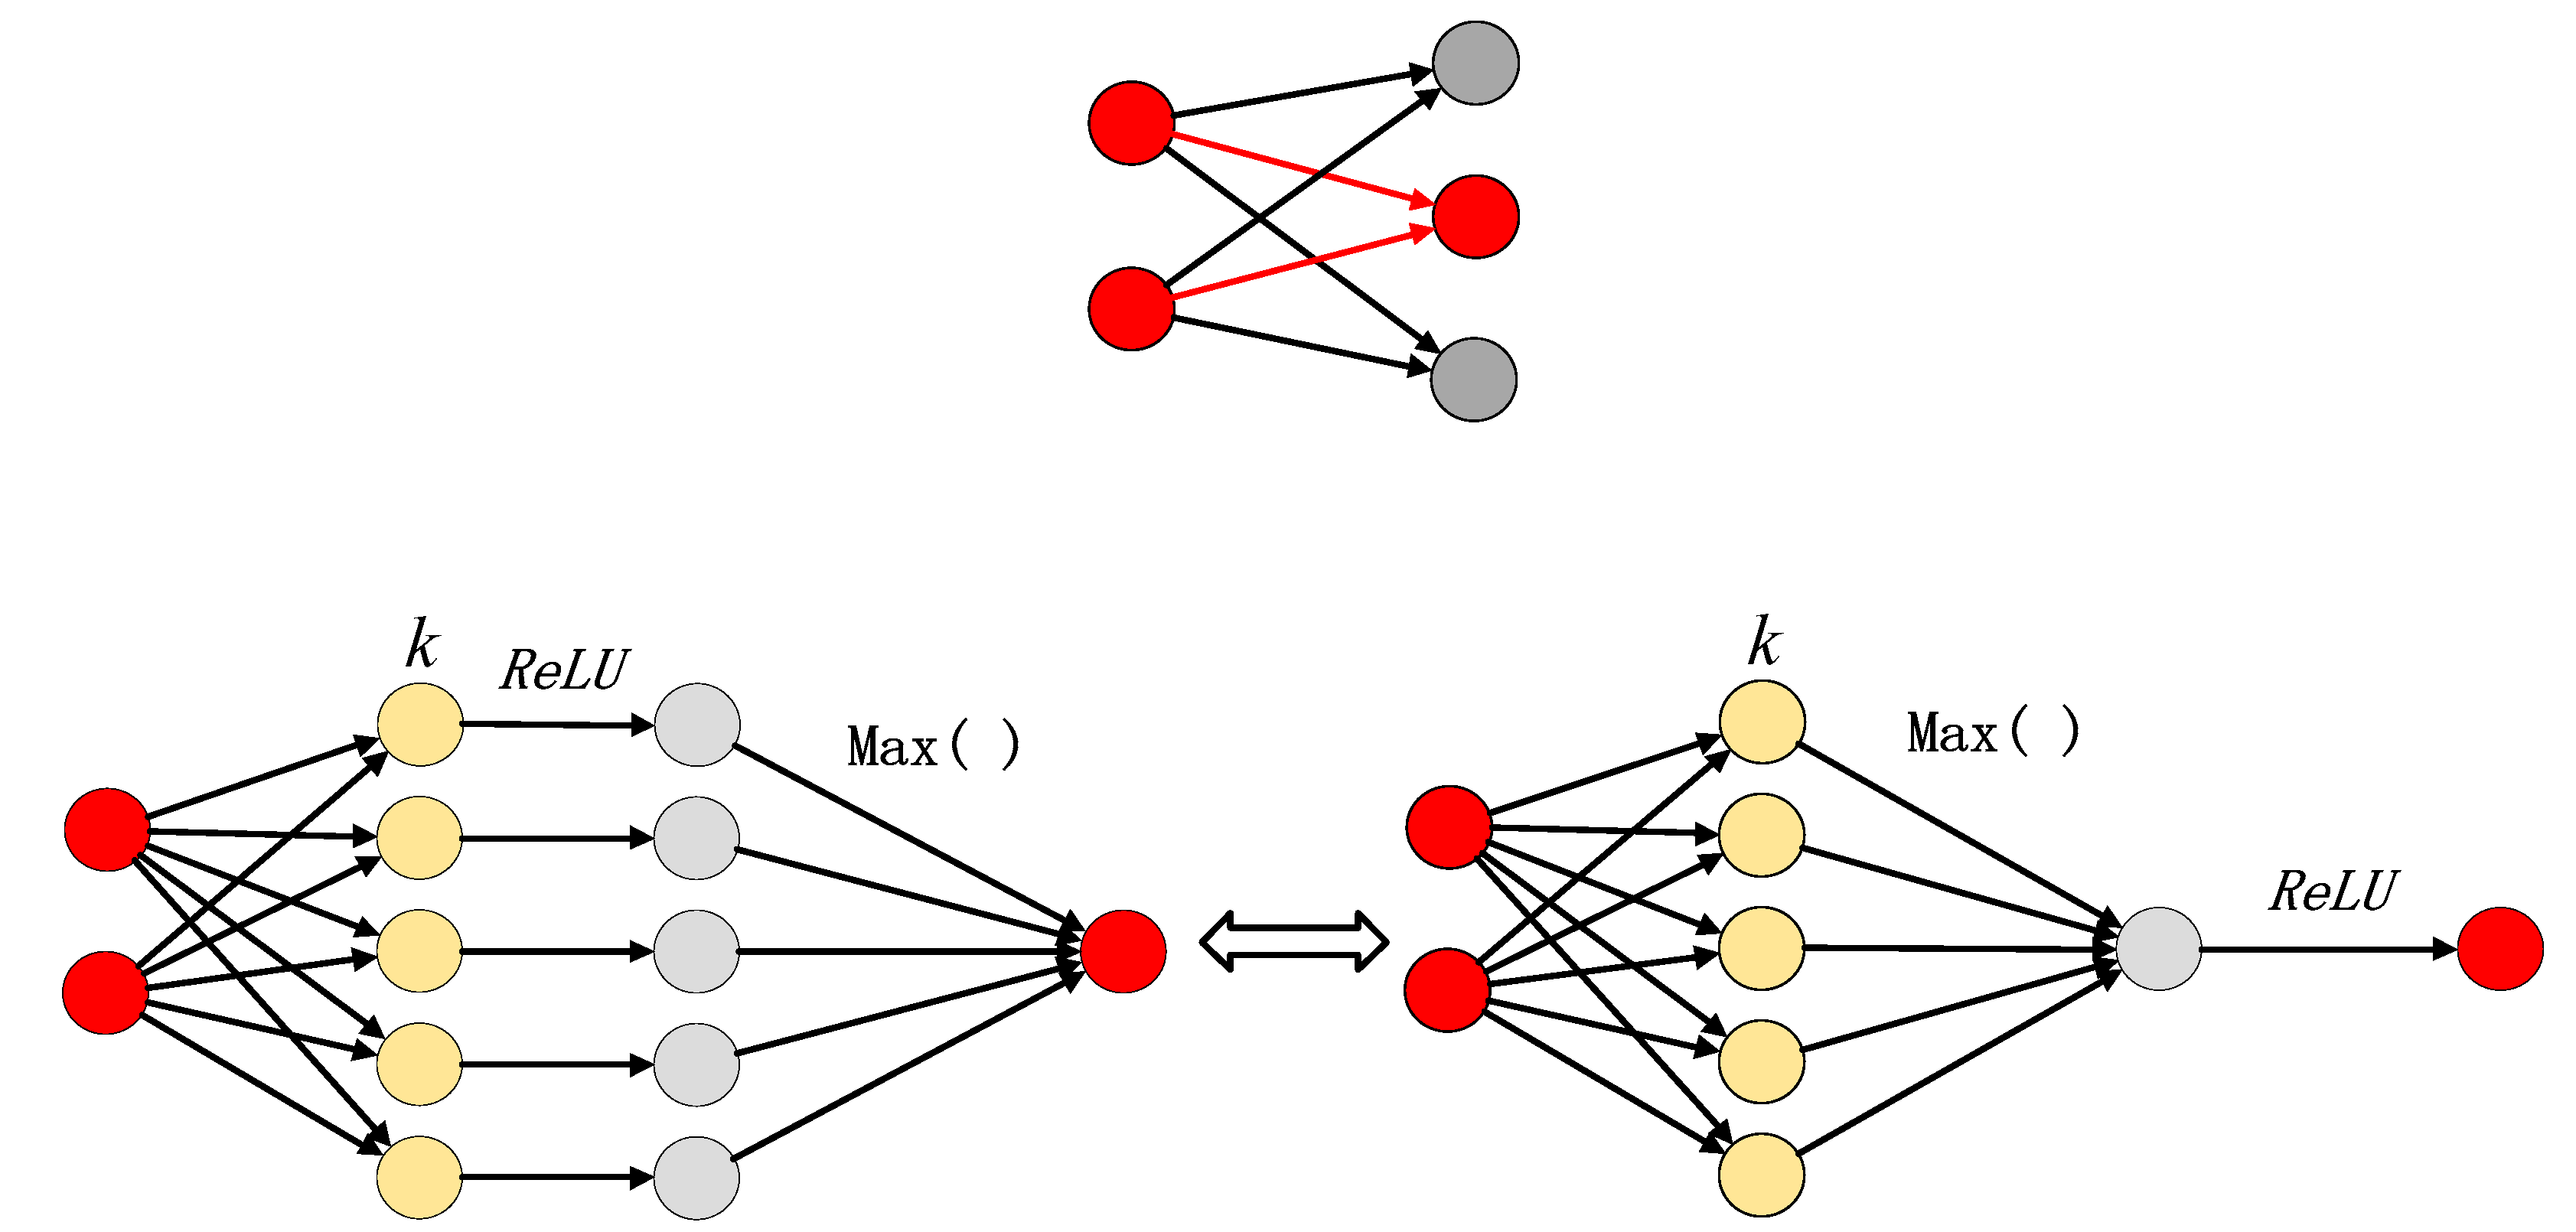
2.1.1. CNN Based on Sparse Maxout

The accuracy of road traffic sign recognition is crucial to driverless public transportation. The CNN algorithm has high signal recognition accuracy, but the activation function has a great influence on the recognition results [32]. This section introduces a sparse maxout CNN, which is helpful for the selection of activation functions.
(1)
Maxout neural network
The maxout neural network, which is a feed neural network model, was proposed by Goodfellow et al. [21]. The maxout unit is used only in the activation function instead of the commonly used activation function. For a given input, ( x may be visible or may be the state of the hidden layer), the maxout hidden layer implements the function given below:
  h i x = max z i j , j 1 , k
z i j = x T W i j + b i j
where W i j R d × m and b i j R m are obtained through learning.
In the CNN, the maxout feature map is obtained by sequentially taking the maximum value of the corresponding position on the k affine feature map.
(2)
Sparse maxout CNN
For road traffic information recognition, sparse features [33] have higher classification accuracy than nonsparse features. To introduce sparsity into maxout and achieve the purpose of dimension reduction, this paper uses the ReLU to introduce sparsity for maxout and accomplishes the goal of dimension reduction. According to Maas et al. [34], the ReLU can promote the sparse representation of the network. Based on this property, this paper presents sparse maxout. After the k affine feature images are obtained, the ReLU is used to map and obtain k feature graphs. Taking the same strategy as maxout, the maximum values of k feature graphs are obtained in the order of the elements. The difference between the final feature map and the original maxout is that the negative neurons in the original maxout are set to 0 while the remaining elements remain unchanged. Appendix A lists the algorithm code.
The sparse maxout schematic is shown as Figure 3.

2.1.2. K-Means CNN

CNN’s learning method is very important for road traffic sign recognition, and its learning results have an important impact on the realization of driverless public transport. An unsupervised learning method is adopted in the first level, and a supervised learning method is adopted in the second level. On the one hand, it reduces the parameters of supervised training, and on the other hand, it makes the characteristics of the training related to specific tasks and improves the classification accuracy. The k-means algorithm is a vector quantization method derived from signal processing, and now, it is more popular in the field of machine learning as a clustering algorithm. The purpose of the k-means algorithm is to divide n data into k clusters so that each datum belongs to the category corresponding to the nearest cluster center.
Assuming that each datum of the data set (observation set) x 1 , x 2 , , x n is a D-dimensional vector, k-means clustering divides the n data samples into k k n sets S = { S 1 , S 2 , , S k ) so that the sum of all clusters’ squares is minimal.
arg S min i = 1 k x S i x u i 2
where u i is the mean value of datum S i in cluster I .
Assuming that the k initial means are known,   m 1 1 , m 2 1 ,…, m k 1 , the standard k-means algorithm is learned alternately in the following two steps:
(1)
Assignment. Using the Euclidean distance, data points can be allocated to the nearest observation point, that is to say, they are allocated according to the following formula.
S i t = x p : x p m i t 2 x p m j t 2 j , 1 j k
It should be noted that although x p may be assigned to two or more categories in theory, in the specific operation,   x p is only assigned to a certain cluster.
(2)
Update. The new clustering center in each cluster obtained in step 1st is calculated as the new mean point, and the formula is as follows:
m i t + 1 = 1 S i t x j S i t x j
This algorithm converges when the clustering centers no longer change. However, it should be noted that because there is only a limited number of allocation schemes, this method usually converges to a local optimal solution.
In semi-supervised or unsupervised learning, k-means clustering is often used for feature learning. The main purpose is to obtain a k-means clustering representation by training unlabeled data and then mapping any input data to a new feature space.
After k-means clustering, we can use the obtained k-means clustering center to extract the features. The specific steps are as follows.
(1)
By convoluting the above clustering results with the input data (images), the features of the input data can be obtained.
(2)
Generally, in order to decrease the feature dimension, speed up the computations, reduce the network size and obtain certain translation invariance, the image feature graph obtained above is pooled (using pooling).
Through the above steps, the output feature map of the k-means-based convolutional layer (unsupervised learning phase) is obtained. In the supervised learning phase, the output of the k-means-based convolutional layer is used as the input, and the structure and learning algorithms are similar to those of the traditional CNN. Figure 4 is a schematic diagram of the k-means CNN. The connecting lines of different colors represent that they learn in different learning modes. The graph on the left shows the output feature map of the k-means based convolutional layer (unsupervised learning phase). The graph on the right shows the supervised learning stage with the output of the k-means-based convolutional layer as the input, similar to traditional CCN training.

2.2. Data

2.2.1. Data Source

The GTSRB data set was the data set used in a competition held by the IJCNN (International Joint Conference on Neural Networks, IJCNN) in 2011, and the data set was made public after the competition, to serve as the same standard for the traffic sign algorithm. The data set is a video recording of nearly 10 h taken by a camera when driving on different roads in Germany during the day. The data set contains a total of 43 types of traffic signs. Figure 5 is a scaled view of the sample size distribution for each category. It can be seen that the proportion of each category of the data set is not balanced. The dataset has a total of 51,839 traffic sign images, divided into training and test sets, with 39,209 images in the training set and 12,630 in the test set. The size of the image in the dataset ranges from 15 × 15 to 250 × 250. Figure 6 is a traffic sign map (already scaled) randomly selected from each category. It can be seen that there is only one traffic sign in each image, and there are usually some edges around the selected traffic signs (margin). The traffic signs are obtained from the video taken in the moving car. Therefore, the traffic sign data have different sized traffic signs, various angles, and blurring caused by motion. Moreover, because the shooting environment is also inconsistent, the data are inconsistent. The set contains images with different light intensities, partial occlusion, and low resolution. In summary, the data set can well simulate the recognition situation in an actual scene, and it can well test the performance of the recognition algorithm.
There are many types of traffic signs, which can be roughly divided into six categories according to the shape, color and other characteristics. Each has its own characteristics. For example, a speed limit sign is mostly red and composed of a round frame, black numbers and a white background, and an indicator sign is mainly composed of a blue background and a white pattern. There is a clear distinction between the various categories. However, in the same category, the distinction between different types of traffic signs is not particularly obvious. In classification, it is easy for the feature space distance of the data samples to be relatively close, and due to the interference of complex situations such as the environment, it is relatively difficult to distinguish different types of traffic signs. To overcome the problem, the hierarchical classification method can be used to decompose the classification task into two steps. The first step is the rough classification stage and the second step is the fine classification stage. The first step is to classify the categories; that is, the sample is first divided into one of the six categories mentioned above. The second step is to classify each category to determine the specific category of the sample.

2.2.2. Data Preprocessing

Before the two-step classification process, the data need to be preprocessed. Through edge cutting, dimension scaling, changing the color graph to a grayscale image, contrast enhancement and other preprocessing operations, the image after preprocessing is obtained. However, the quality of the image of the original image is poor, and the human eye cannot easily recognize it. The original images with poor quality that were difficult for humans to recognize were selected. By comparing these images using three different contrast enhancement effects (image adjustment, histogram equalization, and contrast-limited adaptive histogram equalization), the images with relatively good effects after processing were selected as the final experimental samples. As shown in Figure 7, each column represents the same traffic sign, and each row represents the result after a different processing phase. As seen from the image, the image quality has been significantly improved via the image-related preprocessing techniques.

3. Results

3.1. K-Means Feature Extraction

A number of small 7 × 7 pictures of size were randomly selected from the training set. After unsupervised learning via the k-means, the cluster centers obtained are shown in Figure 8. Therefore, the clustering results under this number of clustering centers were used as the weights to extract the k-means feature, which was used to extract the characteristics of the training set and the test set.

3.2. Crude Classification Results

Because of the use of multilevel classification, the same test set of images needs to go through two different convolution neural networks, the coarse classification and the fine classification once each, which is time consuming. To ensure the real-time performance and consider the system overhead in practical applications, in the coarse classification stage, only a single-layer convolution layer and an SVM classifier based on the k-means are used. The k-means CNN is used to extract the features of the images, and then the SVM is used to classify the images. In the classification task, 12,630 samples in the test set should be classified into six categories of traffic signs, including speed limit signs, other prohibition signs, lifting prohibition signs, instruction signs, warning signs and other signs. Through the experiment, the classification results of the coarse classification can reach 99.64% accuracy, and only 45 traffic signs in the test set are incorrectly classified.

3.3. Fine Classification Results

The sparse maxout CNN is used for fine classification. In this method, the ReLU is used to introduce sparsity into maxout. The image classification process is similar to that of the traditional CNN. The fine classification is each of these six categories, which are trained and tested separately. The correct recognition rates of various types of traffic signs are shown in Table 1:

3.4. Final Classification Results and Analysis

The two processes of rough classification and fine classification are linked to form a complete classification process. Through the hierarchical classification method, the total accuracy of the GTSRB data set is 98.81%. To illustrate the performance of the proposed algorithm, Table 2 compares the test results with the accuracies of other algorithms on the dataset, including the multicolumn depth neural network (multi column DNN) [35], multiscale CNN (multiscale CNN), human performance [36], random forests (random forests) [37] and other methods.
From the comparison results, the accuracy of the algorithm of this paper is higher, which is equivalent to human performance, and it is slightly worse than the optimal multicolumn DNN. Regarding the time complexity, the multicolumn DNN uses multiple CNNs for classification and prediction, respectively, and then, it obtains the final classification results through the “voting method”. The structure of each neural network is relatively deep. Compared with the algorithm in this paper, the learning in the algorithm of this paper is simpler, less time consuming, and superior to the multicolumn DNN regarding the time complexity. It is important to note that when testing the final classification accuracy rate, the correct rate of the coarse classification can affect the final classification accuracy to a large extent. However, this phenomenon has not been found in this experiment. After analysis, it has been found that this is mainly due to two reasons. First, the accuracy of the rough classification is high. Another more important reason is that traffic signs that are misclassified in the coarse classification are misclassified in the fine classification. That is, when a hierarchical classification is adopted, even if all the misclassified traffic signs in the coarse classification are correctly classified, these traffic signs will be misclassified in the subsequent fine classification process.

4. Discussion

This part mainly discusses two aspects: one is the impact on carbon emissions and the other is the proposed policies.

4.1. Assumption of Carbon Reduction

Cars are an important source of carbon emissions. Reducing the number of cars can greatly reduce the amount of carbon emissions. This paper takes China as an example. According to the 2019 National Economic and Social Development Statistics Bulletin issued by the National Bureau of Statistics of China, the number of cars in China at that time was 261.5 million.
Accurate real-time traffic sign recognition enables driverless driving. Driverless technology can greatly reduce the labor costs of public transport companies to promote the development of sustainable public transport. The development of driverless public transport can replace a large number of cars. In the future, the number of cars will be reduced by approximately 75% (Camille von Kaenel, ClimateWire on 3 May 2017, https://www.scientificamerican.com/article/combining-3-vehicle-technologies-could-nearly-eliminate-auto-emissions/), which means that China will reduce its number of cars by 196.125 million. If a bus can take 40 people, it means that 4.903 million buses need to be added. This will make the road traffic smoother and reduce traffic congestion, which will promote the sustainable development of cities. Assuming that the displacement of each vehicle is 2.0 L (based on the assumption of intermediate displacement), 10,000 km a year are driven and 1000 L of gasoline are used, the annual carbon emissions of each vehicle is approximately 2.7 tons. The total annual carbon emissions are 70,605 million tons. The reduction of 196.125 million cars can reduce 529.5375 million tons of carbon emissions. If a fuel bus is used, the average bus runs 30,000 km per year, and the carbon emissions per kilometer are approximately 1.103 kg; then, the carbon emissions per year are 33.09 tons per bus. The annual carbon emissions of 490.3 million buses is 162.24027 million tons. The annual carbon emissions can be reduced by 367.229723 million tons.
Electric buses have lower carbon emissions than fuel buses. According to the life cycle theory, the carbon emissions of a fuel bus are 1401.319 tons over its whole life cycle, and those of an electric bus are 1103.237 tons [38]. If the fuel buses are replaced by electric buses, the carbon emissions of each bus can be reduced by 298.082 tons in its life cycle. Thus, 490.3 million buses can reduce the carbon emissions by 1461.49605 million tons.
From the above analysis, it can be seen that the large-scale operation of driverless electric buses will greatly reduce the carbon emissions of the world, but they can also greatly alleviate road traffic problems, so that the society can achieve sustainable development.

4.2. Policy Recommendations

Driverless public transportation is crucially important to realize sustainable traffic. To better develop sustainable public transport, the following policy recommendations are put forward.
(1)
First, the government should greatly develop road traffic information recognition technology to improve the recognition accuracy. Road traffic signal identification is very important for the development of sustainable public transport. High-accuracy identification can promote the development of driverless technology and then promote the development of sustainable public transport. To improve the recognition accuracy, the government should increase the number of related projects and increase the amount of funding for each project. In the future, the government should establish a number of R&D centers for road traffic information identification and invest more funds in its research. The government should encourage enterprises to undertake more relevant projects independently or in cooperation with scientific research institutions to promote the development of the technology. The government should encourage private capital and enterprises to establish road traffic information identification research and development center, systematically participate in the research of this technology, and promote the development of this technology.
(2)
Moreover, the government should establish the relevant system of driverless public transport. First, it should formulate relevant policies and promote the cooperation of the relevant departments to develop driverless public transport. The development of driverless public transport is not isolated, since it involves cross-field, cross-industry and cross-sector cooperation. It is necessary for the government to formulate relevant policies to promote the cooperation of all departments and stipulate the division of the labor, power, responsibility and obligation of all departments. Second, the construction of a driverless public transport standardization system should be promoted in an all-round way. The development of driverless public transport involves many fields and levels; thus, it is necessary to formulate relevant standards in different fields and levels. A standardization system plays the role of guiding the top-level design and the leading norms, which will greatly promote the development of driverless public transport. Third, relevant financial support policies should be formulated. Cities that use driverless public transportation can be given financial subsidies, and the intensity of the subsidies can be determined according to their contribution to carbon emissions reductions. For driverless bus companies, preferential tax policies and loan policies should be given.
(3)
Finally, driverless transportation infrastructure should be investigated and constructed. The development of driverless driving requires infrastructure construction. First, a closed road test area should be established. The establishment of a test area that can meet the test conditions of driverless public transport is conducive to the testing of driverless public transport. Second, roads for open tests should be established. Although a closed test site can simulate the natural environment such as rain and fog, pedestrians and interfering vehicles, there is still a certain gap between a closed test site and actual road test data. Third, the operation of driverless public transport requires other investments, such as the traffic internet things, related road networks and road traffic signals. For finance support, the government needs to increase investment, and it can use new financial tools such as public–private partnership and build–operate–transfer policies.

5. Conclusions

Road traffic sign recognition is the key technology of sustainable driverless public transportation. Among all kinds of recognition algorithms, the CNN has good recognition accuracy. In this paper, the CNN algorithm is improved and applied to road traffic recognition, and good results are achieved. The selection of the activation function is generally determined by the empirical method or cross-validation with other parameters, and there are problems with inaccuracies and time consumption. Aiming at these problems, this paper proposes a CNN based on sparse maxout, which introduces the sparse expression in the maxout unit to solve the problem of difficult activation function selection and improve the performance of the maxout CNN. This paper also proposes a CNN based on the k-means, which combines the unsupervised k-means learning algorithm with the widely used back propagation algorithm. The proposed method can improve the accuracy of traffic sign recognition, make driverless buses possible, promote the development of sustainable public transport, and greatly reduce carbon emissions. To better promote the research of traffic sign recognition technology and realize sustainable public transport, we put forward policy suggestions from the aspects of the technology, system and infrastructure. In terms of the technology, at this stage, the government should set up more projects related to traffic sign recognition to encourage enterprises to participate in research projects; in the future, the government should establish more related research and development centers to promote the development of recognition technology. In terms of the system, the government should formulate departmental cooperation policies, establish a standard system and formulate relevant financial support policies to promote the development of driverless public transport. In terms of the infrastructure, it is hoped that the government can establish closed road test areas, open road test roads and other relevant infrastructure.

Author Contributions

Conceptualization, J.L. (Jingjing Liu) and H.G.; methodology, Z.H.; validation, Z.H. and P.H.; formal analysis, J.L. (Jingjing Liu) and Z.H.; investigation, J.L. (Jingjing Liu) and J.L. (Jiajie Li); resources, P.H.; data curation, P.H.; writing—original draft preparation, J.L. (Jingjing Liu); writing—review and editing, J.L. (Jiajie Li) and M.H.; visualization, Z.H.; supervision, H.G.; project administration, J.L. (Jiajie Li); funding acquisition, Z.H. and M.H. All authors have read and agreed to the published version of the manuscript.

Funding

This research was funded by the “Natural Science Foundation of China. grant number 72004130 and 52004021”, “Wealth Management Characteristic Research Project of Shandong Technology and Business University, grant number 2019ZBKY031”, “Shandong Provincial Natural Science Foundation, China, grant number ZR2020MG013 and ZR2017MG022”, “Special Funds for Taishan Scholar Project, College Youth Innovation Science and Technology Support Plan of Shandong Province, China, grant number 2020RWG007”. and “111 Project, grant number B20041”.

Institutional Review Board Statement

Not applicable.

Informed Consent Statement

Not applicable.

Data Availability Statement

Not applicable.

Conflicts of Interest

The authors declare no conflict of interest.

Appendix A

The ReLU-based sparsity maxout convolutional neural network pseudocode (Python) is as follows:
output = temp conv_out = conv(input = x, filter = W) # convolution operation
bias_out = ReLU(conv_out + b.dimshuffle (‘x’,0, 1,2) # plus offset and perform ReLU operation
output = None # final output
for i in range(k):
temp = bias_out [:, i::k, :, :]
if output is None:
else:
output = max(temp, output)
end

References

  1. Zhao, X.; Ke, Y.; Zuo, J.; Xiong, W.; Wu, P. Evaluation of sustainable transport research in 2000–2019. J. Clean. Prod. 2020, 256, 120404. [Google Scholar] [CrossRef]
  2. Song, X.; Geng, Y.; Dong, H.; Chen, W. Social network analysis on industrial symbiosis: A case of Gujiao eco-industrial park. J. Clean. Prod. 2018, 193, 414–423. [Google Scholar] [CrossRef]
  3. Song, X.; Ali, M.; Zhang, X.; Sun, H.; Wei, F. Stakeholder coordination analysis in hazardous waste management: A case study in China. J. Mater. Cycles Waste Manag. 2021, 23, 1873–1892. [Google Scholar] [CrossRef]
  4. Buyukozkan, G.; Feyzioglu, O.; Gocer, F. Selection of sustainable urban transportation alternatives using an integrated intuitionistic fuzzy Choquet integral approach. Transp. Res. Part D Transp. Environ. 2018, 58, 186–207. [Google Scholar] [CrossRef]
  5. Hatefi, S.M. Strategic planning of urban transportation system based on sustainable development dimensions using an integrated SWOT and fuzzy COPRAS approach. Glob. J. Environ. Sci. Manag. 2018, 4, 99–112. [Google Scholar]
  6. Eliasson, J.; Proost, S. Is sustainable transport policy sustainable? Transp. Policy 2015, 37, 92–100. [Google Scholar] [CrossRef] [Green Version]
  7. Barfod, M.B. Supporting sustainable transport appraisals using stakeholder involvement and mcda. Transport 2018, 33, 1052–1066. [Google Scholar] [CrossRef] [Green Version]
  8. Salehi, M.; Jalalian, M.; Siar, M.M. Green transportation scheduling with speed control: Trade-off between total transportation cost and carbon emission. Comput. Ind. Eng. 2017, 113, 392–404. [Google Scholar] [CrossRef]
  9. Hong, Y.; Chen, C.; Wu, Y. Biobutanol production from sulfuric acid-pretreated red algal biomass by a newly isolated Clostridium sp. strain WK. Biotechnol. Appl. Biochem. 2020, 67, 738–743. [Google Scholar] [CrossRef]
  10. Xue, Y.; Guan, H.; Corey, J.; Wei, H.; Yan, H. Quantifying a financially sustainable strategy of public transport: Private capital investment considering passenger value. Sustainability 2017, 9, 269. [Google Scholar] [CrossRef] [Green Version]
  11. Dubey, R.; Gunasekaran, A.; Papadopoulos, T.; Childe, S.J.; Shibin, K.T.; Wamba, S. Sustainable supply chain management: Framework and further research directions. J. Clean. Prod. 2017, 142, 1119–1130. [Google Scholar] [CrossRef]
  12. Buehler, R.; Pucher, J. Making public transport financially sustainable. Transp. Policy 2011, 18, 126–138. [Google Scholar] [CrossRef]
  13. Hensher, D.A. Sustainable public transport systems: Moving towards a value for money and network-based approach and away from blind commitment. Transp. Policy 2007, 14, 98–102. [Google Scholar] [CrossRef] [Green Version]
  14. Smieszek, M.; Dobrzanska, M.; Dobrzanski, P. Rzeszow as a city taking steps towards developing sustainable public transport. Sustainability 2019, 11, 402. [Google Scholar] [CrossRef] [Green Version]
  15. Li, Y.; Zheng, J.; Li, Z.; Yuan, L.; Yang, Y.; Li, F. Re-estimating CO2 emission factors for gasoline passenger cars adding driving behaviour characteristics—A case study of Beijing. Energy Policy 2017, 102, 353–361. [Google Scholar] [CrossRef]
  16. Song, X.; Geng, Y.; Li, K.; Zhang, X.; Wu, F.; Pan, H.; Zhang, Y. Does environmental infrastructure investment contribute to emissions reduction? A case of China. Front. Energy 2020, 14, 57–70. [Google Scholar] [CrossRef]
  17. Luo, H.L.; Yang, Y.; Tong, B.; Wu, F.; Fan, B. Traffic sign recognition using a multi-task convolutional neural network. IEEE Trans. Intell. Transp. Syst. 2018, 19, 1100–1111. [Google Scholar] [CrossRef]
  18. Tan, T.; Lu, J.; Wen, J.; Li, C.; Ling, W. Traffic sign recognition applying with convolution neural network and RPN. Comput. Eng. Appl. 2018, 54, 251–256. [Google Scholar]
  19. Xu, Z.; Feng, C. Modified scale dependent pooling model for traffic image recognition. J. Comput. Appl. 2018, 38, 671–676. [Google Scholar]
  20. Dahl, G.E.; Sainath, T.N.; Hinton, G.E. Improving deep neural networks for LVCSR using rectified linear units and dropout. In Proceedings of the IEEE international Conference on Acoustics, Speech and Signal Processing (ICASSP), Vancouver, BC, Canada, 26–31 May 2013; pp. 8609–8613. [Google Scholar]
  21. Goodfellow, I.J.; Warde-Farley, D.; Mirza, M.; Courville, A.C.; Bengio, Y. Maxout Networks. In Proceedings of the 30th International Conference on Machine Learning, Atlanta, GA, USA, 16–21 June 2013; pp. 1319–1327. [Google Scholar]
  22. Hinton, G.E.; Srivastava, N.; Krizhevsky, A.; Sutskever, I.; Salakhutdinov, R. Improving neural networks by preventing co-adaptation of feature detectors. arXiv 2013, arXiv:1207.0580. [Google Scholar]
  23. Cai, M.; Shi, Y.; Liu, J. Deep maxout neural networks for speech recognition. In Proceedings of the IEEE Workshop on Automatic Speech Recognition and Understanding (ASRU), Olomouc, Czech Republic, 8–12 December 2013; pp. 291–296. [Google Scholar]
  24. Rueda, F.M.; Grzeszick, R.; Fink, G. Neuron pruning for compressing deep networks using maxout architectures. In Proceedings of the German Conference on Pattern Recognition, Basel, Switzerland, 13–15 September 2017; pp. 177–188. [Google Scholar]
  25. Jin, Z.; Han, Y.; Zhu, Q. A sentiment analysis model with the combination of deep learning and ensemble learning. J. Harbin Inst. Technol. 2018, 50, 32–39. [Google Scholar]
  26. Zhu, Q.; Du, B.; Turkbey, B.; Choyke, P.L.; Yan, P. Deeply-Supervised CNN for Prostate Segmentation. In Proceedings of the International Joint Conference on Neural Network (IJCNN), Anchorage, AK, USA, 14–19 May 2017; pp. 178–184. [Google Scholar]
  27. Chen, T.; Lu, S.; Fan, J. SS-HCNN: Semi-supervised hierarchical convolutional neural network for image classification. IEEE Trans. Image Process. 2019, 28, 2389–2398. [Google Scholar] [CrossRef]
  28. Jog, A.; Hoopes, A.; Greve, D.N.; Leemput, K.V.; Fisch, B. PSACNN: Pulse sequence adaptive fast whole brain segmentation. Neurolmage 2019, 99, 553–569. [Google Scholar] [CrossRef] [Green Version]
  29. Laskar, Z.; Kannala, J. Semi-supervised semantic matching. In Proceedings of the European Conference on Computer Vision, Munich, Germany, 8–14 September 2018; pp. 444–445. [Google Scholar]
  30. Garg, R.; Vijay, K.B.G.; Carneiro, G.; Reid, I. Unsupervised CNN for single view depth estimation: Geometry to the rescue. In Proceedings of the European Conference on Computer Vision, Amsterdam, The Netherlands, 8–16 October 2016; pp. 740–756. [Google Scholar]
  31. Darugar, M.J.; Kiong, L.C. Gender estimation based on supervised HOG, Action Units and unsupervised CNN feature extraction. In Proceedings of the Joint Conference on Artificial Intelligence & Robotics & Robocupiranopen International Symposium, Qazvin, Iran, 10 April 2017; pp. 23–27. [Google Scholar]
  32. Piekniewski, F.; Rybicki, L. Visual comparison of performance for different activation functions in MLP networks. In Proceedings of the International Joint Conference on Neural Networks: IJCNN, Budapest, Hungary, 25–29 July 2004; pp. 2947–2952. [Google Scholar]
  33. Sivaram, G.S.V.S.; Nemala, S.K.; Elhilali, M.; Tran, T.D.; Hermansky, H. Sparse coding for speech recognition. In Proceedings of the IEEE International Conference on Acoustics, Speech, and Signal Processing, Dallas, TX, USA, 14–19 March 2010; p. 9. [Google Scholar]
  34. Maas, A.L.; Hannun, A.Y.; Ng, A.Y. Rectifier nonlinearities improve neural network acoustic models. In Proceedings of the ICML Workshop on Deep Learning for Audio Speech and Language Processing, Atlanta, GA, USA, 16 June 2013; pp. 1–6. [Google Scholar]
  35. Cireşan, D.; Meier, U.; Masci, J.; Schmidhuber, J. Multi-column deep neural network for traffic sign classification. Neural Netw. 2012, 32, 333–338. [Google Scholar] [CrossRef] [Green Version]
  36. Stallkamp, J.; Schlipsing, M.; Salmen, J.; Igel, C. Man vs. computer: Benchmarking machine learning algorithms for traffic sign recognition. Neural Netw. 2012, 32, 323–332. [Google Scholar] [CrossRef]
  37. Zaklouta, F.; Stanciulescu, B.; Hamdoun, O. Traffic sign classification using K-d trees and random forests. In Proceedings of the International Joint Conference on Neural Networks (IJCNN), San Jose, CA, USA, 31 July–5 August 2021; pp. 2151–2155. [Google Scholar]
  38. Ying, Z.; Wu, X.; Yang, W. Carbon emission accounting for the transition of public buses from gasoline to electricity in Hangzhou City, China. Acta Ecol. Sin. 2018, 38, 6452–6464. [Google Scholar]
Figure 1. Mechanism chart.
Energies 15 07386 g001
Figure 2. Algorithm flow chart.
Energies 15 07386 g002
Figure 3. Schematic chart of sparse maxout.
Energies 15 07386 g003
Figure 4. CNN based on k-means.
Energies 15 07386 g004
Figure 5. Relative class frequencies in the data set.
Energies 15 07386 g005
Figure 6. Forty-three kinds of traffic sign in GTSRB.
Energies 15 07386 g006
Figure 7. Comparison of preprocessing methods.
Energies 15 07386 g007
Figure 8. Chart of the k-means clustering centroids in the GTSRB.
Energies 15 07386 g008
Table 1. Result of fine classification.
CategoryNumber of ErrorsAccuracy (%)
Speed limit (Total sum 4200)4099.04
Other ban (Total sum 1470)1798.86
Lifting ban (Total sum 360)1695.56
Indication (Total sum 1770)2098.87
Warning (Total sum 2790)2599.10
Others (Total sum 2040)3298.43
Table 2. Recognition accuracy comparison between the proposed algorithm and other algorithms (%).
MethodsLimitationOther BanLifting BanIndicationWarningOther SignsTotal
Multicolumn DNN99.4799.9399.7299.8999.0799.2299.46
Human Performance97.6399.9398.8999.7298.67100.0098.84
Proposed algorithm99.0498.8695.5698.8799.1098.4398.81
Multiscale CNN98.6199.8794.4497.1898.0398.6398.31
Random forests95.9599.1387.5099.2792.0898.7396.14
LDA on HOG 295.3796.8085.8397.1893.7398.6395.68
Publisher’s Note: MDPI stays neutral with regard to jurisdictional claims in published maps and institutional affiliations.

