Article

Influence Mechanisms of Dynamic Changes in Temperature, Precipitation, Sunshine Duration and Active Accumulated Temperature on Soybean Resources: A Case Study of Hulunbuir, China, from 1951 to 2019

1
School of Economics and Management, Beijing Forestry University, Beijing 100083, China
2
School of Mechanics and Civil Engineering, China University of Mining and Technology, Beijing 100083, China
*
Author to whom correspondence should be addressed.
Energies 2022, 15(22), 8347; https://doi.org/10.3390/en15228347
Submission received: 30 September 2022 / Revised: 25 October 2022 / Accepted: 3 November 2022 / Published: 8 November 2022
(This article belongs to the Special Issue Advances in Energy and Resource Efficiency and Sustainable Policy)

Abstract

:
As a raw material for clean energy supply for the new generation, the soybean is conducive to the realization of global energy transition and sustainable development in the context of “carbon neutrality”. However, global warming has been affecting soybean yields in recent years. How to clarify the correlation between meteorological factors and soybean yields, so as to ensure the security of soybean growth and development and the stability of renewable energy development, is a key concern of the government and academia. Based on the data of temperature, precipitation, sunshine duration and active accumulated temperature during the soybean growing season in Hulunbuir, Inner Mongolia Autonomous Region from 1951 to 2019, and soybean yield data of the city from 1985 to 2019, this paper adopted statistical methods such as the Trend Analysis Method, the Rescaled Range Analysis Method and so on to analyze the trends of yield changes, characteristics of abrupt changes and periodic patterns of climate factors and soybean yields in Hulunbuir. A Pearson Correlation Analysis and a Grey Relation Analysis were used to explore the correlation between climatic factors and soybean yields, followed by a comprehensive impact model of the combined effect of temperature and precipitation on soybean yields established by the Method of Integral Regression. The results showed that temperature and active accumulated temperature are the dominant factors affecting soybean yields in Hulunbuir, while the decrease in precipitation is unfavorable to the improvement of soybean yields. Meanwhile, temperature and precipitation have different effects on the growth and development of the soybean at different stages. The conclusion of this paper is of great practical significance for Hulunbuir to promote the sustainable development of clean energy.

1. Introduction

The soybean is the world’s largest oil crop and one of China’s important agricultural products, whose planting area is second only to maize, wheat and rice. Because of its high content of cell wall polymers, proteins and other components, as well as its lower energy costs and more environmentally friendly oil-refining process, it is often used as the most common raw material for renewable diesel production and has great potential in the field of bioenergy, which is the new generation raw materials of clean energy [1,2]. Since the introduction of the concept of “carbon neutrality” in countries around the world, promoting the transformation of non-renewable energy such as oil and natural gas to clean renewable energy such as biomass energy is necessary to ensure energy security and stimulate the recovery of the green economy [3,4]. Currently, China’s renewable energy sources are taking an increasing share of the energy mix; in particular, the use of biofuels, such as renewable diesel, is gradually increasing. Therefore, the soybean industry is not only an effective driving force for promoting the healthy and green development of agriculture, but also conducive to the realization of energy transition and sustainable development. Soybean production is the basis of renewable diesel supply, and the increase in the frequency of renewable diesel use will lead to a surge in soybean demand. Based on this, China attaches great importance to the production improvement situation in the main soybean-producing areas, deeply promotes the soybean revitalization plan and proposes to vigorously implement the soybean and oilseed capacity improvement project in the Central Document No. 1 released in 2022 to promote the improvement of the soybean self-sufficiency rate.
However, The Sixth Assessment Report of Intergovernmental Panel on Climate Change (IPCC) in 2021 showed that the global climate is undergoing significant changes characterized by warming, and the warming of the global climate system will gradually affect all sectors of industrial production and people’s daily lives [5]. Soybean planting is an agricultural activity that “counts on the weather”, and soybean yields are extremely and directly affected by climate change. For example, the increase in the frequency, duration and impact of extreme weather events such as droughts and high temperatures will lead to habitat deterioration in most soybean cropping areas, greatly restricting the normal functioning of farmland ecosystems and causing a decline in soybean yields and quality, thus seriously threatening the supply of green and renewable energy and the stable development of the national economy [6,7]. Therefore, on the basis of accurately comprehending the trend of future climate change, clarifying the correlation between climate change and changes in soybean yields and avoiding the negative effects of climate change to the greatest extent, will ensure the security of soybean growth and accelerate the development and application of renewable energy, which is also of great significance to the transition towards a green economy.
The impact of climate change on soybean yields has been studied by both natural science researchers, mainly in agronomy, and social science researchers, mainly in economics, from the perspectives of their respective disciplines [8,9,10]. Particularly, the changing patterns of soybean yields, climatic potential productivity and the response of the soybean industry to climate change in the context of global warming have become hot issues in current research. Climate change seriously confines the soybean industry in terms of soybean quality, growth rate, growth stability, etc. The existing studies have mainly adopted the Meteorological Yield Separation Method, the Wavelet Analysis Method, the First-Order Difference Methods of yield and climate factors, the Mann–Kendall Test and other mathematical and statistical methods, and integrated the knowledge of phenology to explore the influence of meteorological factors such as precipitation and temperature on soybean yields [11,12,13]. Some researchers have also paid attention to the role of the combination of different climatic factors, thus using crop yield models, such as the Difference Model, the CERES-Rice Model and the APSIM Model, in synchronization with climate patterns, to comprehensively assess the trend of soybean growth under the influence of different meteorological factors [14,15]. However, most studies have focused on the effects of temperature and precipitation on soybeans, while neglecting the effects of other meteorological elements such as cumulus temperature and light on soybean growth. The climatic potential productivity is an important indicator of the biological yields that can be determined by a region’s climate resources [16]. For now, many studies have utilized scientific methods such as Production Potential Modeling, Crop Growth Modeling and Sensitivity Analysis to calculate the potential productivity of climate resources such as water, light and heat, and to identify the main climate factors that promote or limit soybean growth to further guide agricultural production [17,18]. Nevertheless, most of the current studies are limited to the effects of one or a few meteorological elements on soybean growth or a certain reproductive stage, and lack a systematic approach, especially for the systematic assessment of climate change effects on the whole reproductive period of the crop.
In terms of the response of soybean planting to climate change, most scholars have regulated the changes in meteorological factors according to different future climate change scenarios in order to synthesize the combinations that will lead to the optimum growth comfort for soybeans in the future. For example, Feng et al. (2021) took the global fraction values of soybean-harvested area (FSHA) as the basic data and climate and soil conditions as predictors, and developed the MaxEnt Model to explore the potential global soybean planting areas and changes under future climate change scenarios (RCP 2.6, RCP 4.5 and RCP 8.5) by virtue of various global circulation models (IPSL-CM5A-LR, BCC-CSM 1.1 and MIROC-ESM-CHEM), with the aim of addressing the threats posed by global warming [19]. Lin et al. (2021) employed the Integrated Science Assessment Model to estimate changes in global soybean yields from 2021 to 2100 in response to changes in climate and CO2 concentrations and agricultural management practices, and found that the increases in CO2 concentrations in the future would enhance soybean yields and mitigate the negative impacts of climate changes on soybean productivity [20]. The disadvantage is that there are regional differences in the effects of climate change on soybean growth, and most of the studies are conducted in national or provincial areas, while the study of specific regions, especially the main soybean-producing areas, is still weak and uneven.
In view of the above, this paper presents a comprehensive analysis of soybean yields and regional climate change characteristics in Hulunbuir based on soybean yield data in this region from 1985 to 2019 and a long time series of regional temperature, precipitation, sunshine duration and active cumulative temperature (≥10 °C) during the soybean growing season from 1951 to 2019, in order to conclude a comprehensive analysis of soybean yields and regional climate change characteristics in Hulunbuir, and complete a quantitative analysis of the response of soybean yield to climate change across the region. The aim is to provide effective suggestions for soybean security and green economic development in the context of climate change, so as to significantly reduce the loss of clean and sustainable energy development caused by climate change.
We chose Hulunbuir as the study area to investigate the influence of meteorological elements on soybean yield for three main reasons. One is that Hulunbuir, as the main soybean-producing area in China, is located in the northern temperate zone (115°31′~126°04′ E, 47°05′~53°20′ N), with a significant continental climate, a short frost-free period, sufficient sunshine, high effective temperature utilization and climate resources. The climate resources have obvious horizontal and vertical zonality, in which heat resources are more obvious and suitable for soybean growth and development [21,22,23]. Second, soybeans in Hulunbuir have the advantages of good quality and high oil yield, with an average protein content of up to 43.2% and an average fat content of up to 20.3%, which is the leading variety of soybean production in the country [24]. Third, soybean planting areas in Hulunbuir actively respond to the national strategic deployment of stabilizing grain, expanding beans and increasing oil, and deeply implementing soybean capacity enhancement projects, which can provide timely and efficient feedback on national policies. Therefore, the analysis and discussion of the paper using Hulunbuir as the study area is highly representative and convincing.
Compared with the existing studies, the innovations of this paper are as follows:
First, in terms of research methodology, this paper takes into account the changes in meteorological factors and the effects of combined impacting factors, and adopts the Method of Rescaled Range Analysis to analyze the consistency of past and future trends under meteorological factors and the method of Grey Relation Analysis to determine the dominant factors affecting yields, and establishes an Integral Regression Model accordingly, enriching the evaluation method of climate–crop dynamic change.
Second, in terms of application value, previous scholars have mostly discussed the role of meteorological factors in relation to soybean yield or development days from national or provincial perspectives, and relatively few analyses have been conducted for the main production areas, resulting in generalized conclusions that do not precisely cover specific regions. This paper analyzes the study area in Hulunbuir, a major soybean-producing area in China, and provides an important reference for the local government to formulate a soybean energy policy, which is targeted to contribute to the sustainable development of green resources in Hulunbuir, and to help China realize the transformation and upgrade of renewable energy by regulating soybean policies in the main producing area.
The paper is elaborated in the following sequence: data sources and research methodology in Part II, results and analysis in Part III, further discussion in Part IV and conclusions and policy implications in Part V.

2. Data Sources and Research Methodology

2.1. Data Sources

The meteorological data in this paper were accessed on 15 March 2022 from the China Meteorological Data Sharing Network (http://cdc.cma.gov.cn/), from which daily meteorological data (temperature, precipitation, sunshine duration, active accumulated temperature (≥10 °C)) were selected from two national benchmark climate stations and seven national basic meteorological stations in Hulunbuir with good data continuity during the soybean growing season (from May to September) from the year of 1951 to 2019. The data here were processed as interannual data for the convenience of research. In this paper, the total soybean yield data and the corresponding grain planting area data of Hulunbuir from 1985 to 2019 were obtained through the National Bureau of Statistics, the Hulunbuir Bureau of Statistics and the Hulunbuir Statistical Yearbook to calculate the grain yield per unit area from year to year, thus effectively excluding the interference of grain planting area fluctuation from the analysis. To ensure the continuity and validity of the data, the missing meteorological data and yield data in this paper were interpolated and corrected by the software of Matlab.

2.2. Research Methodology

This paper explored the trends and characteristics of soybean yield and meteorological factors in Hulunbuir through a series of mathematical and statistical methods, and analyzed the correlation and influence mechanisms between them. Specifically, this paper used trend analysis, rescaled extreme difference analysis, M-K test and grain yield decomposition to analyze the trends, abrupt changes and cyclical patterns of climate factors and soybean yield in Hulunbuir, followed by Pearson correlation analysis and gray correlation analysis to study the correlation between climate factors and soybean yield and find out the dominant climate factors affecting soybean yield. Finally, we used the principle of integral regression to construct a comprehensive model of the influence of dominant climate factors on soybean yield.

2.2.1. The Method of Moving Average

The Method of Moving Average refers to calculating the moving average by sequentially increasing and decreasing period by period in a long series of year-by-year data. It is usually used to eliminate the outliers from the original data and avoid the associated interference to the research results. The formula is:
X ¯ j = 1 k i = 1 k X i + j 1 , ( j = 1 , 2 n k + 1 ) ,   k = 5
Here, X ¯ is the smoothed time series, X is the original time series and n is the total number of samples; k is the sliding length, and its value selection will directly affect the smoothing effect on the data, so 5 is taken in this paper to eliminate the effect of short-period fluctuations.

2.2.2. The Method of Rescaled Range Analysis

The Method of Rescaled Range Analysis uses continuous and significant climate data of the past to make a scientifically sound analysis of climate change trends in some certain area to predict future climate transitions between warm and cold, which is the application of fractal theory on the field of climate change [25]. It is based on measuring the fractal dimension D and using the patterns of change on small time scales to predict changes on large time scales. Based on this, the British hydrologist Hurst proposed the Hurst Exponent to measure the magnitude of the change trends. The steps to calculate the Hurst Exponent and the value of the fractal dimension D are as follows:
Assuming a time series of length T, firstly divide the time series { X i } into n equal subsequences of length n, where the length of n is W (the integer part of T/n), consecutive subsequences F d (d = 1, 2…, W) and the elements in each subsequence are denoted as Q r , d .
Calculate the average value G d of each subsequence F d :
G d = 1 n r = 1 n Q r , d
Calculate the cumulative deviation X t , d of F d from the subsequence mean G d :
X t , d = r = 1 t ( Q r , d G d )   t = 1 , 2 n
Calculate the range R d of each subsequence F d :
R d = m a x 1 t n ( X t , d ) m i n 1 t n ( X t , d )
Calculate the standard deviation S d of each subsequence F d :
S d = [ 1 n r = 1 n ( Q r , d G d ) 2 ] 1 2
Compare different types of time series by dividing the standard deviation S d by the range R d :
( R / S ) d = R d S d
Repeat the above steps to get a rescaled range sequence and calculate its mean:
( R S ) n = 1 w d = 1 w ( R S ) d
Increase the time length of the subsequence by 1 each time, and keep repeating the above steps, and end when n = M/2.
Hurst established the following relation:
( R S ) n = ρ h H
Introduce the explained variable l n ( R / S ) n and the explanatory variable lnn, use the least squares method to calculate the coefficient H of the explanatory variable, and the obtained coefficient of the explanatory variable, which is the Hurst exponent H value:
l n ( R / S ) n = H l n n + l n ρ
The formula of Hurst Exponent and fractal dimension D is:
D = D T + 1 H
D T is the topological dimension of the fractal object, which is taken as 1 for a one-dimensional time series.
The Hurst Exponent and fractal dimension D are mainly divided into the following four cases: H = 0.5, D = 1.5, indicating that the change trend in the past is not related to the future; 0.5 < H < 1, 1 < D < 1.5, indicating the change trend in the past consistent with the future one; 0 < H < 0.5, 1.5 < D < 2, indicating that the change trend in the past is opposite to the future change trend; H = 1, indicating that the analyzed time series is a completely specified time series.

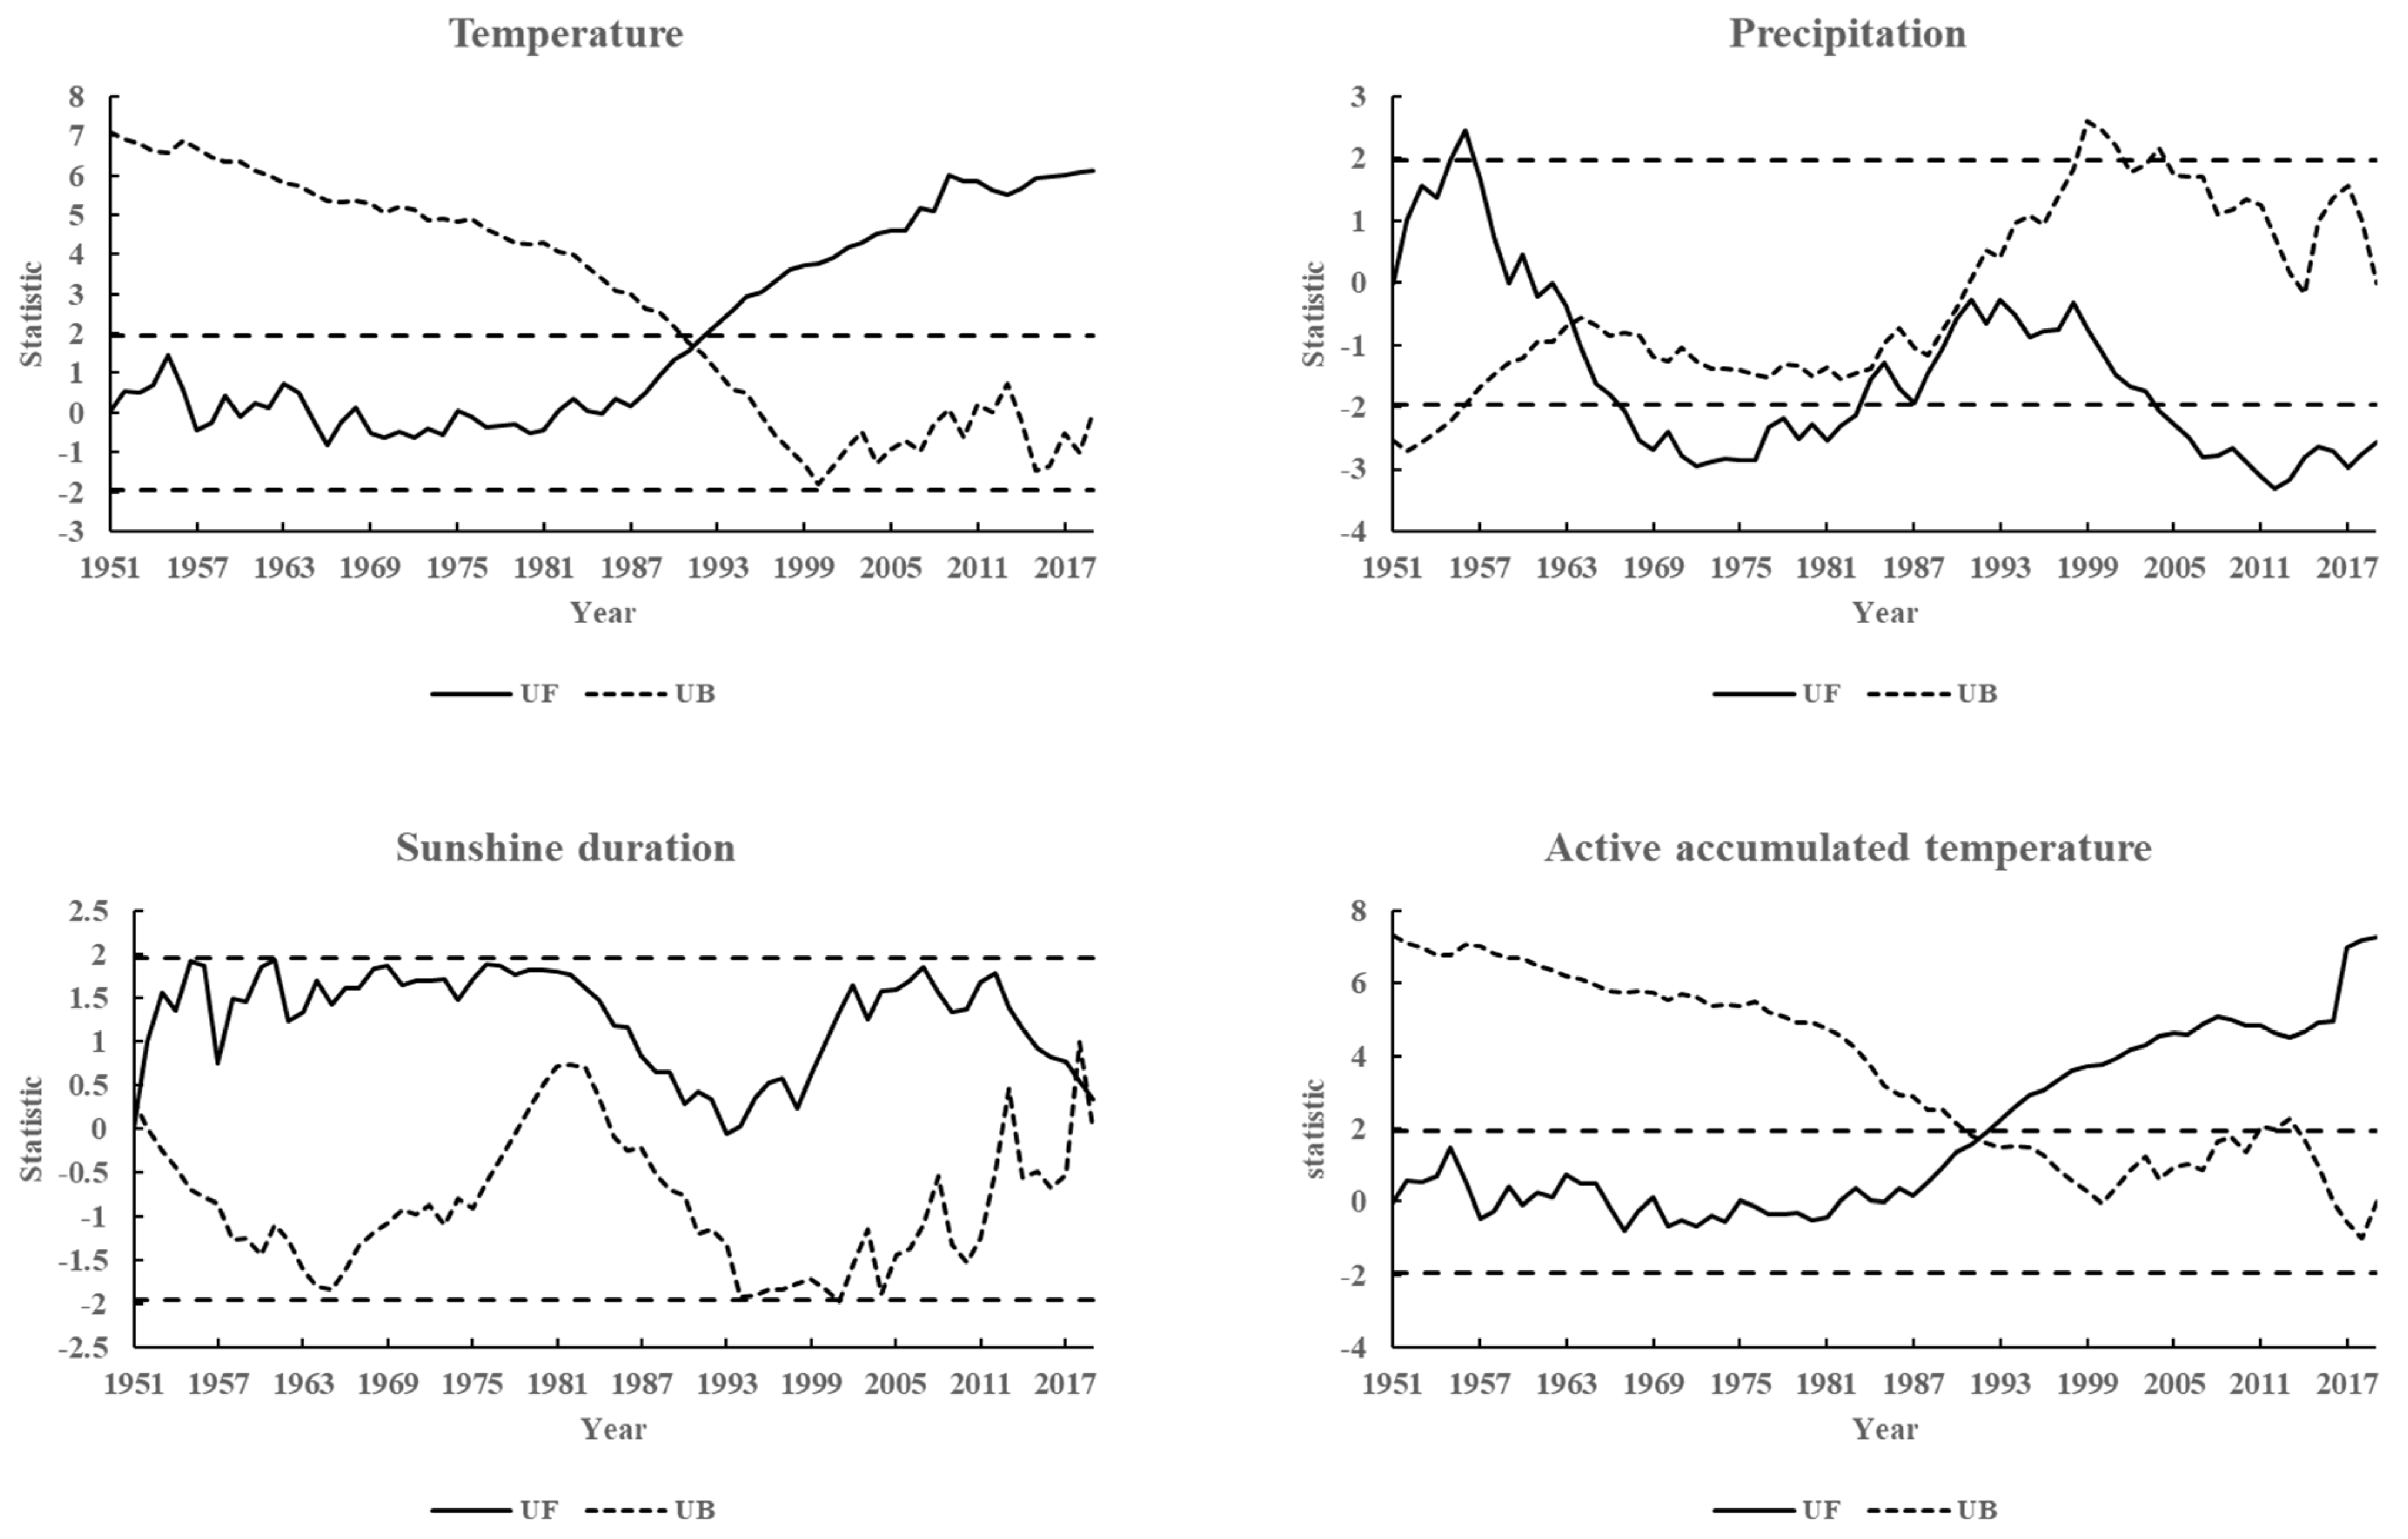
2.2.3. The Mann–Kendall Test

The Mann–Kendall Test is a non-parametric test method recommended by the World Meteorological Organization and has been widely used. This method does not require the variables to follow a normal distribution and is not disturbed by a few outliers, so it is advantageous in testing the variability of hydrological and meteorological series. The Mann–Kendall Trend Test can estimate whether the trend of time series changes is significant by calculating the test value (Z value). In a mutation test, the significance level α is selected for programming calculation (α = 0.05 in this paper, the critical value U0.05 = ±1.96), and two columns of data are obtained of UF and UB. The two curves of UF and UB and the two critical lines U0.05 = ±1.96 are plotted on the same graph. If UF > 0, it indicates that the time series shows an upward trend; otherwise, it represents a downward trend. When UF exceeds the critical line, it means that the time series has a notable upward or downward trend. If there is an intersection between the two curves and the intersection is between the two critical lines, the time corresponding to the intersection is the time when the mutation begins.

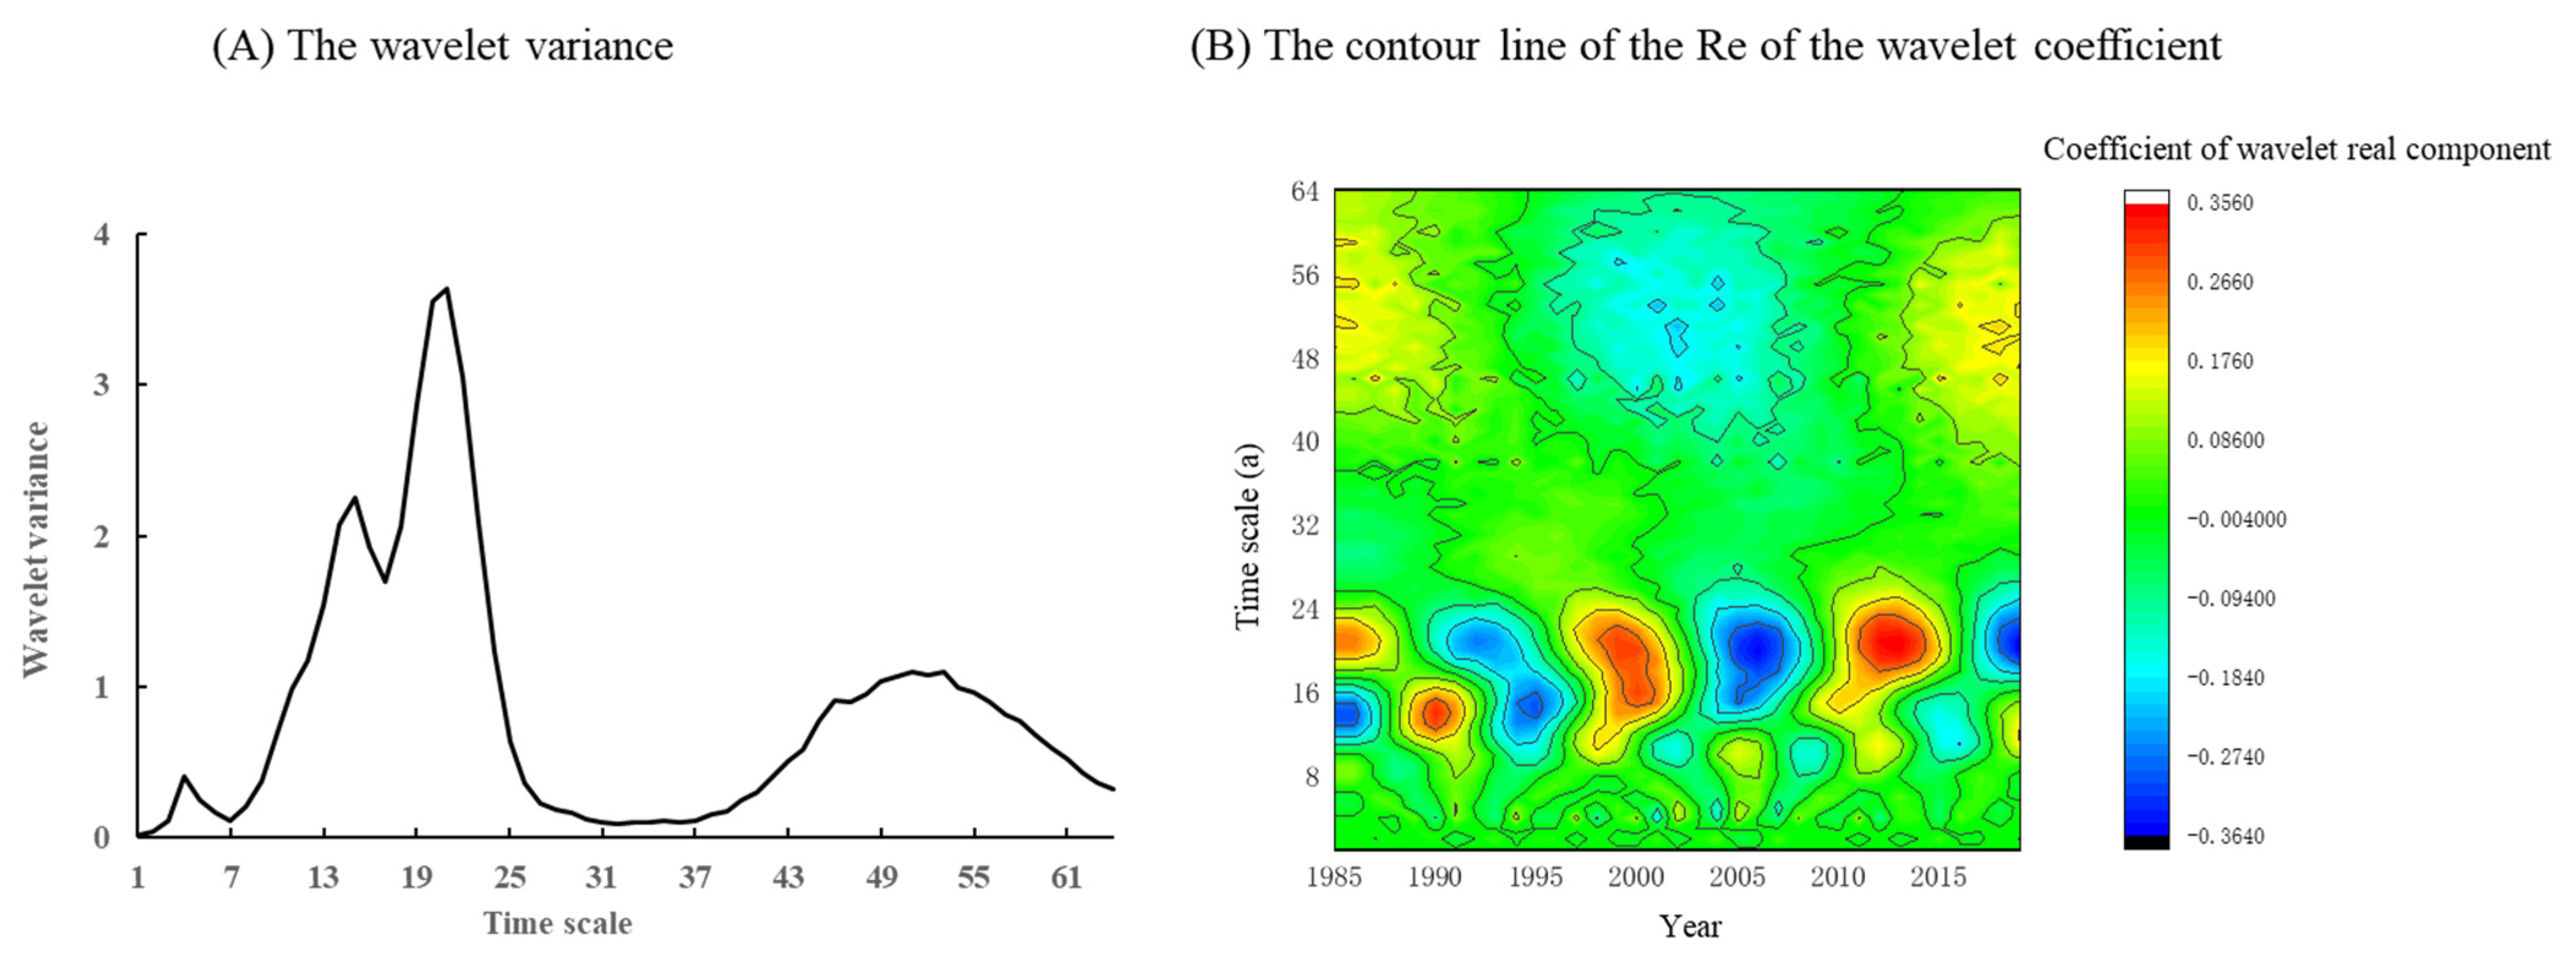
2.2.4. The Method of Wavelet Analysis

The Method of Wavelet Analysis decomposes the time series into time and frequency, which can effectively analyze the periodic structure and anomalous variation patterns of the series on different time scales, and is widely used in the periodic analysis of hydrological and meteorological time series [26]. Morlet Wavelet Analysis in MATLAB is used to calculate the wavelet coefficients and wavelet variance of each factor with the following formula:
W f ( a , b ) = 1 / a + f ( t ) ψ ¯ [ ( t b ) / a ] d t
V a r ( a ) = + | W f ( a , b ) | 2 d b
Here, W f ( a , b ) is the wavelet coefficient, V a r ( a ) is the wavelet variance, ψ ¯ [ ( t b ) / a ] is the basal wavelet function, Morlet wavelet function is selected as the primary function, a is the time scale factor and b is the time position factor.
The contour line of the Re of the wavelet coefficient can reflect the periodic change of the sequence under different time scales and the distribution in the time domain. If the Re coefficient is positive, it means that the wavelet coefficients are relatively high; if the Re coefficient is negative, it means that the wavelet coefficients are relatively low. The more intensive the contour line, the stronger the signal is. The wavelet variance represents the magnitude or capacity of the periodic fluctuation in the time series. The larger the value of the wavelet variance, the more significant the periodic variation characteristic of the corresponding time scale.

2.2.5. Decomposition of Grain Yield

Grain yield is affected by a combination of natural and eco-social factors. Generally, the grain yields caused by technological progress, economic and social advancement and other factors are defined as the trend yields, and those influenced by fluctuations in climatic factors are defined as meteorological yields. The grain yield in Hulunbuir is decomposed into three parts:
Y = X t + X w + X e
Here, Y is the actual grain yield per unit area (kg/hm2); X t is the trend yield (kg/hm2); X w is the meteorological yield (kg/hm2); and X e is the random fluctuating yield (kg/hm2), which can be neglected because of its relatively small impact.
At the same time, in order to quantitatively analyze the influence of climatic factors on grain yield, the meteorological yield is separated from formula (13) and the result is as follows:
X w = Y X t
In this formula, X w is the meteorological yield (kg/hm2); Y is the actual grain yield, (kg/hm2), which is the actual yield data per unit area in the statistical yearbook; and X t is the trend yield (kg/hm2), calculated by the 5 years moving average method.
In order to demonstrate the influence of climatic factors on grain yields more visually, the concept of relative meteorological yield is introduced, and the formula is as follow:
X r = X w X t
Here, X r is the relative meteorological yield (%). When X r ≥ 10%, it means that the meteorological factors of the year are favorable for the growth of soybeans, which is a climatically favorable year; when X r ≤ −10%, it means that the meteorological factors of the year are not conducive to the growth of soybeans, which is a climatically unfavorable year; when −10% < X r < 10%, it means that the meteorological factors of the year are normal. X t is the trend yield (kg/hm2); X w is the meteorological yield (kg/hm2).

2.2.6. The Method of Grey Relation Analysis

The Method of Grey Relation Analysis is the method to measure the degree of correlation between factors based on the trend of the same or different historical data series between factors [27]. It is commonly used in multi-factor analysis to determine the dominant factor by calculating the correlation between multiple factors and the same reference series. Taking grain yields as an example, the correlation between grain yields and meteorological factors is calculated as follow:
S ¯ = 1 n × t = 1 n S ( t )
Here, S ¯ is the degree of correlation between the t-th comparison series and the reference series; n is the length of the time series; and S(t) is the correlation coefficient between the meteorological factor index of the comparison series and the reference series in the t-th year, and its calculation formula is:
S ( t ) = Δ m i n + ρ × Δ m a x Δ ( t ) + ρ × Δ m a x
Here, Δ m i n and Δ m a x are the minimum and maximum values of the absolute difference between the comparison and the reference series in year t, respectively; Δ(t) is the absolute difference between the comparison and the reference series in year t; and ρ is the resolution difference, which is usually 0.5.

2.2.7. The Method of Integral Regression

The Method of Integral Regression can be used to explore the combined effect of different meteorological factors on the whole process of soybean growth and development. Its formula is:
Y C ^ = c + i = 1 k 0 i α i ( t ) X i ( t ) d t ,   ( i = 1 ,   2 ,   ,   k )
Here, Y C ^ is the estimated yield of meteorological elements at each time period; k is the number of meteorological elements; α i ( t ) is the effect of the i-th meteorological element at time t + Δt on the grain yield when the ith meteorological element changes by one unit; X i ( t ) is the ith meteorological value at time t + Δt; and c is a constant term. In practice, the time-orthogonal polynomial function expansion of α i ( t ) is:
α i ( t ) = j = 0 m α i j φ j ( t ) ,   ( i = 1 ,   2 , , k ;   j = 0 ,   1 ,   2 , , m )
Here, m is the number of the polynomial expansion and φ j ( t ) is the time-orthogonal polynomials.
Then, Equation (1) can be expressed as:
Y C ^ = c + i = 1 k 0 j j = 0 m α i j φ j ( t ) X i ( t ) d t
Setting φ j ( t ) X i ( t ) d t = ρ i j , then the formula (20) can be expressed as:
Y C ^ = c + i = 1 k j = 0 m ρ i j α i j ( t )
In practice, the formula for calculating ρ i j is:
ρ i j = c + t = 1 m ρ j ( t ) X i ( t ) ,   ( t = 1 ,   2 ,   3 ,   , n )
Here, n represents different biological periods.

3. Results and Analysis

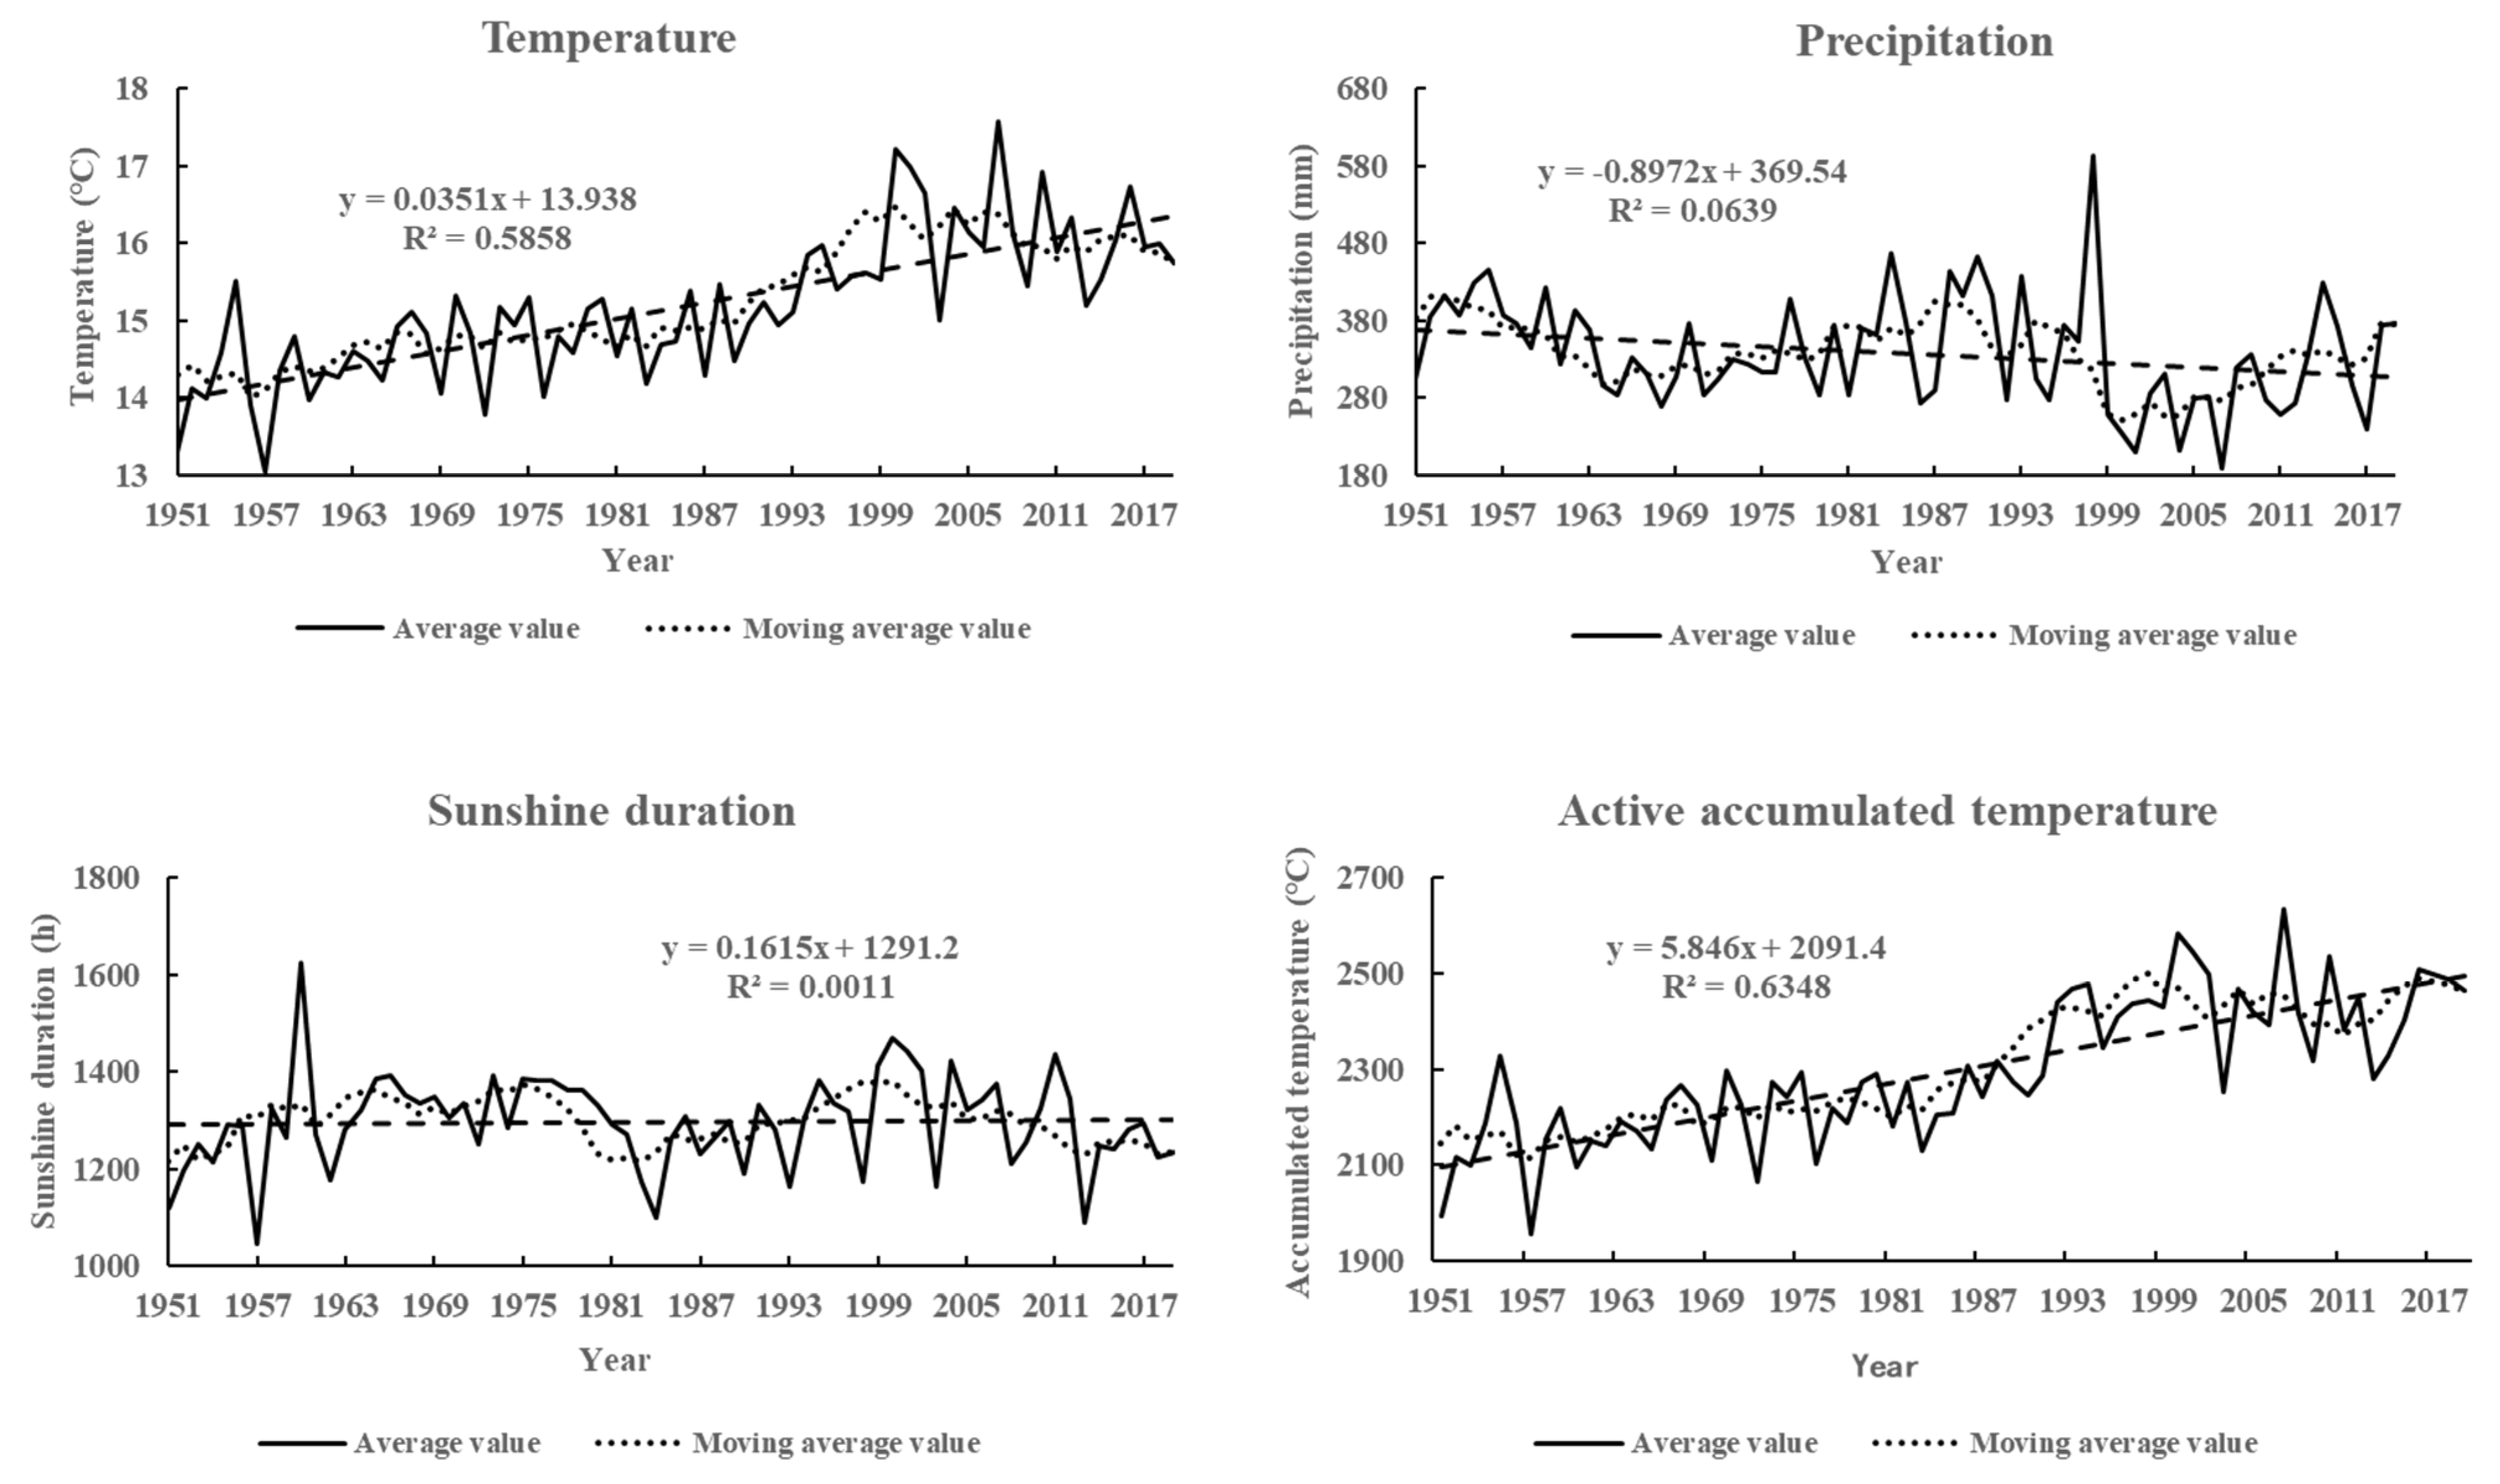
3.1. Characteristics of Climate Change

The average temperature, precipitation, sunshine duration and active accumulated temperature of the soybean growing season (May to September) in Hulunbuir from 1951 to 2019 were 15.16 °C, 338.14 mm, 1296.85 h and 2283 °C respectively, with different magnitudes of changes in various climate elements (Figure 1). Among them, the annual average temperature and active accumulated temperature showed a remarkable upward trend (p < 0.01), and the precipitation showed a fluctuating decline with a significant downward trend (p < 0.05), while the change trend of sunshine hours was not distinct (p > 0.05). According to the Hurst Exponent and the fractal dimension D of each climate element (Table 1), the future trend of all four climate elements is consistent with the past, among which the Hurst Exponent of temperature is the largest and the value of the fractal dimension D is the smallest, indicating that the future trend of temperature is the most distinct one and its trend is the strongest in terms of continuity. The above analysis reflects the warming and drying trend of climate change in Hulunbuir.
As shown in Figure 2, the UF and UB curves of temperature and active cumulative temperature in Hulunbuir both produce an intersection in 1991, and combined with the description in Section 2.2.3, it can be seen that both temperature and active cumulative temperature in Hulunbuir underwent an abrupt change around 1991, experiencing a shift from a cold to a warm trend and entering a relatively warm climate state, and this warming trend after 1992 exceeds the confidence level of a = 0.05. This warming trend exceeded the a = 0.05 confidence level after 1992, indicating a significant temperature increase in Hulunbuir. The UF curve intersects the UB curve in 1963, indicating that the precipitation changed abruptly in 1963 and the decreasing trend exceeded the a = 0.05 confidence line in 2003, indicating a significant decreasing trend of precipitation in Hulunbuir. The decreasing trend of precipitation is significant. The UF and UB curves of sunshine hours in Hulunbuir intersected at 1951 and 2017, which proved that the sudden change of sunshine hours occurred in 1951 and 2017; however, both UF and UB curves did not exceed the critical line, so the change of sunshine hours was more volatile in 69a, and the upward or downward trend was not significant.
The highest peaks of the wavelet variance of temperature, precipitation, sunshine duration and active accumulated temperature in Hulunbuir are all located at the time scale of 52a (Figure 3). Combined with the description of Section 2.2.4, it can be seen that the main period of variation of all four types of meteorological elements is about 52a. In addition, the second main period of temperature is characterized by a time scale of 10a, and the third and fourth peaks correspond to timescales of 6a and 25a, respectively, indicating that the fluctuations of these four periods determine the characteristics of Hulunbuir temperature changes in the entire time domain. Precipitation can be found in the second main period of 11a and quasi-period around 8a; sunshine duration exists in the second main period of 8a, and subperiods around 16a and 28a; active accumulated temperature exists in the second main period of 27a, and the subperiod around 6a, 10a and 15a.
On the time scale of the first main period, the annual average temperature in the soybean growing season in Hulunbuir from 1951 to 2019 has experienced two relatively complete high–low transformations. From 1956 to 1969 and from 1987 to 2003, there were high-temperature periods. From 1951 to 2019, soybean growing season precipitation in Hulunbuir experienced two relatively complete periods of wet and dry changes, with 1951–1969 in the wet period, 1970–1987 in the dry period, 1988–2004 in the wet period and 2005–2019 in the dry period. At the same time, the sunshine duration hours and active accumulated temperature during the soybean growing season in Hulunbuir experienced two relatively complete high–low transformations, and the period of changes is the same as the trend and the annual average temperature (Figure 4).

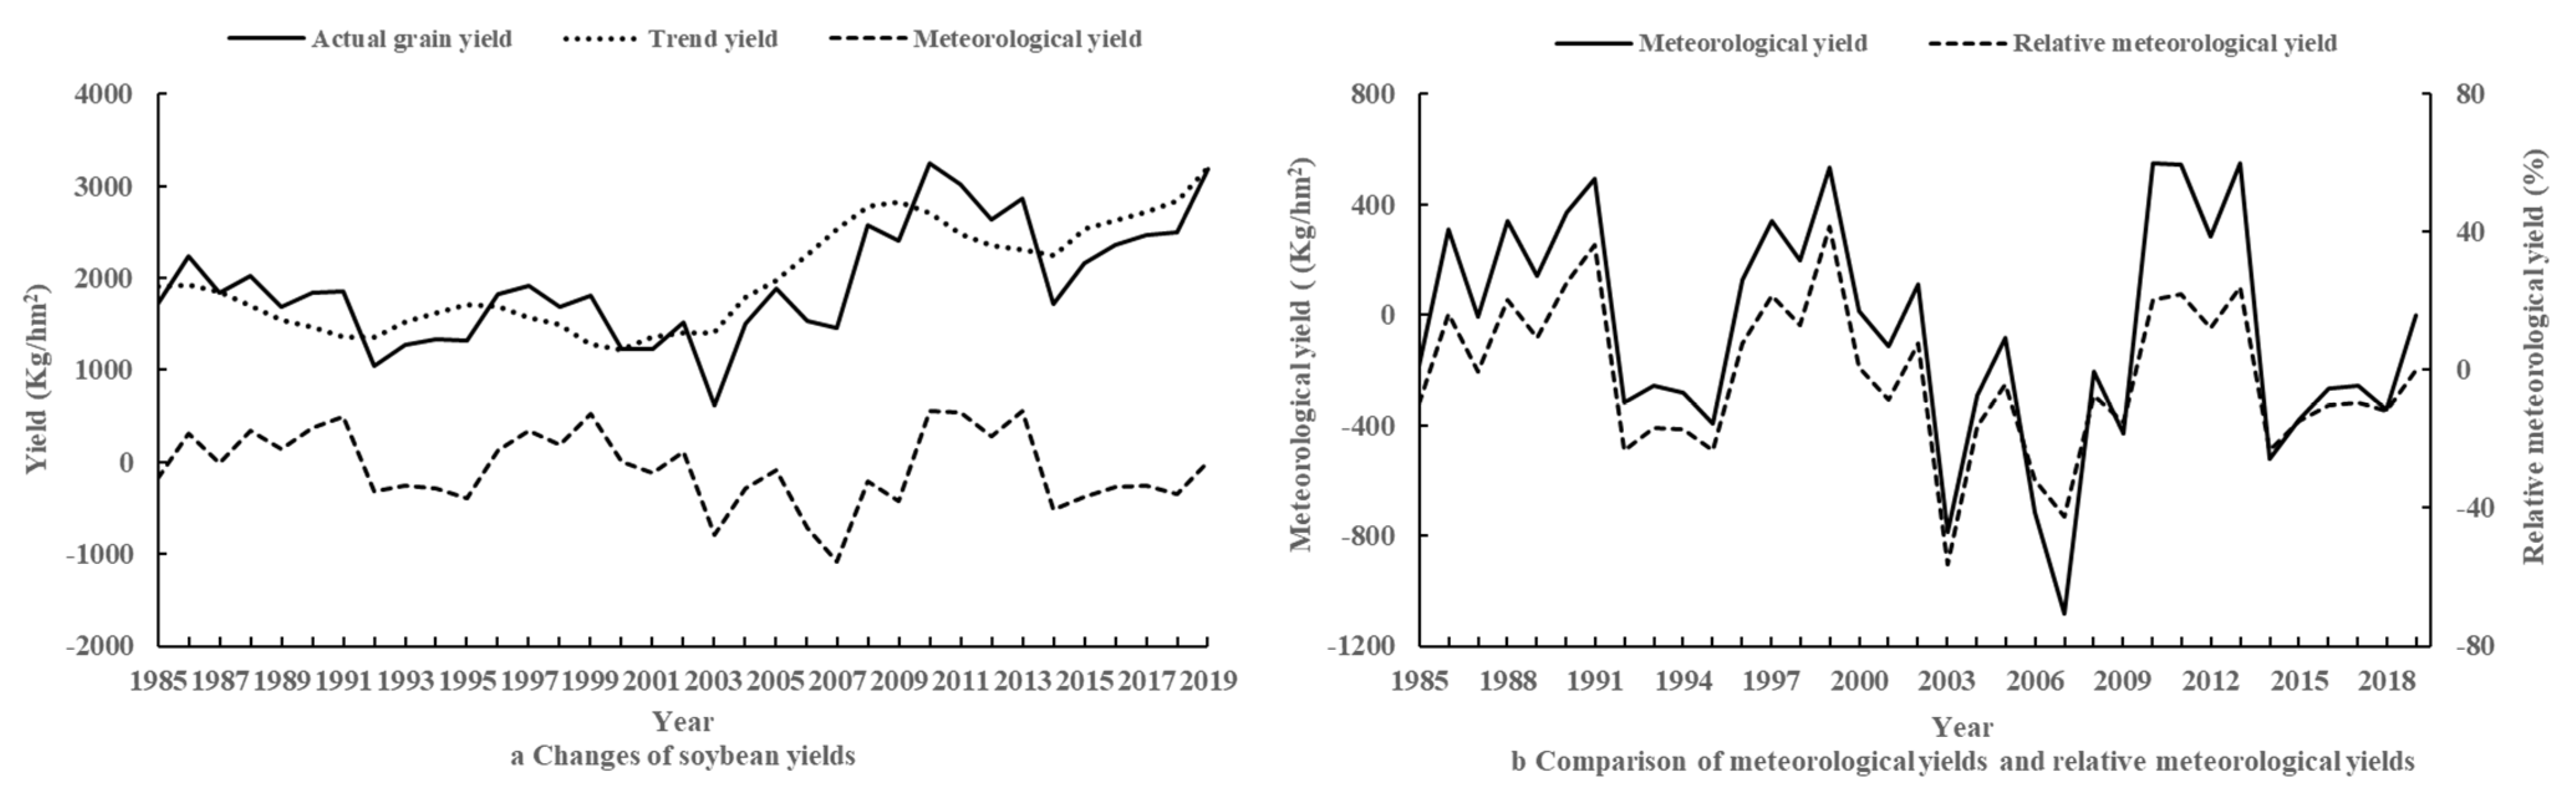
3.2. Characteristics of Soybean Yield Changes

From 1985 to 2019, the actual yield data of soybeans per unit area in Hulunbuir fluctuated from 610.88 to 3244.70 kg/hm2, with a marked trend of increase (p < 0.05). Before 2003, soybean yield fluctuated naturally. In 2003, it was hit by a rare and serious natural disaster, and the yield per unit area fell to a minimum of 610.88 kg/hm2. After that, the overall upward trend was restored under the regulation of the government and various social parties. The trend yield is generally on the rise, rising from 1900.87 kg/hm2 to 3189.06 kg/hm2, showing that scientific and technological progress as well as social and economic development have greatly improved grain production capacity and increased soybean yield per unit area (Figure 5).
To further explore the trend of soybean yield changes in Hulunbuir, the meteorological yields and relative meteorological yields of soybean were analyzed. As shown in Figure 5, the relative meteorological yield is consistent with the meteorological yield, and the trend of change fluctuates remarkably. The Z-value of climatic yield did not pass the 90% reliability test, so the changes of meteorological yield in Hulunbuir during 35 years fluctuated slightly with no significant change point (Table 1). The good or poor harvest of soybean is closely related to the meteorological conditions. Years with high temperature and long sunshine duration hours are shown as good harvest years, and vice versa. According to the definition in this paper of relative meteorological yields, the soybean yields in Hulunbuir in the past 35 years includes 11 climatically favorable year, 14 climatically unfavorable year, and the rest were normal years.
It can be seen from Table 1 that the past increments of actual soybean yields and meteorological yields are positively correlated with the future increments, indicating that the overall direction of future changes of the two is consistent with the past changes, where the Hurst Exponent of actual yields is greater than that of meteorological yields and the fractal dimension D is smaller than that of meteorological yields. It demonstrates that the trend of future changes in meteorological yields is less consistent than that of actual yields and that its trend is more complex on that time scale.
The Wavelet Analysis was conducted on the meteorological yields of soybean in Hulunbuir from 1985 to 2019 to explore the period of changes in the meteorological yields of soybean. In the wavelet variance, there are four distinct peaks, corresponding in turn to the time scales of 21a, 15a, 53a and 4a (Figure 6). The largest peak corresponds to a time scale of 21a, indicating that the period around 21a oscillates more strongly and is the 1st main period of soybean variability; the 2nd main cycle is characterized by a 15a time scale, and the 3rd and 4th peaks correspond to time scales of 53a and 4a, respectively. It is shown that fluctuations in these four periods determine the characteristics of soybean meteorological yield changes in Hulunbuir throughout the overall time domain.
On the first main time period scale, soybean meteorological yield in Hulunbuirexperienced two relatively complete high–low transformation from 1985 to 2019, with 1985–1992, 2000–2006 and 2014–2019 being periods of low yield, and 1993–1999 and 2007–2013 being periods of high yield (Figure 6). The analysis in Section 3.1 shows that the lower yield periods overlap to a greater extent with the dry and low-temperature periods in Hulunbuir, whereas the higher yield periods overlap to a greater extent with the abundant and high-temperature periods, so it is conjectured that soybean yield changes are correlated with changes in temperature and precipitation.

3.3. Influence Mechanism of Meteorological Factors on Soybean Resources

3.3.1. Response of Soybean Yield to Climate Change

In order to explore the response of soybean yield to climate change in Hulunbuir, the correlation between soybean yield per unit area, meteorological yield and meteorological factors in Hulunbuir from 1951 to 2019 was studied by employing the methods of Pearson Correlation Analysis and Grey Relation Analysis, respectively, and the results are shown in Table 2.
The Pearson Correlation Analysis shows that soybean yields in Hulunbuir from 1985 to 2019 were moderately positively correlated with temperature, active cumulative temperature and precipitation with significant correlation (p < 0.05), while the correlation with sunshine duration hours was not significant (p > 0.05). For soybean meteorological yields in Hulunbuir in the past 35 years, they had a strong positive correlation with temperature and active cumulative temperature, and a significant positive correlation with precipitation (p < 0.05), which was weaker than the former ones. The negative correlation between meteorological yields and sunshine duration in Hulunbuir was weak and insignificant (p > 0.05). We can conclude from it that temperature and active cumulative temperature are the main factors determining the soybean growth rate, which influences the span of the growing season. In addition, a moderate increase in precipitation has a positive effect on soybean yield, whereas the role of sunshine duration hours is not significant.
Soybean yields per unit area and meteorological yield changes in Hulunbuir have shown different correlation sequences with meteorological factors in the last 35a. The correlation between soybean yields and meteorological factors in Hulunbuir was 0.449–0.678, which was influenced by temperature and active cumulative temperature to a greater extent, followed by precipitation to a lesser extent, and least influenced by sunshine hours. In contrast, the correlation between meteorological yields and meteorological factors in Hulunbuir was greater at 0.526–0.776, with meteorological yields being more strongly correlated with temperature and active cumulative temperature, followed by precipitation, and least influenced by sunshine duration. Therefore, soybean yields and meteorological yields in Hulunbuir City responded to the four types of meteorological factors in the same order, while the degree of correlation was different, and the degree of correlation between meteorological yields and meteorological factors was higher. This result is consistent with the results of the Person correlation analysis, which shows that temperature is the dominant factor in soybean yield variation, followed by precipitation.

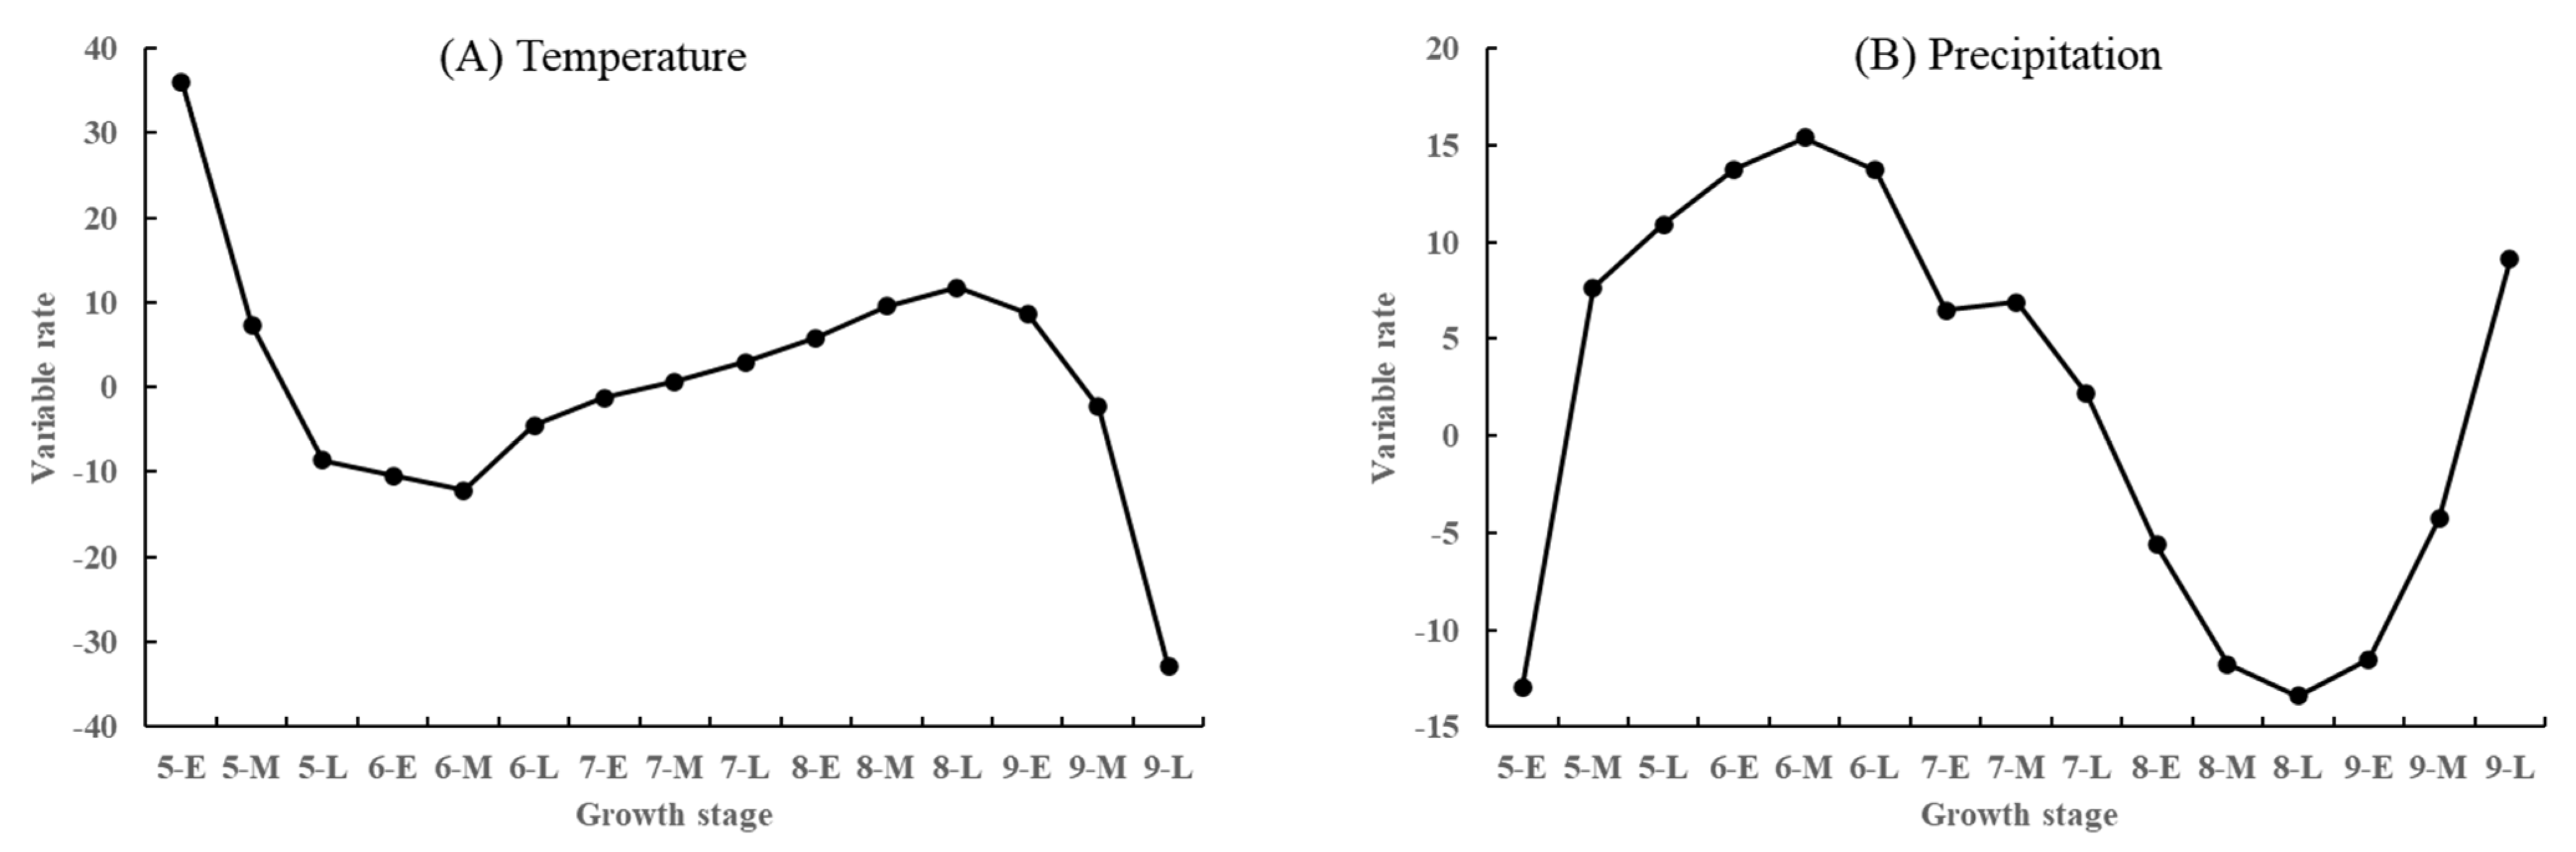
3.3.2. Effects of Dynamic Changes of Temperature and Precipitation on Soybean Yields

From the results of analysis in Section 3.3.1, it can be seen that high temperature in synchronization with abundant precipitation during the growth season of soybean planting areas in Hulunbuir are the key impacting factors for the growth and yields of soybean. Therefore, the Method of Integral Regression was used to quantitatively analyze the relationship between soybean yield in Hulunbuir and the daily average temperature and daily precipitation during the growing period in this area every ten days.
The soybean growth period in Hulunbuir is about from early May to late September. Therefore, ifthe whole soybean growth period is divided into 15 periods (n = 15), and the temperature and precipitation are set as independent variables x, and m is taken as 5, then:
Y C = c + j = 0 5 α j ( t ) ρ j ( X ) ,   ( j = 0 ,   1 ,   2 ,   3 ,   4 ,   5 )
Calculate the ρ i of temperature and precipitation according to the formula, and set ρ 0 - ρ 5 as the temperature item, ρ 6 ρ 11 as the precipitation item and Y c = 12. Then, the established multiple regression equation is as follows:
Y = 237.12 0.261 ρ 2 0.091 ρ 3 0.0075 ρ 9 + 0.000082 ρ 11
It can be seen that the 2nd and 3rd terms of temperature and the 9th and 11th terms of precipitation have a significant impact on soybean yields. The combined effects of the two factors constitute the soybean yield forecast equation. According to the yield prediction equation, the a ( t ) value of the influence of temperature and precipitation on soybean yield can be calculated, and then the a T ( t ) curve and a R ( t ) curve of the influence of temperature and precipitation on soybean yield can be obtained.
As shown in Figure 7A, during the soybean sowing period, emergence period and flower bud differentiation period (i.e., from mid to late May to early July), temperature mainly played a negative role in its growth and development, and the negative effect was the strongest in mid-June. It shows that the continuous high temperature will delay the emergence and germination of seeds, causing the putrefactive phenomenon of seeds and affecting the yields. During the flowering, podding and grain–bursting stages of soybeans (i.e., mid-July to early September), temperature has a significant positive effect on their growth and development. In a certain range, the higher the temperature, the faster the growth, and the lack of heat in this period will have a great impact on soybean yield. Temperature had a significant negative effect on soybean growth and development from the late bulge period to the maturity of soybeans. The high temperature during the period will affect the accumulation of dry matter, which will then lead to the reduction in soybean yields.
As shown in Figure 7B, during the soybean sowing period, emergence period, flower bud differentiation period and flowering period, the precipitation mainly has a positive effect on its growth and development, and the positive effect is the greatest in June, indicating that sufficient water supply at the seedling stage is the key to high yields. In the early stage of soybean podding and maturity, the increase in precipitation will be detrimental to the growth and development of soybeans, resulting in the phenomenon of falling flowers and pods and reduced yields. In the middle and late stages of soybean maturity, precipitation has a positive impact on its growth and development. Therefore, it is necessary to ensure sufficient moisture at this stage.

4. Further Discussion

Soybean production is fundamental to ensuring the supply of green and renewable diesel. Climatic factors are closely related to changes in soybean yields. Not only do they directly affect soybean growth, but they also indirectly influence soybean growth suitability by altering the effects of non-climatic factors such as irrigation and fertilizer [7,10]. Therefore, exploring the variation pattern of meteorological factors and soybean yield and analyzing the correlation between the two can, to a certain extent, be used to promote the improvement of soybean yield by changing climatic conditions, thus ensuring the smooth transition to green and renewable energy.
Previous studies have shown that the meteorological factors that have a relatively greater impact on soybean yields mainly include light, heat and water [28,29]. Therefore, this paper firstly analyzes the change characteristics and trends of the annual average temperature, annual precipitation, annual sunshine duration and annual active accumulative temperature in the soybean growing season in a long time series in Hulunbuir, and it was found that the four types of climatic factors all had a main change period of about 52a, which was close to the third period of soybean meteorological yields of 53a, indicating that soybean yields responded to the dynamic changes of the four types of climatic factors.
The Pearson Correlation Analysis of the four meteorological factors to soybean yield and meteorological yield in Hulunbuir from 1985 to 2019 showed that soybean yield and meteorological yield were both strongly influenced by the average growing season temperature and active cumulative temperature, and were also significantly and positively correlated with growing season precipitation, while the number of hours of sunshine during the growing season had little effect on soybean yield and meteorological yield. To confirm the reliability of the results, a Grey Relation Analysis was employed to determine the dominant climatic factors affecting soybean yield in this study. The results showed that soybean yields per unit area and meteorological yields in Hulunbuir had the same order of correlation with meteorological factors; that is to say, they were more strongly correlated with temperature and active accumulative temperature followed by precipitation, and were least influenced by sunshine duration. The mature deliberation of the above two methods of analysis show that temperature is the dominant factor affecting the fluctuation of soybean yields in Hulunbuir, and the two are positively correlated. It can be attributed to the fact that the geographical location of Hulunbuir makes the heat conditions of crops in the growing season not ideal, yet the warming of the climate has enhanced the heat resources in the region, which is beneficial to the increase in the crop photosynthesis rate, thus prolonging the growing season, and shortening the frost period, improving the multiple cropping index and diversifying the planting varieties [18,30], thereby boasting the grain yield per unit area. The result is in line with the study by Li et al. (2015) [31]. At the same time, it is concluded in this paper that there is also a significant positive correlation between precipitation in the soybean growing season and soybean yields. It can be explained by the fact that soybeans store more water at each growth stage, and sufficient precipitation can supplement the water lost by evapotranspiration and ensure physiological activities such as respiration, thus promoting efficient uptake and utilization of CO2 by soybeans and then resulting in higher yields [32]. Wang et al. (2021) found that temperature and precipitation were the dominant meteorological factors affecting soybean protein content in northeastern Inner Mongolia, while the dominant meteorological factor affecting soybean fat content was temperature, and that yield, protein content and fat content had the same dominant factor—temperature. Therefore, it can be assumed that the increase in temperature in Hulunbuir not only helped to improve soybean yield, but also contributed significantly to the promotion of high-quality soybean production [24].
However, the results of the integral regression model revealed that the effects of temperature and precipitation on soybean growth and development at all stages were not significantly linear, and there were also negative effects of both meteorological factors in certain growth stages. Through the analysis of the effect of each period, it was found that drought had the greatest impact on yield at the seedling stage, and that adequate water supply at the seedling stage was necessary for high yields. Meanwhile, moderate low-temperature regulation at the seedling and maturity stages could prolong the time for soybeans to absorb nutrients and to accumulate organic matter, to produce more full-grained soybeans. Wang et al. (2021) concluded that the podding-drum stage is a common critical period affecting the protein and fat content of soybeans in northeastern Inner Mongolia, and that high temperature and precipitation during this stage are favorable for protein accumulation and fat content, also indicating that elevated temperature and supplemental precipitation during the flowering-drum-drum stage have positive effects on soybean yield and quality improvement [24].
The soybean is a light- and temperature-sensitive crop, and moderate increases in light and improved light and heat conditions can enhance organic matter synthesis in soybeans, which is beneficial to soybean growth and yields [33]. Wang et al. found that Hulunbuir enjoys sufficient sunshine duration during the growing season, within the range of hours required for soybean growth within most years [34], while Jin et al. concluded that sunshine suitability in Hulunbuir was generally stable in the past and future [35], so the effect of sunshine duration on soybean yield was insignificant.
In addition, this paper found that the correlation between the soybean yield per unit area of Hulunbuir and the four types of climatic factors from 1985 to 2019 was weak to moderately strong. Jin et al. (2019) also held that the future climate trend in Hulunbuir had a weak positive effect on soybean production [36], indicating that the actual soybean yields per unit area are also affected by other factors. Most studies have shown that, compared with the factor of climate change, crop management practices have a greater impact on the sowing, emergence and maturity of soybeans. The coordination of water and heat conditions with other non-climatic factors is the key to increase crop yields [36,37]. For example, the combination of temperature and irrigation is conducive to the improvement in crop yields [38], while fertilizer combined with a certain amount of light, temperature and precipitation can better regulate soil fertility to increase yields [39]. Therefore, the increase in soybean yields in Hulunbuir may be connected to the continuous improvement of agricultural production technology, fertilizer application amount and frequency and acreage of irrigation. At the same time, the cultivation of high-yielding varieties can also promote the improvement of soybean yields.

5. Conclusions and Policy Implications

5.1. Conclusions

Based on the data of the climate factors of Hulunbuir from 1951 to 2019, the characteristics of climate change and soybean yield response in Hulunbuir City were analyzed as follows:
Firstly, during the soybean growing season in Hulunbuir from 1951 to 2019, the annual average temperature and the annual active accumulated temperature showed a significant upward trend, while the annual precipitation registered a significant downward trend and the annual sunshine duration fluctuated. The future change trend is consistent with the past one, indicating that the climate in Hulunbuir would be warming and drying.
Secondly, the actual output of soybeans in Hulunbuir from 1985 to 2019 was affected by natural disasters, technological progress and socioeconomic development, and showed a fluctuating trend of falling at the beginning and then rising. Meteorological yields fluctuated and their change period corresponds to the change period of climatic factors. The relative meteorological yields were consistent with the change trend of meteorological yields. The soybean yields in Hulunbuir in the past 35 years included 11 climatically favorable years and 14 climatically unfavorable years, and the rest were normal years.
Thirdly, changes in soybean yields in Hulunbuir are mainly influenced by temperature and active cumulative temperature. The increase in temperature within a certain range and the accelerated ground temperature increment will contribute to the improvement in grain yield per unit area, while the increase in precipitation will also have a positive effect on the improvement of soybean yield, while sunshine duration has no significant effect on soybean yield in this region. In addition, high temperature in synchronization with abundant precipitation during the growth season of soybean planting areas in Hulunbuir is the major meteorological factor promoting yields of soybean.
Fourthly, temperature and precipitation have different effects on the growth and development of soybeans at different growth stages. Temperature had a negative effect on the growth and development of soybeans at the seeding–emergence–bud differentiation stage and from the late bulge period to the maturity of soybeans, whereas it had a positive effect on the flowering, podding and grain–bursting stages of soybeans. Precipitation had a negative effect on the sowing–flowering stage and the mid-to-late-maturity stage of soybean development, whereas it had a positive effect on the podding to early-maturity stage of development.

5.2. Policy Implications

In recent years, Hulunbuir has focused on safeguarding grain production, making efforts in disaster prevention and mitigation, optimizing structure, environmental-friendly production and implementing major projects. For example, it has expanded the planting area of soybeans, introduced other high-yielding grain crops, provided greater policy support, accelerated the retrofitting of machinery and equipment and vigorously promoted the research and development of special machinery and equipment. In addition, it gives full play to the leading role of subsidy policies in order to ensure a steady increase in soybean yields. Here are the policy implications for soybean planting in Hulunbuir provided by this paper:
First of all, this paper found that the synchronization of water and heat is the key to promoting the improvement of soybean yield in Hulunbuir, in which temperature plays a leading role, and the two factors have different effects on soybean growth and development in each period. It is also clear from the study of Wang et al. that the flowering-drumming-pod stage is a critical period affecting fat and protein accumulation in soybeans [24]. This paper suggests that adequate irrigation should be ensured in the soybean seedling stage, and appropriate low-temperature regulation should be performed to prolong the time for soybean to absorb nutrients and to accumulate organic matter. In the podding and grain–bursting stages of soybeans, sufficient heat supply should be in place and excessive irrigation should be prevented, so as to avoid the phenomenon of falling flowers and pods. In the middle and late stages of soybean maturity, sufficient water should be maintained and moderate low-temperature regulation is welcome, in order to guarantee full-grained soybeans.
Second, the combined effect of meteorological factors and crop management practices affects soybean yields. Therefore, in accordance with the current climate and soil moisture conditions, the government should fully apply technologies such as full-scale smashing and returning of straw, deep ploughing, formula fertilization, fertilizer control, drug reduction, etc., and choose varieties that are high-yield, high-quality, disease-resistant, adaptable, suitable for mechanical planting and appropriate for planting in the region. Meanwhile, the government should also strengthen the prevention and control of pests and weeds, promote the application of technologies that support high-yields, enhance technical training and guidance and pay attention to the synchronization of water and heat to enhance soybean yields.

6. Limitations and Research Gaps

This paper analyzes the characteristics of changes in different climatic factors over long time scales and the response of soybean yields in Hulunbuir to provide a reference for ensuring stable soybean yields and optimizing planting plans. It should be noted that, taking into account the availability of data, the selected weather stations are limited, which may have minor discrepancies from the real status. Moreover, in exploring the effects of temperature and precipitation on the whole process of soybean growth and development, this paper uses relatively uniform sowing and harvesting periods, thus ignoring the spatial and temporal specificity of soybean development in different growing areas, which affects the accuracy of the soybean fertility data. In addition, changes in the quality of soybean fat and protein in Hulunbuir also have an important impact on green energy supply by affecting the oil yield and thus the refining process of renewable diesel. Therefore, it is worthwhile to further refine and explore the characteristics of soybeans’ response to climatic factors in various periods within the growing season at different meteorological stations in Hulunbuir, to explore the changes in soybean fat, protein and other nutrients in relation to meteorological factors, and to further improve the soybean planting policy in Hulunbuir City as a direction worthy of attention in future research.

Author Contributions

Conceptualization, X.N. and C.W.; methodology, X.N.; validation, Y.Z., Y.W. and C.W.; formal analysis, X.N.; investigation, P.D.; resources, P.D.; data curation, Y.Z.; writing—original draft preparation, X.N. and P.D.; writing—review and editing, Y.W.; visualization, X.N.; supervision, Y.W.; project administration, Y.Z.; funding acquisition, Y.Z. All authors have read and agreed to the published version of the manuscript.

Funding

This paper was supported by the General Program of the National Natural Science Foundation of China (71573019).

Institutional Review Board Statement

Not applicable.

Informed Consent Statement

Not applicable.

Data Availability Statement

The analysis data were taken from the China Meteorological Data Sharing Network, the Nation-al Bureau of Statistics, the Hulunbuir Bureau of Statistics and the Hulunbuir Statistical Yearbook.

Conflicts of Interest

The authors declare no conflict of interest.

References

  1. Ishrar, I.; Adam, Z.; Islam, S. Soybean (Glycine Max): Alternative Sources of Human Nutrition and Bioenergy for the 21st Century. Am. J. Food Sci. Technol. 2019, 7, 1–6. [Google Scholar]
  2. Walter, A.; Seabra, J.; Rocha, J.; Guarenghi, M.; Vieira, N.; Damame, D.; Santos, J.L. Spatially Explicit Assessment of the Feasibility of Sustainable Aviation Fuels Production in Brazil: Results of Three Case Studies. Energies 2021, 14, 4972. [Google Scholar] [CrossRef]
  3. Islam, M.M.; Sohag, K.; Hammoudeh, S.; Mariev, O.; Samargandi, N. Minerals import demands and clean energy transitions: A disaggregated analysis. Energy Econ. 2022, 113, 106205. [Google Scholar] [CrossRef]
  4. Komarova, A.V.; Filimonova, I.V.; Kartashevich, A.A. Energy consumption of the countries in the context of economic development and energy transition. Energy Rep. 2022, 8, 683–690. [Google Scholar] [CrossRef]
  5. Monteiro, A.; Ankrah, J.; Madureira, H.; Pacheco, M.O. Climate Risk Mitigation and Adaptation Concerns in Urban Areas: A Systematic Review of the Impact of IPCC Assessment Reports. Climate 2022, 10, 115. [Google Scholar] [CrossRef]
  6. Pooja, N. Trends of Extreme Climate Events in the Kumaon Area of the Little Himalayas—Taking Ramgad Basin as an Example. J. Res. Sci. Eng. 2022, 4, 28. [Google Scholar]
  7. Chou, J.M.; Xu, Y.; Dong, W.J.; Xian, T.; Xu, H.; Wang, Z. Comprehensive climate factor characteristics and quantitative analysis of their impacts on grain yields in China’s grain-producing areas. Heliyon 2019, 5, e02846. [Google Scholar] [CrossRef] [Green Version]
  8. Saeid, S.Y.; Sadegh, K. On Projecting Climate Change Impacts on Soybean Yield in Iran: An Econometric Approach. Environ. Process. 2020, 7, 73–87. [Google Scholar]
  9. Rakhal, S.; Glenn, F.; Daniel, M. Effects of climatic and economic factors on corn and soybean yields in ontario: A county level analysis. Int. J. Food Agric. Econ. 2019, 7, 1–17. [Google Scholar]
  10. Mukesh, D.B.; Silvia, S.; Justin, S. Projecting corn and soybeans yields under climate change in a Corn Belt watershed. Agric. Syst. 2017, 152, 90–99. [Google Scholar]
  11. Wang, C.; Linderholm, H.W.; Song, Y.; Wang, F.; Liu, Y.; Tian, J.F.; Xu, J.X.; Song, Y.B.; Ren, G.Y. Impacts of Drought on Maize and Soybean Production in Northeast China During the Past Five Decades. Int. J. Environ. Res. Public Health 2020, 17, 2459. [Google Scholar] [CrossRef] [PubMed] [Green Version]
  12. Tan, Q.H.; Liu, Y.j.; Dai, L. Shortened key growth periods of soybean observed in China under climate change. Sci. Rep. 2021, 11, 8197. [Google Scholar] [CrossRef] [PubMed]
  13. Fernandes, R.D.M.; de Melo, D.M.; Elli, E.F.; Battisti, R. Climate change impacts on rainfed and irrigated soybean yield in Brazil’s new agricultural frontier. Theor. Appl. Climatol. 2021, 147, 803–816. [Google Scholar] [CrossRef]
  14. Ko, J.; Cho, J.; Choi, J.; Yoon, C.Y.; An, K.N.; Ban, J.O.; Kim, D.K. Simulation of Crop Yields Grown under Agro-Photovoltaic Panels: A Case Study in Chonnam Province, South Korea. Energies 2021, 14, 8463. [Google Scholar] [CrossRef]
  15. Casali, L.; Herrera, J.M.; Rubio, G. Resilient soybean and maize production under a varying climate in the semi-arid and sub-humid Chaco. Eur. J. Agron. 2022, 135, 126463. [Google Scholar] [CrossRef]
  16. Li, X.S.; Zheng, C.L.; Cao, C.Y.; Dang, H.K.; Sun, J.S.; Li, K.J.; Ma, J.Y. Analysis of Climatic Potential Productivity and Wheat Production in Different Producing Areas of the Northern Hemisphere. IOP Conf. Ser. Earth Environ. Sci. 2020, 427, 012010. [Google Scholar] [CrossRef]
  17. Ding, Q.Y.; Tian, Z.; Fan, D.L.; Sun, L.X.; Fischer, G. A Study of the Impact on Soybean Potential under Climate Change. J. Risk Anal. Crisis Response 2016, 6, 95. [Google Scholar] [CrossRef] [Green Version]
  18. Gong, L.J.; Liu, D.; Jiang, L.Q.; Li, X.F.; Lv, J.J. Distribution characteristics of climate potential productivity of soybean in frigid region and its response to climate change. Environ. Sci. Pollut. Res. Int. 2021, 29, 7452–7464. [Google Scholar] [CrossRef]
  19. Feng, L.; Wang, H.; Ma, X.W.; Peng, H.B.; Shan, J.R. Modeling the current land suitability and future dynamics of global soybean cultivation under climate change scenarios. Field Crops Res. 2021, 263, 108069. [Google Scholar] [CrossRef]
  20. Lin, T.S.; Song, Y.; Lawrence, P.; Kheshgi, H.S.; Jain, A.K. Worldwide Maize and Soybean Yield Response to Environmental and Management Factors Over the 20th and 21st Centuries. J. Geophys. Res. Biogeosciences 2021, 126, e2021JG006304. [Google Scholar] [CrossRef]
  21. Liu, M.F.; Zhao, J.J.; Guo, X.Y.; Zhang, Z.X.; Tan, G.; Yang, J.H. Study on Climate and Grassland Fire in HulunBuir, Inner Mongolia Autonomous Region, China. Sensors 2017, 17, 616. [Google Scholar] [CrossRef] [PubMed] [Green Version]
  22. Na, R.; Du, H.B.; Na, L.; Shan, Y.; He, H.S.; Wu, Z.F.; Zong, S.W.; Yang, Y.; Huang, L.R. Spatiotemporal changes in the Aeolian desertification of Hulunbuir Grassland and its driving factors in China during 1980–2015. Catena 2019, 182, 104123. [Google Scholar] [CrossRef]
  23. Zhou, C.H.; Xie, Y.C.; Zhang, A.B.; Liu, C.; Yang, J.Y. Spatiotemporal analysis of interactions between seasonal water, climate, land use, policy, and socioeconomic changes: Hulun-Buir Steppe as a Case Study. Water Res. 2021, 209, 117937. [Google Scholar] [CrossRef]
  24. Wang, H.Z.; Tang, H.Y.; Niu, D.; Lu, M. Study on meteorological forecasting methods for key quality components of soybean. Soybean Sci. 2021, 40, 112–121. [Google Scholar]
  25. Xiao, Z.K.; Ding, W.L.; Liu, J.S.; Tian, M.Z.; Yin, S.; Zhou, X.H.; Gu, Y. A fracture identification method for low-permeability sandstone based on R/S analysis and the finite difference method: A case study from the Chang 6 reservoir in Huaqing oilfield, Ordos Basin. J. Pet. Sci. Eng. 2018, 174, 1169–1178. [Google Scholar] [CrossRef]
  26. Shevchenko, O.; Skorbun, A.; Osadchyi, V.; Osadcha, N.; Grebin, V.; Osypov, V. Cyclicities in the Regime of Groundwater and of Meteorological Factors in the Basin of the Southern Bug River. Water 2022, 14, 2228. [Google Scholar] [CrossRef]
  27. Kimia, P.; Payam, S.; Hamed, R.; Peivand, B. Evaluating the health system financing of the Eastern Mediterranean Region (EMR) countries using Grey Relation Analysis and Shannon Entropy. Cost Eff. Resour. Alloc. 2018, 16, 31. [Google Scholar]
  28. Moacir, T.; Griebler, G. How do water, compaction and heat stresses affect soybean root elontation? A review. Rhizosphere 2021, 19, 100403. [Google Scholar]
  29. Sun, W.G.; Fleisher, D.; Timlin, D.; Li, S.; Wang, Z.J.; Reddy, V. Effects of elevated CO2 and temperature on soybean growth and gas exchange rates: A modified GLYCIM model. Agric. For. Meteorol. 2022, 312, 108700. [Google Scholar] [CrossRef]
  30. Yan, H.; Nelson, B. Effect of temperature and growth and disease development in soybean. Can. J. Plant Pathol. 2020, 42, 527–537. [Google Scholar] [CrossRef]
  31. Li, Z.S.; Liu, S.; Guo, C.M.; Wang, D.N. Impact of future climate change on rice yield in three provinces of Northeast China. J. China Agric. Univ. 2015, 20, 223–228. [Google Scholar]
  32. Leuthold, S.J.; Wendroth, O.; Salmerón, M.; Poffenbarger, H. Weather-dependent relationships between topographic variables and yield of maize and soybean. Field Crops Res. 2022, 276, 108368. [Google Scholar] [CrossRef]
  33. Kanchan, J.; Virender, S.B. Influence of different light intensities on specific leaf weight, stomatal density photosynthesis and seed yield in soybean. Plant Physiol. Rep. 2020, 25, 277–283. [Google Scholar]
  34. Wang, Y.P.; Zhang, K.; Zhang, J.X.; Yao, Y.; Jiang, F.Y. Effects of climatic conditions at different sowing dates on main agronomic traits and quality of soybean in northeastern Inner Mongolia. J. Agron. 2022, 12, 60–65. [Google Scholar]
  35. Jin, L.X.; Wu, S.R.; Wu, R.F. Climate suitability change and future scenarios of soybean in Inner Mongolia. Jiangsu Agric. Sci. 2019, 47, 134–140. [Google Scholar]
  36. Liang, H.; Ning, J.; Qiang, Y. Impacts of climate change and crop management practices on soybean phenology changes in China. Sci. Total Environ. 2020, 707, 135638. [Google Scholar]
  37. Yang, J.; Li, G.L.; Cong, J.H.; Zhao, Y.B.; Pei, Y.J. Climate change trend and its influence on grain crop yield in Shanxi Province in recent 60 years. Resour. Dev. Mark. 2018, 34, 1389–1396. [Google Scholar]
  38. Hou, P.F.; Chang, Y.T.; Lai, J.M.; Chou, K.L.; Tai, S.F.; Tseng, K.C.; Chow, C.N.; Jeng, S.L.; Huang, H.J.; Chang, W.C. Long-Term Effects of Fertilizers with Regional Climate Variability on Yield Trends of Sweet Corn. Sustainability 2020, 12, 3528. [Google Scholar] [CrossRef]
  39. Shahbaz, P.; Haq, S.U.; Boz, I. Linking climate change adaptation practices with farm technical efficiency and fertilizer use: A study of wheat-maize mix cropping zone of Punjab province, Pakistan. Environ. Sci. Pollut. Res. Int. 2021, 29, 16925–16938. [Google Scholar] [CrossRef]
Figure 1. Change characteristics of meteorological factors in the soybean growing season from 1951 to 2019 in Hulunbuir.
Energies 15 08347 g001
Figure 2. The Mann−Kendall Mutation Test results of meteorological factors in the soybean growing season in Hulunbuir from 1951 to 2019.
Energies 15 08347 g002
Figure 3. Wavelet variance of meteorological elements in Hulunbuir from 1951 to 2019.
Energies 15 08347 g003
Figure 4. The contour line of the Re of the wavelet coefficients of meteorological elements from 1951 to 2019 in Hulunbuir.
Energies 15 08347 g004
Figure 5. Characteristics of soybean yield changes in Hulunbuir from 1985 to 2009.
Energies 15 08347 g005
Figure 6. The wavelet variance of meteorological yield of soybeans and the contour line of the Re of the wavelet coefficient in Hulunbuir from 1985 to 2019.
Energies 15 08347 g006
Figure 7. The influence of temperature and precipitation on soybean yields.
Energies 15 08347 g007
Table 1. Change tendency rate of soybean yields and regional meteorological factors in Hulunbuir, the values of the Mann–Kendall Trend Test and the Rescaled Range Analysis.
ParameterYield of per Unit Area/kg/hm2Meteorological Yield/
kg/hm2
Temperature/
°C
Precipitation/
mm
Sunshine Duration/
h
Active Accumulated Temperature/
°C
Change tendency rate (10a)322.84−4.540.35−8.971.6258.46
The value of Z2.56 *−1.247.12 **−2.54 *0.327.23 **
Hurst Exponent0.880.720.990.760.690.72
The fractal dimension D1.121.281.011.241.311.28
Note: The signs of ** and * represent passing the significance tests at 0.01 and 0.05 levels, respectively.
Table 2. The Pearson correlation coefficient and Grey Relation Analysis of soybean yield and meteorological factors in Hulunbuir.
ParameterSoybean Yields Per Unit AreaMeteorological Yields of Soybean
TemperaturePrecipitationSunshine DurationActive Accumulated TemperatureTemperaturePrecipitationSunshine DurationActive Accumulated Temperature
The Pearson Correlation Analysis0.526 *0.448 *−0.2140.515 *0.674 **0.603 *0.3260.669 **
The Grey Relation Analysis0.6580.5370.4490.6420.7760.5910.5260.757
Note: The signs of ** and * represent the significant correlation at the 0.05 and 0.01 levels, respectively.
Publisher’s Note: MDPI stays neutral with regard to jurisdictional claims in published maps and institutional affiliations.

