Article

Alkaline Direct Ethanol Fuel Cell: Effect of the Anode Flow Field Design and the Setup Parameters on Performance

Institute of Chemical Engineering and Environmental Technology, Graz University of Technology, Inffeldgasse 25/C, 8010 Graz, Austria
*
Author to whom correspondence should be addressed.
Energies 2022, 15(19), 7234; https://doi.org/10.3390/en15197234
Submission received: 13 September 2022 / Revised: 23 September 2022 / Accepted: 27 September 2022 / Published: 1 October 2022
(This article belongs to the Special Issue Fuel Cells: Latest Advances and Prospects)

Abstract

:
Alkaline direct ethanol fuel cells (DEFCs) represent an efficient energy conversion device for sustainable ethanol fuel. In this study, a design with new structural parameters for the anodic flow field of the alkaline DEFC was modeled with the aid of computational fluid dynamics and was then actually constructed. Single-cell tests were performed to evaluate the impact of the developed design on fuel cell performance. The results show that fuel cell performance significantly increased when using the improved design in the low-temperature range. The higher the temperature in the cell, the lower the influence of the flow field structure on performance. In addition, the influence of external factors, such as the orientation of the cell, the preheating of the fuel, and the direction of the two fuel flows relative to each other (co-current and counter-current), are shown.

1. Introduction

Research and development work on alkaline fuel cells (AFCs) with KOH as an electrolyte began in the early 20th century and has been pursued continuously with varying intensity ever since. The reason for this is to be found in the many advantages of the alkaline environment, such as the possible utilization of non-noble metals as co-catalysts, the improvement of the reaction kinetics, and the use of cost-efficient anion exchange membranes (AEM) [1,2,3,4,5,6,7]. In addition to hydrogen, as a well-established fuel, many other fuels are considered in alkaline fuel cells, for instance, alcohols (like methanol or ethanol) [1,2,4,5,8]. This subcategory of AFCs is termed an alkaline direct alcohol fuel cell because the alcohol is directly oxidized at the anode. In comparison to hydrogen, alcohols have a higher energy density and allow for simpler storage and transport due to their liquid state at room temperature [1,2,6,8,9,10]. The most intensively studied direct alcohol fuel cell is the direct methanol fuel cell (DMFC) [1,2,8,10,11,12,13]. However, a serious disadvantage, the high toxicity of methanol compared to ethanol, led to research on the direct ethanol fuel cell (DEFC) [1,2,4,5,6,9,10,14,15]. The additional advantages of ethanol over methanol are the higher energy density (8 kWh kg−1 vs. 6 kWh kg−1), the increased boiling point, and the lower susceptibility to crossover due to the larger molecule size. Furthermore, ethanol is considered a CO2-neutral fuel, as it is produced from renewable resources through fermentation [1,2,4,5,6,9,10,14]. In the alkaline DEFC, ethanol is oxidized (1) in presence of OH ions at the anode to CO2, H2O, and e (in case of complete oxidation). At the cathode (2), the electrons (migrated from the anode via an external circuit) and H2O are used to reduce O2 to the desired OH ions. These generated ions migrate cross the membrane to the anode and the electro-osmotic drag is counter to the crossover of ethanol and, as a result, the crossover is thereby reduced. The total theoretical reaction results in the production of CO2 and water with a theoretical voltage of 1.14 V (3) [1,6].
C H 3 C H 2 O H + 12   O H   2   C O 2 + 9   H 2 O + 12   e ,   E a 0 = 0.74   V
3   O 2 + 6   H 2 O + 12   e 12   O H ,   E c 0 = 0.40   V
C H 3 C H 2 O H + 3   O 2   2   C O 2 + 3   H 2 O ,   E 0 = 1.14   V
The sluggish anode ethanol electro-oxidation kinetics (C-C bond breaking problems) at temperatures below 120 °C lead to undesirable intermediate products (acetic acid/acetate and acetaldehyde), for which no further oxidation is possible in the potential range used in the cell [6,9,10]. The percentage of completed oxidation reactions is thus lower than 100% and full performance cannot be achieved [1,6,16]. Apart from the still outstanding problem of producing a catalyst that contributes to complete oxidation, other challenges include the improvement of the membrane, the ionomer, the water transport management, the electrolyte (carbonation issues), and especially the ethanol transport management [6]. In the transport management of ethanol, transport phenomena occur through the individual layers of the anode (diffusion and catalyst layer) and also through the membrane [7,14,17,18,19]; this is affected by the flow rates since if the available ethanol quantity is too low for the reaction, the result is reduced performance and furthermore a power loss also occurs when there is an excessive ethanol quantity due to a reduction in the reaction sides that are occupied and an increase in the ethanol crossover can be noticed [7,14,15,17,20]; the most important factor is the major role played by the flow fields [6,8,21,22,23]. Flow fields are, therefore, one of the major components of a fuel cell. They serve as current collectors, reactant distributors, and product transporters simultaneously. The important characteristics of flow fields are (i) the provision of a uniform distribution of reactants, (ii) effective removal of products, (iii) structural support for the membrane electrode assembly (MEA), (iv) contribution to heat and water management, (v) electronic conduction and (vi) a non-permeability to reactants, and products for safe operation [8,10,24,25,26,27]. There are already many studies on the optimal design of flow fields for the well-established polymer electrolyte fuel cell (PEMFC), for the (mostly acidic) DMFC, and some modeling studies for the acidic DEFC, but nearly no studies on the anode flow field for the alkaline DEFC. All of these studies focus on the development of different flow field structures and shapes (serpentine, parallel, grid, pattern, interdigitated, and bio-inspired) with modifications in channel length, width, and height (open ratio) to reach an even flow distribution, with an increased under rib-transport and a minimal pressure drop (function of channel length, hydraulic diameter, and flow rate) [4,8,10,11,12,21,22,23,25,26,27,28,29,30,31,32,33,34,35,36,37,38,39,40,41,42,43,44,45,46,47,48,49,50,51,52,53,54,55,56,57,58,59,60,61,62]. Table 1 shows an overview of experimental and model studies on the different design parameters in anode flow field designs for DMFCs [11,46,47,48,51,53,55,56,57,58].
Research on a flow field design for alkaline DEFCs is needed since the properties of an alkaline DEFC differ in important aspects from a PEMFC, with this involving a gaseous fuel, or DMFC, which mainly generates gaseous reaction products in the form of CO2 (two phase flow) [8,11,12,13,24,26,27,30,31,32,33,34,35,36,37,40,41,42,43,44,45,46,47,48,49,50,51,52,53,54,55,56,57,58,59,60,61,62]. Besides improving the flow field, external components (e.g., pump, tank, and heating systems) are important factors for an increase in performance, which should not be neglected [6,8,16,20].
The aim of this work was to design and evaluate a flow field with new and improved structural parameters for the anode side of an alkaline DEFC. Data (experimental and modeling/ simulation) from the literature for other fuel cell types (PEMFC [24,32], DMFC [31,53,58], and acidic DEFC [23]) were used to develop the design, and simulations of the new design were created. An evaluation of the improvement was made by comparing it with the flow field already used in previous works [63,64,65]. The impact of the two different flow field structures on the fluid distribution and the pressure drop was shown. In addition, the orientation effect of the cell, the influence of preheating the fuel, and the influence of the direction of the fuel flows to each other on cell performance was determined. The optimization achieved great success since the developed flow field design for the alkaline DEFCs clearly outperformed the previously used one in the low-temperature range.

2. Materials and Methods

2.1. Chemicals and Materials

The following materials and chemicals were utilized for the MEA production and the single-cell tests: ethanol (EtOH, 99.9% p.a., Carl Roth (Karlsruhe, Germany)), 2-propanol (Isopropanol, 99.9% p.a., Carl Roth (Karlsruhe, Germany)), potassium hydroxide (≥85%, p.a., pellets, Carl Roth (Karlsruhe, Germany)), fumasep® FAA-3-50 (anion-exchange membrane, non-reinforced, fuel cell store (USA)), fumion® FAA-3 solution (10 wt.% in NMP, fuel cell store (USA)), commercial PtRu/C (HiSPEC 10000, Platinum, nominally 40%, Ruthenium, nominally 20% on carbon black, Johnson Matthey (London, UK)), PdNiBi/C catalyst [66], carbon cloth (ELAT—Hydrophilic Plain Cloth, 0.406 mm thick, fuel cell store, (USA)), carbon paper (Sigracet 29 BC, 0.235 mm thick, fuel cell store (USA)).

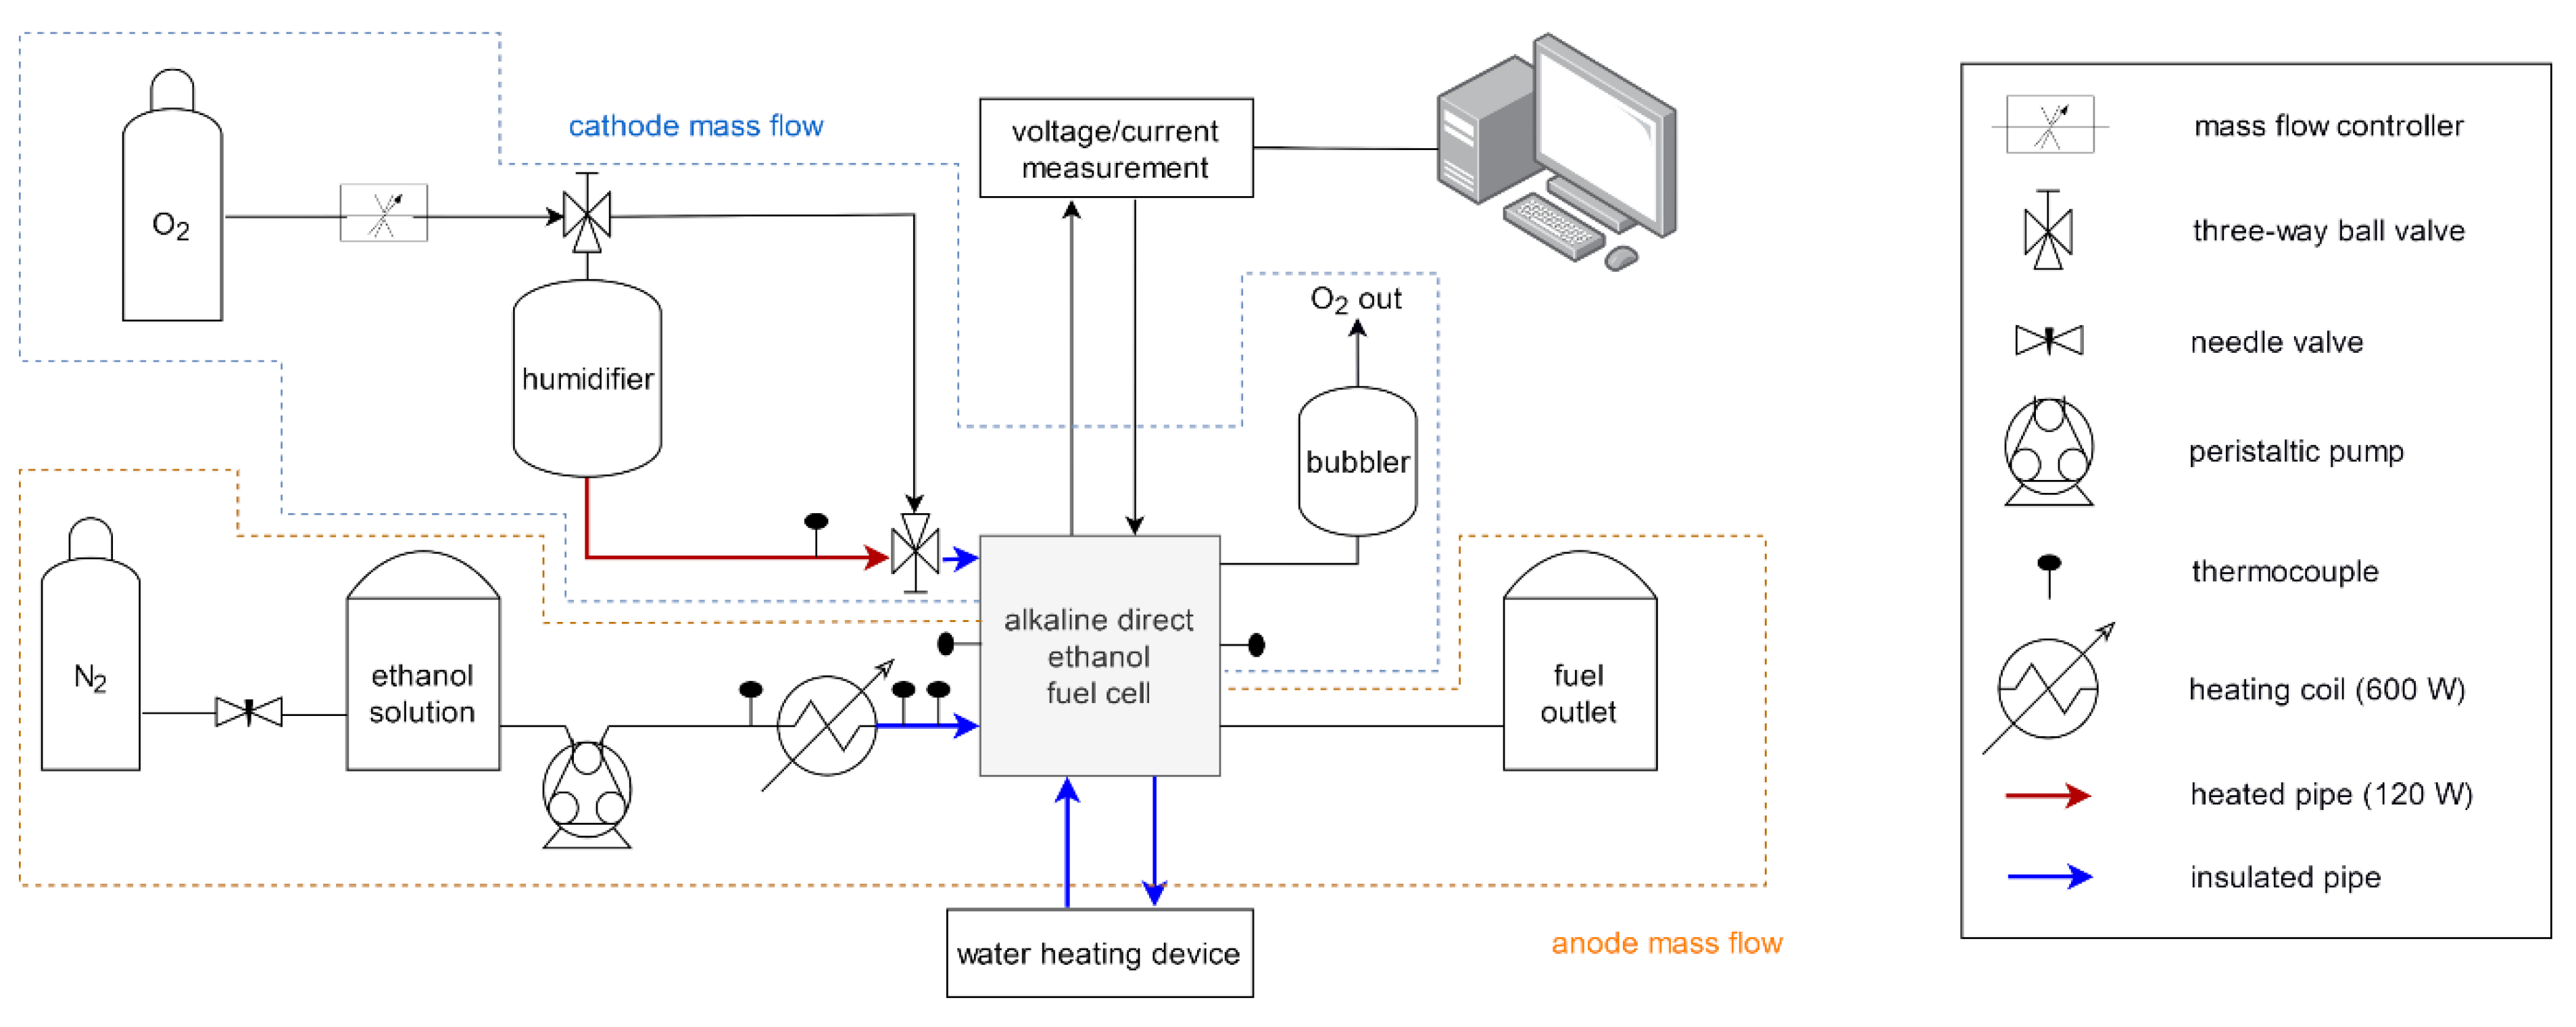
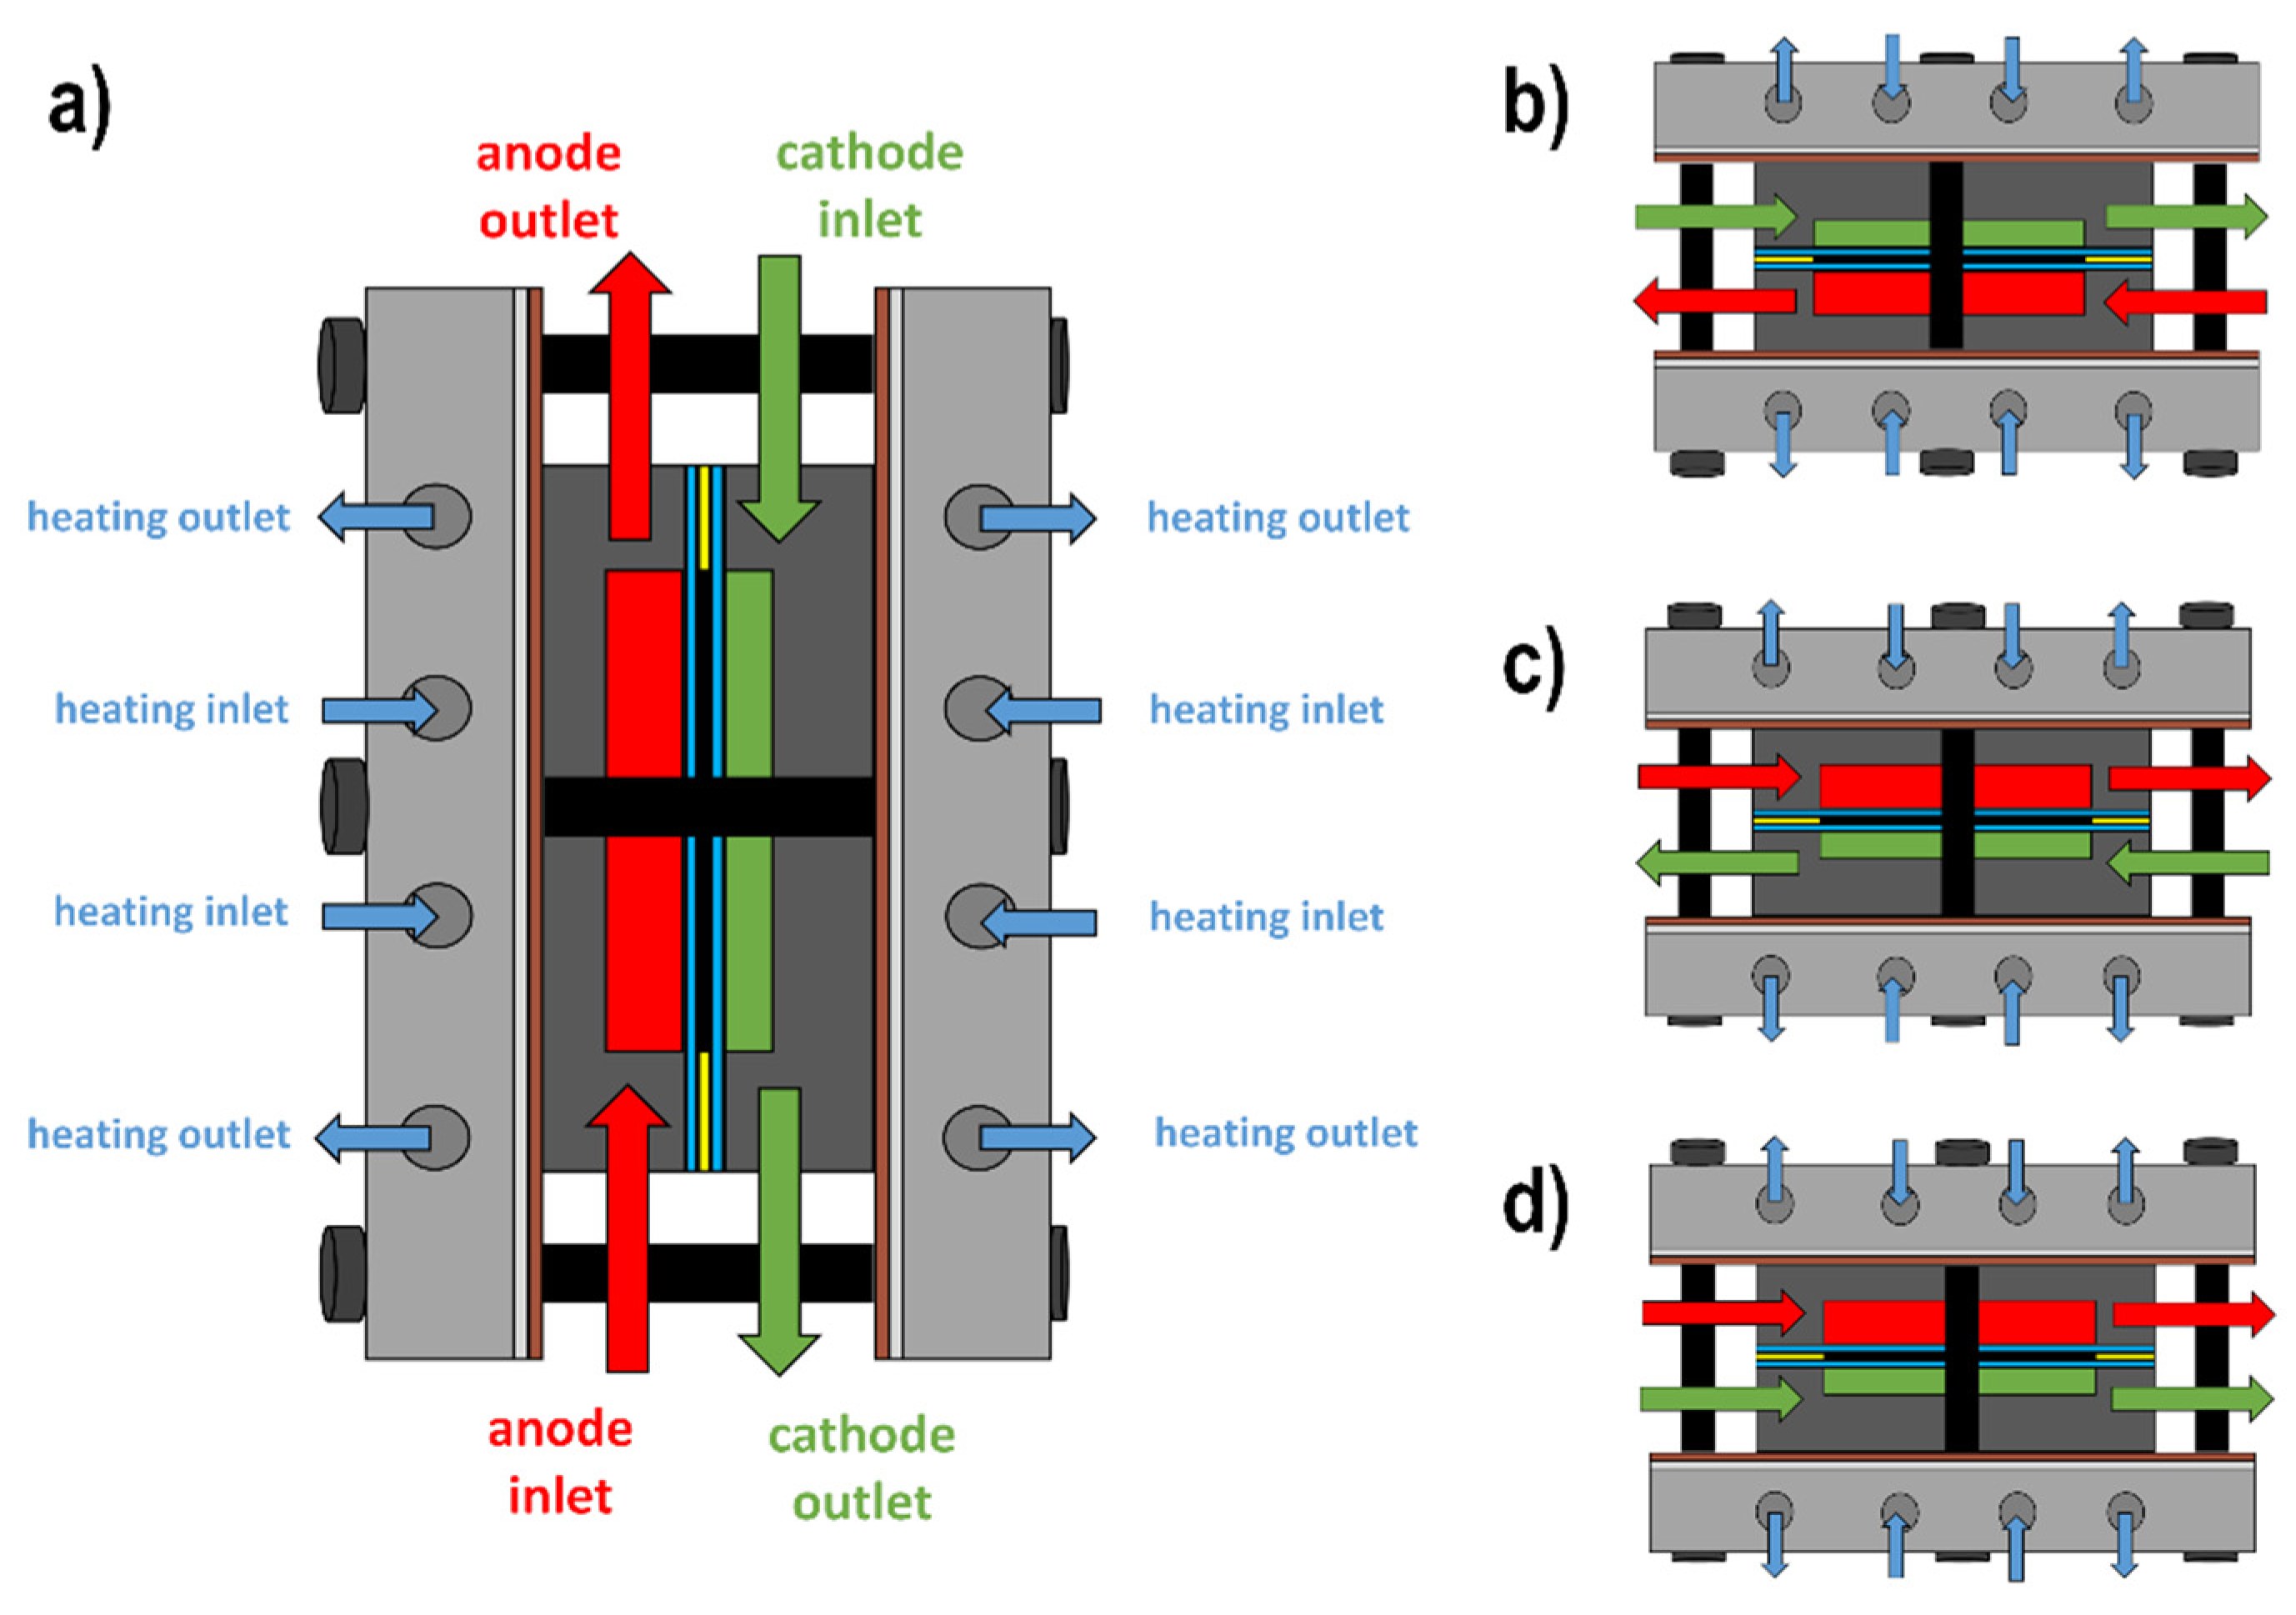
2.2. Testrig and Fuel Cell
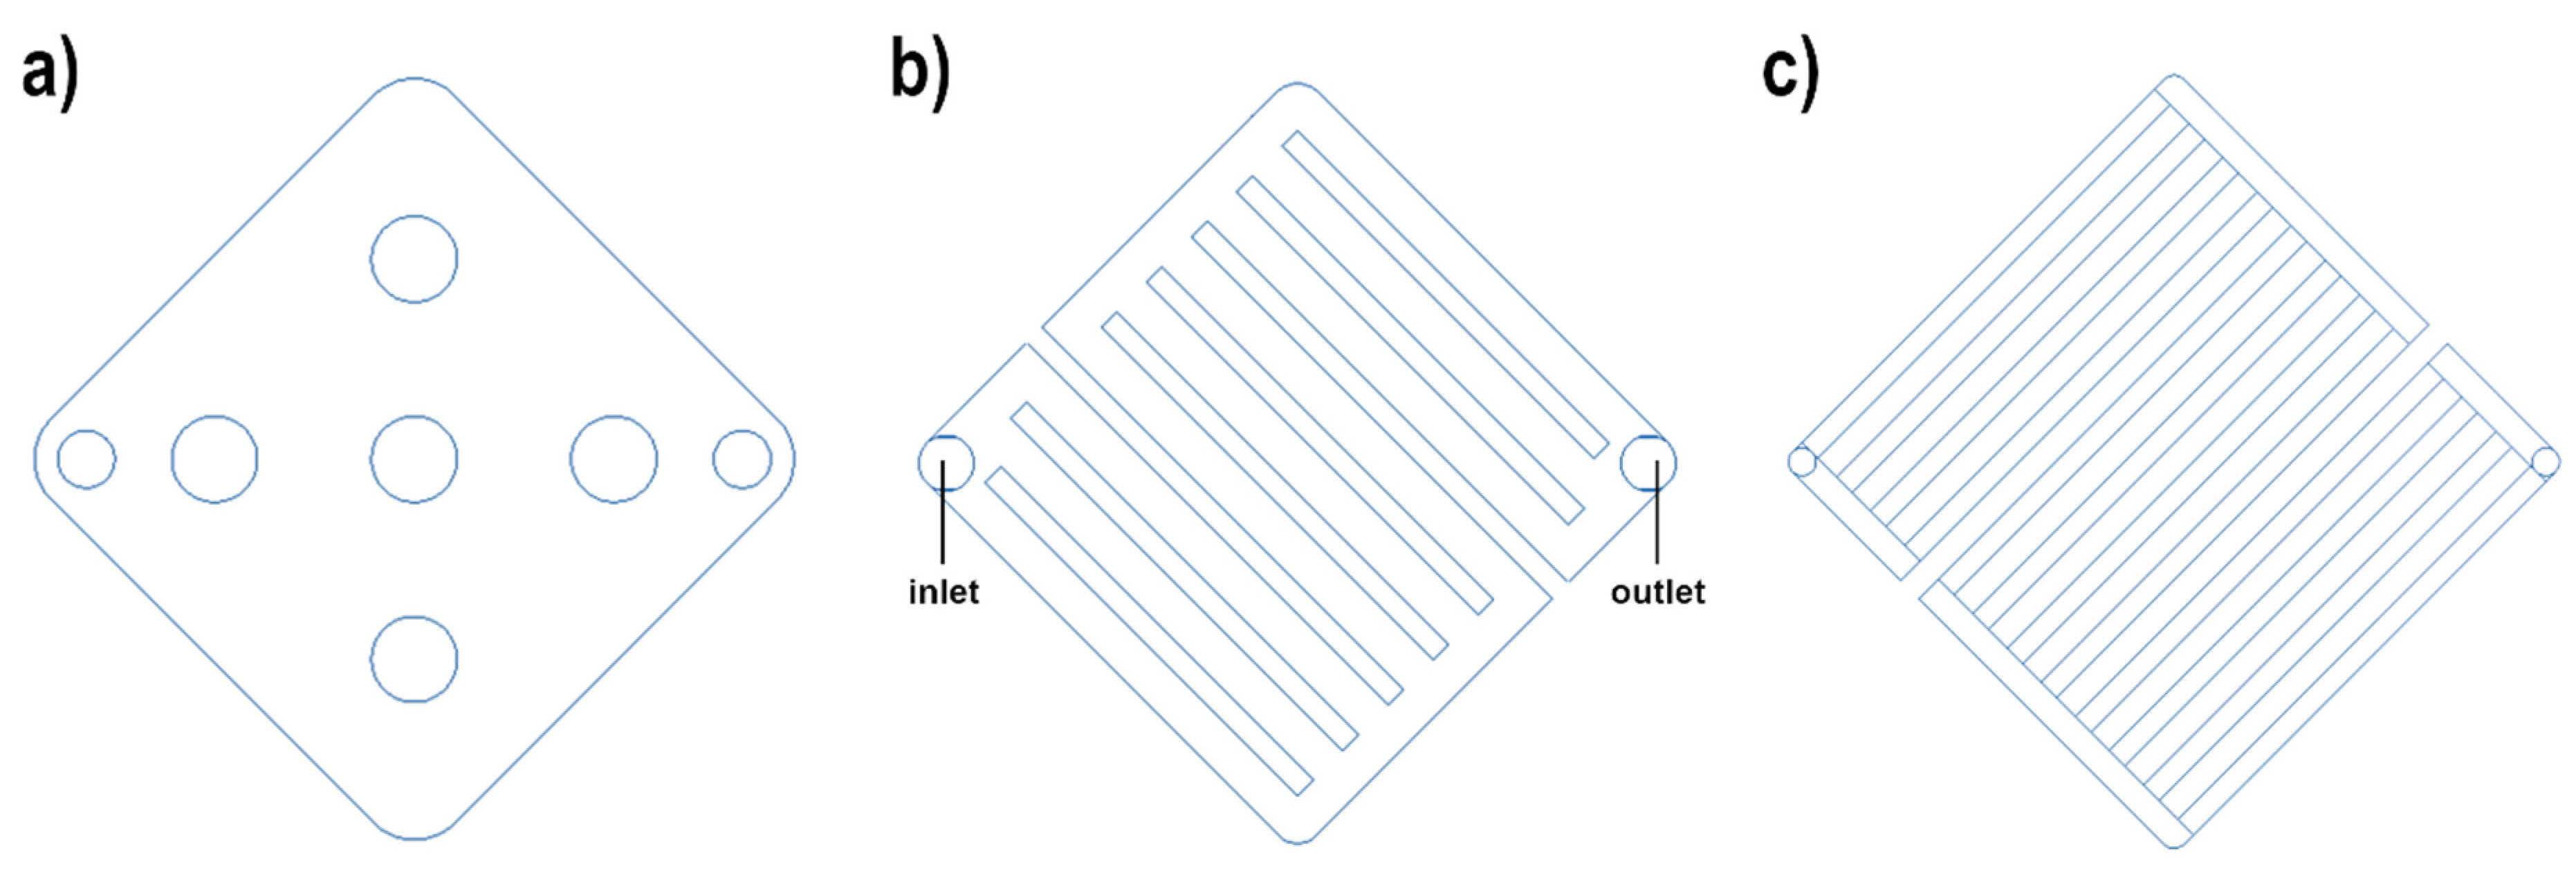
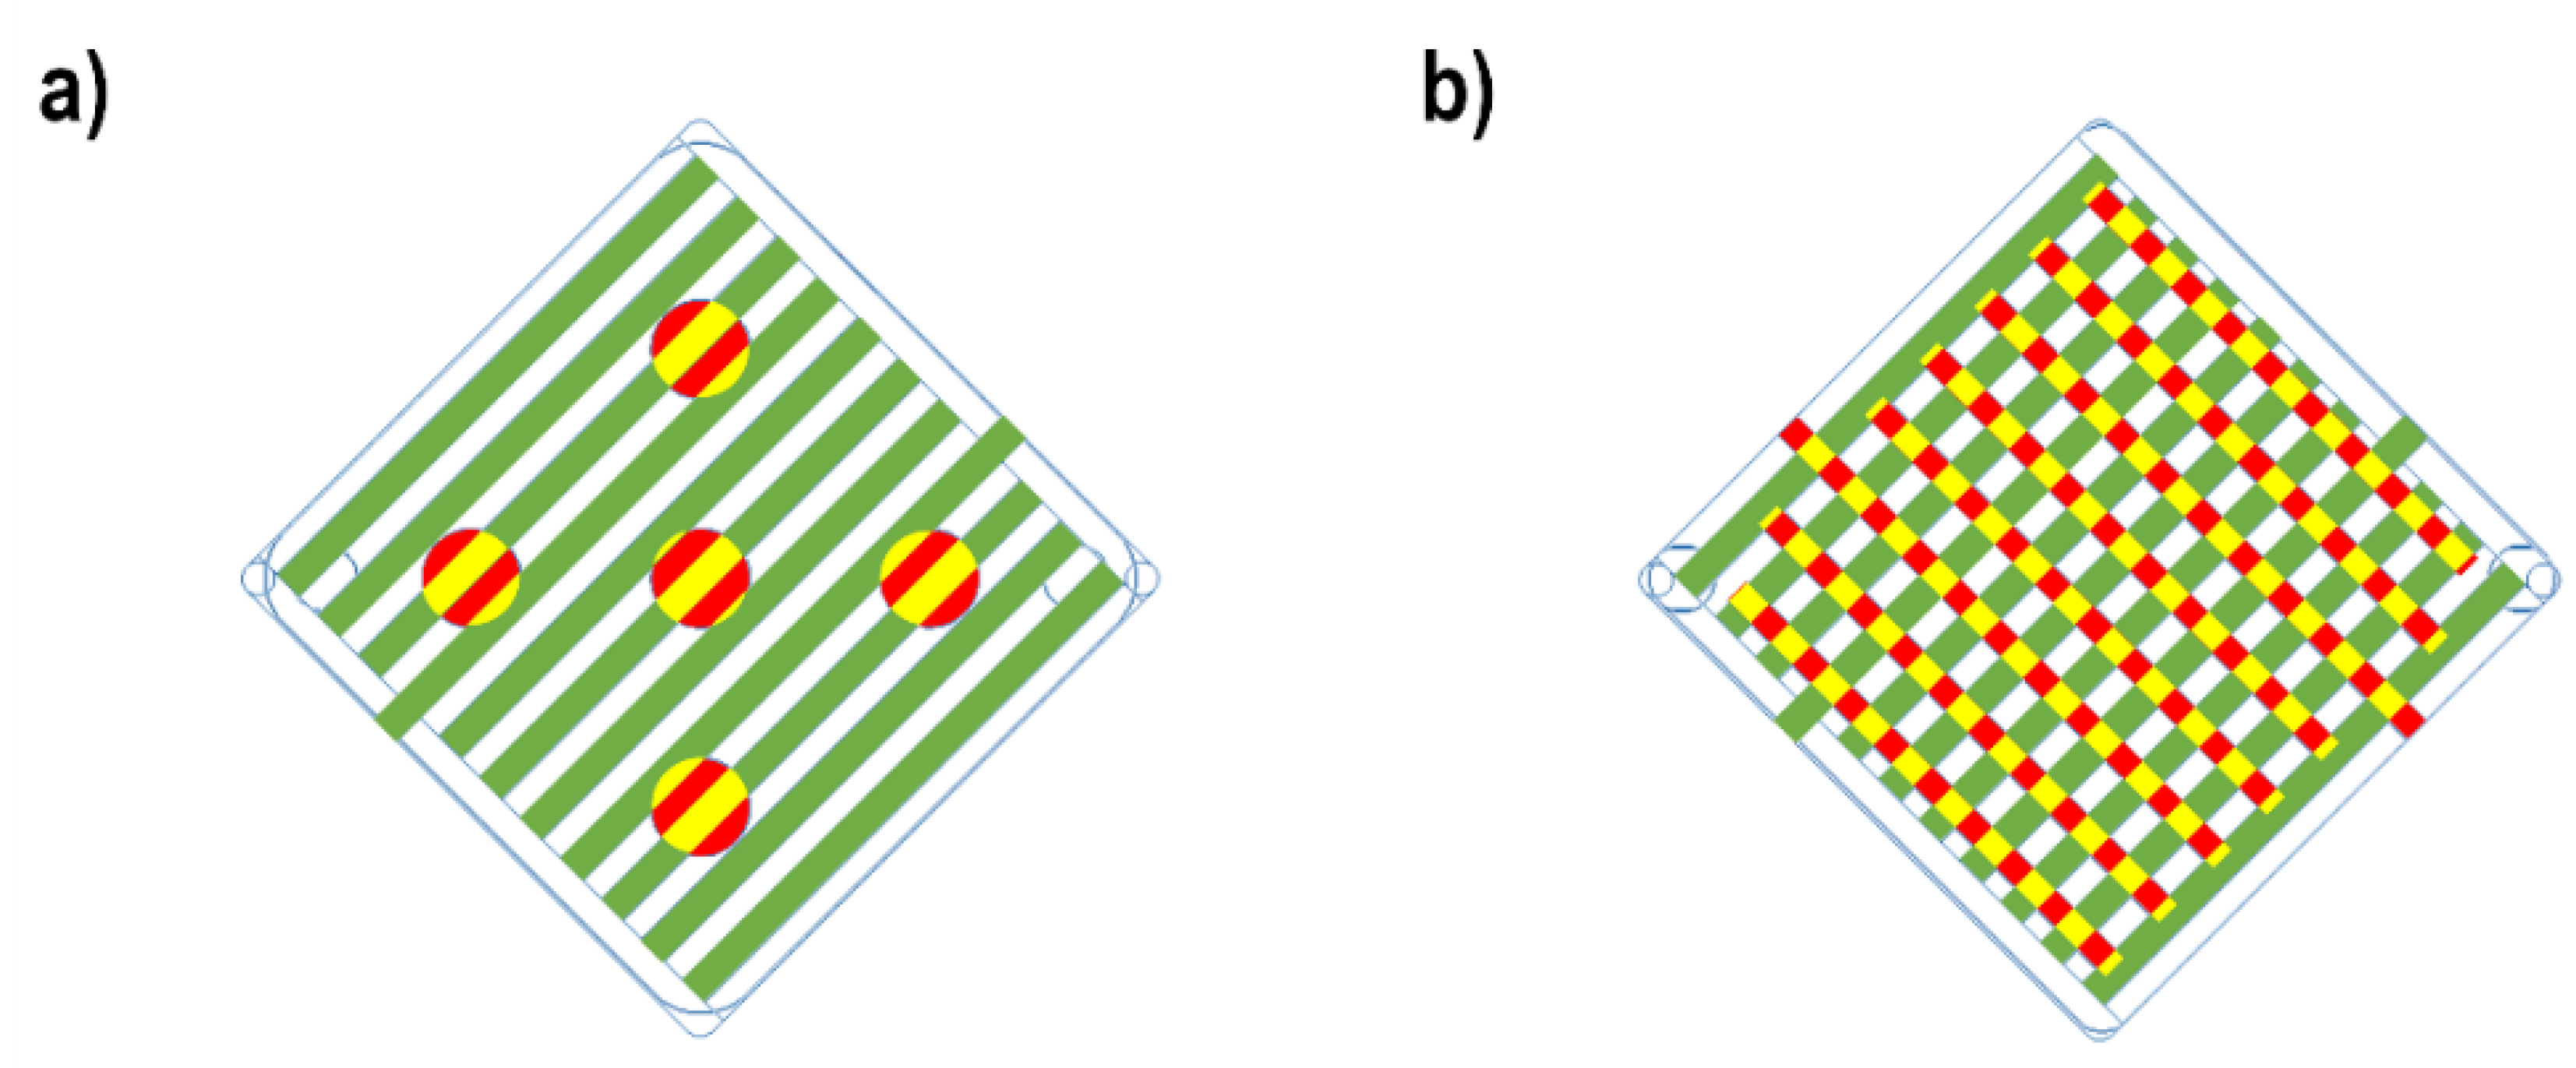
For the evaluation of the influence of the flow field on performance, an alkaline DEFC test rig (Figure 1) was utilized. It comprises an oxygen gas handling system, an ethanol solution heating system, and electronic devices. This experimental test station, therefore, provides control over the cell operating temperature (+ for anode and cathode individually), the ethanol fuel solution temperature, the flow rates for the anodic and cathodic side, and the option to humidify the oxygen gas to the desired value. The feed line of the anodic fuel flow consists of a unit for the inertisation of the ethanol solution with nitrogen (to avoid the introduction of oxygen at the anode), a peristaltic pump that can deliver at flow rates of between 0.03 and 45 mL min−1, and a heating unit consisting of a spiraled pipe coiled with a heating cable (600 W) and insulation to reach temperatures up to more than 80 °C. For temperature monitoring, thermocouples are installed at the inlet, outlet, and in the center of the spiral. The KOH and ethanol mixture is pumped through this heating unit and is thus heated to the desired temperature. The cathode mass flow can be regulated to a maximum of 200 mL min−1 and monitored by a mass flow controller (MFC). The oxygen can be used dry or humidified; for this purpose, a humidifier and a heating hose with temperature control and insulation (120 W, max. 200 °C) were installed in the setup. The insulation prevents the cooling or condensation in both the anodic and cathodic mass flow in the pipes.
The fuel cell consists of two stainless-steel endplates with channels for water heating, two copper current collector plates (with a Teflon isolation layer between the endplate and current collector plate), two graphite flow field plates, and the sealing and the membrane electrode assembly. Different orientations of the fuel cell, shown in Figure 2 (vertical, horizontal (anode up), horizontal (cathode up)), were tested.

2.3. Flow Field

The flow fields are fabricated by milling the desired geometric structure in the bipolar graphite plates. A thermocouple (1 mm below the flow field) was also incorporated into the flow field plate to measure the temperature as accurately as possible. The flow field plates used in this work for the anode and the cathode are shown in Figure 3, and the dimensions are listed in Table 2.
The flow field, which was already used in previous studies [64,65] and first described by Grimmer et al. [63] for the anode of direct borohydride fuel cells, shows a pin (P) structure. In this flow field (2 cm × 2 cm), five contact points (diameter: 3 mm) towards the MEA are present. The channel depth is 2.4 mm, and the calculated open area is 350.9 mm2. The developed flow field with new and improved structural parameters (which was designed on the basis of the literature data from PEMFCs [24,32], DMFCs [31,53,58], and acidic DEFCs [23]) with the same overall size, as shown in Figure 3, has a three meander parallel (3 MP) flow channel structure. The channel depth is the same, while the channel width is 1.5 mm. The open area is 283.3 mm2 and is, therefore, smaller in comparison to the pin structure. Additionally, the open ratio (ratio of the portion of MEA which is exposed to fuel to total MEA size) was decreased from 87.7% to 70.8%. At the same time, the contact points to the anode gas diffusion layer (GDL) are better connected and distributed over the whole MEA area.
The structure of the cathode flow field (four meander parallel structure (4 MP)) shows similarities to the new anodic flow field and has not been changed or varied since the focus in this work is on the anode flow field and the homogeneous distribution of the ethanol fuel.

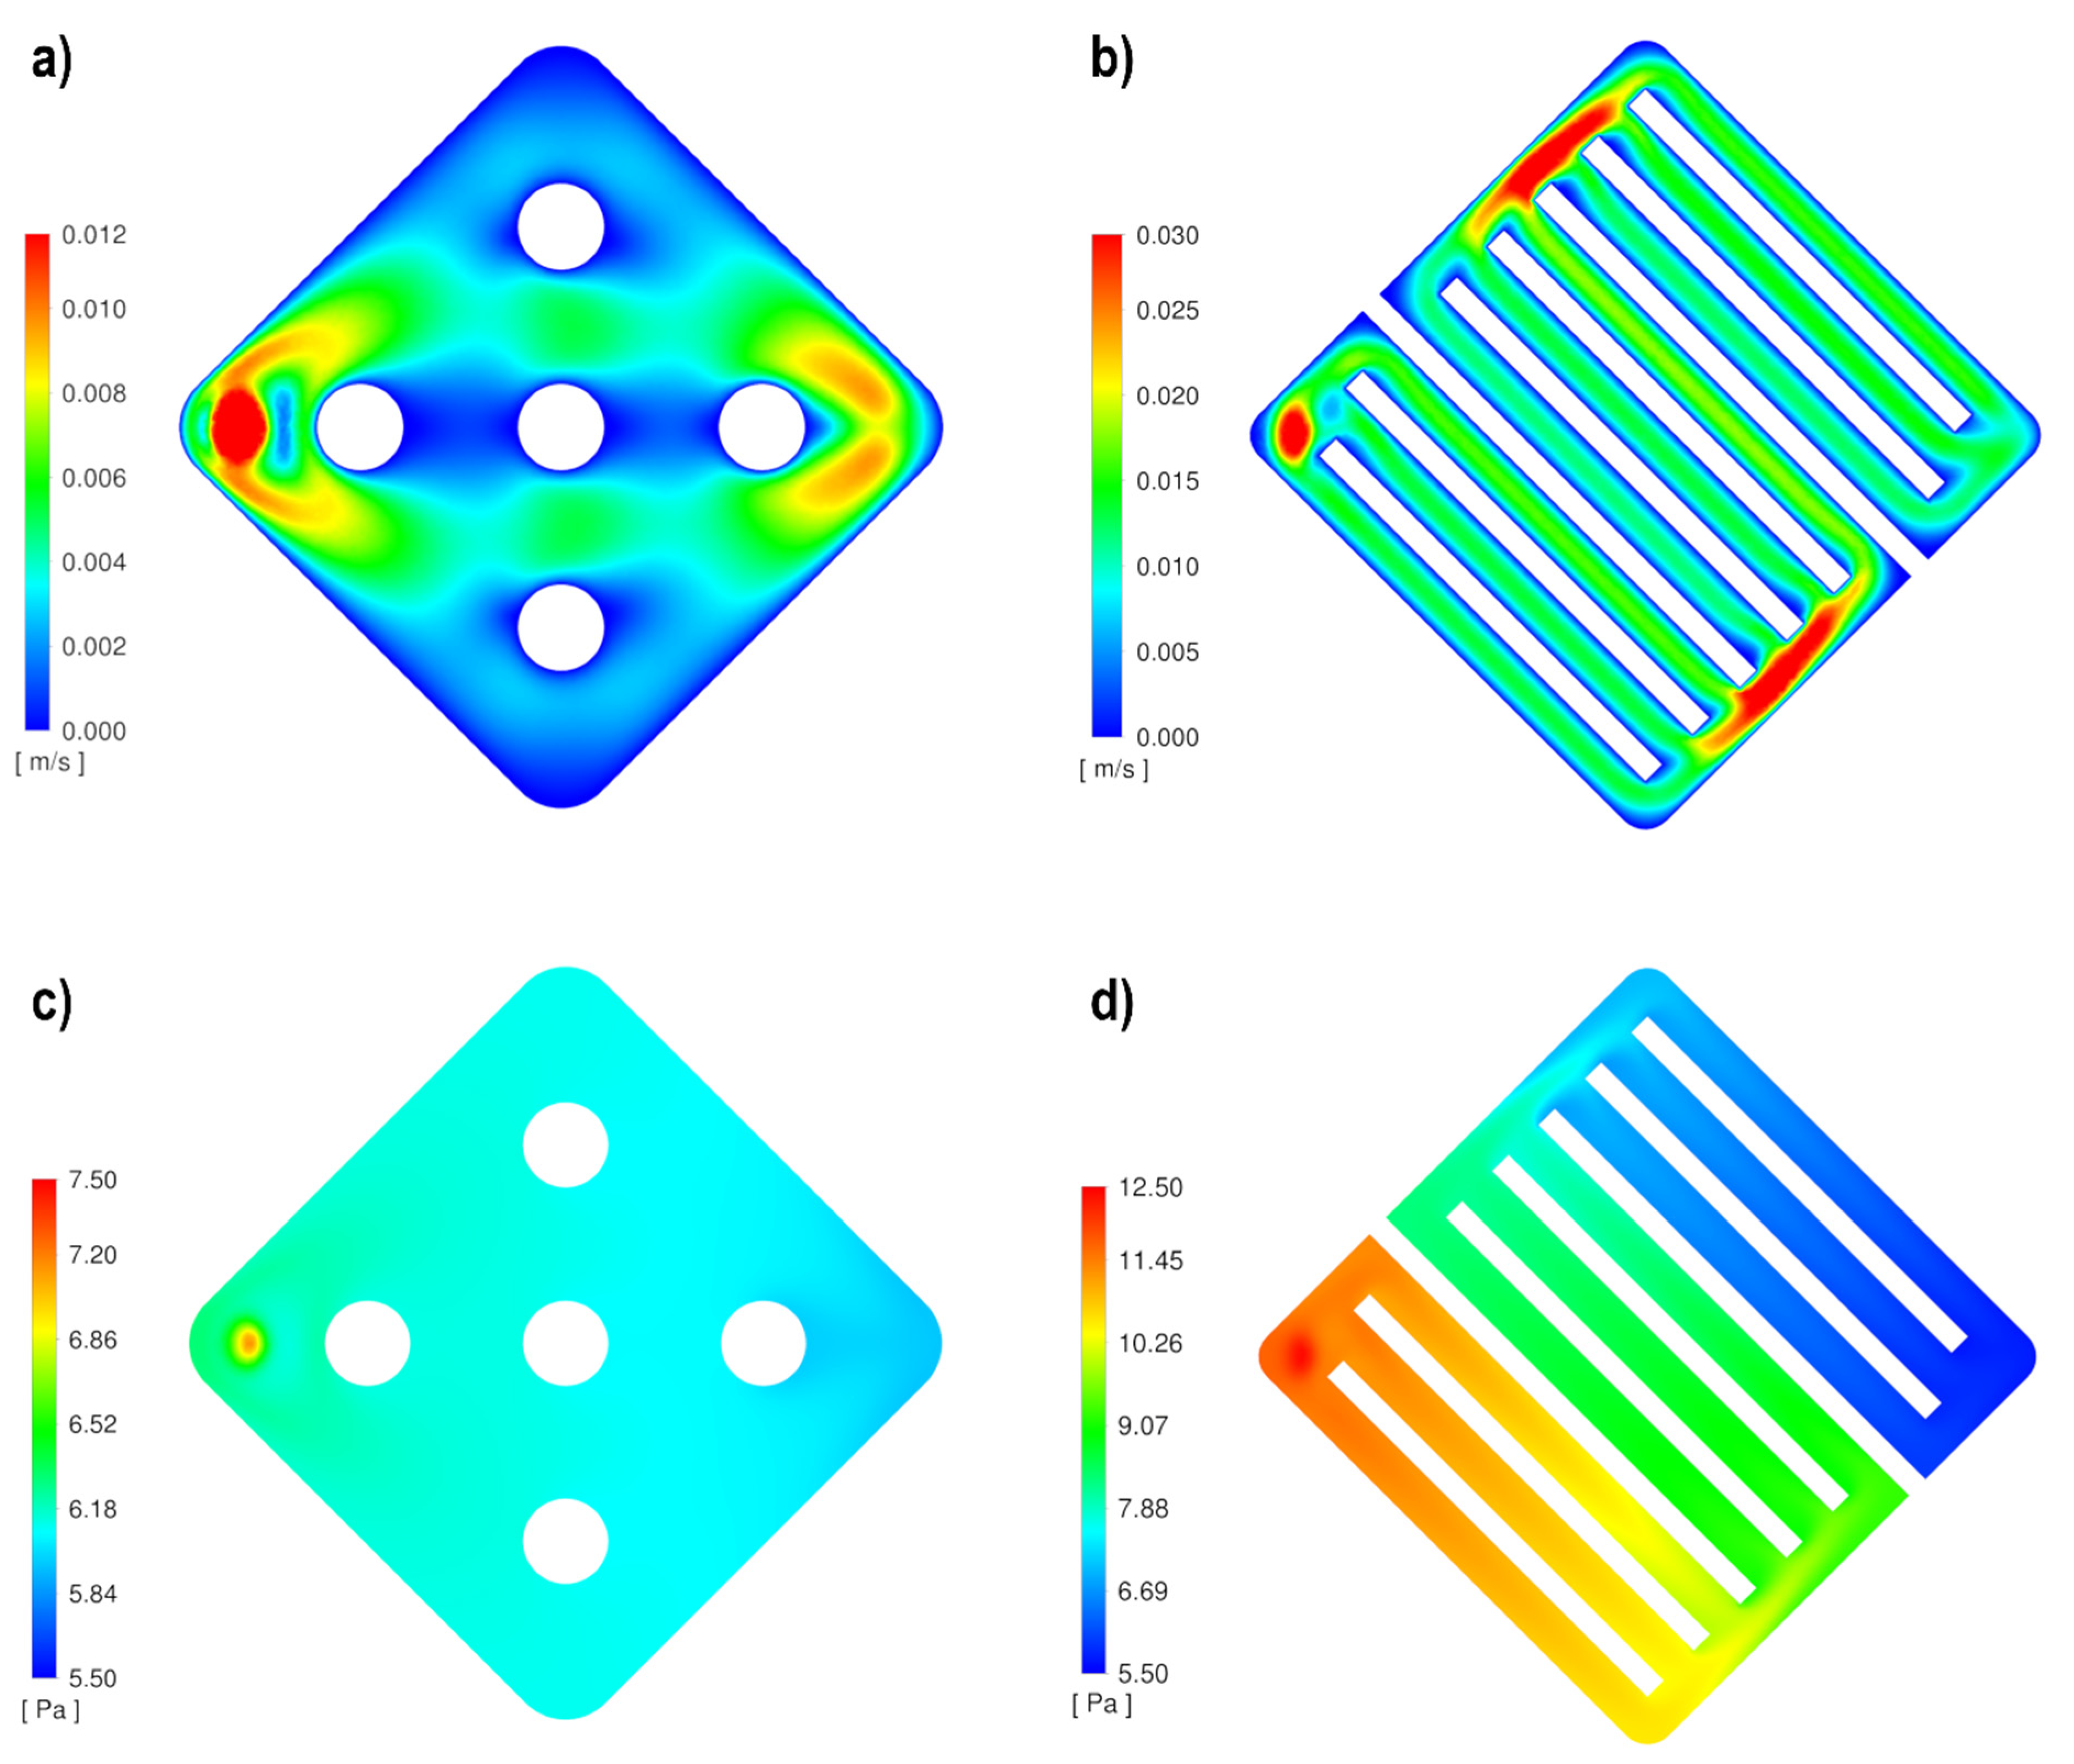
2.4. Computational Fluid Dynamics Simulation

Computational fluid dynamics (CFD) simulation was applied to investigate both the anodic flow fields and the flow behavior of the ethanol fuel and electrolyte mixture within them. Both the P-type and the 3 MP-type anode flow field were modeled by means of computer-aided design (CAD) and simulated using the same boundary conditions. The following parameters and boundary conditions were set: the simulated flowing fuel and electrolyte mixture consisted of 1 M KOH and 1 M EtOH, as in the experiments; thus, 5.4 wt.% KOH, 4.4 wt.% EtOH, and 90.2 wt.% H2O. The fuel rate was set to 5 mL min−1. Due to the low fuel rate, a laminar flow behavior within the cell is assumed. The simulations were performed at ambient pressure, temperature, and gravitational force. The obtained images are presented in this manuscript in the results section. All simulations were carried out with the software tool ANSYS Fluent (Ansys, Inc., Canonsburg, PA, USA).

2.5. Single Cell Tests

2.5.1. Membrane Electrode Assembly Production

Membrane electrode assemblies (MEAs) were made from the fumasep® membrane, the commercial PtRu/C catalyst (cathode), and the PdNiBi/C catalyst [66] (anode). The membrane was first activated by placing it in 1 M KOH for 24 h and then rinsing it with ultrapure water. The electrodes were fabricated as follows: the catalyst powder was processed into an ink by dispersion in isopropanol and water (7:3), and the addition of the ion-exchange ionomer, and sprayed onto the gas diffusion layers (carbon paper for the cathode and carbon cloth for the anode) by means of an ultrasonic spraycoater (Sonotech ExactaCoat OP3 from SonoTek Corporation, Milton, NY, USA). The production of the electrodes with the spraycoater was selected, as the use of this device can ensure even distribution and thus that all the electrodes produced are comparable. The electrodes and the pre-treated membrane were assembled together and installed in the previously described cell.

2.5.2. Polarization Measurements

All tests described were conducted with both flow fields by using an anode fuel mixture of 1 M KOH and 1 M EtOH solution (5 mL min−1) and dry or humidified oxygen gas (25 mL min−1) for the cathode mass flow. The different orientations (Figure 2) on the fuel cell measurement were tested at RT (condition I). The effect of fuel preheating was verified at 60 °C (condition II a and b). Additionally, the influence of the direction of the two reactant flows on each other was tested at 80 °C (condition III). A Zahner IM6ex potentiostat (Zahner-elektrik GmbH & Co., KG, Kronach-Gundelsdorf, Germany) was used for the control of the potential (V) and the current (I) to record the I–V curves and to calculate the power (P) for the P-I curves. The current was increased stepwise (starting with small steps in the high potential region and getting larger for the ohmic region of the polarization curve), and was held for 30 s to measure the corresponding cell voltage.

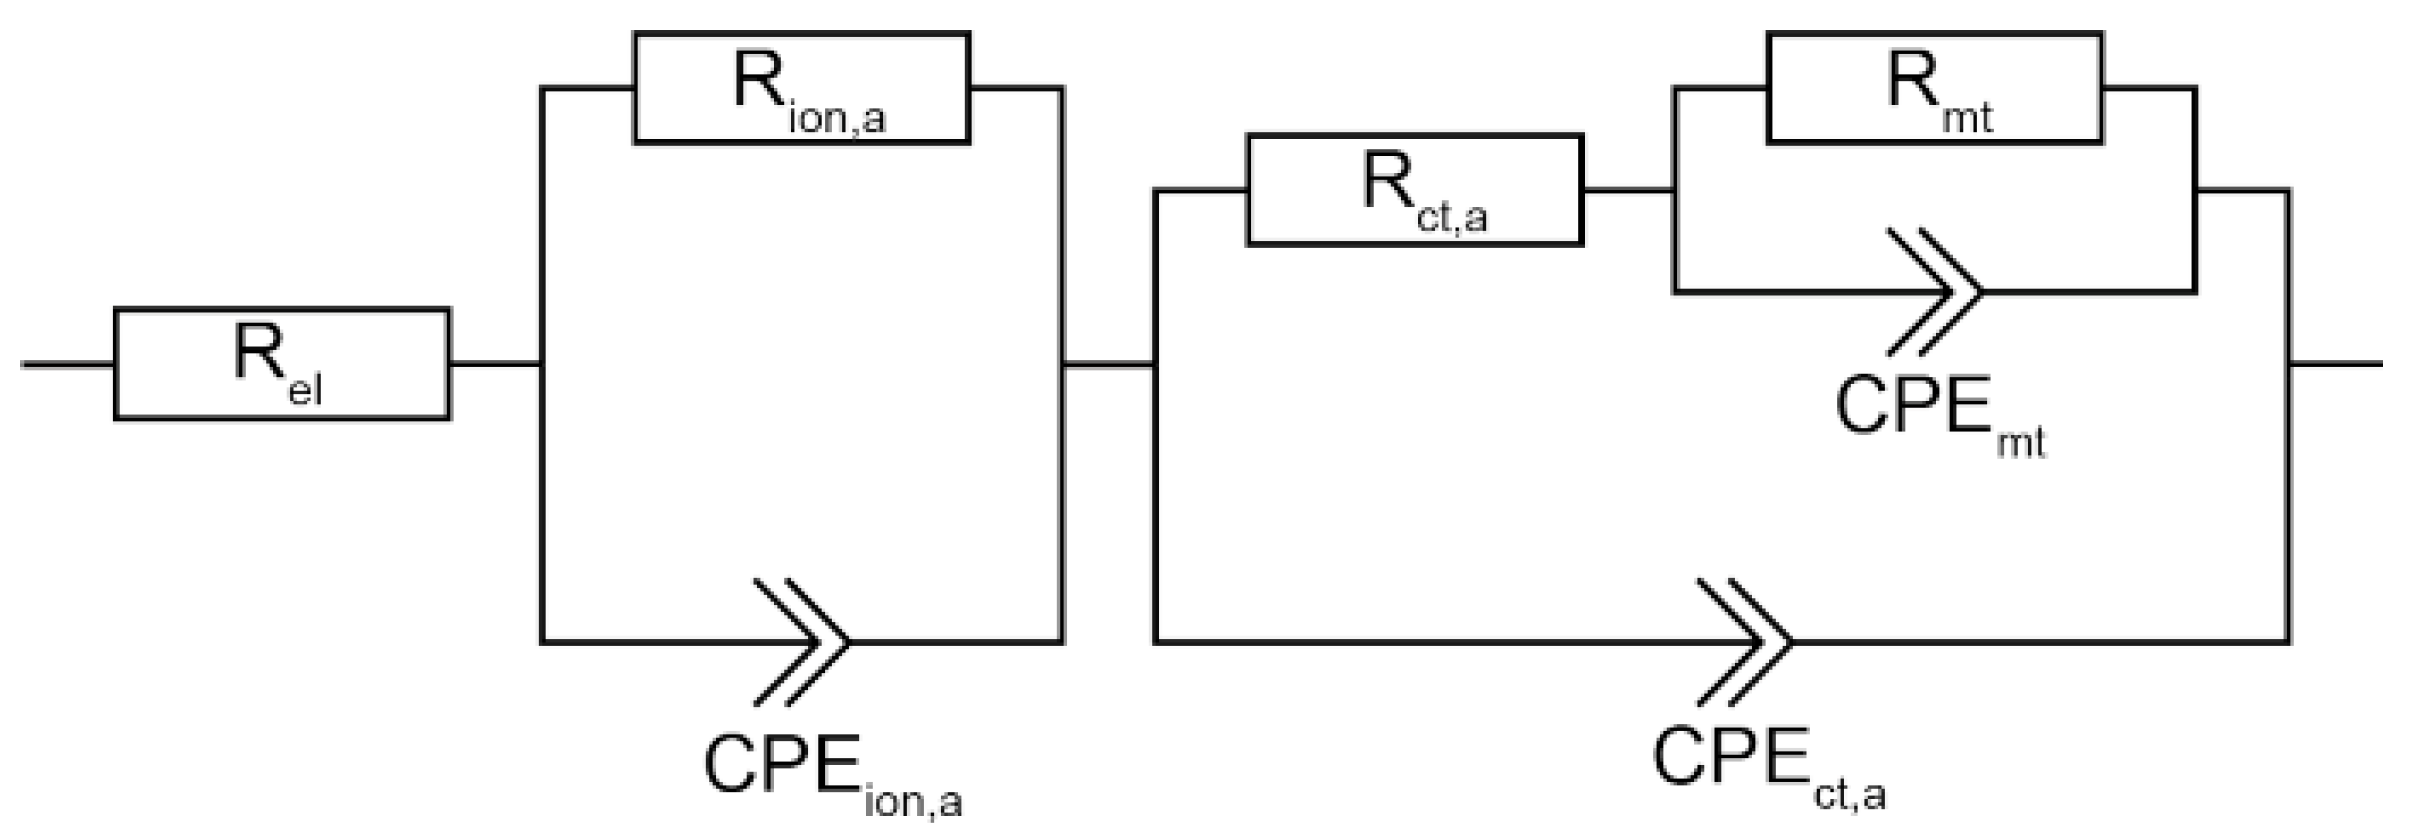
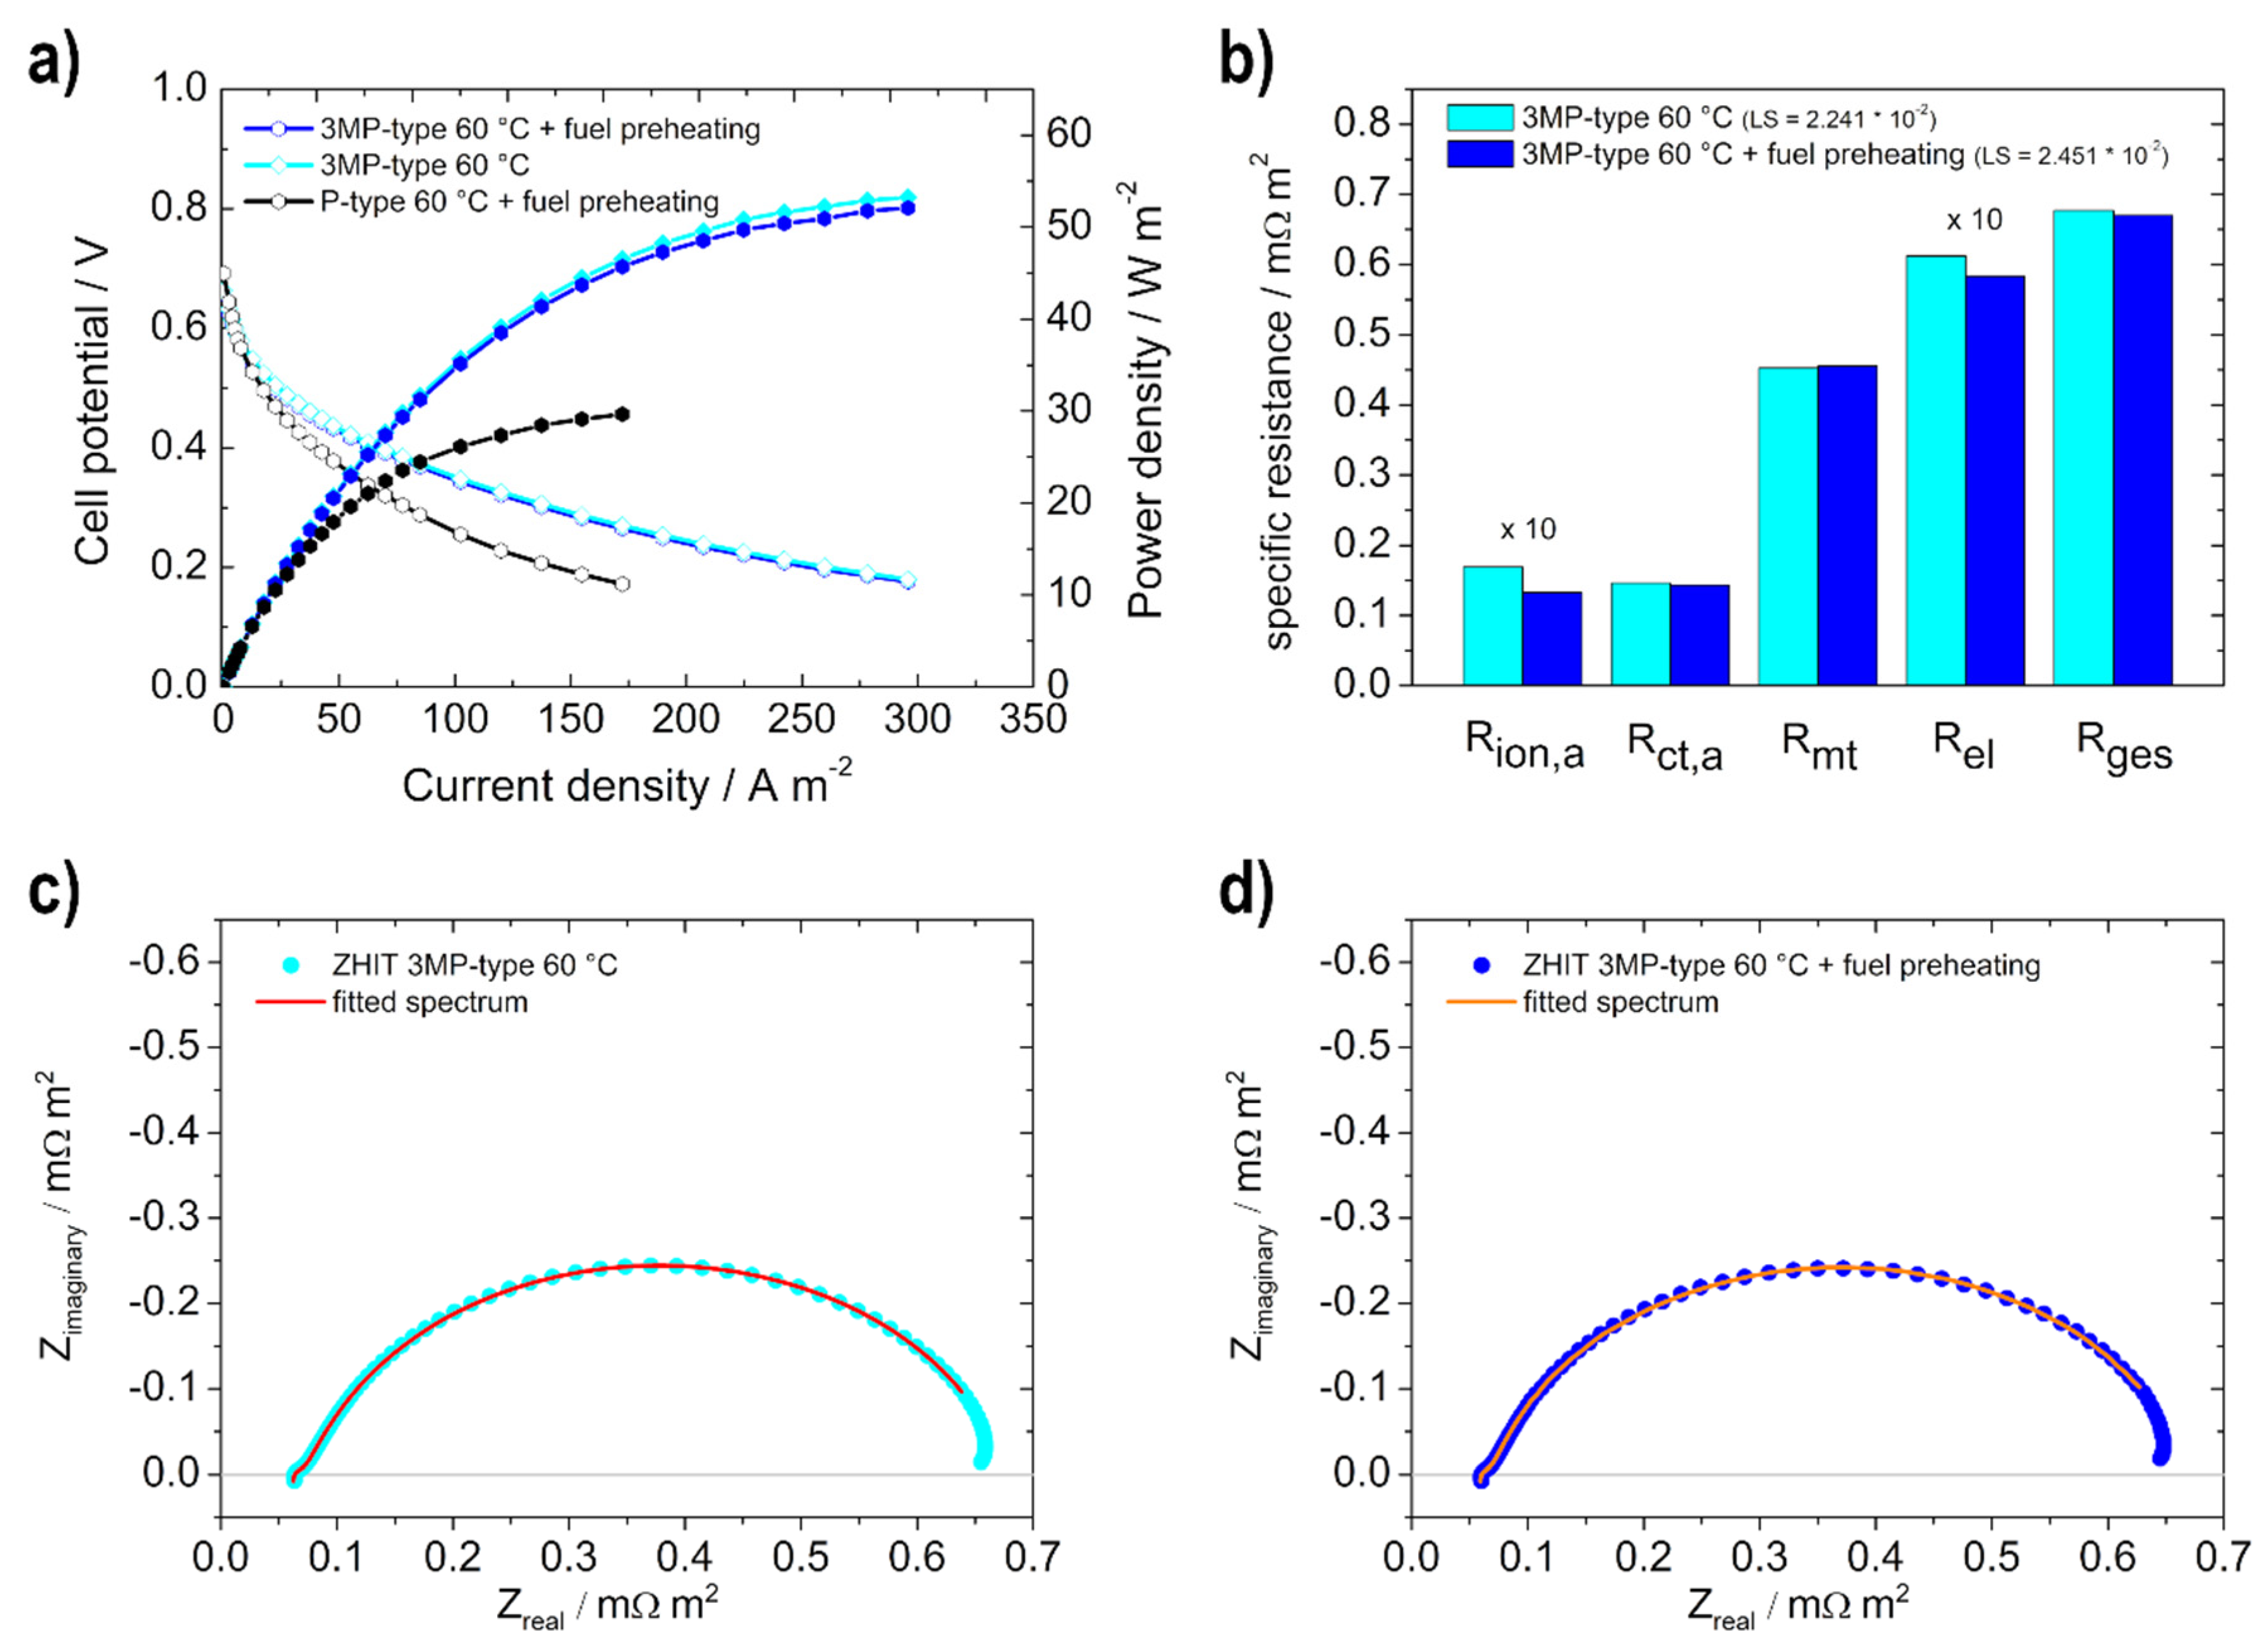
2.5.3. Electrochemical Impedance Spectra

The operating conditions for recording the electrochemical impedance spectra (EIS) measurements were the same as described for conditions II a and b. To ensure a steady state during each measurement, it was allowed to stabilize for 5 min. The recording was performed between 50 kHz and 0.1 Hz at 118 mA with a 10% amplitude for the operating point. ZView® software (Scribner Associates Inc., Southern Pines, NC, USA) was used for evaluation and fitting. The equivalent circuit model used for the evaluation is shown in Figure 4 (CPE = constant phase element).

3. Results and Discussion

3.1. Computational Fluid Dynamics Simulation

The main task of the flow field in the fuel cell is to ensure a uniform fuel supply. The nature of this structure also has an influence on the pressure drop and the under-rib transport [11,12,25,26,30,41,43,45,53,60]. In order to develop a flow field design with new structural parameters for the alkaline DEFC, simulation models and data from the literature were used to obtain the most suitable structure. This was designed based on the findings from these studies: [23,24,31,32,53,58]. The mixture of a parallel and serpentine configuration to obtain the 3 MP-structure was chosen to combine the contrary benefits of the two different types, which, for the serpentine, are, for example, a high rate of under-rib convection due to the large pressure drop, and for the parallel form, a low-pressure drop. By combining the two types, disadvantages, such as the misdistribution of reactants in the central channels in the parallel or the reduction of reactant depletion along the channel in the serpentine flow field, can be reduced [53].
The channel width and channel depth used in this study for the 3 MP-type were both selected in a comparable range, according to Oliveira et al. [57], who also determined that the mixed parallel and serpentine flow fields had a positive impact at a low methanol flow rate, concentration, and temperature. In addition, the ratio between channel length and the open ratio plays an important role, as determined by Deng et al. [11]. In the 3 MP-type, the rib width in relation to the channel width was chosen to be a ratio of 2:1, which was shown to be optimal by Park et al. [47]. Moreover, the performance (by using too narrow channels) was also lower, as characterized by Lu et al. [56]. The mentioned features led to the development of the 3 MP-type flow field shown in this study. As can be seen in Figure 5b, a homogeneous flow distribution can clearly be achieved. However, the fastest velocities occur in the channel bends because the channel width or volume has been kept the same as in the individual channels. These areas cause products to be easily removed. The velocity (in the parallel channels) of a set with respect to each other is not equal but is highest in the last of the three, which can lead to an uneven distribution of the reactants. A major advantage of this flow field type is that there are few stagnant areas in the corners of the curves.
In comparison, the P-structure (Figure 5a) shows the clear disadvantage of very poor reactant distribution since the flow is mainly from the inlet to the outlet, and therefore the corners of the MEA perform poorly [53]. In addition, the pins, which are located in the direct line between the inlet and outlet, cause zones where the flow nearly stagnates. Considered in its entirety, the flow velocity in the flow field is also lower. These facts lead to poorer transport of the educts, as well as the products. In the areas where there is almost no flow velocity, the products and reactants can accumulate and contribute to poorer cell performance.
This is also reflected in the pressure drop (Figure 5c,d), which is larger for the 3 MP-type, with 6.86 Pa, in comparison to the P-type, with 0.94 Pa. The channels and bends in the 3 MP-type flow field increase the pressure drop [43]. Ouellette et al. [53] determined that similar pressures prevail in the three parallel channels of a group, and, as a result, there is minimal under-rib convection occurring among them. However, the pressure difference between the adjacent channel bends increases convection under the rib, and, therefore, this enables the reactants to cross more easily through the backing layer [53].
These findings are evident from the literature data. Ouellette et al. [53] achieved the best performance by using a mixed serpentine flow field for the anode side of a DMFC in comparison with bio-inspired flow fields. Vasile et al. [58] determined that this type of flow field shows a homogeneous reacting methanol mass fraction and a homogeneous distributed current density at the interface of the anode of a DMFC. El-Zoheiry et al. [55] identified that the pressure difference along the rib, which drives the under-rib mass transport, is dependent on the flow-path patterning in the channels, rib length, and the number of paths for the anodic flow fields. Another important aspect of flow field design is the choice of channel width, channel depth, and open ratio. Wong et al. [48] presented the case for an ideal channel depth that exists according to the channel width and open ratio.
In addition, when optimizing the flow field on one side, the flow field on the other should always be considered as well since both structures of the flow fields have an influence on the contact and pressure on the MEA located in the middle [51,52,53,57,62]. For example, Gholami et al. [51] showed in their work (for the DMFC) that the direct path between the anode and cathode (i.e., the zones where, on both sides, there are no ribs present) has a remarkable influence on the crossover, and moreover, the uniform distribution is important for adequate contact pressure. The distribution of the zones of the direct path has an influence on the reactant’s accessibility to the reaction sites and also on the surface contact of the reactants to the active sites. In addition, the allocation of the contact surfaces of the ribs to the anode and cathode should be uniform to ensure better pressure uniformity for the clamping force and lower contact resistance. Thus, a good balance of the layout between direct paths and contact areas should be aimed for [51]. In Figure 6a,b, the contact areas (yellow) and the paths (no color) between the anode (red) and cathode (green) are shown for the P + 4 MP and the 3 MP + 4 MP combination.
The P-type flow field on the anode, in combination with the 4 MP-type flow field on the cathode, shows a relatively small contact area of 17.4 mm2. Moreover, the contact points are not that evenly distributed and offer large areas for the possibility of ethanol crossover. In contrast, the 3 MP-type flow field, in combination with the 4 MP-type flow field, has a more uniform contact and pressure on the MEA, with a contact area of 57.7 mm2. This improves the current conduction and minimizes the ethanol crossover [51].

3.2. Single Cell Tests

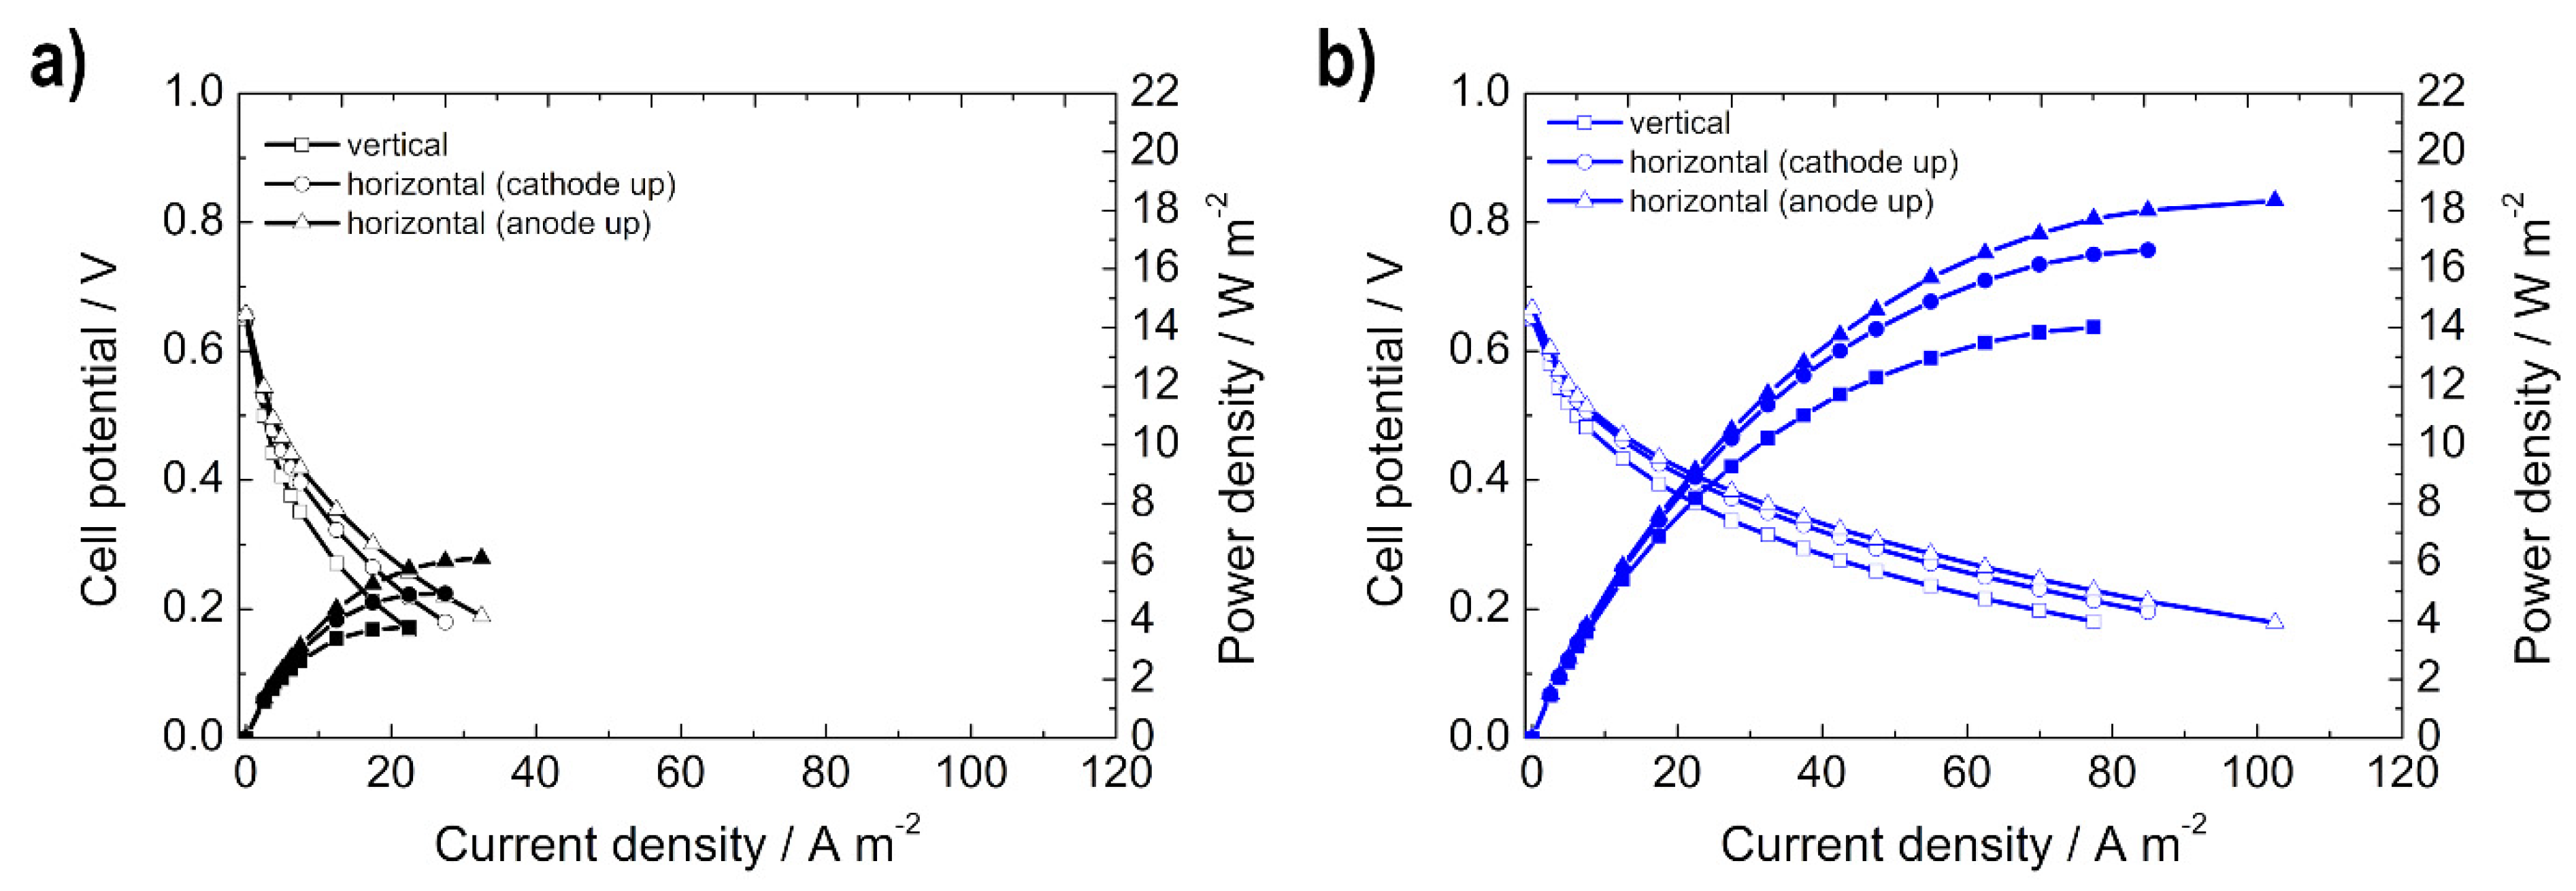
3.2.1. Influence of Orientation on Alkaline DEFC Performance

The influence of orientation was determined via single-cell measurements since different cases were found in the literature for the DMFC [34,35,36,44,46,59]. The results are discussed in this section. For both flow fields, the power density (Figure 7) increased in the following order: vertical < horizontal (cathode up) < horizontal (anode up). For the P-type flow field and the 3 MP-type flow field, the following power density values could be achieved: 3.78 < 4.94 < 6.14 W m−2 and 14.0 < 16.6 < 18.3 W m−2, respectively. Based on these values, the 3 MP-type showed a power output threefold greater than that of the P-type structure.
The effect of orientation on performance is independent of the anodic flow field since the same trend applies to them both. Thus, it can be concluded that it is not mainly the flow field structure that is the influencing factor but the external forces. A force that should certainly not be disregarded is the gravitational force. Therefore, the following justifications only apply to the here shown case of ambient pressure. However, the application of pressure on the system would have involved more complexity and higher costs, which is unattractive for a potentially portable technology; it was thus decided not to implement this possibility.
The horizontal orientation with the anode facing upward showed the best performance since gravity pushes the ethanol evenly down onto the carbon cloth and, thus, to the active sites. This also has a further advantage for water transport through the membrane due to the pressure from the gravitational force. This orientation also has a positive effect on the flooding of the cathode because, when there is too much water, this water remains on the bottom of the flow channel and the oxygen can flow over it to the active sites of the cathode. In the arrangement where the anode is oriented downwards, the conditions are exactly the opposite: if the cathode is flooded, the water would block the accessibility of the oxygen. In addition, the pressure of the ethanol on the MEA and, thus, on the catalyst is not comparable and inferior performance is the result. In the vertical arrangement tested here, the liquid is introduced from the bottom and the gas from the top; Kim et al. [13] reported that water cannot be removed adequately if the gas is introduced from the bottom because it accumulates and causes local flooding. The disadvantage of the vertical arrangement is, again, just as for the horizontal form with the anode facing downwards, the supply of the ethanol to the catalytic active sites of the catalyst. Since the ethanol oxidation reaction is the more inhibited reaction in this cell, the performance depends on the anode side and, thus, on optimal feeding. This is provided in the horizontal arrangement, with the anode facing up due to gravitational force as demonstrated.
The behavior is different from the literature data for the DMFC, where the vertical orientation was preferred [33,59]. This is due to the fact that, in the DMFC, CO2 is formed as the main product, which is formed only to a minor extent, depending on the activity and C-C bond cleavage possibility of the catalyst in the DEFC. Yang et al. [59] and also Yuan et al. [33] showed that the produced CO2 within the flow field affects performance due to buoyancy forces when using different orientations. In contrast, Wong et al. [48] demonstrated that, for very narrow channels, like in the µDMFC, the orientation has no effect on performance because the capillary force becomes more influential than the buoyancy force. All of these observations (narrow channels, gas behavior) are, as mentioned before, not consistent with the factors in the DEFC at the moment because the formation of CO2 is inhibited [1,6,16]. However, the pattern of measured data and obtained values for the alkaline DEFC fit within a reasonable range compared to the literature values for the DMFC. Yang et al. [59] showed that the different orientations affect cell performance by approximately 2–5 mW cm−2 using 1 M methanol solution (1 mL min−1) at 60 °C.

3.2.2. Effect of the Fuel Temperature on Performance

Performance generally improves with increasing temperature, mainly due to the electrode kinetics, mass transfer properties, and the membrane conductivity being thermally activated [15]. In this section, the effect of fuel preheating on performance is investigated since both cases were found in the literature for the DMFC [4,36,44,45,46,50,58,59]. This influence should not be disregarded since preheating the fuel is associated with higher costs (equipment and energy) and also greater system space consumption. Therefore, polarization curves were performed without using preheated fuel (RT) and with preheated fuel (60 °C), which can be seen in Figure 8. In our case, the preheating of the fuel cell mixture has nearly no effect on the power output of the cell. This can be explained by the fact that the cell itself was heated; thus, there was only a minimal difference in the measured temperature directly below the flow field (independent of the type of flow field). In the non-preheated fuel test, 60 °C was measured on the cathode side and 57 °C on the anode side; in the preheated fuel test, 60 °C was measured for both sides. This results in a minimal difference of 3 °C. Due to the low pump speed of the ethanol mixture (of 5 mL min−1), it has enough time to warm up within the flow field, and, therefore, no performance difference is noticeable. Furthermore, the polarization curve itself shows no difference in any region whatsoever.
However, preheating the fuel results in a positive effect on cell resistance, as shown in Figure 8b–d, with EIS measurements. Comparing the two EIS measurements of the 3 MP-type flow field, with and without preheating, it can be determined that the electrolyte resistance, Rel, decreased with the preheating of the anodic fuel as it consists of both KOH and EtOH. The charge transfer resistance at the anode side, Rct,a, is nearly the same for both measurements as there is no major influence on the reaction kinetics due to the small temperature change, as shown before. The ionomer resistance in the anodic catalyst layer, Rion,a, gets lower with the preheated fuel. The overall resistance, Rges, of the cell at 60 °C with and without preheating the ethanol and electrolyte solution is slightly lower with preheating due to lower electrolyte resistance, Rel, and the lower resistance of the ionomer in the anodic catalyst layer, Rion,a. Therefore, the influence of preheating should definitely not be ignored for larger applications. In the low-frequency region of both impedance spectra, a little kink can be observed. Studies on the impedance spectroscopy of direct ethanol fuel cells [67] show that one reason for these beginning inductive loops in the low-frequency region is the formation and adsorption of intermediate products on the catalyst surface.
When comparing the power density yields of the two flow fields with each other (Figure 8a), it is, again, clearly evident that higher power density values (52.1 W m−2 vs. 29.6 W m−2, i.e., almost twice as large) could be achieved with the 3 MP-type flow field in comparison to the P-type structure. As already explained in the previous section, this is due to the design of the flow field.

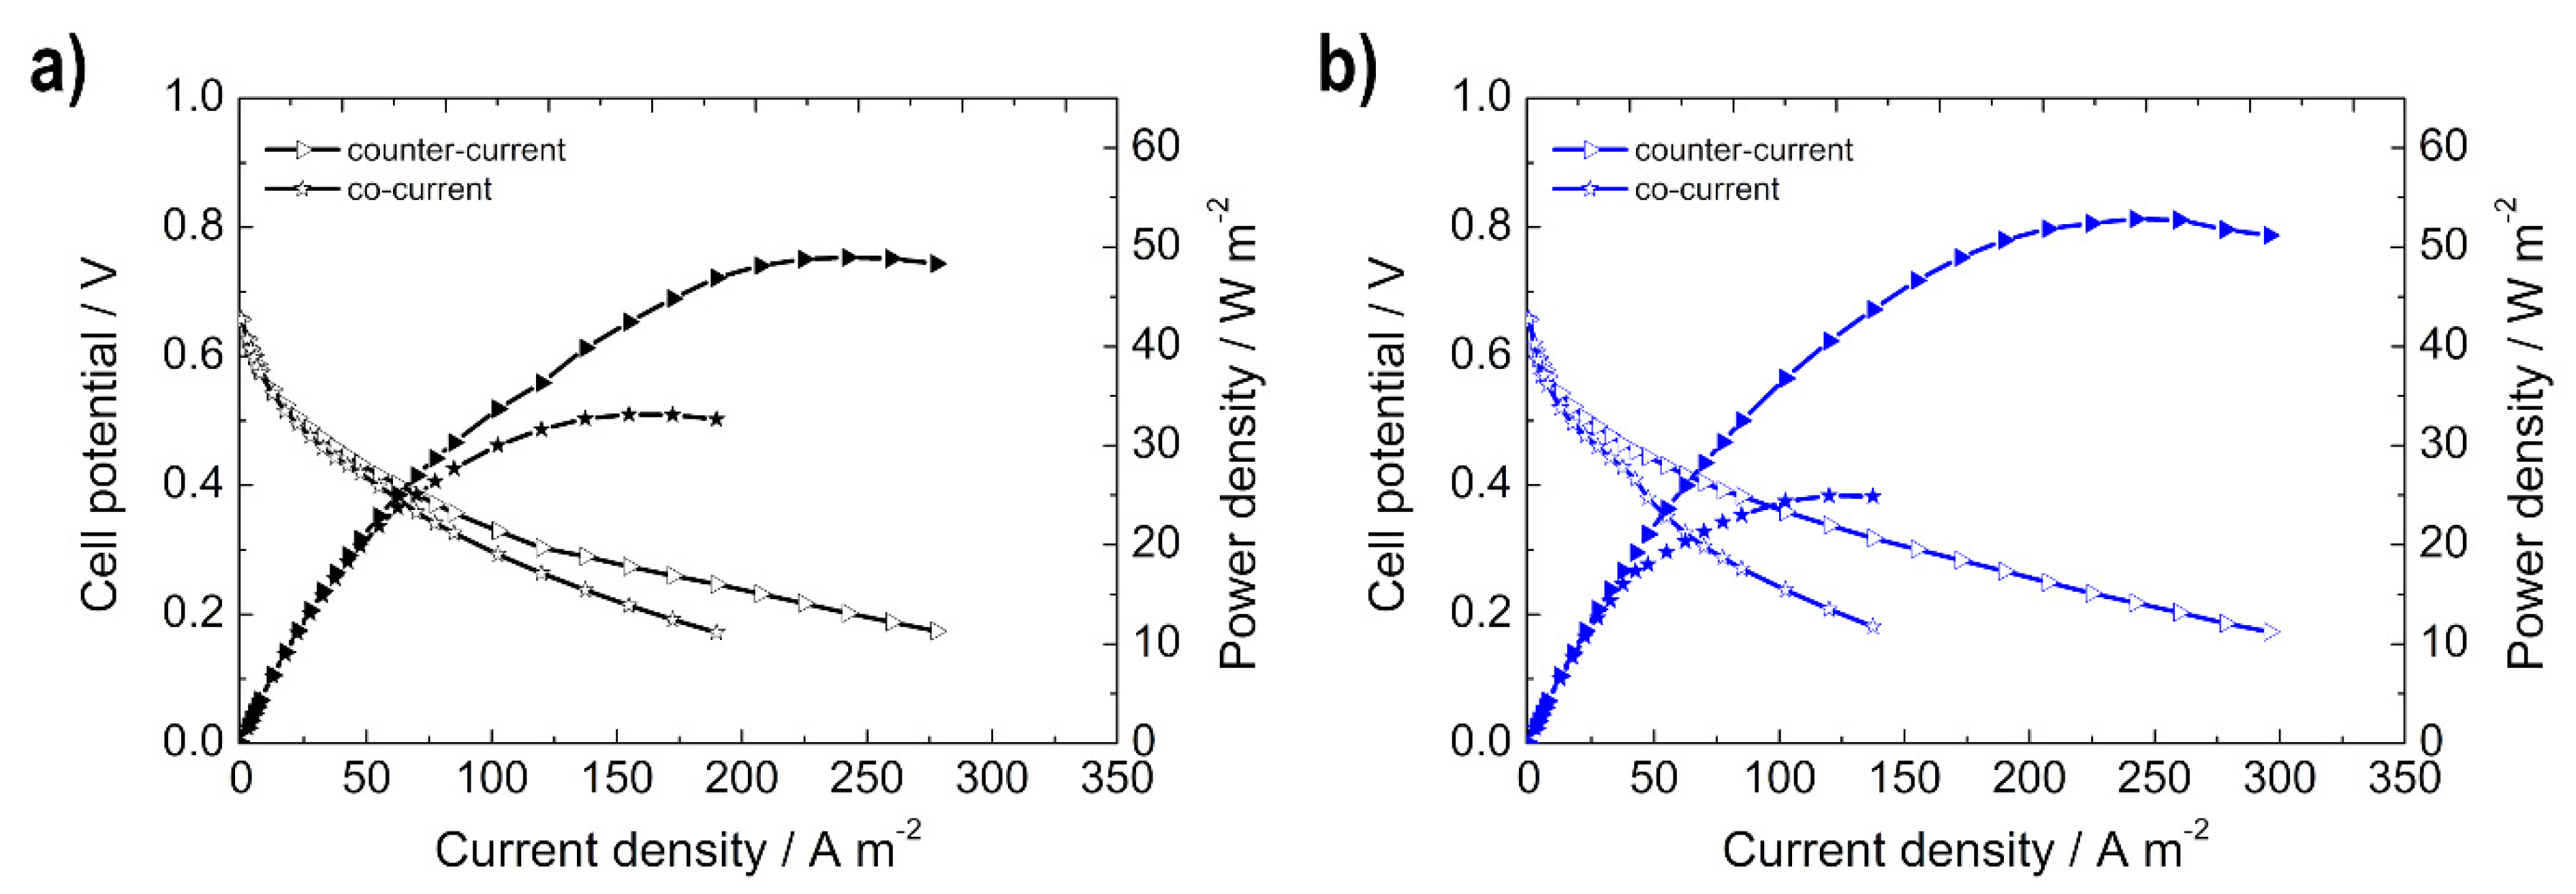
3.2.3. Influence of Co-Current vs. Counter-Current

The polarization curves for the evaluation of the influence of the direction of the two reactant flows (to each other) for both flow fields are shown in Figure 9. Two different configurations (Figure 2c,d) were tested: co-current (anode and cathode flow are in the same direction) and counter-current (both flows enter from opposite sides of the fuel cell). The counter-current has a positive effect on the performance of both of the anodic flow fields tested. For the P-structure type, 48.9 W m−2 was measured by using the counter-current condition and 33.1 W m−2 in the co-current form (Figure 9a), whereas, for the 3 MP-type, 52.8 W m−2 and 24.9 W m−2 were determined (Figure 9b), respectively. This increase in performance can be explained by the counter-current flow principle (gradient between the flows), the prevention of the accumulation of products in the flow channels, and the simultaneous modification of the concentrations of the two fuels [13,44]. Similar to the measurements at a lower temperature, the 3 MP-type flow field achieved larger maximum power density values than the P-type flow field when comparing the counter-current measurements. However, the difference between the two flow fields is not as significant since, at higher temperatures, the reaction kinetics and the conductivity of the cell improved, and therefore the limiting factors of the flow field are diminished. In contrast to the counter-current measurement, by using the co-current direction for both flow fields, the P-type reached higher maximum power density values than the 3 MP-type. This is due to the fact that the possible accumulation of the products in the channels through the co-current [44] is less pronounced in the P-type than in the 3 MP-type since there are no real channels in this flow field. Another important aspect is that the concentration of ethanol and oxygen on both sides simultaneously decreased along the flow path, and with this, therefore, so did the electrochemical reactions. This led to insufficient use of the MEA [13]. This phenomenon is again more pronounced with the 3 MP-type due to the channels. In the P-type, intermixing can occur due to the wide area, resulting in a less pronounced gradient. By comparing the different flow configurations for both flow field types, it can be observed that in the low current density region (>50 A m−2) there is no difference between the counter and co-current. In the ohmic region of the polarization curve, the negative effect of the co-current configuration can be seen.

4. Conclusions

In this study, a flow field with new and improved structural parameters for the anode side of an alkaline DEFC was designed and evaluated. The modeling and simulation data, as well as the polarization measurements, showed that the new design combines the important parameters for the even flow distribution and an optimized supply of the reactants. This shows better performance than that of the previously used model, with a maximum power density of 18.3 W m−2 at RT. The investigation into the influence of temperature on performance showed that the higher the temperature in the cell, the lower the influence of the flow field structure on performance. Furthermore, it could be determined that the horizontal orientation (with anode up) of the cell exerts a positive effect on performance, in contrast to the DMFC, where vertical orientation is preferred. Preheating the fuel mixture has almost no effect on performance since the mixture is already heated by the temperature control in the cell and the low flow rate, but it does have a positive effect on cell resistance. If the two reactants are fed from the opposite sides of the flow fields, the power generated (counter-current flow principle) doubles compared to the co-current flow (52.8 W m−2 vs. 24.9 W m−2).

Author Contributions

Conceptualization, M.R.; methodology, M.R., S.W., K.M., M.S. and V.H.; software, M.R., M.S. and K.M.; validation, V.H.; formal analysis, M.R., S.W., K.M. and M.S.; investigation, M.R., S.W., K.M. and M.S.; resources, V.H.; data curation, M.R., K.M. and M.S.; writing—original draft preparation, M.R., S.W., M.S. and K.M.; writing—review and editing, V.H., M.R., S.W., K.M. and M.S.; visualization, M.R.; supervision, V.H.; project administration, V.H.; funding acquisition, V.H. and M.R. All authors have read and agreed to the published version of the manuscript.

Funding

This research was funded by the AUSTRIAN SCIENCE FUND (FWF), grant number I 3871-N37 in the frame of the project “Graphene Oxide based MEAs for the Direct Ethanol Fuel Cell”.

Data Availability Statement

The data that support the findings of this study are available within the article.

Acknowledgments

Special thanks are due to Peter Schranz for his help in performing the measurements. Open Access Funding by the Austrian Science Fund (FWF) is gratefully acknowledged.

Conflicts of Interest

The authors declare no conflict of interest. The funders had no role in the design of the study; in the collection, analyses, or interpretation of data; in the writing of the manuscript; or in the decision to publish the results.

References

  1. Yu, E.H.; Wang, X.; Krewer, U.; Li, L.; Scott, K. Direct Oxidation Alkaline Fuel Cells: From Materials to Systems. Energy Environ. Sci. 2012, 5, 5668–5680. [Google Scholar] [CrossRef] [Green Version]
  2. Kamarudin, M.Z.F.; Kamarudin, S.K.; Masdar, M.S.; Daud, W.R.W. Review: Direct Ethanol Fuel Cells. Int. J. Hydrogen Energy 2013, 38, 9438–9453. [Google Scholar] [CrossRef]
  3. Huo, S.; Deng, H.; Chang, Y.; Jiao, K. Water Management in Alkaline Anion Exchange Membrane Fuel Cell Anode. Int. J. Hydrogen Energy 2012, 37, 18389–18402. [Google Scholar] [CrossRef]
  4. Li, Y.S.; Zhao, T.S.; Chen, R. Cathode Flooding Behaviour in Alkaline Direct Ethanol Fuel Cells. J. Power Sources 2011, 196, 133–139. [Google Scholar] [CrossRef]
  5. Carrera-Cerritos, R.; Fuentes-Ramírez, R.; Cuevas-Muñiz, F.M.; Ledesma-García, J.; Arriaga, L.G. Performance and Stability of Pd Nanostructures in an Alkaline Direct Ethanol Fuel Cell. J. Power Sources 2014, 269, 370–378. [Google Scholar] [CrossRef]
  6. Monyoncho, E.A.; Woo, T.K.; Baranova, E.A. Ethanol Electrooxidation Reaction in Alkaline Media for Direct Ethanol Fuel Cells. In Electrochemistry; SPR Electrochemistry; Royal Society of Chemistry: Cambridge, UK, 2019; Volume 15, pp. 1–57. [Google Scholar] [CrossRef]
  7. An, L.; Zhao, T.S. Transport Phenomena in Alkaline Direct Ethanol Fuel Cells for Sustainable Energy Production. J. Power Sources 2017, 341, 199–211. [Google Scholar] [CrossRef]
  8. Alias, M.S.; Kamarudin, S.K.; Zainoodin, A.M.; Masdar, M.S. Active Direct Methanol Fuel Cell: An Overview. Int. J. Hydrogen Energy 2020, 45, 19620–19641. [Google Scholar] [CrossRef]
  9. Abdullah, S.; Kamarudin, S.K.; Hasran, U.A.; Masdar, M.S.; Daud, W.R.W. Modeling and Simulation of a Direct Ethanol Fuel Cell: An Overview. J. Power Sources 2014, 262, 401–406. [Google Scholar] [CrossRef]
  10. Fadzillah, D.M.; Kamarudin, S.K.; Zainoodin, M.A.; Masdar, M.S. Critical Challenges in the System Development of Direct Alcohol Fuel Cells as Portable Power Supplies: An Overview. Int. J. Hydrogen Energy 2019, 44, 3031–3054. [Google Scholar] [CrossRef]
  11. Deng, H.; Zhou, J.; Zhang, Y. Design and Simulation of Air-Breathing Micro Direct Methanol Fuel Cells with Different Anode Flow Fields. Micromachines 2021, 12, 253. [Google Scholar] [CrossRef]
  12. Gamea, O.E.; Ookawara, S.; Mori, S.; Ahmed, M. Performance Enhancement of Direct Methanol Fuel Cell Using Multi-Zone Narrow Flow Fields. Int. J. Energy Res. 2019, 43, 8257–8274. [Google Scholar] [CrossRef]
  13. Kim, D.; Lee, J.; Lim, T.H.; Oh, I.H.; Ha, H.Y. Operational Characteristics of a 50 W DMFC Stack. J. Power Sources 2006, 155, 203–212. [Google Scholar] [CrossRef]
  14. Azam, A.M.I.N.; Lee, S.H.; Masdar, M.S.; Zainoodin, A.M.; Kamarudin, S.K. Parametric Study on Direct Ethanol Fuel Cell (DEFC) Performance and Fuel Crossover. Int. J. Hydrogen Energy 2019, 44, 8566–8574. [Google Scholar] [CrossRef]
  15. Alzate, V.; Fatih, K.; Wang, H. Effect of Operating Parameters and Anode Diffusion Layer on the Direct Ethanol Fuel Cell Performance. J. Power Sources 2011, 196, 10625–10631. [Google Scholar] [CrossRef] [Green Version]
  16. Kamaruddin, M.Z.F.; Kamarudin, S.K.; Daud, W.R.W.; Masdar, M.S. An Overview of Fuel Management in Direct Methanol Fuel Cells. Renew. Sustain. Energy Rev. 2013, 24, 557–565. [Google Scholar] [CrossRef]
  17. Sundar Pethaiah, S.; Arunkumar, J.; Ramos, M.; Al-Jumaily, A.; Manivannan, N. The Impact of Anode Design on Fuel Crossover of Direct Ethanol Fuel Cell. Bull. Mater. Sci. 2016, 39, 273–278. [Google Scholar] [CrossRef] [Green Version]
  18. Ekdharmasuit, P.; Therdthianwong, A.; Therdthianwong, S. Anode Structure Design for Generating High Stable Power Output for Direct Ethanol Fuel Cells. Fuel 2013, 113, 69–76. [Google Scholar] [CrossRef]
  19. Abdullah, S.; Kamarudin, S.K.; Hasran, U.A.; Masdar, M.S.; Daud, W.R.W. Electrochemical Kinetic and Mass Transfer Model for Direct Ethanol Alkaline Fuel Cell (DEAFC). J. Power Sources 2016, 320, 111–119. [Google Scholar] [CrossRef]
  20. Heysiattalab, S.; Shakeri, M.; Safari, M.; Keikha, M.M. Investigation of Key Parameters Influence on Performance of Direct Ethanol Fuel Cell (DEFC). J. Ind. Eng. Chem. 2011, 17, 727–729. [Google Scholar] [CrossRef]
  21. Sarris, I.; Tsiakaras, P.; Song, S.; Vlachos, N. A Three-Dimensional CFD Model of Direct Ethanol Fuel Cells: Anode Flow Bed Analysis. Solid State Ion. 2006, 177, 2133–2138. [Google Scholar] [CrossRef]
  22. Maia, L.K.K.; Sousa, R. Three-Dimensional CFD Modeling of Direct Ethanol Fuel Cells: Evaluation of Anodic Flow Field Structures. J. Appl. Electrochem. 2017, 47, 25–37. [Google Scholar] [CrossRef]
  23. Sokmez, E.; Taymaz, I.; Eker Kahveci, E. Performance Evaluation of Direct Ethanol Fuel Cell Using a Three-Dimensional CFD Model. Fuel 2022, 313, 123022. [Google Scholar] [CrossRef]
  24. Lobato, J.; Cañizares, P.; Rodrigo, M.A.; Pinar, F.J.; Mena, E.; Úbeda, D. Three-Dimensional Model of a 50 cm2 High Temperature PEM Fuel Cell. Study of the Flow Channel Geometry Influence. Int. J. Hydrogen Energy 2010, 35, 5510–5520. [Google Scholar] [CrossRef]
  25. Wang, J. Theory and Practice of Flow Field Designs for Fuel Cell Scaling-up: A Critical Review. Appl. Energy 2015, 157, 640–663. [Google Scholar] [CrossRef]
  26. Li, X.; Sabir, I. Review of Bipolar Plates in PEM Fuel Cells: Flow-Field Designs. Int. J. Hydrogen Energy 2005, 30, 359–371. [Google Scholar] [CrossRef]
  27. Xu, C.; Zhao, T.S. A New Flow Field Design for Polymer Electrolyte-Based Fuel Cells. Electrochem. Commun. 2007, 9, 497–503. [Google Scholar] [CrossRef]
  28. Gomes, R.S.; De Bortoli, A.L. A Three-Dimensional Mathematical Model for the Anode of a Direct Ethanol Fuel Cell. Appl. Energy 2016, 183, 1292–1301. [Google Scholar] [CrossRef]
  29. Gomes, R.S.; De Souza, M.M.; De Bortoli, A.L. Modeling and Simulation of a Direct Ethanol Fuel Cell Considering Overpotential Losses and Variation of Principal Species Concentration. Chem. Eng. Res. Des. 2018, 136, 371–384. [Google Scholar] [CrossRef]
  30. Zehtabiyan-Rezaie, N.; Arefian, A.; Kermani, M.J.; Noughabi, A.K.; Abdollahzadeh, M. Effect of Flow Field with Converging and Diverging Channels on Proton Exchange Membrane Fuel Cell Performance. Energy Convers. Manag. 2017, 152, 31–44. [Google Scholar] [CrossRef]
  31. Yen, T.J.; Fang, N.; Zhang, X.; Lu, G.Q.; Wang, C.Y. A Micro Methanol Fuel Cell Operating at near Room Temperature. Appl. Phys. Lett. 2003, 83, 4056–4058. [Google Scholar] [CrossRef]
  32. Cavalca, C.; Homeyer, S.T.; Walsworth, E. Flow Field Plate for Use in a Proton Exchange Membrane Fuel Cell. U.S. Patent US5686199, 11 November 1997. [Google Scholar]
  33. Yuan, W.; Tang, Y.; Yang, X.; Liu, B.; Wan, Z. Structural Diversity and Orientation Dependence of a Liquid-Fed Passive Air-Breathing Direct Methanol Fuel Cell. Int. J. Hydrogen Energy 2012, 37, 9298–9313. [Google Scholar] [CrossRef]
  34. Hutzenlaub, T.; Paust, N.; Zengerle, R.; Ziegler, C. The Effect of Wetting Properties on Bubble Dynamics and Fuel Distribution in the Flow Field of Direct Methanol Fuel Cells. J. Power Sources 2011, 196, 8048–8056. [Google Scholar] [CrossRef]
  35. Wang, L.; Zhang, Y.; Zhao, Y.; An, Z.; Zhou, Z.; Liu, X. Design, Fabrication and Testing of an Air-Breathing Micro Direct Methanol Fuel Cell with Compound Anode Flow Field. J. Micromech. Microeng. 2011, 21, 104012. [Google Scholar] [CrossRef]
  36. Hsieh, S.S.; Wu, H.C.; Her, B.S. A Novel Design for a Flow Field Configuration, of a Direct Methanol Fuel Cell. J. Power Sources 2010, 195, 3224–3230. [Google Scholar] [CrossRef]
  37. Jung, G.B.; Tu, C.H.; Chi, P.H.; Su, A.; Weng, F.B.; Lin, Y.T.; Chiang, Y.C.; Lee, C.Y.; Yan, W.M. Investigations of Flow Field Designs in Direct Methanol Fuel Cell. J. Solid State Electrochem. 2009, 13, 1455–1465. [Google Scholar] [CrossRef]
  38. Krewer, U.; Pfafferodt, M.; Kamat, A.; Menendez, D.F.; Sundmacher, K. Hydrodynamic Characterisation and Modelling of Anode Flow Fields of Direct Methanol Fuel Cells. Chem. Eng. J. 2007, 126, 87–102. [Google Scholar] [CrossRef]
  39. Ouellette, D.; Gencalp, U.; Colpan, C.O. Effect of Cathode Flow Field Configuration on the Performance of Flowing Electrolyte-Direct Methanol Fuel Cell. Int. J. Hydrogen Energy 2017, 42, 2680–2690. [Google Scholar] [CrossRef]
  40. Liang, J.; Luo, Y.; Zheng, S.; Wang, D. Enhance Performance of Micro Direct Methanol Fuel Cell by in Situ CO2 Removal Using Novel Anode Flow Field with Superhydrophobic Degassing Channels. J. Power Sources 2017, 351, 86–95. [Google Scholar] [CrossRef]
  41. Wang, S.J.; Huo, W.W.; Zou, Z.Q.; Qiao, Y.J.; Yang, H. Computational Simulation and Experimental Evaluation on Anodic Flow Field Structures of Micro Direct Methanol Fuel Cells. Appl. Therm. Eng. 2011, 31, 2877–2884. [Google Scholar] [CrossRef]
  42. Zhang, Y.; Zhang, P.; Yuan, Z.; He, H.; Zhao, Y.; Liu, X. A Tapered Serpentine Flow Field for the Anode of Micro Direct Methanol Fuel Cells. J. Power Sources 2011, 196, 3255–3259. [Google Scholar] [CrossRef]
  43. El-Zoheiry, R.M.; Mori, S.; Ahmed, M. Using Multi-Path Spiral Flow Fields to Enhance under-rib Mass Transport in Direct Methanol Fuel Cells. Int. J. Hydrogen Energy 2019, 44, 30663–30681. [Google Scholar] [CrossRef]
  44. Yang, H.; Zhao, T.S.; Ye, Q. Pressure Drop Behavior in the Anode Flow Field of Liquid Feed Direct Methanol Fuel Cells. J. Power Sources 2005, 142, 117–124. [Google Scholar] [CrossRef]
  45. Yuan, W.; Wang, A.; Ye, G.; Pan, B.; Tang, K.; Chen, H. Dynamic Relationship between the CO2 Gas Bubble Behavior and the Pressure Drop Characteristics in the Anode Flow Field of an Active Liquid-Feed Direct Methanol Fuel Cell. Appl. Energy 2017, 188, 431–443. [Google Scholar] [CrossRef]
  46. Yang, H.; Zhao, T.S. Effect of Anode Flow Field Design on the Performance of Liquid Feed Direct Methanol Fuel Cells. Electrochim. Acta 2005, 50, 3243–3252. [Google Scholar] [CrossRef]
  47. Park, Y.C.; Chippar, P.; Kim, S.K.; Lim, S.; Jung, D.H.; Ju, H.; Peck, D.H. Effects of Serpentine Flow-Field Designs with Different Channel and Rib Widths on the Performance of a Direct Methanol Fuel Cell. J. Power Sources 2012, 205, 32–47. [Google Scholar] [CrossRef]
  48. Wong, C.W.; Zhao, T.S.; Ye, Q.; Liu, J.G. Experimental Investigations of the Anode Flow Field of a Micro Direct Methanol Fuel Cell. J. Power Sources 2006, 155, 291–296. [Google Scholar] [CrossRef]
  49. Tüber, K.; Oedegaard, A.; Hermann, M.; Hebling, C. Investigation of Fractal Flow-Fields in Portable Proton Exchange Membrane and Direct Methanol Fuel Cells. J. Power Sources 2004, 131, 175–181. [Google Scholar] [CrossRef]
  50. Aricò, A.S.; Cretì, P.; Baglio, V.; Modica, E.; Antonucci, V. Influence of Flow Field Design on the Performance of a Direct Methanol Fuel Cell. J. Power Sources 2000, 91, 202–209. [Google Scholar] [CrossRef]
  51. Gholami, O.; Imen, S.J.; Shakeri, M. Effect of Anode and Cathode Flow Field Geometry on Passive Direct Methanol Fuel Cell Performance. Electrochim. Acta 2015, 158, 410–417. [Google Scholar] [CrossRef]
  52. Ozden, A.; Ercelik, M.; Ouellette, D.; Colpan, C.O.; Ganjehsarabi, H.; Hamdullahpur, F. Designing, Modeling and Performance Investigation of Bio-Inspired Flow Field Based DMFCs. Int. J. Hydrogen Energy 2017, 42, 21546–21558. [Google Scholar] [CrossRef]
  53. Ouellette, D.; Ozden, A.; Ercelik, M.; Colpan, C.O.; Ganjehsarabi, H.; Li, X.; Hamdullahpur, F. Assessment of Different Bio-Inspired Flow Fields for Direct Methanol Fuel Cells through 3D Modeling and Experimental Studies. Int. J. Hydrogen Energy 2018, 43, 1152–1170. [Google Scholar] [CrossRef]
  54. Sudaroli, B.M.; Kolar, A.K. Experimental and Numerical Study of Serpentine Flow Fields for Improving Direct Methanol Fuel Cell Performance. Fuel Cells 2015, 15, 826–838. [Google Scholar] [CrossRef]
  55. El-Zoheiry, R.M.; Ookawara, S.; Ahmed, M. Efficient Fuel Utilization by Enhancing the Under-Rib Mass Transport Using New Serpentine Flow Field Designs of Direct Methanol Fuel Cells. Energy Convers. Manag. 2017, 144, 88–103. [Google Scholar] [CrossRef]
  56. Lu, Y.; Reddy, R.G. Effect of Flow Fields on the Performance of Micro-Direct Methanol Fuel Cells. Int. J. Hydrogen Energy 2011, 36, 822–829. [Google Scholar] [CrossRef]
  57. Oliveira, V.B.; Rangel, C.M.; Pinto, A.M.F.R. Effect of Anode and Cathode Flow Field Design on the Performance of a Direct Methanol Fuel Cell. Chem. Eng. J. 2010, 157, 174–180. [Google Scholar] [CrossRef]
  58. Vasile, N.S.; Monteverde Videla, A.H.A.; Simari, C.; Nicotera, I.; Specchia, S. Influence of Membrane-Type and Flow Field Design on Methanol Crossover on a Single-Cell DMFC: An Experimental and Multi-Physics Modeling Study. Int. J. Hydrogen Energy 2017, 42, 27995–28010. [Google Scholar] [CrossRef]
  59. Yang, H.; Zhao, T.S.; Ye, Q. In Situ Visualization Study of CO2 Gas Bubble Behavior in DMFC Anode Flow Fields. J. Power Sources 2005, 139, 79–90. [Google Scholar] [CrossRef]
  60. Bewer, T.; Beckmann, T.; Dohle, H.; Mergel, J.; Stolten, D. Novel Method for Investigation of Two-Phase Flow in Liquid Feed Direct Methanol Fuel Cells Using an Aqueous H2O2 Solution. J. Power Sources 2004, 125, 1–9. [Google Scholar] [CrossRef]
  61. Yuan, W.; Wang, A.; Yan, Z.; Tan, Z.; Tang, Y.; Xia, H. Visualization of Two-Phase Flow and Temperature Characteristics of an Active Liquid-Feed Direct Methanol Fuel Cell with Diverse Flow Fields. Appl. Energy 2016, 179, 85–98. [Google Scholar] [CrossRef]
  62. Jung, G.B.; Su, A.; Tu, C.H.; Weng, F.B.; Chan, S.H. Innovative Flow-Field Combination Design on Direct Methanol Fuel Cell Performance. J. Fuel Cell Sci. Technol. 2007, 4, 365–368. [Google Scholar] [CrossRef]
  63. Grimmer, C.; Grandi, M.; Zacharias, R.; Weinberger, S.; Schenk, A.; Aksamija, E.; Mautner, F.-A.; Bitschnau, B.; Hacker, V. Carbon Supported Nanocrystalline Manganese Oxide: Surpassing Platinum as Oxygen Reduction Catalyst in Direct Borohydride Fuel Cells. J. Electrochem. Soc. 2016, 163, F885–F890. [Google Scholar] [CrossRef] [Green Version]
  64. Gorgieva, S.; Osmić, A.; Hribernik, S.; Božič, M.; Svete, J.; Hacker, V.; Wolf, S.; Genorio, B. Efficient Chitosan/Nitrogen-Doped Reduced Graphene Oxide Composite Membranes for Direct Alkaline Ethanol Fuel Cells. Int. J. Mol. Sci. 2021, 22, 1740. [Google Scholar] [CrossRef] [PubMed]
  65. Samsudin, A.M.; Wolf, S.; Roschger, M.; Hacker, V. Poly(Vinyl Alcohol)-Based Anion Exchange Membranes for Alkaline Direct Ethanol Fuel Cells. Int. J. Renew. Energy Dev. 2021, 10, 435–443. [Google Scholar] [CrossRef]
  66. Cermenek, B.; Genorio, B.; Winter, T.; Wolf, S.; Connell, J.G.; Roschger, M.; Letofsky-Papst, I.; Kienzl, N.; Bitschnau, B.; Hacker, V. Alkaline Ethanol Oxidation Reaction on Carbon Supported Ternary PdNiBi Nanocatalyst Using Modified Instant Reduction Synthesis Method. Electrocatalysis 2020, 11, 203–214. [Google Scholar] [CrossRef] [Green Version]
  67. Wnuk, P.; Jurczakowski, R.; Lewera, A. Electrochemical Characterization of Low-Temperature Direct Ethanol Fuel Cells Using Direct and Alternate Current Methods. Electrocatalysis 2020, 11, 121–132. [Google Scholar] [CrossRef] [Green Version]
Figure 1. Schematic representation of the test rig.
Energies 15 07234 g001
Figure 2. Schematic illustrations of the different orientations and directions of the two reactant flows to each other: (a) vertical, (b) horizontal (cathode up), (c) horizontal (anode up) and counter-current, and (d) co-current.
Energies 15 07234 g002
Figure 3. Design of the flow fields: (a) pin-structure for the anode [63,64,65], (b) three meander parallel structure for the anode (in/outlet marked) and (c) cathode.
Energies 15 07234 g003
Figure 4. The equivalent circuit model used for the evaluation of the electrochemical impedance spectra.
Energies 15 07234 g004
Figure 5. Simulation of the fluid distribution for (a) the P-type flow field and (b) the 3 MP-type flow field, and the pressure drop for (c) the P-type flow field and (d) the 3 MP-type flow field.
Energies 15 07234 g005
Figure 6. Visual simplistic representation of the contact areas (yellow) and the paths (no color) between the anode (red) and cathode (green) for (a) the P flow field and (b) for the 3 MP flow field.
Energies 15 07234 g006
Figure 7. Polarization (hollow symbols) and power density (filled symbols) curves for measurement condition I at different orientations: vertical, horizontal (cathode up), and horizontal (anode up) for (a) the P-type (black) and (b) the 3 MP-type (blue) flow field structure.
Energies 15 07234 g007
Figure 8. Effect of fuel preheating (a) on cell performance (polarization (hollow symbols) and power density (filled symbols) curves) for measurement condition II for the 3 MP (blue and cyan) in comparison with the P (black) flow field structure, and (b) a comparison of the resistances (Rion,a and Rel are multiplied by a factor of 10 for better visibility) determined by electrochemical impedance spectra measurements for the 3 MP-type flow field, (c) fitted spectrum (red line) of the data (cyan circles) for the 60 °C 3 MP-type measurement (Nyquist Plot), (d) fitted spectrum (orange line) of the data (blue circles) for the 60 °C + fuel preheating 3 MP-type measurement (ZHIT Algorithm is used).
Energies 15 07234 g008
Figure 9. Polarization (hollow symbols) and power density (filled symbols) curves for measurement condition III; the evaluation of the influence of the direction the two reactant flows with respect to each other for (a) the P-type (black) and (b) the 3 MP (blue) flow field structure.
Energies 15 07234 g009
Table 1. Studies on the different design parameters of the anode flow field in DMFCs.
Flow Field
Structures
Flow Field Parameters
(Width and Depth of Channel)
ResultsRef.
Different Geometries
trapezoidal,
parallel, perforated
  • area: 5 cm2
  • width: 1 or 0.8–1 mm
  • direct path between anode and cathode has significant effect on crossover
  • contact of walls: improved pressure distribution of clamping force and resistance
Gholami et al. [51]
serpentine, bio-inspired interdigitated and non-interdigitated
  • area: 8 × 8 mm
  • width: 1.24–2.62 mm
  • depth: 1 mm
  • best performance: serpentine (anode) and the bio-inspired interdigitated (cathode), because of enhanced under-rib convection
Ouellette et al. [53]
grid, parallel, double serpentine, single serpentine
  • area: 8 × 8 mm
  • width: 0.3, 0.5, 0.65, 0.8 mm
  • depth: 0.24 mm
  • open ratio: 29.1, 47.3, 60.6, 73.0
  • single-serpentine: better mass transfer efficiency of methanol and emission efficiency of carbon dioxide
  • channel length and opening ratio have important effects on the cell performance
Deng
et al. [11]
Different serpentine
single serpentine, multi-serpentine, mixed parallel and serpentine
  • area: 25 cm2
  • width: 2 mm
  • depth: 2 mm
  • at a low methanol flow rate and concentration and temperature: mixed parallel and serpentine flow field had a positive impact
Oliveira et al. [57]
single and double channel serpentine, mixed multichannel serpentine with wide and narrow channels
  • area: 2.25 cm2
  • width: 375 or 750 µm
  • depth: 300 µm
  • double-channel serpentine flow field showed the best performance
  • mixed multichannel serpentine having narrow channels showed the worst performance
Lu et al. [56]
serpentine with varying number of paths, different patterning, and rib lengths
  • area: 31 × 31 mm
  • width: 1 mm
  • depth: 0.8 mm
  • open ratio: 53.17
  • pressure difference across the rib (drives the under-rib mass transport) is dependent on the flow-path patterning in channels, rib length, the amount of paths
  • flow field featuring four paths + longest rib: largest under-rib mass transport and small total pressure drop
El-Zoheiry et al. [55]
unique serpentine, four parallel serpentine, four inlet serpentine
  • area: 2.3 × 2.3 cm
  • width: 1 mm
  • depth: 1 mm
  • open ratio: 26.3, 52.8, 79.3
  • unique and four inlet serpentine show a homogeneous reacting methanol mass fraction and a homogeneous distributed current density at the interface
Vasile
et al. [58]
Channel depth, width and rib width
single serpentine, parallel
  • area: 4 × 4 cm
  • width: 1, 2, 3 mm
  • depth: 1, 2, 3 mm
  • open ratio: 26.3, 52.8, 79.3
  • single serpentine better than parallel
  • open ratio and channel length effect pressure drop
  • low methanol flow rate + large open ratio: high power density at high current densities
Yang
et al. [46]
serpentine, parallel
  • area: 1 × 1 cm
  • width: 500 or 580 µm
  • depth: 100, 200, 300, 500, 1000 µm
  • open ratio: 43 or 49
  • an ideal channel depth exists for the channel width and open ratio
  • deeper or shallower channels will lead to a reduction in cell performance
  • µDMFC is insensitive to cell orientations
Wong
et al. [48]
serpentine
  • area: 9 cm2
  • width: 0.7, 1, 1.5 mm
  • depth: 1 mm
  • channel/rib width optimal with 2:1
Park
et al. [47]
Table 2. Geometry of the flow fields.
Flow FieldP
(Anode)
3 MP
(Anode)
4 MP
(Cathode)
dimensions [cm × cm]2 × 22 × 22 × 2
channel width [mm]-1.50.8
channel depth [mm]2.42.40.8
rib width [mm]Ø: 30.80.95
open area [mm2]350.9283.3210.6
rib area [mm2]141.4109.0190.5
open ratio [%]87.770.852.7
Publisher’s Note: MDPI stays neutral with regard to jurisdictional claims in published maps and institutional affiliations.

