

Evaluation of Long-Term Tightness of the Coal Pillar Dam of Underground Reservoir and Protection Countermeasures


Abstract
1. Introduction
2. Simulation Scheme
2.1. Basic Information
2.2. Seepage Calculation Model
2.3. Theoretical Model of Seepage
2.4. Working Conditions’ Settings
- When the underground reservoir is connected with the upper aquifer and the surface water system, both the caving zone and fractured zone may be filled with water. The water level of reservoir increased, which will cause the coal pillar dam to bear higher water pressure.
- Periodic fluctuation of water level and pressure caused by pumping and storing water in reservoirs. After the underground reservoir is built, the water level gradually decreases during the water use period while increasing during the water storage period. If the underground reservoir is used for a pumped storage power station in the future, it will cause more frequent fluctuation in water level.
- Coal pillar dams are damaged due to the brine immersion, the mining disturbance, and the long-term service damage. For example, in some mining areas of western coal mines, where salinity of groundwater is high, long-term immersion will damage the reservoir side of the coal pillar dam and then promote the development of cracks and increase its permeability.
3. Constant Pressure Water Storage
3.1. Basic Situation Setting
3.2. Simulation Results of 100 m Depth
- (1)
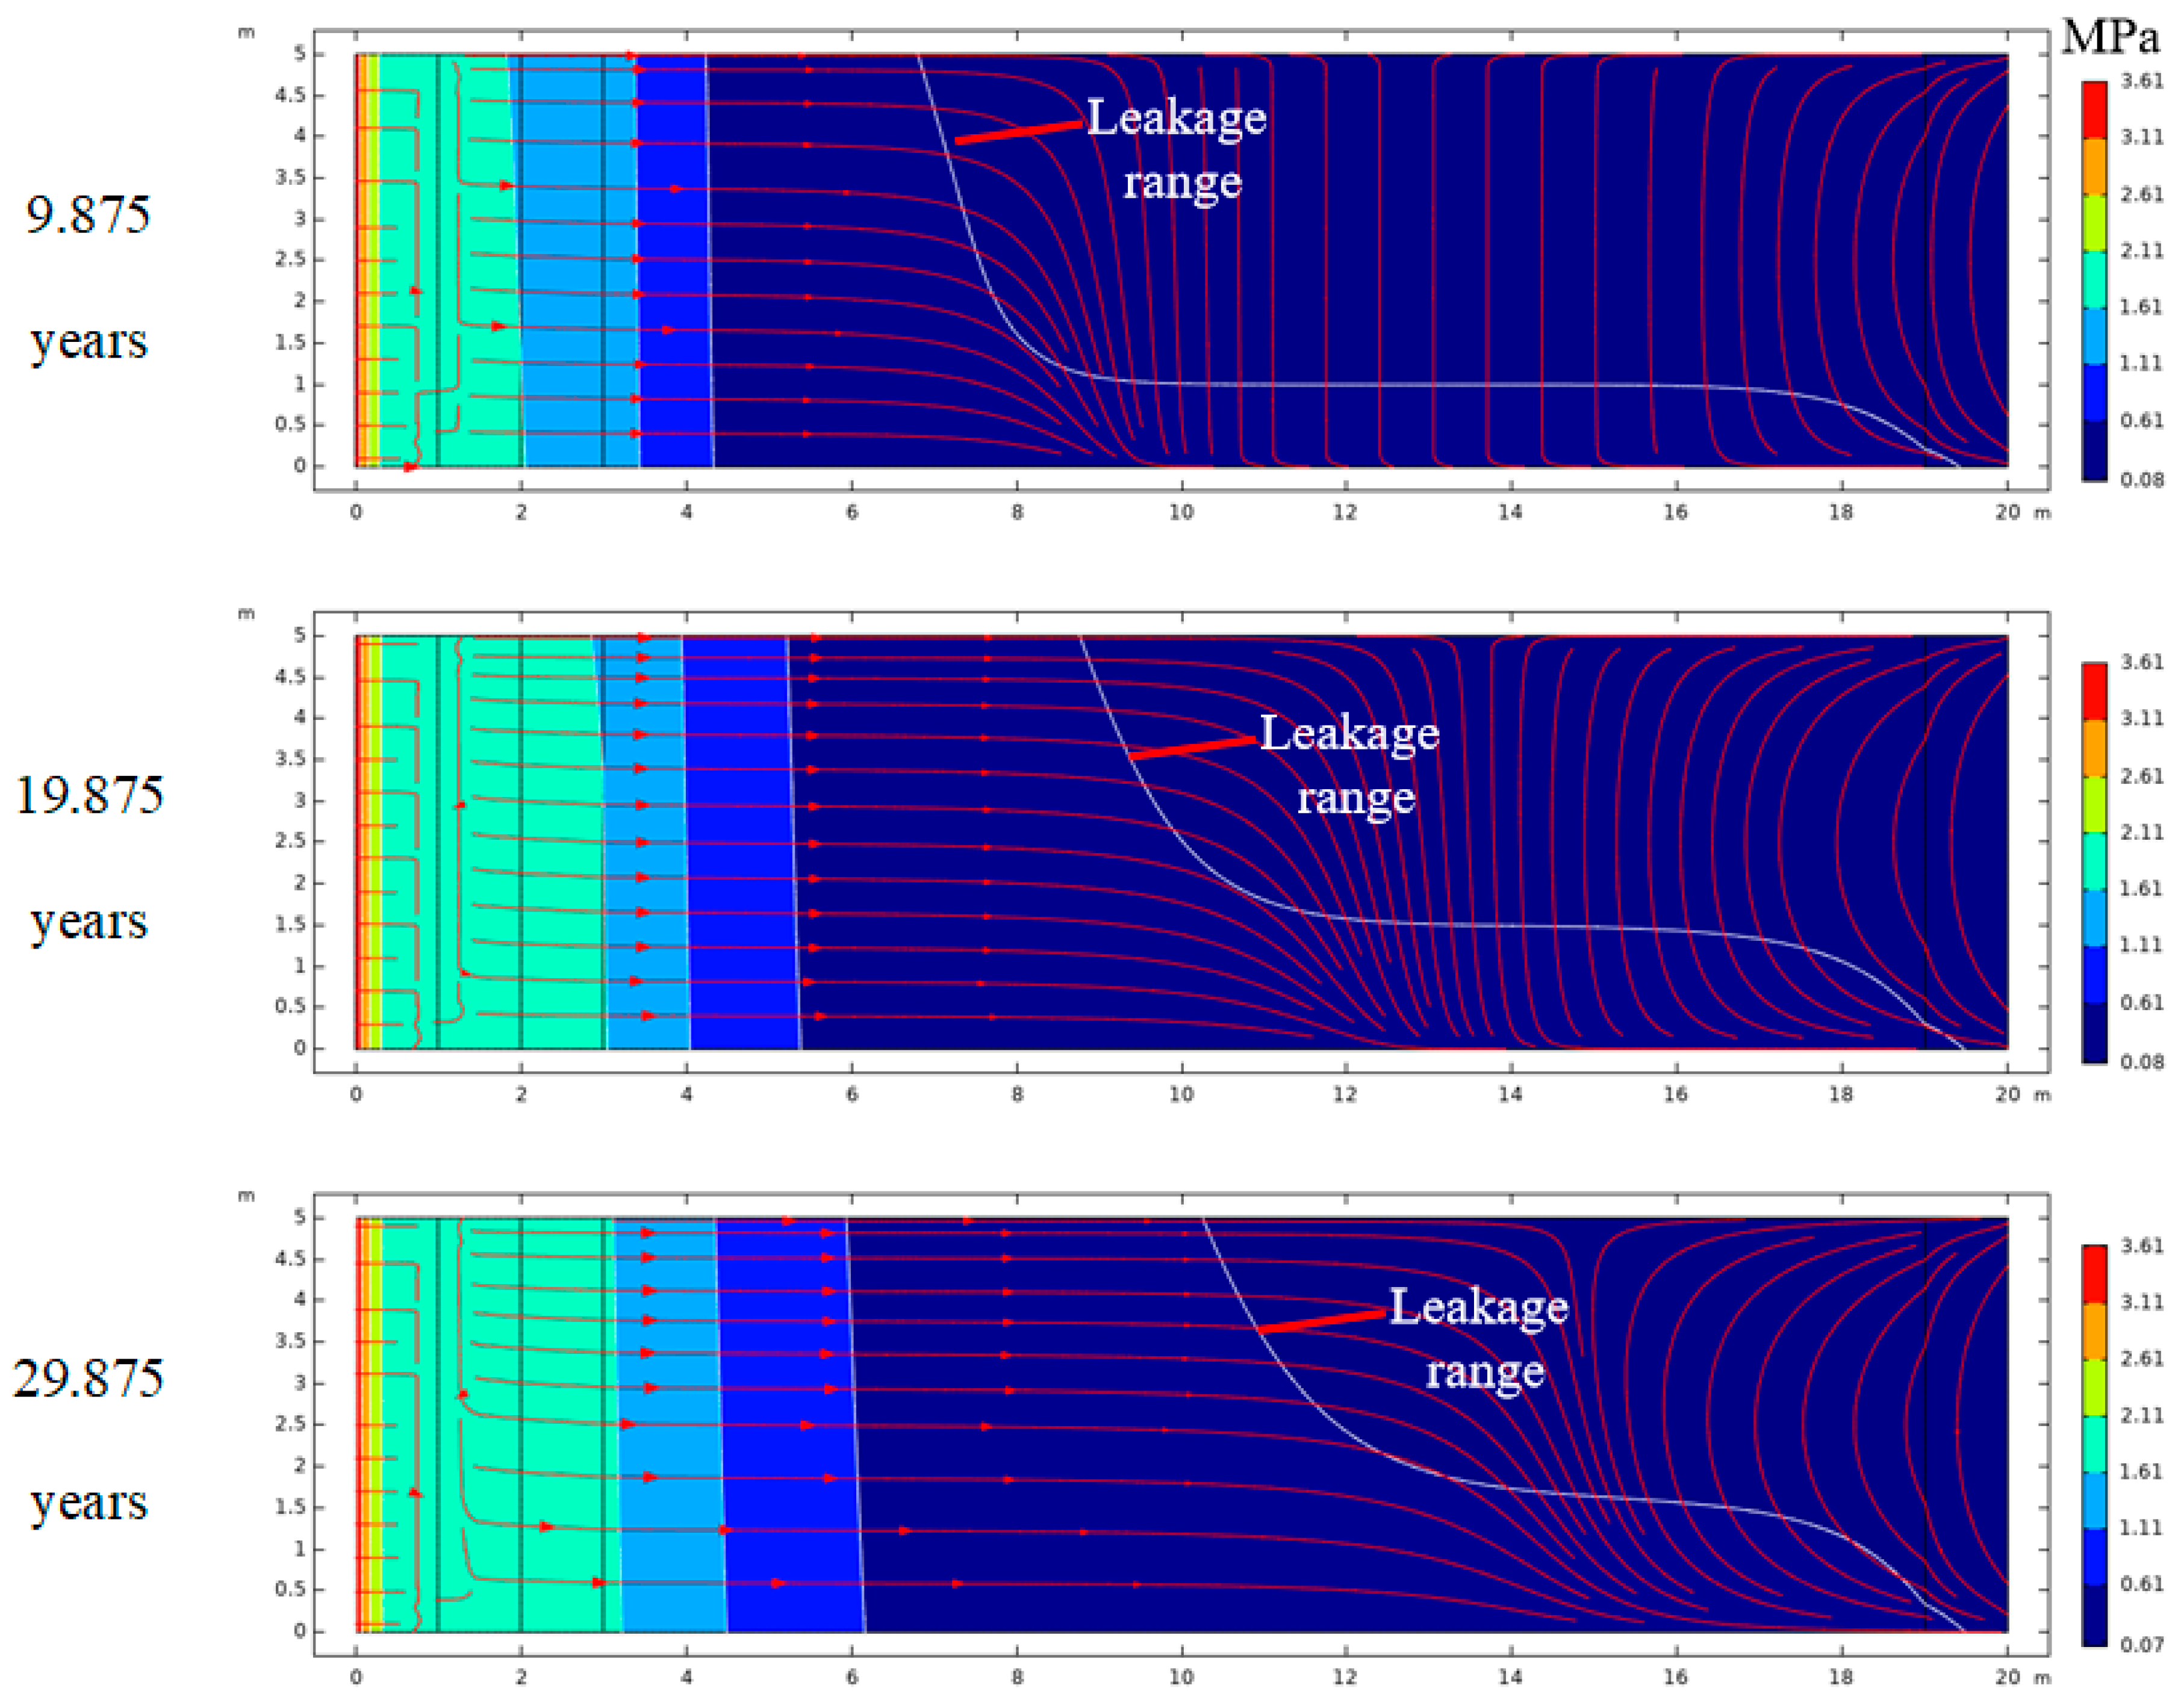
- Leakage range
- (2)
- Pore pressure in the coal pillar dam
- (3)
- Cumulative leakage amount
3.3. Comparison of Different Depths
- (1)
- Comparison of leakage range
- (2)
- Comparison of pore pressure
- (3)
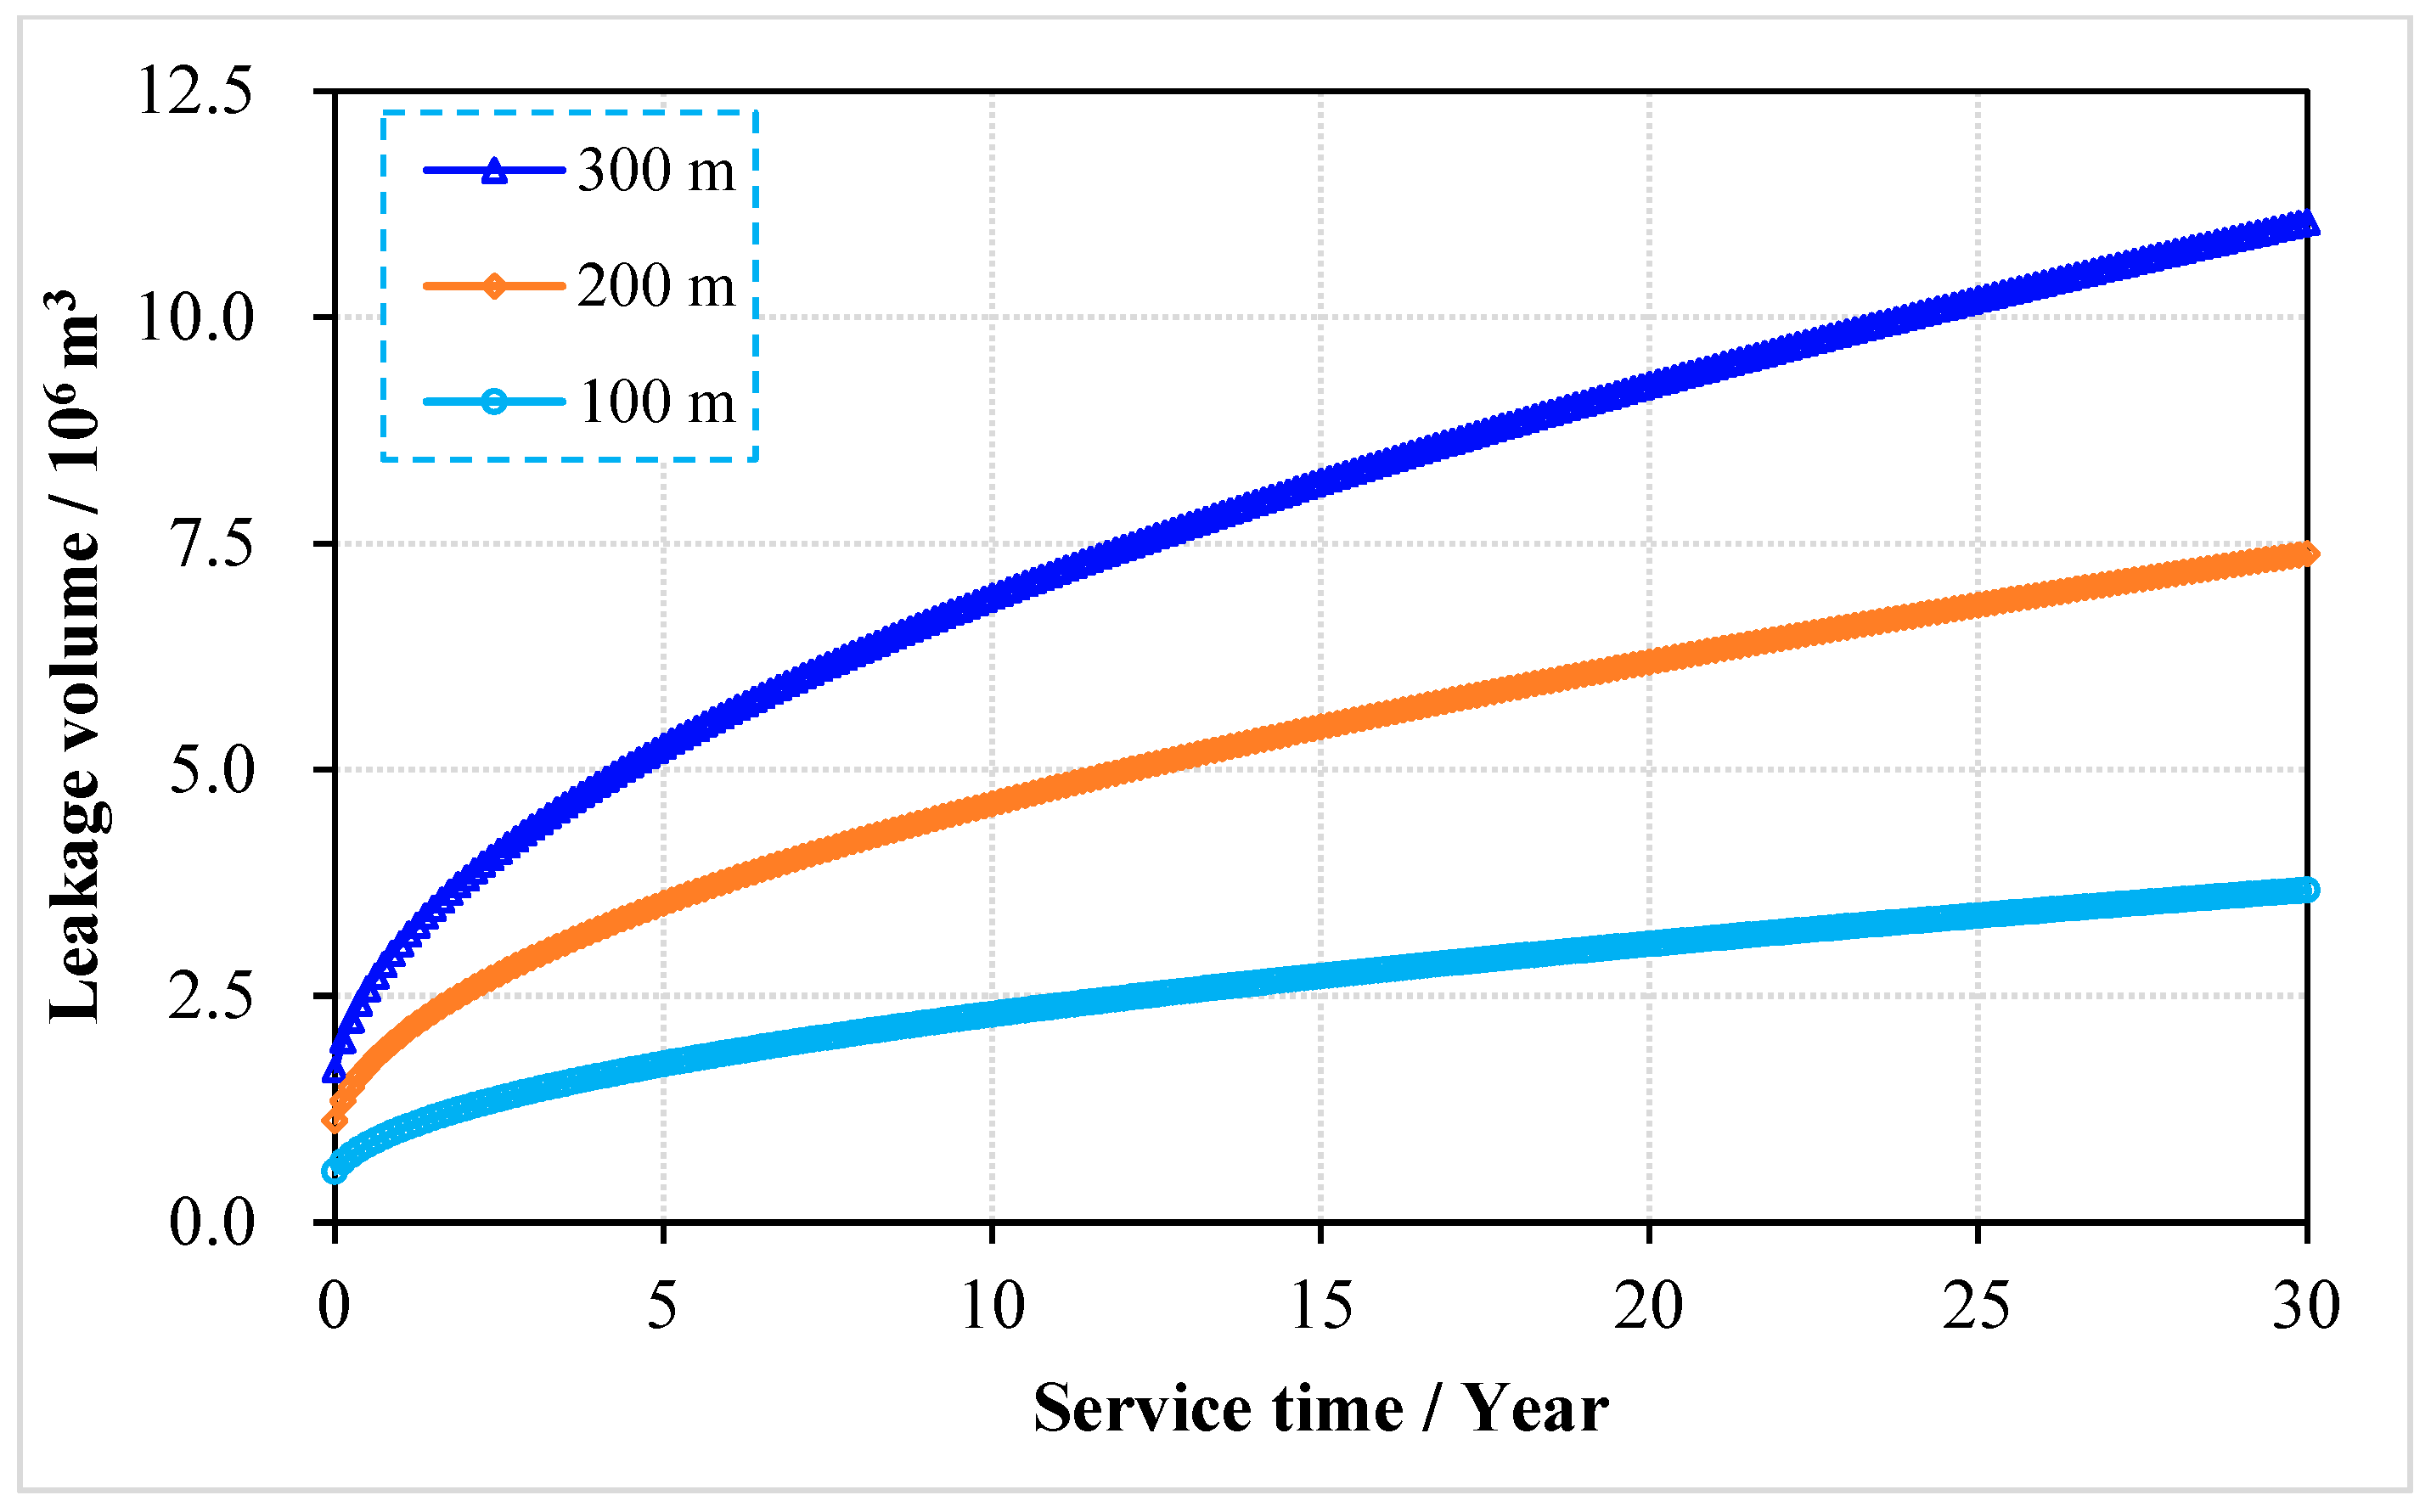
- Cumulative leakage amount
4. Water Pumping and Storage
4.1. Pore Pressure Distribution
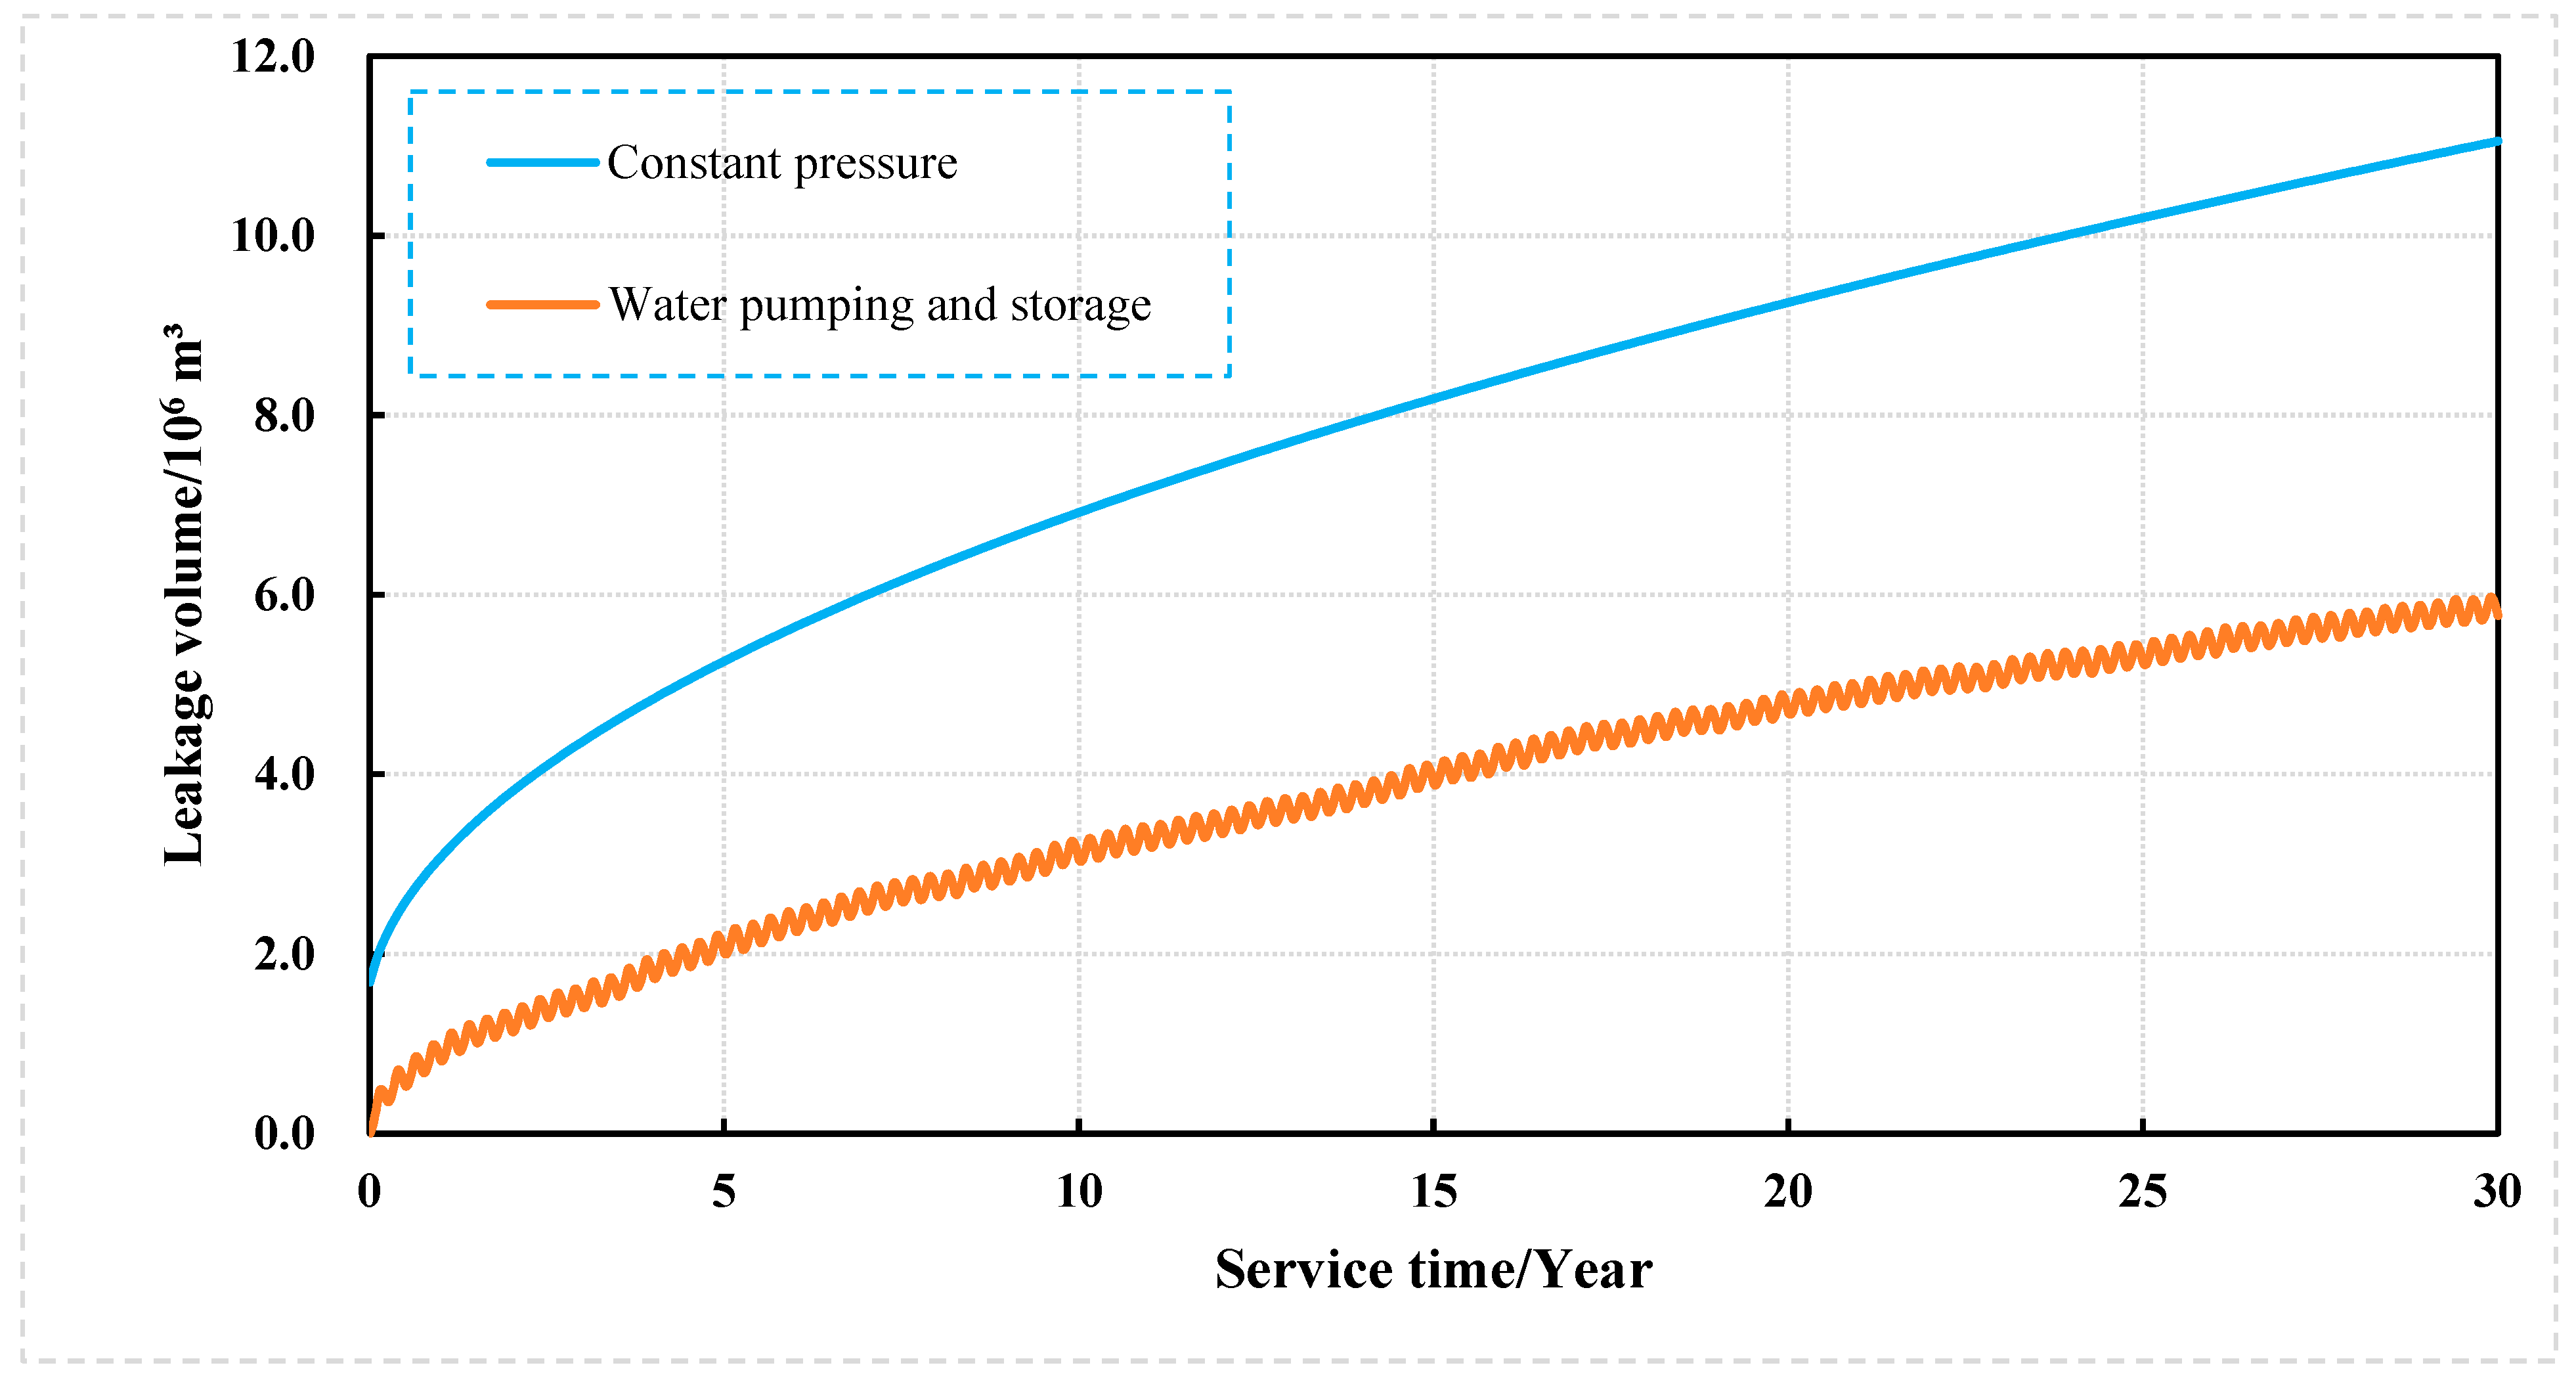
4.2. Cumulative Leakage
5. Influence of Coal Pillar Dam Performance
5.1. Different Permeability of Coal Pillar
- (1)
- Leakage range
- (2)
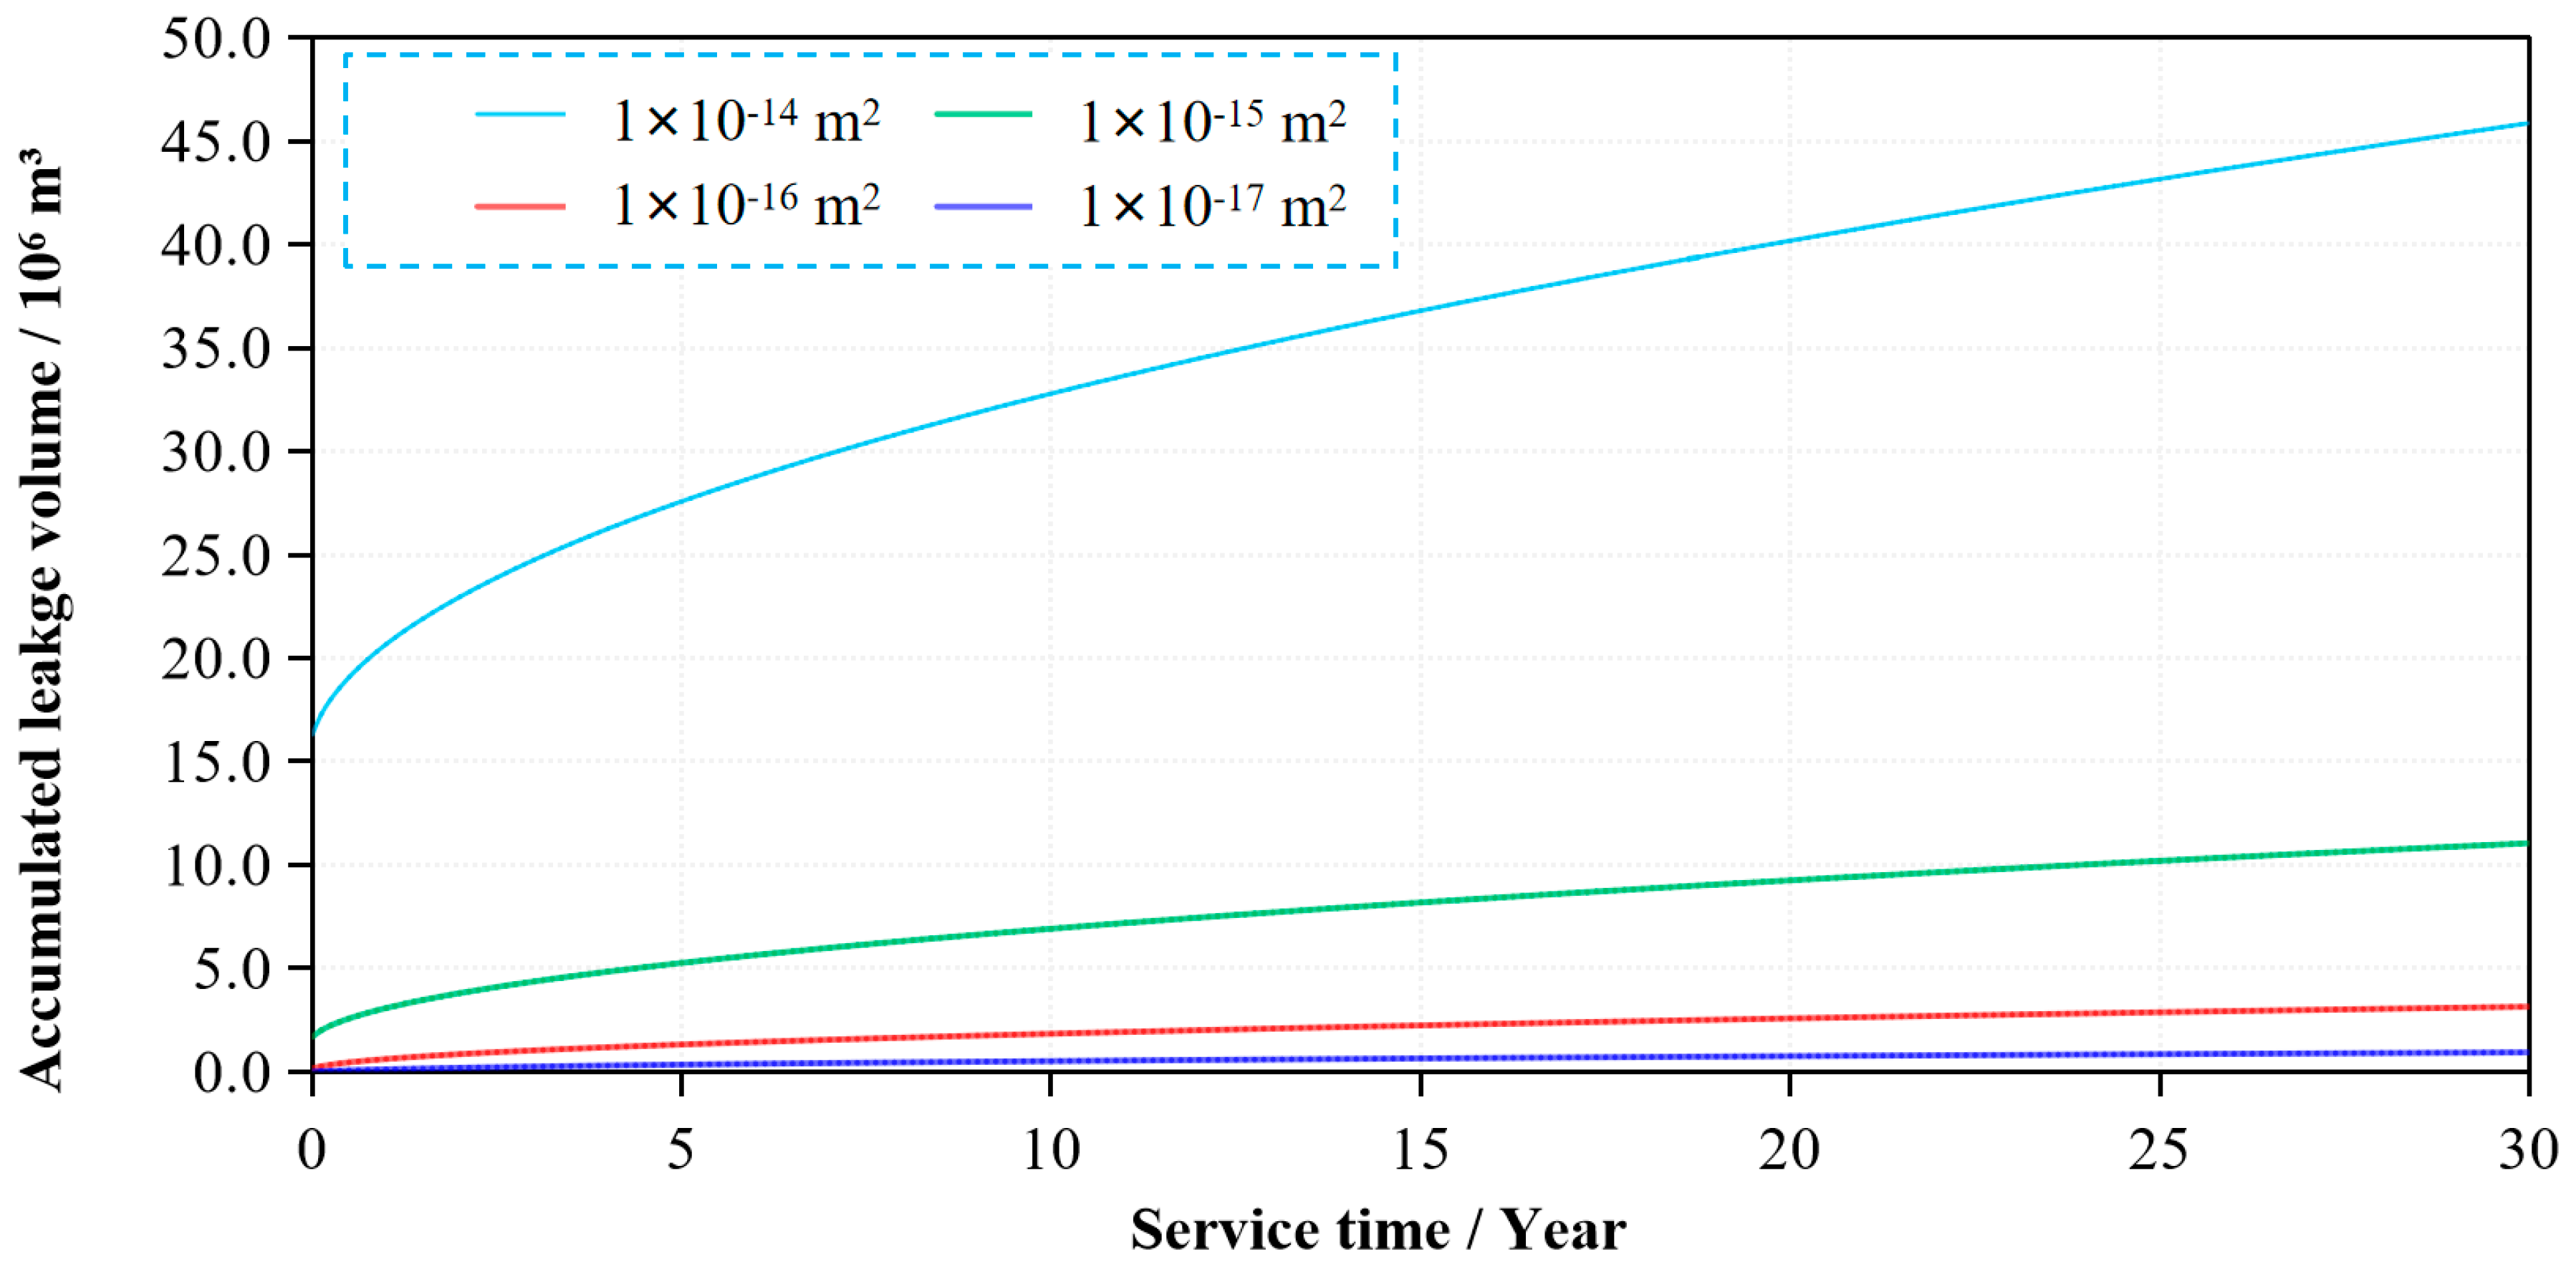
- Cumulative leakage amount
- (1)
- A large amount of water leakage will bring trouble to the underground working face, especially when the leakage is high. Secondary disasters caused by water leakage should be prevented.
- (2)
- High pore pressure in the coal pillar will decrease the effective stress, leading to the local spalling and crushing, and reducing the effective pressure-bearing area.
- (3)
- Large coal pillar permeability will cause the loss of tiny powder and particles in the coal body due to the high flow velocity and strong hydrodynamic force. It may result in the phenomenon of “flowing soil” and “piping”; moreover, the sudden collapse of coal pillars when it develops to a certain extent.
5.2. Damage Zone in the Coal Pillar
- (1)
- Leakage range
- (2)
- Pore pressure distribution
- (3)
- Cumulative leakage amount
6. Discussion and Application
- (1)
- When the reservoir is not connected with upper water system, the leakage is minimal, and the average annual leakage only accounts for 1.5% of the total water storage. Once they are connected, water pressure in the reservoir increased rapidly, significantly increasing the leakage. When the water pressure is 100 m water column height, the leakage will increase by more than seven times, and when the water pressure is 300 m water column height, the leakage will increase by 23.66 times. Therefore, detecting and controlling the water pressure change in the reservoir area is crucial, which is the key to preventing leakage. Once the water pressure is too high, priority should be given to pumping and depressurizing the reservoir when using water in the mining area. Although the fracture zone has adverse effects on dam leakage prevention, it is equivalent to gathering more water resources for utilization, and the deeper the depth, the greater the collected water amount should be. Therefore, the problem of reservoir depth should be treated dialectically.
- (2)
- Permeability of coal pillar dam is also an essential factor affecting the leakage. It can be seen from the above simulation that the higher the permeability of the coal pillar dam, the greater the leakage. It is suggested that the coal seam with low permeability and complete structure should be selected as far as possible to build the reservoir to ensure the anti-seepage performance of the reservoir. At the same time, for coal seams with coal seam permeability higher than 1 × 10⁻¹⁵ m2, the anti-seepage performance of the coal pillar dam should be strictly demonstrated, or anti-seepage reinforcement measures should be taken.
- (3)
- Compared with constant water pressure storage, periodic water pumping and storage operation also help to reduce leakage. Therefore, the water pumping and storage operation should be brought into the water-drainage management of the mining area at the site—to give full play to the water regulation function in the mining area, to effectively reduce the leakage and improve the anti-seepage and stability of the coal pillar dam.
- (4)
- When the coal pillar dam is damaged, permeability increased in the damaged zones; this will increase pore pressure in the lateral range, about three times of the distance of damaged area. At the same time, due to the existence of damaged zones, water leakage increased significantly (increased by 99% in this case). Therefore, if there is inevitable coal pillar damage in the site, before a formal water storage reservoir, measures such as dam seepage prevention and coal pillar reinforcement are suggested to effectively prevent the occurrence of damaged zones and significantly increase the leakage. The proposed measures and methods also include: spraying anchor on the surface of the coal pillar near the water and supporting with pre-stressed bolt through layers.
7. Conclusions and Recommendations
- (1)
- Once the overburden fracture zone of the coal mine underground reservoir is filled with water and the reservoir is connected with the upper water system, the water pressure in the reservoir area will be significantly increased, resulting in a substantial increase in leakage. When the water pressure is 100–300 m in water column height, the leakage is 8.19–24.66 times that of the not connected. Therefore, in the site, people should monitor the change in water pressure and, if necessary, pump water to relieve stress in time.
- (2)
- The permeability of the coal pillar dam also influences the leakage significantly. As the permeability decreased from 1 × 10⁻¹⁴ m2 to 1 × 10⁻¹⁷ m2, the accumulated water leakage decreased from 4.59 × 10⁷ m3 to 9.39 × 10⁵ m3, and the pore pressure also reduced considerably. To build an underground reservoir, coal seams with low permeability and good integrity should be selected as far as possible. It is suggested that the permeability of the coal pillar dam should not be greater than 1 × 10⁻¹⁵m2.
- (3)
- The anti-seepage and safety of the coal pillar dam will be significantly improved by periodic water pumping and storage operations. After 30 years of service, the leakage amount decreased to 51.9% of that under constant water pressure storage. Within the range of 0.4 m in the reservoir side of the coal pillar, the pore pressure rapidly reduces by nearly half, dramatically improving the coal pillar’s safety performance. Therefore, periodic water pumping and storage operations can not only give full play to the reservoir regulation function but also effectively reduce the leakage and improve the safety performance of coal pillars.
- (4)
- When the coal pillar dam is damaged and its permeability increased, both the pore pressure and leakage amount increased significantly. The existence of the damaged area will bring hidden dangers to the further weakening of the coal pillar dam. At the same time, it will also lead to a substantial increase in leakage (about a 99% increase in this case), which is unfavorable for seepage control. Therefore, before storing water, it can be considered to take measures such as shotcreting the anchor and penetrating the layer anchor to prevent the damage on the reservoir side of the dam body.
Author Contributions
Funding
Acknowledgments
Conflicts of Interest
References
- Gu, D.Z. Water Resource Protection and utilization engineering technology of coal mining in “Energy Golden Triangle” Region. Coal Eng. 2014, 46, 34–37. [Google Scholar]
- Gu, D.Z. Technology Development and Engineering Practice for Protection and Utilization of Water Resources in Coal Mining in Western China. Front. Eng. Manag. 2016, 3, 59–66. [Google Scholar] [CrossRef]
- Liu, J.; Zhao, Y.; Tan, T.; Zhang, L.; Zhu, S.; Xu, F. Evolution and modeling of mine water inflow and hazard characteristics in southern coalfields of China: A case of Meitanba mine. Int. J. Min. Sci. Technol. 2022, 32, 12. [Google Scholar] [CrossRef]
- Xie, X.; Hou, E.; Long, T.; Feng, D.; Hou, P.; Wei, Q.; Li, Y.; Liu, J. Study on Evaluation and Prediction of the degree of Surface Damage caused by Coal Mining. Front. Earth Sci. 2022, 9, 805248. [Google Scholar] [CrossRef]
- Qiao, W.; Li, W.; Li, T.; Chang, J.; Wang, Q. Effects of Coal Mining on Shallow Water Resources in Semiarid Regions: A Case Study in the Shennan Mining Area, Shaanxi, China. Mine Water Environ. 2017, 36, 104–113. [Google Scholar] [CrossRef]
- Hou, E.; Xie, X.; Wang, S.; Long, T.; Shi, Z.; Yang, Z.; Huang, Y.; Xie, Y.; Chen, Z.; Bai, K.; et al. Study on the dynamic law and mechanism of groundwater induced by medium-deep coal mining: A case study from one coal mine. J. China Coal Soc. 2022. Available online: http://kns.cnki.net/kcms/detail/11.2190.TD.20210427.1622.004.html (accessed on 14 June 2022).
- Wu, H.Q.; Wu, H.F. Demonstration of the influences of coal mining on water resource environment-Taking the dam of Wenyuhe Reservoir as an Example. SCI-Technol. Inf. Dev. Econ. 2011, 2, 177–179. [Google Scholar]
- Gu, D.Z. Water resource and surface ecology protection technology of modern coal mining in China’s energy “Golden Triangle”. Strateg. Study CAE 2013, 15, 102–107. [Google Scholar]
- Cao, Z.G.; Li, Q.S.; Dong, B.Q. Water resource protection and utilization technology and application of coal mining in Shendong Mining Area. Coal Eng. 2014, 46, 162–164, 168. [Google Scholar]
- Gu, D.Z. Theory framework and technological system of coal mine underground reservoir. J. China Coal Soc. 2015, 40, 239–246. [Google Scholar]
- Gu, D.Z.; Zhang, Y.; Cao, Z.G. Technical progress of water resource protection and utilization by coal mining in China. Coal Sci. Technol. 2016, 1, 1–7. [Google Scholar]
- Gao, R.; Wu, F.; Zou, Q.; Chen, J. Optimal dispatching of wind-PV-mine pumped storage power station: A case study in Lingxin Coal Mine in Ningxia Province, China. Energy 2022, 243, 123061. [Google Scholar] [CrossRef]
- Xie, H.P.; Hou, Z.M.; Gao, F. A new technology of pumped-storage power in underground coal mine: Principles, present situation and future. J. China Coal Soc. 2015, 40, 965–972. [Google Scholar]
- Wang, Q.; Li, W.; Li, T.; Li, X.; Liu, S. Goaf water storage and utilization in arid regions of northwest China: A case study of Shennan coal mine district. J. Clean. Prod. 2018, 202, 33–44. [Google Scholar] [CrossRef]
- Fan, J.Y.; Xie, H.P.; Chen, J.; Jiang, D.; Li, C.; Tiedeu, W.N.; Ambre, J. Preliminary feasibility analysis of a hybrid pumped-hydro energy storage system using abandoned coal mine goafs. Appl. Energy 2020, 258, 114007. [Google Scholar] [CrossRef]
- Kitsikoudis, V.; Archambeau, P.; Dewals, B.; Pujades, E.; Orban, P.; Dassargues, A.; Pirotton, M.; Erpicum, S. Underground Pumped-Storage Hydropower (UPSH) at the Martelange Mine (Belgium): Underground Reservoir Hydraulics. Energies 2020, 13, 3512. [Google Scholar] [CrossRef]
- Bodeux, S.; Pujades, E.; Orban, P.; Dassargues, A. Mines as Lower Reservoir of an UPSH (Underground Pumped Storage Hydroelectricity): Groundwater Impacts and Feasibility. EGU General Assembly Conference, Vienna, Austria, April 2016. Available online: http://ui.adsabs.harvard.edu/abs/2016EGUGA..18.3047B/abstract (accessed on 6 April 2022).
- Menendez, J.; Loredo, J.; Vega, M.G.; Fernández-Oro, J.M. Energy storage in underground coal mines in NW Spain: Assessment of an underground lower water reservoir and preliminary energy balance. Renew. Energy 2019, 134, 1381–1391. [Google Scholar] [CrossRef]
- Menendez, J.; Loredo, J. Numerical modelling of water subsurface reservoirs during the operation phase in underground pumped storage hydropower plants. E3S Web Conf. 2020, 152, 02001. [Google Scholar] [CrossRef]
- Wang, F.; Liang, N.; Li, G. Damage and Failure Evolution Mechanism for Coal Pillar Dams Affected by Water Immersion in Underground Reservoirs. Geofluids 2019, 2019, 2985691. [Google Scholar] [CrossRef]
- Yao, Q.; Tang, C.; Xia, Z.; Liu, X.; Zhu, L.; Chong, Z.; Hui, X. Mechanisms of failure in coal samples from underground water reservoir. Eng. Geol. 2020, 267, 105494. [Google Scholar] [CrossRef]
- Yao, Q.; Yu, L.; Chen, N.; Wang, W.; Xu, Q. Experimental Study on Damage and Failure of Coal-Pillar Dams in Coal Mine Underground Reservoir under Dynamic Load. Geofluids 2021, 2021, 5623650. [Google Scholar] [CrossRef]
- Xin, F.; Xu, H.; Tang, D.; Chen, Y.; Cao, L.; Yuan, Y. Experimental study on the change of reservoir characteristics of different lithotypes of lignite after dehydration and improvement of seepage capacity. Fuel 2020, 277, 118196. [Google Scholar] [CrossRef]
- Xue, Y.; Cao, Z.Z.; Dang, F.N.; Wang, S.H.; He, M.M.; Du, F. Effect of Damage on gas seepage mechanism in coal seam based on a coupled model. Therm. Sci. 2019, 23, 1323–1328. [Google Scholar] [CrossRef]
- Tang, C.; Yao, Q.; Xu, Q.; Shan, C.; Xu, J.; Han, H.; Guo, H. Mechanical failure modes and fractal characteristics of coal samples under repeated drying–saturation conditions. Nat. Resour. Res. 2021, 30, 4439–4456. [Google Scholar] [CrossRef]
- Jia, W.Q.; Liu, Z.H.; Hu, Y.Q.; Chang, Z.X. Research on coupling process of pyrolysis and seepage of coal mass. Min. Res. Dev. 2010, 3, 40–42. [Google Scholar]
- Yin, G.Z.; Zhang, D.M. Transport and gathering of Gas within fractured surrounding rock in deep coal mining. Sci. Technol. Inf. 2016, 6, 170–173. [Google Scholar]
- Shi, X.C.; Meng, Z.P. Coupling effect of mining-induced strain field and permeability coefficient field in surrounding rock of working face. Coal Geol. Explor. 2018, 46, 143–150. [Google Scholar]
- Ma, D.; Duan, H.; Zhang, Q.; Zhang, J.; Li, W.; Zhou, Z.; Liu, W. A Numerical Gas Fracturing Model of Coupled Thermal, Flowing and Mechanical Effects. Comput. Mater. Contin. 2020, 65, 2123–2141. [Google Scholar] [CrossRef]
- Ma, D.; Duan, H.; Zhang, J.; Liu, X.; Li, Z. Numerical Simulation of Water–Silt Inrush Hazard of Fault Rock: A Three-Phase Flow Model. Rock Mech. Rock Eng. 2022, 55, 5163–5182. [Google Scholar] [CrossRef]
- Ma, D.; Duan, H.; Zhang, J. Solid grain migration on hydraulic properties of fault rocks in underground mining tunnel: Radial seepage experiments and verification of permeability prediction. Tunn. Undergr. Space Technol. 2022, 126, 104525. [Google Scholar] [CrossRef]
- Li, J.H. Experimental study of water storage soaking of coal mine underground reservoir to coal pillar dam body strength. Coal Min. Technol. 2018, 23, 9, 15–17. [Google Scholar]


| Rock Stratum | Porosity (%) | Permeability (m2) |
|---|---|---|
| Overlying strata | 7 | 2 × 10⁻¹⁷ |
| Coal pillar dam body | 10 | 1 × 10⁻¹⁵ |
| Underlying strata | 6 | 1 × 10⁻¹⁷ |
Publisher’s Note: MDPI stays neutral with regard to jurisdictional claims in published maps and institutional affiliations. |
© 2022 by the authors. Licensee MDPI, Basel, Switzerland. This article is an open access article distributed under the terms and conditions of the Creative Commons Attribution (CC BY) license (https://creativecommons.org/licenses/by/4.0/).
Share and Cite
Zhang, Z.; Guo, Q.; Liu, W. Evaluation of Long-Term Tightness of the Coal Pillar Dam of Underground Reservoir and Protection Countermeasures. Energies 2022, 15, 7229. https://doi.org/10.3390/en15197229
Zhang Z, Guo Q, Liu W. Evaluation of Long-Term Tightness of the Coal Pillar Dam of Underground Reservoir and Protection Countermeasures. Energies. 2022; 15(19):7229. https://doi.org/10.3390/en15197229
Chicago/Turabian StyleZhang, Zhixin, Qiang Guo, and Wei Liu. 2022. "Evaluation of Long-Term Tightness of the Coal Pillar Dam of Underground Reservoir and Protection Countermeasures" Energies 15, no. 19: 7229. https://doi.org/10.3390/en15197229
APA StyleZhang, Z., Guo, Q., & Liu, W. (2022). Evaluation of Long-Term Tightness of the Coal Pillar Dam of Underground Reservoir and Protection Countermeasures. Energies, 15(19), 7229. https://doi.org/10.3390/en15197229