Abstract
An increase in the share of renewables in heat supply systems is a promising direction to reach sustainable development goals and decarbonization. Decision makers should consider various factors, including energy market prices, the availability of biofuels, boiler and auxiliary equipment costs, logistic costs, and the taxation system. In the European Union, the energy crisis causes a rapid increase in fossil fuel prices. Moreover, the use of fossil fuels results in greenhouse gas emissions, which threatens the achievement of sustainable development goals. We studied the influence of the delivery cost and the value of environmental tax rates on the levelized cost of heat. Low-capacity boilers (up to 1 MW) and different fossil and renewable fuels were analyzed. An analysis was carried out on the example of Ukraine. The European trends were factored in. The obtained results showed that biofuel boilers had lower levelized costs of heat than fossil fuel boilers. Delivery costs and environmental taxes have a significant impact on heat energy costs.
1. Introduction
In 2019, the European Commission put forward the concept of the European Green Deal [1], the goal of which is to create a modern climate-neutral, resource-saving, and competitive economy. The key areas of this course are the transition to the use of clean energy, the fight against climate change, reducing environmental pollution, etc. The EU aims to become climate neutral by 2050, and to this end, most EU countries need to phase out coal, the largest global source of emissions, by 2030. Even the global energy crisis, which began in 2021, did not seem to be able to stand in the way of achieving these goals. However, the rapid increase in energy resource prices and their shortage in Europe during the last months of 2022 has created new challenges for achieving environmental goals in the EU and Ukraine.
In early 2020, Ukraine’s 2050 Green Energy Transition Concept [2] project was presented, which, in general, sets goals close to the goals of the European Green Deal. According to this plan, energy efficiency and renewable energy sources are becoming the priority areas of Ukraine’s green energy transition. Carbon dioxide, which is released when fossil fuels are burned, is the most common greenhouse gas in the world. A decrease in carbon dioxide emissions results in a gradual abandonment of fossil fuels in favor of renewable energy sources [2].
The climatic conditions of Ukraine are similar to those in some European countries. In these countries, the heating season lasts around six months. Their heat supply systems use primarily organic-fuel-based boilers.
Most EU countries, including Ukraine, use natural gas, coal, electricity, and biofuels for heat generation. The problems of their energy security and the diversification of energy imports, especially natural gas, are becoming more acute. The relevance of the replacement of fossil fuels with biomass has significantly increased.
In many countries, including Ukraine, there are areas, especially in the countryside, where the existing power grids do not allow consumers to use electric boilers with a capacity of more than 500 kW. This makes them use fuel-based boilers, which is why these boilers were the subject of our study.
Biomass-based fuels, such as wood chips, wood pellets, sunflower husk pellets, straw briquettes, straw peat, wood, and peat briquettes, are manufactured and used for heat generation in Ukraine. Ukrainian companies manufacture biomass boilers taking into account the characteristics of burning these types of fuels for both domestic and industrial consumers. In 2020, the total primary energy supply was 3617.39 TJ, including biofuels, and the generated waste was 177.52 TJ (according to Energy balance of Ukraine 2020). The domestic supply of solid biofuel was 137,539 TJ.
Among the reasons that stand in the way of investments for their implementation in Ukraine, we can single out the imperfection of environmental taxation, constant increase in environmental tax rates, frequent price changes for various types of fuels, significant exchange rate fluctuations, etc.
The importance of research is also confirmed by a significant number of relevant publications in the direction of this study. Articles [3,4,5,6,7,8,9,10,11,12,13,14,15,16,17,18,19,20,21,22,23,24,25] were devoted to various aspects of burning biofuels. Celebi et al. [3] examined combined heat supply systems that use lignocellulosic biomass. Cheney and Deo [4] studied wood-based biofuels for heat supply systems. They revealed that wood chips could substitute up to 80% of fossil fuel. Jasinskas et al. [5] analyzed the possibilities of using reeds for energy purposes and provided the results of experimental studies on their use for the production of heat energy; in particular, they determined the elemental composition of reed pellets, ash content, and calorific value, and the impact on the environment during their burning. Kim et al. [6] suggested the novel concept of a decentralized biorefinery to substitute hard coal. The objective of another study [7] was to determine the optimal combination of biochar and bio-oil production and its end use to achieve environmental and economic benefits using a life cycle assessment and costing approach. Musule et al. [8] analyzed conventional and wood-based residential heat supply systems. Rover et al. [9] developed a novel biomass-based fuel that can be used for co-firing in coal power plants. This novel biofuel reduces the emissions of sulfur and nitrogen compounds. Sawai et al. [10] examined alternative torrefied solid biofuel to be used by coal-fired boilers and power plants. Bermúdez et al. [11] used an Eulerian fixed-bed biomass combustion model coupled with the commercial CFD code ANSYS-Fluent to simulate a large-scale moving grate biomass furnace. Karim et al. [12] developed a 3D CFD model for biomass combustion in a moving grate furnace. Shi et al. [13] constructed a supercritical oxyfuel combustion system based on a CFB boiler burning coal, lignite, and sawdust to evaluate the performance of the system. Another study [14] presented the results of the experimental studies of the ignition processes of a large set of wood-coal composite fuel particles under the conditions of high-temperature radiative–convective heating. Verma et al. [15] conducted studies in which one multi-fuel domestic pellet boiler (40 kW) was tested under standard laboratory conditions when burning eight different biomass pellets, and two boilers (35 kW) were tested under real conditions when burning DIN plus certified wood pellets. Björnsson et al. [16] studied the integration of a pyrolysis plant into an existing CHP plant. Mustapha et al. [17] analyzed how the growth of biofuel production in forests affects fuel use in the district heating sector in northern Europe. Duong et al. [18] investigated Acacia mangium solid biofuel characterization and its ash properties. García et al. [19] investigated the joint pelletization of spent fuel and pine sawdust in a continuous pilot pelletizer, which resembles industrial pelletization. The purpose of another study [20] was to evaluate the suitability of residual biomass of conifers and broad-leaved trees to produce quality pellets using an agri-pellet machine activated by the power take-off of a tractor. Nuryawan et al. [21] investigated the main properties of mangrove branches as a raw material for the production of wood pellets and briquettes. Petlickaitė et al. [22] conducted a study of compressed solid biofuel produced from multi-culture biomass. The purpose of article [23] was to determine the variability of the quality parameters of wood chips produced from the most favorable raw material (energy round forest) and under the most controlled operating conditions (pellet mill) as a first step in determining the opportunities to optimize wood chip quality monitoring. Woo et al. [24] studied the characteristics of solid fuel pellets containing spent coffee grounds and wood powder. Souček et al. [25] dealt with the production of mixed fuels, in particular pellets consisting of a mixture of grass and sawdust.
Many studies [26,27,28,29,30,31,32,33,34,35,36,37,38,39,40] were devoted to the various environmental aspects of using different types of fuel. Kraszkiewicz et al. [26] investigated the effect of ignition techniques on pollutant emissions during the combustion of selected solid biofuels. Zaporozhets [27] carried out a correlation analysis between the energy balance components (the types of energy resources, the transformation sector, and energy-consuming industries) and the emissions of pollutants. Iatsyshyn et al. [28] studied the problem of the impact the storage places of ash and the slag dumps of fuel and energy complex enterprises can have on the environment. Experimental results were obtained from the combustion of raw and torrefied palm kernel shells in a domestic-scale boiler [29]. Zajac et al. [30] analyzed the emission characteristics of a domestic heating boiler (32 kW with automatic fuel loading) fueled with mallow pellets and wood pellets. Duong et al. [31] explored wood pellets for non-industrial applications. Havrysh et al. [32] studied the distribution of input energy and carbon dioxide emissions between the main product and the crop residues during the growing process. Bala-Litwiniak [33] presented an analysis of the combustion of pine husk and sunflower pellets without and with a 5% addition of spent glycerol, and the effect of the addition of spent glycerol on the concentrations of CO2, CO, and NOX in the exhaust gases was studied. The aim of another study [34] was to investigate the use of an electrostatic precipitator to control particulate emissions from small heating installations, in particular, solid fuel boilers with a heating output of less than 300 kW. Zhou et al. [35] conducted a study of a cleaner way of burning wood biomass waste on a grate with an emphasis on NOX emissions. Nong et al. [36] used the GTAP-E-Power model, with additional improvements to include non-CO2 emissions, to study the impact of increasing environmental taxes on the Vietnamese economy. Wang et al. [37] presented an original interdisciplinary performance-based contract evaluation model for controlling SO2 emissions in Chinese coal-fired power plants. Wesseh et al. [38] developed a dynamic applied equilibrium model to study the dynamics of CO2 emissions and assessed how the achievement of environmental policy goals may affect production and productivity in a transition country. Foumani et al. [39] considered how three general emission reduction policies, namely emission taxes, emission benchmarks, and emission trading schemes, can create a competitive environmental sphere. The chemical compositions of 40 samples of wood chips of various genera and origins were analyzed by Rodríguez et al. [40].
Many studies were devoted to the various economic aspects of the study of prospects for the use of biofuels, in particular using the LCOH indicator [41,42,43,44,45,46,47,48,49,50,51,52,53,54,55,56,57,58,59,60,61,62,63]. Coelho et al. [41] analyzed several basic power plants and hybrid biomass options: wood gasification, fuel pellets from garbage, biogas from anaerobic reactor wastewater, landfill biogas, and natural gas. The simulation model developed by Fujii et al. [42] was used to predict the performance of a heat charger, based on which a case study of heat transport between a local steel plant and a hotel was studied, and a comparison of the LCOE with a pellet boiler was made. Gerssen-Gondelach et al. [43] explored the current status and possibility of biomass value chains for energy generation and material manufacturing. They estimated their levelized production costs and emission reduction. Moreover, they found that woodchip combustion and pellets in large power plants and central heating systems are economically and environmentally preferred. Article [44] stated that the combination of geothermal district heating from medium and deep wells with heat from waste incineration creates a synergy that achieves above-average price competitiveness and economic impact. Ruffino et al. [45] estimated the LCOH for the most common heating technologies in Piedmont (NW Italy), i.e., fossil fuels (methane, fuel oil, and liquefied petroleum gas), wood biomass (wood logs and pellets, etc.), and heat pumps (air source and ground source) in both heating only systems as well as heating and cooling configurations. The authors of [46] presented a new approach to the analysis of multi-vector energy systems and proposed the levelized cost of exergy (LCOEx) as a new useful indicator in this field. Technical and economic analyses and a life cycle analysis of the ways of the biochemical transformation of seaweed as a sustainable source of bioenergy were carried out [47]. Kargbo et al. [48] conducted a similar study for fuel from lignocellulosic sources. Article [49] was devoted to the modeling of the cost-optimized technological integration of fuel production using the method of hydrothermal liquefaction. The authors in [50] showed that a price model based on the LCOH can clearly reflect the production cost of heat. Article [51] examined the economic feasibility of commercial heat supply technologies suitable for use in district heating networks. Article [52] analyzed and evaluated the possibilities of using oak bark, oak leaves, and their mixtures for obtaining biofuel. Lehtinen et al. [53] studied the structure of the supply chain of wood chips from harvest to thermal power plant using the example of Finland. Van Stralen et al. [54] analyzed the distribution of different biomass feedstocks in the heat, power, and transport sectors up to 2020 for different biomass use scenarios. Leisen et al. [55] studied new sustainable business models in the energy sector using the example of Germany. Andreoni [56] carried out a comparative analysis of factors influencing the receipt of environmental taxes in 25 EU members from 2004–2016. Zhang et al. [57] studied the impact of a carbon tax on tourism development in terms of energy consumption in China through modeling. Nong [58] proposed a new carbon price mechanism with full emission coverage to improve the ability and accuracy of climate change assessment and energy policy. Kondo et al. [59] proposed green procurement solutions for supplier selection and order quantity to minimize greenhouse gas emissions and costs, taking into account different carbon taxes in different countries. Streimikiene et al. [60] conducted a comparative assessment of the impact of environmental taxes on the indicators of sustainable energy development in three selected countries of the Baltic region (Lithuania, Latvia, and Estonia) during 2005–2015. Nissen et al. [61] proposed a modification of the traditional equalized energy cost formula that takes into account the increase in energy prices. Zang et al. [62] carried out a techno-economic comparative analysis of biomass-integrated gasification combined cycles with and without CO2 capture. Zang et al. [63] suggested a hypothesis concerning the possibility of developing an integrated methodology for assessing the potential of biogas based on the integration of crop residues and livestock manure.
The studies in [64,65,66] are most relevant to this study. Bogoslavska et al. [64] determined the LCOH for boilers with a capacity from 100 to 1000 kW. They analyzed different fossil (natural gas and anthracite) and renewable fuels (wood pellets, sunflower husk pellets, straw briquettes, etc.). Specific pollutant emissions were calculated. The authors of [65] showed that the amount of environmental tax in Ukraine does not stimulate the implementation of measures to reduce pollutant emissions, but an increase in environmental tax rates can change it. The purpose of the article [66] was to analyze the impact of the delivery logistics of different types of fuel for low-capacity boilers (0.5 and 1 MW, burning biofuel) on the LCOH. This study showed that the cost of delivering pellets from the producer to the consumer can be up to 20% of their cost.
However, in those conditions when the energy market is changing sharply, the LCOH of biomass boilers and their comparison with conventional boilers are not studied enough. The LCOH structure is also of scientific and practical interest. The purposes of the present study are to analyze the trends of changes in the LCOH for fossil fuel and biofuel boilers in Ukraine, which increases the validity of management decisions in the field of the development of environmentally and economically efficient heat supply systems, and to determine the contribution of the environmental tax and delivery logistic components to the LCOH.
The novelty of this study is its analysis of the LCOH for biomass-based boilers in specific geographical and climate conditions. These conditions are characterized by limited fossil fuel reserves. The territory is predominantly steppe, with sparse forests. Highly developed agriculture is a source of biomass as a raw material for energy production. The study was conducted using the example of Ukraine as a country that satisfies the above conditions.
Two hypotheses were set up:
Hypothesis 1 (H1).
The economic competitiveness of biofuel boilers is stable to the fluctuation of market fuel prices.
Hypothesis 2 (H2).
The use of agricultural residue-based pellets ensures the lowest LCOH compared with wood and fossil fuels.
In addition, the authors show that the existing environmental taxation in Ukraine does not stimulate the implementation of measures to reduce the emissions of pollutants. Moreover, we should note that the introduction of a global approach to the taxation of carbon dioxide emissions from biofuel burning, and a significant increase in the share of biofuel boilers in heat supply systems in Ukraine will contribute to both decarbonization and an increase in the country’s energy security level.
2. Materials and Methods
2.1. Levelized Cost of Heat
The method of the levelized cost of energy is widely used for economic comparison of energy projects using different fuel types [67]. The levelized cost of heat (LCOH) is used for determining the optimal heating projects [43,45,50,64,65,66]. This method allows you to compare different heat production technologies. To calculate the LCOH, the following formula is used:
where It is the initial investment costs in tth year, USD; Mt is the operations and maintenance costs of the heat supply system in tth year, USD; Ft is the fuel costs in tth year, USD; Ht is the heat generation in tth year, GJ; r is the discount rate; N is the lifetime of the project, year.
The knowledge of the LCOH allows investors to select promising heat generation technologies for any country or region. Moreover, this simplifies the prediction of the cost structure for each technology [66].
As the environmental requirements for boilers and the rate of environmental tax are constantly increasing, the environmental factor must be taken into account when determining the LCOH [64]. We determined the environmental tax based on Chapter VIII of the Tax Code of Ukraine [68].
Biofuel costs comprise their production costs and delivery costs. If we add the environmental tax, Formula (1) is transformed into the following expression:
where is the environmental tax in tth year, USD; is the fuel delivery costs in tth year, USD.
The impact of the environmental tax and logistic costs on the LCOH is of scientific and practical interest. The change in the LCOH due to the environmental tax () is determined as follows:
The impact of delivery costs is as follows:
2.2. Discount Rate
The discount rate is used in financial analyses to find the present value of future cash flows. There are three primary methods to calculate the discount rate: the capital asset pricing model (CAPM), the weighted average cost of capital (WACC), and the cumulative method [69]. Scientists substantiated that due to the poorly developed Ukrainian stock market, the cumulative method is more suitable to be applied [69,70].
It must be borne in mind that the transition from fossil fuels to renewables is not considered in commercially invested projects in the world because they curb global warming. In these projects, a social discount rate should be used [71]. In developed countries, a discount rate ranges from 2% to 6% [72]. The major developing countries apply a discount rate of up to 15% [73]. Zuniga et al. [74] revealed that the discount rate of social projects must be around 10%. Therefore, we used a 10% discount rate in this study.
2.3. Logistics
In addition to the choice of boilers and the type of fuel, the correct and efficient organization of delivery is important, which will ensure the timely receipt of orders and the stable operation of boiler plants. Additionally, the transportation process must take into account the characteristics of the fuel and ensure protection from negative external factors (protection of pellets from moisture, precipitation, and mechanical damage). A logistic system impacts the profitability of any heat supply system. The delivery of solid fuel can be carried out in different ways (in bulk, in big bags, in ordinary bags) and by different means of transport (water, rail, and road). The choice of the specific means of transport directly depends on the location of the consumer. Water transportation is the cheapest for long distances. Road transport is relatively expensive for long distances. However, it is convenient and competitive for short distances. Pellets are the most convenient biofuel for transportation and use. They have a constant and high bulk density, which greatly simplifies the process of transporting fuel even long distances, and loading and unloading are easy to automate, which significantly facilitates and speeds up both processes. Bags and bunkers are used to transport pellets. Their prices include production costs, loading, unloading, and transportation costs. The transportation of biofuels is discussed in more detail in the article [35].
We considered pellets packed in big bags (weight—one ton, volume—1.54 cubic meters). Delivery by road transport with a carrying capacity of 20–22 t and a distance of 300 km was considered. This distance is the average within one region of Ukraine.
2.4. Environmental Tax
Environmental taxes are fiscal instruments. They are used for stimulating sustainable development. Therefore, they have a significant impact on the development of heat supply systems and the use of alternative fuels. The environmental tax was calculated based on the annual fuel consumption and the kind of fuel. We used the following information: the thermal power, the thermal efficiency, the annual operating time, the load factor, the lower heating value of fuel, the emission factors, and the environmental tax rate [64,65,66].
In Ukraine, the heat-generating enterprises that use biofuel are taxpayers for CO2 emissions, which does not correspond to modern world practice, since biofuel is considered a CO2-neutral fuel. However, according to the Tax Code of Ukraine [68], the tax base for carbon dioxide emissions is 500 tons/year.
In 2010, Ukraine introduced an environmental tax for carbon dioxide emissions of 0.025 USD/tCO2. Since 2022, this tax rate has increased to 1.075 USD/tCO2. The tax rates for different pollutants increase every year.
According to the current Tax Code of Ukraine [68], the environmental tax is paid for the emissions of pollutants by stationary sources; therefore, the tax for the emissions by vehicles was not considered in this article.
The emission factors for the different fuels fired in boilers are presented in Appendix A. The tax rates for the stationary sources of pollution (heating boilers) are presented in Table 1 [68]. Tax rates in EU countries differ tenfold. Poland uses the lowest taxes in the EU, and Sweden has the highest ones (Table 1).

Table 1.
Emission tax rates in Ukraine, Poland, and Sweden, USD/t [68,75,76].
2.5. The Fuel Price and Delivery Costs
Since 2016, in Ukraine, fuel prices have significantly increased (Table 2). The costs and lower heating value of fuels (no delivery costs) are given in Table 2 [77,78,79,80,81].
Table 2.
The costs and lower heating values of fuels [64,65,66,77,78,79,80,81].
Since January 2020, the state regulator has changed the procedure for paying for natural gas distribution services, and a separate payment and tariff for gas distribution (delivery) has been developed [82]. Since August 2020, the retail price of natural gas, in particular for household consumers, is freely set between the supplier and the consumer; that is, it is contractual [83]. In September 2020, the gas delivery rates ranged from 11.95 to 116.5 USD/(1000 m3) [84], and an average of 42.67 USD/(1000 m3) was used in our calculations. In 2022, the gas delivery rates varied from 13.66 to 104.98 USD/(1000 m3) [84], and the average value was 63.66 USD/(1000 m3). In the heating period of 2021–2022, budget and communal institutions bought natural gas at the price of 1244.67 to 1600.28 USD/(1000 m3) despite the conclusion of the Memorandum with Naftogaz [85] about the price of 586.77 USD/(1000 m3) [86]; therefore, in our calculations for January 2022, a natural gas price of 1422.48 USD/(1000 m3) was accepted. For industry, at the same time, the price was 1891.84 USD/(1000 m3) [87]. The significant increase in natural gas prices caused an increase in pellet prices. Vehicle fuels and their delivery prices [88] increased less. For trucks with a load capacity of 20–22 tons, the delivery cost was 0.96 USD/km (January 2022) and 1.6–1.78 USD/km in July 2022 [88].
2.6. The Boiler Costs
We studied solid fuel boilers manufactured by Ukrainian companies. They have capacities of 500 and 1000 kW. We analyzed the use of fossil fuels (natural gas and coal) and renewable ones (sunflower husk, straw, and wood pellets). The boiler prices are presented in Table 3 [83,89,90,91]. As can be seen, their prices rose in price by 49–117% from 2016 to 2022 (Table 3).
Table 3.
Main characteristics of boilers and costs in 2016, 2020, and 2022 [33,34,35,89,90,91].
3. Results and Discussion
3.1. The Evaluation of LCOH in 2016–2022
The LCOH was calculated at the market prices of 2016, 2020, and 2022. The LCOH comprises the thermal energy costs, the environmental tax (LCOHET), and the delivery costs (LCOHDL). The results are shown in Table 4.
Table 4.
LCOH and its components in 2016, 2020, and 2022, USD/GJ.
In general, the more expensive the fuel, the more expensive the thermal energy. For six years, the heat energy generated by sunflower husk boilers was the cheapest, and straw pellets were slightly more expensive. The LCOH from wood pellet boilers and coal boilers was comparable. Since 2016, the levelized cost of heat has increased by at least four times. The heat generated by natural gas boilers has had the largest increase.
The trend of a significant increase in the price of all types of fuel over the last year is obvious, but there was an exception—from 2016 to 2020, the value of wood pellets decreased by 20%, and the growth rate of their value was the lowest—three times in 5 years. The price of sunflower husk pellets increased the most time, in 5 out of the past 6 years, but the cost of thermal energy obtained from their burning was the lowest. The difference between the minimum and maximum LCOH for the period was 1.5–2.8 times.
The fuel component for biofuel boilers ranged from 68% to 93% in 2016, and from 90% to 97% in July 2022. This increase in the share of fuel components in the LCOH was caused by a significant increase in the cost of all types of fuel. The LCOH was not significantly affected by doubling the boiler capacity. The main reason is that the share of investment costs in the LCOH was less than 5% (Figure 1).
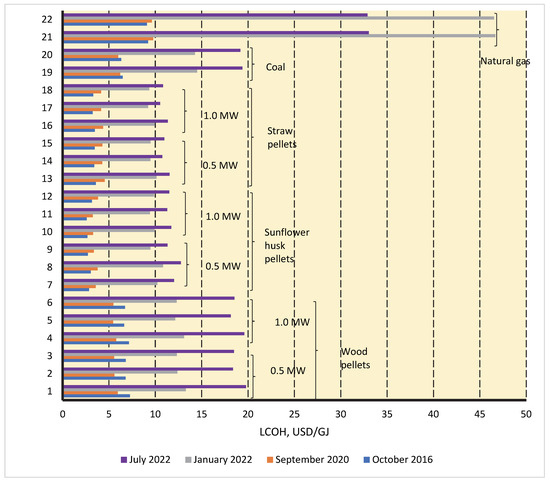
Figure 1.
The evolution of LCOH (the number on the x-axis corresponds to the first column in Table 4).
We found that, in Ukraine, the LCOH of biomass-fired boilers ranged from EUR 35.2/MWh to EUR 56.3/MWh. These values were lower than the LCOH for natural gas-fired boilers (EUR 100.2/MWh). This ratio is consistent with European countries. For instance, Ruffino et al. [45] reported that, in Italy, the LCOH of biomass-fired boilers is lower than the LCOH of fossil fuels. Its value ranges from EUR 72.1/MWh to EUR 118.7/MWh. In France, the situation is the same. The LCOH is around EUR 87/MWh [92]. In Poland and Switzerland, the LCOH is somewhat higher [93,94]. The attractiveness of alternative fuels is determined by the ratio of their prices to traditional fuels [95].
3.2. Environmental Tax and Delivery Logistic Components
In 2022, coal boilers had the highest LCOH environmental tax component (∆LCOHET) of 0.30–0.34 USD/GJ. Gas boilers had the smallest one of 0.007–0.032 USD/GJ. For biofuel boilers, this component was 0.039–0.114 USD/GJ or 0.26–0.94% of the LCOH. The trend has not changed in the past six years. The environmental tax component had the minimum value for 500 kW boilers that burn wood pellets. In addition, 1 MW boilers firing sunflower husk pellets had the maximum environmental tax component.
According to our calculations, the LCOH logistic component (a transport distance of 300 km) increased from 4.4–11.6% in January 2022 to 5.9–16% in July 2022. The minimum value was for burning natural gas boilers, while the maximum was for burning straw pellet boilers. The smallest component for biofuel boilers was for burning wood pellet boilers.
In January 2022, the LCOH (taking into account environmental taxes and logistics) of solid fuel boilers was more than half as much as from gas boilers (Figure 2). The LCOH from coal boilers was on the same level as the LCOH from the boilers burning wood pellets. In July 2022, the LCOH difference significantly decreased (Figure 3).
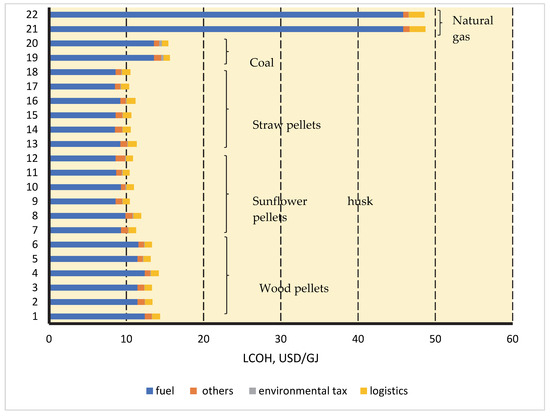
Figure 2.
LCOH structure in January 2022 (the number on the x-axis corresponds to the first column in Table 4).
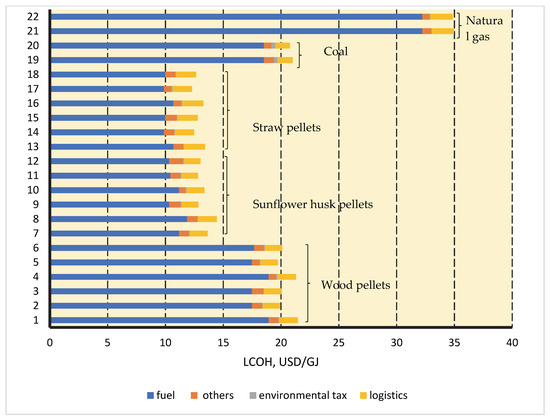
Figure 3.
LCOH structure in July 2022 (the number on the x-axis corresponds to the first column in Table 4).
The LCOH components of the environmental tax and logistics for biofuel boilers increased during January–July 2022 from 0.96–1.17 USD/GJ to 1.56–1.88 USD/GJ, which in percentage terms was from 7.4–13.5% to 7.7–18%. The LCOH of other non-fuel components did not significantly change and in monetary terms were less than the environmental tax and logistic components (0.59–0.92 USD/GJ in January and 0.59–1.03 USD/GJ in July 2022).
The LCOH environmental tax component in Ukraine was insignificant and, therefore, would not stimulate the implementation of measures to reduce the emissions of pollutants.
3.3. LCOH Structure
The LCOH structures for some boilers are shown in Figure 4, Figure 5, Figure 6, Figure 7 and Figure 8. For biofuel boilers, the LCOH fuel component increased in value terms for the first six months of 2022 from 1.78 USD/GJ for straw pellet boilers (Figure 6) to 7.40 USD/GJ for wood pellet boilers (Figure 4). In percentage terms, this component increased only for wood pellet boilers, for others, including coal boilers, it decreased.
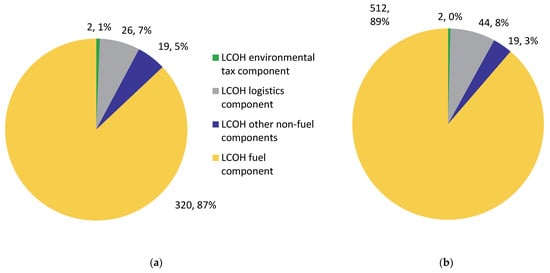
Figure 4.
LCOH structure from KZOT BRS 1000 Comfort BM (1 MW) from wood pellets: (a) January 2022; (b) July 2022.
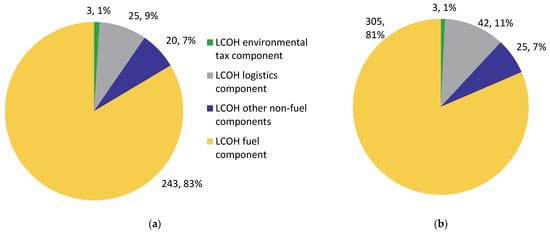
Figure 5.
LCOH structure from KZOT BRS 1000 Comfort BM (1 MW) from sunflower husk pellets: (a) January 2022; (b) July 2022.
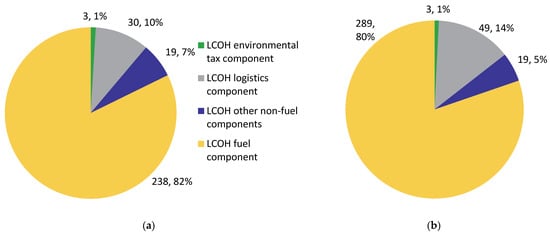
Figure 6.
LCOH structure from KZOT BRS 1000 Comfort BM (1 MW) from straw pellets: (a) January 2022; (b) July 2022.
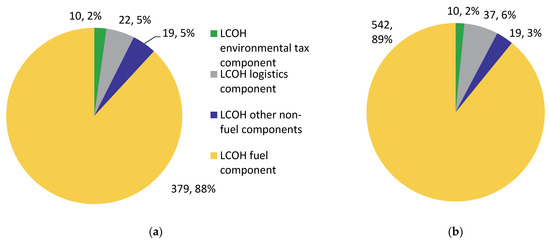
Figure 7.
LCOH structure from KZOT BRS 1000 Comfort BM (1 MW) from coal: (a) January 2022; (b) July 2022.
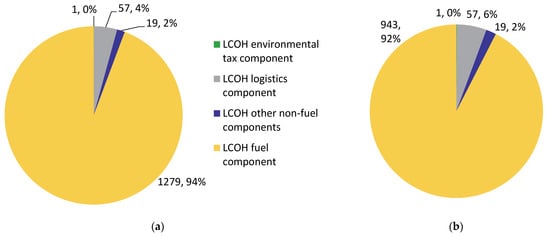
Figure 8.
LCOH structure from KZOT BRS 1000 Comfort BM (1 MW) from natural gas: (a) January 2022; (b) July 2022.
For natural gas boilers, the component significantly decreased, which was because the price of gas was lower in the summer than in the winter. The LCOH logistic component for all biofuel boilers increased, both in percentage terms (by 1–4%) and in terms of value (0.60–0.75 USD/GJ, Figure 4, Figure 5 and Figure 6). For gas boilers, in terms of value, it almost did not change (Figure 8), but for coal, it increased by 0.53–0.55 USD/GJ (Figure 7). The LCOH environmental tax component in monetary terms did not change during this time. The LCOH of other non-fuel components changed for some boilers, as they became more expensive.
The Development Ukraine Recovery Plan is currently underway. It contains a chapter concerning biofuels such as bioethanol, biodiesel, biomethane, and biomass. It is currently under consideration. After its approval, the authors will investigate the main scenarios for biofuel boilers in Ukraine.
4. Conclusions
The increase in the natural gas price provoked a rise in the cost of biofuels. However, even with a threefold increase in their prices in the past six years, the thermal energy produced by biofuel boilers was cheaper than the thermal energy from fossil fuel boilers.
The cost of fuel delivery can significantly increase the cost of heat energy. For example, a transportation distance of 300 km increases the cost of thermal energy by 6–16%.
The LCOH environmental tax component at Ukrainian environmental tax rates was insignificant and, therefore, would not stimulate the implementation of measures to reduce the emissions of pollutants. A CO2 emission tax is charged for biofuel boilers in Ukraine. This component was higher for biomass-fired boilers than for natural gas boilers.
The use of biofuel boilers is economically justified in Ukraine and will contribute to the reduction in greenhouse gas emissions, the development of biofuel production, the increase in the number of jobs, and the development of mechanical engineering. The use of biofuels, which are produced in the region of their use, is expedient to reduce the transportation distance.
The LCOH indicator can be used to make decisions about the choice of equipment and the type of fuel in the near term and to optimize the heat supply systems of settlements and the country. For more accurate forecasting of the cost of thermal energy, forecasting models of components, primarily of the cost of fuels, are needed.
Biomass-derived fuels, when sourced in a sustainable manner, are environmentally friendly (CO2-neutral); however, their combustion results in harmful pollutants and ash. In further research, it is worth determining the ways of handling ash and its effect on the cost of heat energy.
This study confirmed the first hypothesis that biomass-based heat supply systems are stable to the variation in market fuel prices. The second hypothesis is also correct. The LCOH of sunflower husk and straw pellets was lower than those of wood pellets, coal, and natural gas. Its relative value was in the range of 60% (compared with wood pellets) to 35% (compared with natural gas). Therefore, these systems are promising alternatives.
In early 2020, Ukraine’s 2050 Green Energy Transition Concept project was presented, which sets its goals close to those of the European Green Deal. Even in the global energy crisis, which began in 2021, the EU and Ukraine should be to make more efforts to develop green energy and increase the share of biofuels for heating. Combined heat supply systems based on heat pumps, wind power, and solar energy are a promising direction. The main scenarios of their development are of significant importance. In addition, a life cycle assessment of carbon dioxide emissions (including transport emissions) is the subject of further investigation.
Author Contributions
Conceptualization, V.S., O.B. and V.H.; methodology, V.S., V.A., D.S. and A.Z.; software, V.S., V.A. and O.B.; validation, V.S., V.A. and A.Z.; formal analysis, V.S., V.A., O.B., A.Z., A.K., D.S., J.S. and V.H.; investigation, V.S. and V.A.; resources, V.S.; data curation, V.S., V.A., O.B. and V.H.; writing—original draft preparation, V.S., V.A., O.B., A.Z., A.K., J.S., V.H. and D.S.; writing—review and editing, V.S., V.A., O.B., A.Z., A.K., J.S., V.H. and D.S.; visualization, V.S., V.A. and A.Z.; supervision, A.K., J.S. and V.H. All authors have read and agreed to the published version of the manuscript.
Funding
This work was financially supported by the VEGA Grant No. 1/20629/20 (Slovak Republic).
Institutional Review Board Statement
Not applicable.
Informed Consent Statement
Not applicable.
Data Availability Statement
Not applicable.
Acknowledgments
The authors thank the reviewers and editors for their valuable contributions that significantly improved this manuscript.
Conflicts of Interest
The authors declare no conflict of interest.
Appendix A
The data from the following table were used to determine the environmental tax and the LCOH environmental tax components.
Table A1.
Specific pollutant emissions from fuel combustion [33].
Table A1.
Specific pollutant emissions from fuel combustion [33].
| Fuel | Specific Pollutant Emissions, kg/t Fuel | Fuel Pollutant Emission Index, g/GJ | ||||||
|---|---|---|---|---|---|---|---|---|
| NOx | SOx | CO2 | PM10 | NOx | SOx | CO2 | PM10 | |
| Natural gas | 2.127 | 0 | 1943.4 | 0.00 | 64.31 | 0 | 58,748 | 0 |
| Coal | 2.065 | 51.30 | 1918.9 | 47.20 | 100.9 | 2506 | 93,740 | 2305.9 |
| Wood pellet | 1.36 | 0.187 | 1700 | 0.51 | 80 | 11 | 100,000 | 30 |
| Sunflower husk pellets | 1.36 | 3.2 | 1816.1 | 0.091 | 75.56 | 207.4 | 100,893 | 5.911 |
| Straw briquettes | 1.38 | 2 | 1544.2 | 0.171 | 89.03 | 127.4 | 99,624 | 10.892 |
References
- A European Green Deal. Available online: https://ec.europa.eu/info/strategy/priorities-2019-2024/european-green-deal_en (accessed on 7 July 2022).
- Ukraine’s 2050 Green Energy Transition Concept. Available online: https://mepr.gov.ua/news/34424.html (accessed on 7 July 2022).
- Celebi, A.D.; Sharma, S.; Ensinas, A.V.; Maréchal, F. Next generation cogeneration system for industry—Combined heat and fuel plant using biomass resources. Chem. Eng. Sci. 2019, 204, 59–75. [Google Scholar] [CrossRef]
- Cheney, T.; Deo, B.S. Wood-based biofuel options to create zero-fossil fuel district heating systems. In Proceedings of the IISE Annual Conference and Expo, New Orleans, LA, USA, 22–25 May 2021. [Google Scholar]
- Jasinskas, A.; Domeika, R.; Jotautiene, E.; Masek, J.; Streikus, D. Investigation of reed and bulrush preparation and usage for energy purposes and determination of biofuel properties and harmful substance emissions. In Proceedings of the Engineering for Rural Development, Jelgava, Latvia, 20–22 May 2020. [Google Scholar] [CrossRef]
- Kim, S.; Dale, B.E.; Jin, M.; Thelen, K.D.; Zhang, X.; Meier, P.; Sharara, M. Integration in a depot-based decentralized biorefinery system: Corn stover-based cellulosic biofuel. GCB Bioenergy 2019, 11, 871–882. [Google Scholar] [CrossRef]
- Lu, H.R.; El Hanandeh, A. Life cycle perspective of bio-oil and biochar production from hardwood biomass; what is the optimum mix and what to do with it? J. Clean. Prod. 2019, 212, 173–189. [Google Scholar] [CrossRef]
- Musule, R.; Núñez, J.; Bonales-Revuelta, J.; García-Bustamante, C.A.; Vázquez-Tinoco, J.C.; Masera-Cerutti, O.R.; Ruiz-García, V.M. Cradle to grave life cycle assessment of Mexican forest pellets for residential heating. Bioenergy Res. 2021. [CrossRef]
- Rover, M.; Smith, R.; Brown, R.C. Enabling biomass combustion and co-firing through the use of lignocol. Fuel 2018, 211, 312–317. [Google Scholar] [CrossRef]
- Sawai, T.; Yokota, K.; Tagami-Kanada, N. Generalized heating value estimation of torrefied woody biomass based on pyrolysis kinetics of primary constituent polymers. J. Therm. Sci. Technol. 2022, 17, 22–00114. [Google Scholar] [CrossRef]
- Bermúdez, C.A.; Porteiro, J.; Varela, L.G.; Chapela, S.; Patiño, D. Three-dimensional CFD simulation of a large-scale grate-fired biomass furnace. Fuel Process. Technol. 2020, 198, 106219. [Google Scholar] [CrossRef]
- Karim, M.R.; Bhuiyan, A.A.; Sarhan, A.A.R.; Naser, J. CFD simulation of biomass thermal conversion under air/oxy-fuel conditions in a reciprocating grate boiler. Renew. Energy 2020, 146, 1416–1428. [Google Scholar] [CrossRef]
- Shi, Y.; Liu, Q.; Shao, Y.; Zhong, W. Energy and exergy analysis of oxy-fuel combustion based on circulating fluidized bed power plant firing coal, lignite and biomass. Fuel 2020, 269, 117424. [Google Scholar] [CrossRef]
- Syrodoy, S.V.; Kostoreva, J.A.; Kostoreva, A.A.; Asadullina, L.I. Ignition of wood and coal particle mixtures in conditions of steam and water boiler furnaces. J. Energy Inst. 2020, 93, 443–449. [Google Scholar] [CrossRef]
- Verma, V.K.; Bram, S.; Delattin, F.; Laha, P.; Vandendael, I.; Hubin, A.; De Ruyck, J. Agro-pellets for domestic heating boilers: Standard laboratory and real life performance. Appl. Energy 2012, 90, 17–23. [Google Scholar] [CrossRef]
- Björnsson, L.; Pettersson, M.; Börjesson, P.; Ottosson, P.; Gustavsson, C. Integrating Bio-oil Production from Wood Fuels to an Existing Heat and Power Plant—Evaluation of Energy and Greenhouse Gas Performance in a Swedish Case Study. Sustain. Energy Technol. Assess. 2021, 48, 101648. [Google Scholar] [CrossRef]
- Mustapha, W.F.; Kirkerud, J.G.; Bolkesjø, T.F.; Trømborg, E. Large-scale Forest-based Biofuels Production: Impacts on the Nordic Energy Sector. Energy Convers. Manag. 2019, 187, 93–102. [Google Scholar] [CrossRef]
- Duong, M.; Padouvas, E. Solid biofuel characterization and ash properties of acacia mangium. Paliva 2020, 12, 1–6. [Google Scholar] [CrossRef]
- García, R.; González-Vázquez, M.P.; Rubiera, F.; Pevida, C.; Gil, M.V. Co-pelletization of pine sawdust and refused derived fuel (RDF) to high-quality waste-derived pellets. J. Clean. Prod. 2021, 328, 129635. [Google Scholar] [CrossRef]
- Ilari, A.; Pedretti, E.F.; De Francesco, C.; Duca, D. Pellet production from residual biomass of greenery maintenance in a small-scale company to improve sustainability. Resources 2021, 10, 122. [Google Scholar] [CrossRef]
- Nuryawan, A.; Syahputra, R.S.; Azhar, I.; Risnasari, I. Basic properties of the mangrove tree branches as a raw material of wood pellets and briquettes. IOP Conf. Ser. Earth Environ. Sci. 2021, 891, 012005. [Google Scholar] [CrossRef]
- Petlickaitė, R.; Jasinskas, A.; Mieldažys, R.; Romaneckas, K.; Praspaliauskas, M.; Balandaitė, J. Investigation of pressed solid biofuel produced from Multi-Crop biomass. Sustainability 2022, 14, 799. [Google Scholar] [CrossRef]
- Vusić, D.; Vujanić, F.; Pešić, K.; Šafran, B.; Jurišić, V.; Zečić, Ž. Variability of normative properties of wood chips and implications to quality control. Energies 2021, 14, 3789. [Google Scholar] [CrossRef]
- Woo, D.; Kim, S.H.; Kim, T.H. Solid fuel characteristics of pellets comprising spent coffee grounds and wood powder. Energies 2021, 14, 371. [Google Scholar] [CrossRef]
- Souček, J.; Jasinskas, A.; Sillinger, F.; Szalay, K. Determination of mechanical and energetic properties of reed canary grass pellets production. Acta Univ. Agric. Silvic. Mendel. Brun. 2019, 67, 757–762. [Google Scholar] [CrossRef]
- Kraszkiewicz, A.; Przywara, A.; Anifantis, A.S. Impact of ignition technique on pollutants emission during the combustion of selected solid biofuels. Energies 2020, 13, 2664. [Google Scholar] [CrossRef]
- Zaporozhets, A.O. Correlation Analysis Between the Components of Energy Balance and Pollutant Emissions. Water Air Soil Pollut. 2021, 232, 114. [Google Scholar] [CrossRef]
- Iatsyshyn, A.; Artemchuk, V.; Zaporozhets, A.; Popov, O.; Kovach, V. Mathematical Approaches for Determining the Level of Impact of Ash-Slag Dumps of Energy Facilities on the Environment. Stud. Syst. Decis. Control. 2020, 298, 1–13. [Google Scholar] [CrossRef]
- Pawlak-Kruczek, H.; Arora, A.; Mościcki, K.; Krochmalny, K.; Sharma, S.; Niedzwiecki, L. A transition of a domestic boiler from coal to biomass—Emissions from combustion of raw and torrefied palm kernel shells (PKS). Fuel 2020, 263, 116718. [Google Scholar] [CrossRef]
- Zajac, G.; Szyszlak-Barglowicz, J.; Slowik, T.; Wasilewski, J.; Kuranc, A. Emission characteristics of biomass combustion in a domestic heating boiler fed with wood and virginia mallow pellets. Fresenius Environ. Bull. 2017, 26, 4663–4670. [Google Scholar]
- Duong, V.M.; Flener, U.; Hrbek, J.; Hofbauer, H. Emission characteristics from the combustion of acacia mangium in the automatic feeding pellet stove. Renew. Energy 2022, 186, 183–194. [Google Scholar] [CrossRef]
- Havrysh, V.; Kalinichenko, A.; Brzozowska, A.; Stebila, J. Life Cycle Energy Consumption and Carbon Dioxide Emissions of Agricultural Residue Feedstock for Bioenergy. Appl. Sci. 2021, 11, 2009. [Google Scholar] [CrossRef]
- Bala-Litwiniak, A. Environmental and economic aspects of combustion of biomass pellets containing a waste glycerol. Combust. Sci. Technol. 2021, 193, 1998–2008. [Google Scholar] [CrossRef]
- Molchanov, O.; Krpec, K.; Horák, J. Electrostatic precipitation as a method to control the emissions of particulate matter from small-scale combustion units. J. Clean. Prod. 2020, 246, 119022. [Google Scholar] [CrossRef]
- Zhou, A.; Xu, H.; Xu, M.; Yu, W.; Li, Z.; Yang, W. Numerical investigation of biomass co-combustion with methane for NOx reduction. Energy 2020, 194, 116868. [Google Scholar] [CrossRef]
- Nong, D.; Siriwardana, M.; Perera, S.; Nguyen, D.B. Growth of low emission-intensive energy production and energy impacts in Vietnam under the new regulation. J. Clean. Prod. 2019, 225, 90–103. [Google Scholar] [CrossRef]
- Wang, S.; Qing, L.J.; Wang, H.; Li, H.Y. Integrated assessment of environmental performance-based contracting for sulfur dioxide emission control in Chinese coal power plants. J. Clean. Prod. 2018, 177, 878–887. [Google Scholar] [CrossRef]
- Wesseh, P.K.; Lin, B. Does improved environmental quality prevent a growing economy? J. Clean. Prod. 2019, 246, 118996. [Google Scholar] [CrossRef]
- Foumani, M.; Smith-Miles, K. The impact of various carbon reduction policies on green flowshop scheduling. Appl. Energy 2019, 249, 300–315. [Google Scholar] [CrossRef]
- Rodríguez, J.L.; Álvarez, X.; Valero, E.; Ortiz, L.; de la Torre-Rodríguez, N.; Acuña-Alonso, C. Influence of ashes in the use of forest biomass as source of energy. Fuel 2021, 283, 119256. [Google Scholar] [CrossRef]
- Coelho, B.; Oliveira, A.; Schwarzbözl, P.; Mendes, A. Biomass and central receiver system (CRS) hybridization: Integration of syngas/biogas on the atmospheric air volumetric CRS heat recovery steam generator duct burner. Renew. Energy 2015, 75, 665–674. [Google Scholar] [CrossRef]
- Fujii, S.; Kanematsu, Y.; Kikuchi, Y.; Nakagaki, T.; Chiu, J.N.W.; Martin, V. Techno economic analysis of thermochemical energy storage and transport system utilizing “zeolite boiler”: Case study in Sweden. Energy Procedia 2018, 149, 102–111. [Google Scholar] [CrossRef]
- Gerssen-Gondelach, S.J.; Saygin, D.; Wicke, B.; Patel, M.K.; Faaij, A.P.C. Competing uses of biomass: Assessment and comparison of the performance of bio-based heat, power, fuels and materials. Renew. Sustain. Energy Rev. 2014, 40, 964–998. [Google Scholar] [CrossRef]
- Pratiwi, A.S.; Trutnevyte, E. Decision paths to reduce costs and increase economic impact of geothermal district heating in Geneva, Switzerland. Appl. Energy 2022, 322, 119431. [Google Scholar] [CrossRef]
- Ruffino, E.; Piga, B.; Casasso, A.; Sethi, R. Heat pumps, wood biomass and fossil fuel solutions in the renovation of buildings: A techno-economic analysis applied to piedmont region (NW Italy). Energies 2022, 15, 2375. [Google Scholar] [CrossRef]
- de Simón-Martín, M.; Bracco, S.; Piazza, G.; Pagnini, L.C.; González-Martínez, A.; Delfino, F. The Levelized Cost of Energy Indicator. In Levelized Cost of Energy in Sustainable Energy Communities; Springer: Cham, Switzerland, 2022; pp. 31–76. [Google Scholar] [CrossRef]
- Fasahati, P.; Dickson, R.; Saffron, C.M.; Woo, H.C.; Liu, J.J. Seaweeds as a Sustainable Source of Bioenergy: Techno-economic and Life Cycle Analyses of its Biochemical Conversion Pathways. Renew. Sustain. Energy Rev. 2022, 157, 112011. [Google Scholar] [CrossRef]
- Kargbo, H.; Harris, J.S.; Phan, A.N. “Drop-in” Fuel Production from Biomass: Critical Review on Techno-economic Feasibility and Sustainability. Renew. Sustain. Energy Rev. 2021, 135, 110168. [Google Scholar] [CrossRef]
- Penke, C.; Moser, L.; Batteiger, V. Modeling of Cost Optimized Process Integration of HTL Fuel Production. Biomass Bioenergy 2021, 151, 106123. [Google Scholar] [CrossRef]
- Li, H.; Song, J.; Sun, Q.; Wallin, F.; Zhang, Q. A Dynamic Price Model Based on Levelized Cost for District Heating. Energy Ecol. Environ. 2019, 4, 15–25. [Google Scholar] [CrossRef]
- Hennessy, J.; Li, H.; Wallin, F.; Thorin, E.; Räftegård, O. Economic Feasibility of Commercial Heat-to-power Technologies Suitable for Use in District Heating Networks. Energy Procedia 2017, 142, 1721–1727. [Google Scholar] [CrossRef]
- Jasinskas, A.; Mieldažys, R.; Jotautiene, E.; Domeika, R.; Vaiciukevičius, E.; Marks, M. Technical, environmental, and qualitative assessment of the oak waste processing and its usage for energy conversion. Sustainability 2020, 12, 8113. [Google Scholar] [CrossRef]
- Havrysh, V.; Kalinichenko, A.; Brzozowska, A.; Stebila, J. Agricultural Residue Management for Sustainable Power Generation: The Poland Case Study. Appl. Sci. 2021, 11, 5907. [Google Scholar] [CrossRef]
- Lehtinen, U.; Juntunen, J.; Juga, J. Evaluating the Feasibility of Bio-energy Based Heat and Power Production in Rural Community. Biomass Bioenergy 2020, 139, 105578. [Google Scholar] [CrossRef]
- van Stralen, J.N.P.; Uslu, A.; Dalla Longa, F.; Panoutsou, C. The role of biomass in heat, electricity, and transport markets in the EU27 under different scenarios. Biofuels Bioprod. Biorefining 2013, 7, 147–163. [Google Scholar] [CrossRef]
- Leisen, R.; Steffen, B.; Weber, C. Regulatory risk and the resilience of new sustainable business models in the energy sector. J. Clean. Prod. 2019, 219, 865–878. [Google Scholar] [CrossRef]
- Andreoni, V. Environmental taxes: Drivers behind the revenue collected. J. Clean. Prod. 2019, 221, 17–26. [Google Scholar] [CrossRef]
- Zhang, J.; Zhang, Y. Exploring the impacts of carbon tax on tourism-related energy consumption in China. Sustain. Dev. 2019, 27, 296–303. [Google Scholar] [CrossRef]
- Nong, D. Development of the electricity-environmental policy CGE model (GTAP-E-PowerS): A case of the carbon tax in South Africa. Energy Policy 2020, 140, 111375. [Google Scholar] [CrossRef]
- Kondo, R.; Kinoshita, Y.; Yamada, T. Green Procurement Decisions with Carbon Leakage by Global Suppliers and Order Quantities under Different Carbon Tax. Sustainability 2019, 11, 3710. [Google Scholar] [CrossRef]
- Streimikiene, D.; Siksnelyte, I.; Zavadskas, E.; Cavallaro, F. The Impact of Greening Tax Systems on Sustainable Energy Development in the Baltic States. Energies 2018, 11, 1193. [Google Scholar] [CrossRef]
- Nissen, U.; Harfst, N. Shortcomings of the traditional “levelized cost of energy” [LCOE] for the determination of grid parity. Energy 2019, 171, 1009–1016. [Google Scholar] [CrossRef]
- Zang, G.; Jia, J.; Tejasvi, S.; Ratner, A.; Silva Lora, E. Techno-economic comparative analysis of Biomass Integrated Gasification Combined Cycles with and without CO2 capture. Int. J. Greenh. Gas Control 2018, 78, 73–84. [Google Scholar] [CrossRef]
- Bogoslavska, O.; Stanytsina, V.; Artemchuk, V.; Garmata, O.; Lavrinenko, V. Comparative Efficiency Assessment of Using Biofuels in Heat Supply Systems by Levelized Cost of Heat into Account Environmental Taxes. Stud. Syst. Decis. Control 2021, 346, 167–185. [Google Scholar] [CrossRef]
- Stanytsina, V.; Artemchuk, V.; Bogoslavska, O.; Zinovieva, I.; Ridei, N. The Influence of Environmental Tax Rates on the Levelized Cost of Heat on the Example of Organic and Biofuels Boilers in Ukraine. E3S Web Conf. 2021, 280, 09012. [Google Scholar] [CrossRef]
- Bogoslavska, O.Y.; Stanytsina, V.V.; Artemchuk, V.O.; Maevsky, O.V.; Garmata, O.M.; Lavrinenko, V.M.; Zinovieva, I.S. The Impact of Fuel Delivery Logistics on the Cost of Thermal Energy on the Example of Biofuels Boilers in Ukraine. IOP Conf. Ser. Earth Environ. Sci. 2022, 1049, 012018. [Google Scholar] [CrossRef]
- Projected Costs of Generating Electricity 2020. Available online: https://www.iea.org/reports/projected-costs-of-generating-electricity-2020 (accessed on 7 July 2022).
- Tax Code of Ukraine (01.01.2022). Available online: https://zakon.rada.gov.ua/laws/show/2755-17 (accessed on 7 July 2022).
- Artikov, N.Y.; Kakhramonov, K.S. Methods for calculating the discount rate for the evaluation of the cost of objects making income on the example of the republic of Uzbekistan. ISJ Theor. Appl. Sci. 2020, 5, 610–614. [Google Scholar] [CrossRef]
- Ralko, O.S. Methods for Determination of the Discount Rate. International Humanitarian University Herald. Economics and Management. 2015, 11, pp. 150–153. Available online: http://www.vestnik-econom.mgu.od.ua/journal/2015/11-2015/35.pdf (accessed on 21 August 2022).
- Foltyn-Zarychta, M.; Buła, R.; Pera, K. Discounting for Energy Transition Policies—Estimation of the Social Discount Rate for Poland. Energies 2021, 14, 741. [Google Scholar] [CrossRef]
- Nesticò, A.; Maselli, G. A Protocol for the Estimate of the Social Rate of Time Preference: The Case Studies of Italy and the USA. J. Econ. Stud. 2020, 47, 527–545. [Google Scholar] [CrossRef]
- Zhuang, J.; Liang, Z.; Lin, T.; Guzman, F.D. Theory and Practice in the Choice of Social Discount Rate for Cost-Benefit Analysis: A Survey; Asian Development Bank (ADB): Manila, Philippines, 2007; Available online: https://www.adb.org/sites/default/files/publication/28360/wp094.pdf (accessed on 14 September 2022).
- Zuniga, Y.; Kraft, A.; Uezono, D.; Fajardo, M.; Obmana, S.; Genuino, A.; Guerrero, A. Discount Rate Determination for Economic Evaluations in HTA in the Philippines. Eur. J. Public Health 2020, 30, ckaa166.581. [Google Scholar] [CrossRef]
- Carbon Taxes in Europe. Available online: https://taxfoundation.org/carbon-taxes-in-europe-2022/ (accessed on 7 July 2022).
- Poland Ecotax Rates. Available online: https://foes.de/pdf/Poland%20Ecotax%20rates.pdf (accessed on 7 July 2022).
- Marketplace of Ukraine. Available online: https://prom.ua/ (accessed on 7 July 2022).
- Prozorro Market. Available online: https://prozorro.gov.ua/ (accessed on 7 July 2022).
- Gas price Naftogaz Trading. Available online: https://naftogaztrading.com.ua/news/cina-gazu (accessed on 7 July 2022).
- Coal. Available online: https://drova-kiev.in.ua/ua/tverde-palivo/vugillja-kamjane/antratsit-dribnyj (accessed on 7 July 2022).
- Straw Pellets. Available online: https://flagma.ua/uk/granuli-z-solomi-pellety-s-solomy-palivni-o13681320.html (accessed on 7 July 2022).
- Distribution and Delivery of Gas. Available online: https://cutt.ly/xZVWzSu (accessed on 7 July 2022).
- Utility Tariffs. Available online: https://zp.gov.ua/uk/page/perelik-tarifiv (accessed on 7 July 2022).
- Gas Tariffs for the Population. Available online: https://index.minfin.com.ua/tariff/gas/ (accessed on 7 July 2022).
- Memorandum of Understanding on the Settlement of Problematic Issues in the Field of Thermal Energy Supply and Hot Water Supply in the Heating Period 2021/2022. Available online: https://ternopilcity.gov.ua/app6/memorandum.pdf (accessed on 7 July 2022).
- Schools and Kindergartens Buy Gas at 35-45 Thousand UAH, and Part of the Population will Pay Twice as much. Available online: https://biz.censor.net/r3292974 (accessed on 7 July 2022).
- Naftogaz Tariff Archive. Available online: https://gas.ua/uk/business/tariffs (accessed on 7 July 2022).
- DELLA™. Available online: https://della.com.ua/ (accessed on 7 July 2022).
- Solid Fuel Boilers KZOT. Available online: https://kzot-kotel.com.ua/tverdopalyvni-kotly/ (accessed on 7 July 2022).
- Solid Fuel Boilers Gefest-Profi P. Available online: https://gefest-kotel.com.ua/tverdopalyvni-kotly/seriia:gefest-profi-p/ (accessed on 7 July 2022).
- Gas Boilers Protherm. Available online: https://modernsys.com.ua/gazovye-kotly/protherm/ (accessed on 7 July 2022).
- The ReUseHeat Project used the Levelized Cost of Heat. Available online: https://www.euroheat.org/resource/reuseheat-calculation-tool-for-levelised-cost-of-heat.html (accessed on 7 July 2022).
- Zuberi, M.J.S.; Chambers, J.; Patel, M.K. Techno-economic comparison of technology options for deep decarbonization and electrification of residential heating. Energy Effic. 2021, 14, 75. [Google Scholar] [CrossRef]
- Gradziuk, B.; Gradziuk, P. Heat pumps versus biomass boilers: A comparative analysis of heating costs for public buildings. Ann. Pol. Assoc. Agric. Agribus. Econ. 2020, XXII, 77–85. [Google Scholar] [CrossRef]
- Kalinichenko, A.; Havrysh, V.; Atamanyuk, I. The Acceptable Alternative Vehicle Fuel Price. Energies 2019, 12, 3889. [Google Scholar] [CrossRef]


Publisher’s Note: MDPI stays neutral with regard to jurisdictional claims in published maps and institutional affiliations. |
© 2022 by the authors. Licensee MDPI, Basel, Switzerland. This article is an open access article distributed under the terms and conditions of the Creative Commons Attribution (CC BY) license (https://creativecommons.org/licenses/by/4.0/).