1. Introduction
In Ukraine, there are twelve underground gas storage facilities, with their total capacity of active gas volume of gas corresponding to about 25% of the volume of gas storage in underground gas storage facilities in the EU [
1]. In particular, underground storage is used for:
Balancing gas supply and demand during a given period to compensate for fluctuations associated with the change of seasons (summer/winter periods);
Gas balancing in the gas pipeline system;
Optimization of the gas transmission system (GTS);
Providing consumers with gas under conditions of optimal operation of underground gas storage facilities (UGS); and
Provision of gas supply in case of failures or malfunctions at UGS production sites or in the gas transmission system.
UGS operation in Ukraine is carried out in the following modes:
Gas self-flowing injection;
Gas self-flowing withdrawal;
Injection of gas by compression;
Gas withdrawal by compression; and
Gas reduction.
The modes of operation of UGS depend on the pressure in the gas pipelines, which connect the piping and instrumentation diagram of UGS with the main gas pipeline or network of gas pipelines. The main initial data used to build UGS operating modes are reservoir pressure in the working zone of wells and pressure in the pipeline outlet, which change significantly during the seasons of injection and withdrawal.
At significant time intervals, the stability of UGS operating modes is ensured by including in the processes of compressor stations running on natural gas. Compressor stations (CS) with gas turbine drives and centrifugal superchargers are mainly operated in Ukrainian underground storage facilities. Many storage facilities (if high gas compression is required) also have piston-type gas pumping units (GPUs) with gas-powered drives. Each gas storage facility has its own individual characteristics, the most important of which are:
Geometric, geological, geophysical and accumulating parameters of reservoirs;
Parameters of ground equipment and piping, as well as instrumentation diagrams of gas collection and preparation;
Parameters of wells and types of opening of their bottomhole zones; and
Technological projects of cyclic operation (technological indicators of operation).
Ukraine’s underground gas storage facilities are an essential element of the country’s energy security. In the autumn–winter period (subject to a sharp cooling), they provide as much as to 70% of gas supplied to domestic consumers and reliable transit of gas to European countries [
1]. The Ukrainian GTS involves many technological schemes of operation, which connect underground gas storage facilities (UGS), main gas pipelines (MG), gas distribution stations (GDS) and compressor stations (CS). However, underground storage facilities are distributed unevenly across the Ukraine territory. Therefore, it is necessary to schedule the distribution of projected volumes of gas in advance, both between groups of storage facilities and between individual storage facilities, which are technologically combined into one group. One of the most important characteristics that must be taken into account when scheduling the distribution of gas between underground storage facilities is their peak capacity, i.e., the maximum amount of gas withdrawal per unit time (taken per day). The gas is stored in reservoirs, which are a made of a heterogeneous, porous medium. Each UGS has the following individual characteristics: the structure of reservoirs and porous media, gas storage volumes and the number of wells through which gas is injected (or extracted). Therefore, the peak capacity of individual gas storage facilities differ significantly.
According to technological operational schemes, the peak capacity of underground gas storage facilities in Ukraine during the gas withdrawal season varies between 60 and 260 million m
3 per day [
2]. Among the possible options for the operation of underground storage facilities [
3], the most efficient rely on integrated indicators, which take into account fuel and energy costs, as well as the parameters of reliability of GTS operation. Optimization of GTS operation encourages the development of optimal strategies for their interaction with UGS, as well as the interaction of UGS groups with each other, in order to maximize their joint energy-saving potential. To achieve this, it is necessary to make full use of the potential of periods of compressorless withdrawal (injection) of gas:
Subject to the existing or projected mode of operation of the GTS; and
If necessary, by regulating the process of gas withdrawal from storage facilities by reducing the pressure in the main gas pipeline.
Hydrodynamic models can be used to study the available capacity potential of UGS. The process of constructing a hydrodynamic model that describes the behavior of an underground gas storage facility (formed on depleted gas fields) using mathematical tools takes place in several stages. In the first stage, geological and geophysical information, structural maps, piping and instrumentation diagrams, long-term operational information, metrological and technical support, automation systems, etc., are analyzed. The next stage involves the construction of information and mathematical models that describe the behavior of facilities, with a single hydraulic complex as the object. In this stage, attention is paid to the reservoir; the basic equations are formed, which describe the process of filtration of liquids and gases in a porous medium, taking into account the laws of conservation of mass and energy, the law of motion, equations of state, etc. The sets of initial and boundary conditions and differential equations in partial derivatives are also determined. The next stages of construction a hydrodynamic model are the development of information software and mathematical methods and updating of the parameters of the integrated UGS model, which are performed simultaneously [
4]. Proven approaches (for research and operation of hydrocarbon deposits) are most often adapted for the development of UGS models [
5], which are based on previously developed geological models of reservoirs. The need to develop a detailed geological model to be used in the development a hydrodynamic model of underground storage is debatable because there is a problem associated with uncertainty, which is caused by incorrect geological modeling. It is known that each algorithm that interprets geological information can create several equally likely geological models that are consistent with the actual well data and differ significantly in the well space. The problem of identifying model parameters as an inverse mathematical problem, by its nature, is incorrect.
Scientific publications related to UGS problems most often concern the design and development of gas and gas condensate reservoirs; methods of geological–industrial analysis that provide a detailed study of the geological structure of deposits; issues of control over the development of gas deposits, subsoil and environmental protection; calculation of development indicators for different modes of operation of deposits; mathematical modeling of the main processes of development and operation; issues associated with increasing the gas recovery of reservoirs and bottomhole zones of wells, etc. [
6,
7,
8,
9,
10,
11,
12,
13,
14,
15,
16,
17,
18,
19,
20,
21,
22,
23,
24] (details in
Table 1).
However, there are no generally accepted recommendations for the development of UGS models. The complexity of developing reservoir models demands that the following factors be taken into account: geological and physical characteristics of the reservoirs; water; information uncertainty; multiphase filtration processes, etc. Some recommendations are formulated in [
25].
Historically, gas storage facilities have been established and operated in most European countries and the Americas for decades. The world’s first underground storage facility was built in Canada in 1915. The beginning of technological design of underground storage facilities in Ukraine, on the basis of produced gas and gas condensate fields, dates back to the early 1960s. According to its indicators, the Ukrainian UGS complex ranks third in the world (after the United States and Russia). Today, most research on the creation and operation of underground storage facilities is conducted in Asian countries [
26,
27,
28,
29]. In countries with a developed underground storage system, the possibility of storing hydrogen (and its mixtures with natural gas in varying concentrations) and ensuring a high level of intellectualization of the underground storage process is being studied [
30,
31,
32] (see
Table 1).
The real degree of development of UGS modeling systems can be judged by the state of development and operation of software packages (PCs) [
33,
34,
35]. The existing market for geophysical service software packages, which include PCs for UGS operation, is a segment of the oil and gas sector and includes exploration services (geological exploration, seismic exploration and geophysics), modeling of deposits and storage, development of piping and instrumentation diagrams for extraction and storage of hydrocarbons, etc. The following companies compete in the geophysical service market [
36]:
Companies that deal directly with geophysical services (Schlumberger, Weatherford, Reimer and Integra); and
Oil and gas companies, including their structure geophysical service units (ExxonMobil, Baker Hughes, Gazpromgeofizika, Surgutneftegeofizika, etc.).
The manufacturers of software for geophysical services include:
Companies that are directly involved in the development and sale of software for geophysical services (Paradigm and Rock Flow Dynamics); and
Large service companies that are involved in software development and creation, among other activities (Schlumberger and CGGVeritas).
Currently, there is a tendency to integrate the main directions of modeling and interpretation of data, i.e., “seismic interpretation—geological modeling—hydrodynamic modeling”. Examples of products that combine these areas are Petrel and ECLIPSE (Schlumberger), as well as IRAP RMS (Roxar). Demand for integrated systems (a software segment for geophysical services SKUA-GOCAD (Paradigm)) is growing, thanks to the possibility of comprehensive solutions to several problems of geophysical modeling. This trend will continue in the future due to the growing complexity of tasks during the development of new deposits.
The foreign market for geophysical service software is divided between the largest international companies. The share of the largest international players in the market for software for geophysical services is as follows:
Open-source programs designed for analysis, interpretation and visualization of geographic information systems (GIS), such as OpendTect, GeoTriple for Oil & Gas Exploration, GeoCraft, qiWorkBench and GI, are also available in the market. The above programs contain both open (for public use) software and closed commercial plugins.
The main arguments for the development of domestic (Ukrainian) software and possible problems with its replication outside Ukraine are presented below. According to the estimates of geophysical services experts [
36], the minimum cost of a basic set of software on the world market is USD 150,000 for one workplace, with an average cost of USD 250,000. The main barriers to the entry of Ukrainian software for geophysical services into the global market are a lack of startup capital and legal and technological restrictions outside of Ukraine. To enter the international market, large startup capital is required to invest in research and development (R&D) and software development and to purchase equipment (worth about USD 1 million). To maintain Ukraine’s position in the gas software market, it is necessary to regularly invest in R&D (for example, Schlumberger spends 10–15% of its annual profits on R&D). The development and creation of a quality software product requires a team of qualified specialists, including mathematicians, geophysicists, IT specialists, engineers, geologists, etc. In addition, there are legal barriers related to the need to obtain patents and licenses, government restrictions on various countries (for example, the share of foreign geophysical services in the US and China is not more than 5%, as governments lobby for national companies). Technological barriers are extremely complex, requiring the compatibility of developed software with the software of large developers (Schlumberger, Paradigm, Roxar and CGGVeritas). There are also other requirements, such as to provide a network effect, creation of a system of service and technical support for users in different countries worldwide and orientation of the interface and software circulation of the software to the needs of a specific client.
Arguments justifying the need to realize the Ukrainian potential for the development of high-performance software for underground storage facilities are outlined below. Technological chain modeling software, which includes all facilities on the gas flow path, from the reservoir to the pipeline, are mainly operated in the gas fields. The main problems that arise in the process of developing calculation procedures are the complexity of the models (different types of mathematical representation) and the incompleteness of their information support. There are significant difficulties in adapting such models under the conditions of the existing uncertainty of parameters, especially the parameters of reservoir systems.
Long-term practice of UGS modeling has revealed a number of specific points that distinguish UGS modeling from modeling of oil and gas fields, requiring adjustments to the applied methods and software products. The operation of many underground storage facilities and the analysis of the processes occurring in the reservoir significantly increase the role of filtration modeling as a tool for studying and controlling the reliability of the geological structure of the facility.
Foreign mathematical software for modeling filtration processes is focused mainly on the development of gas fields. The operation of underground gas storage facilities is characterized by a number of features, including significant non-stationarity and non-linearity of filtration and gas dynamics laws, divergence of filtration flows, cyclicity, uneven selection/injection processes and hysteresis of displacement process characteristics with constant change of directions. In addition, in foreign mathematical software:
There are no software modules for calculating the modes of multishop compressor stations with different types of GPA, variable flow parts and multistage gas compression; and
There is no optimal planning of UGS operating modes integrated with the GTS as a single hydraulic complex.
From the perspective of the user, foreign mathematical software is a “black box”, so it cannot be further developed, adapted or assessed in terms of the correctness of the work and the reliability of the results.
The purpose of the study is to develop:
Models of operation of underground storage facilities in the modes of gas injection and withdrawal; and
System models of UGS operation in gas injection and withdrawal modes as a part of GTS as a single hydraulic complex.
To achieve this goal, the following must be offered:
Models that take into account the main internal and external factors influencing the parameters of gas flows in the facilities to achieve a given degree of adequacy in terms of gas-dynamic and non-stationary filtration processes;
A sufficient level of differentiation of the UGS model to avoid solving incorrect mathematical problems at the stage of their integration into a single thermohydraulic system; and
A sufficient level of complexity of the models to ensure the solution of operational control tasks with maximum speed and sufficient accuracy.
2. Modeling and Operation of Underground Storage Facilities
2.1. Object of Study
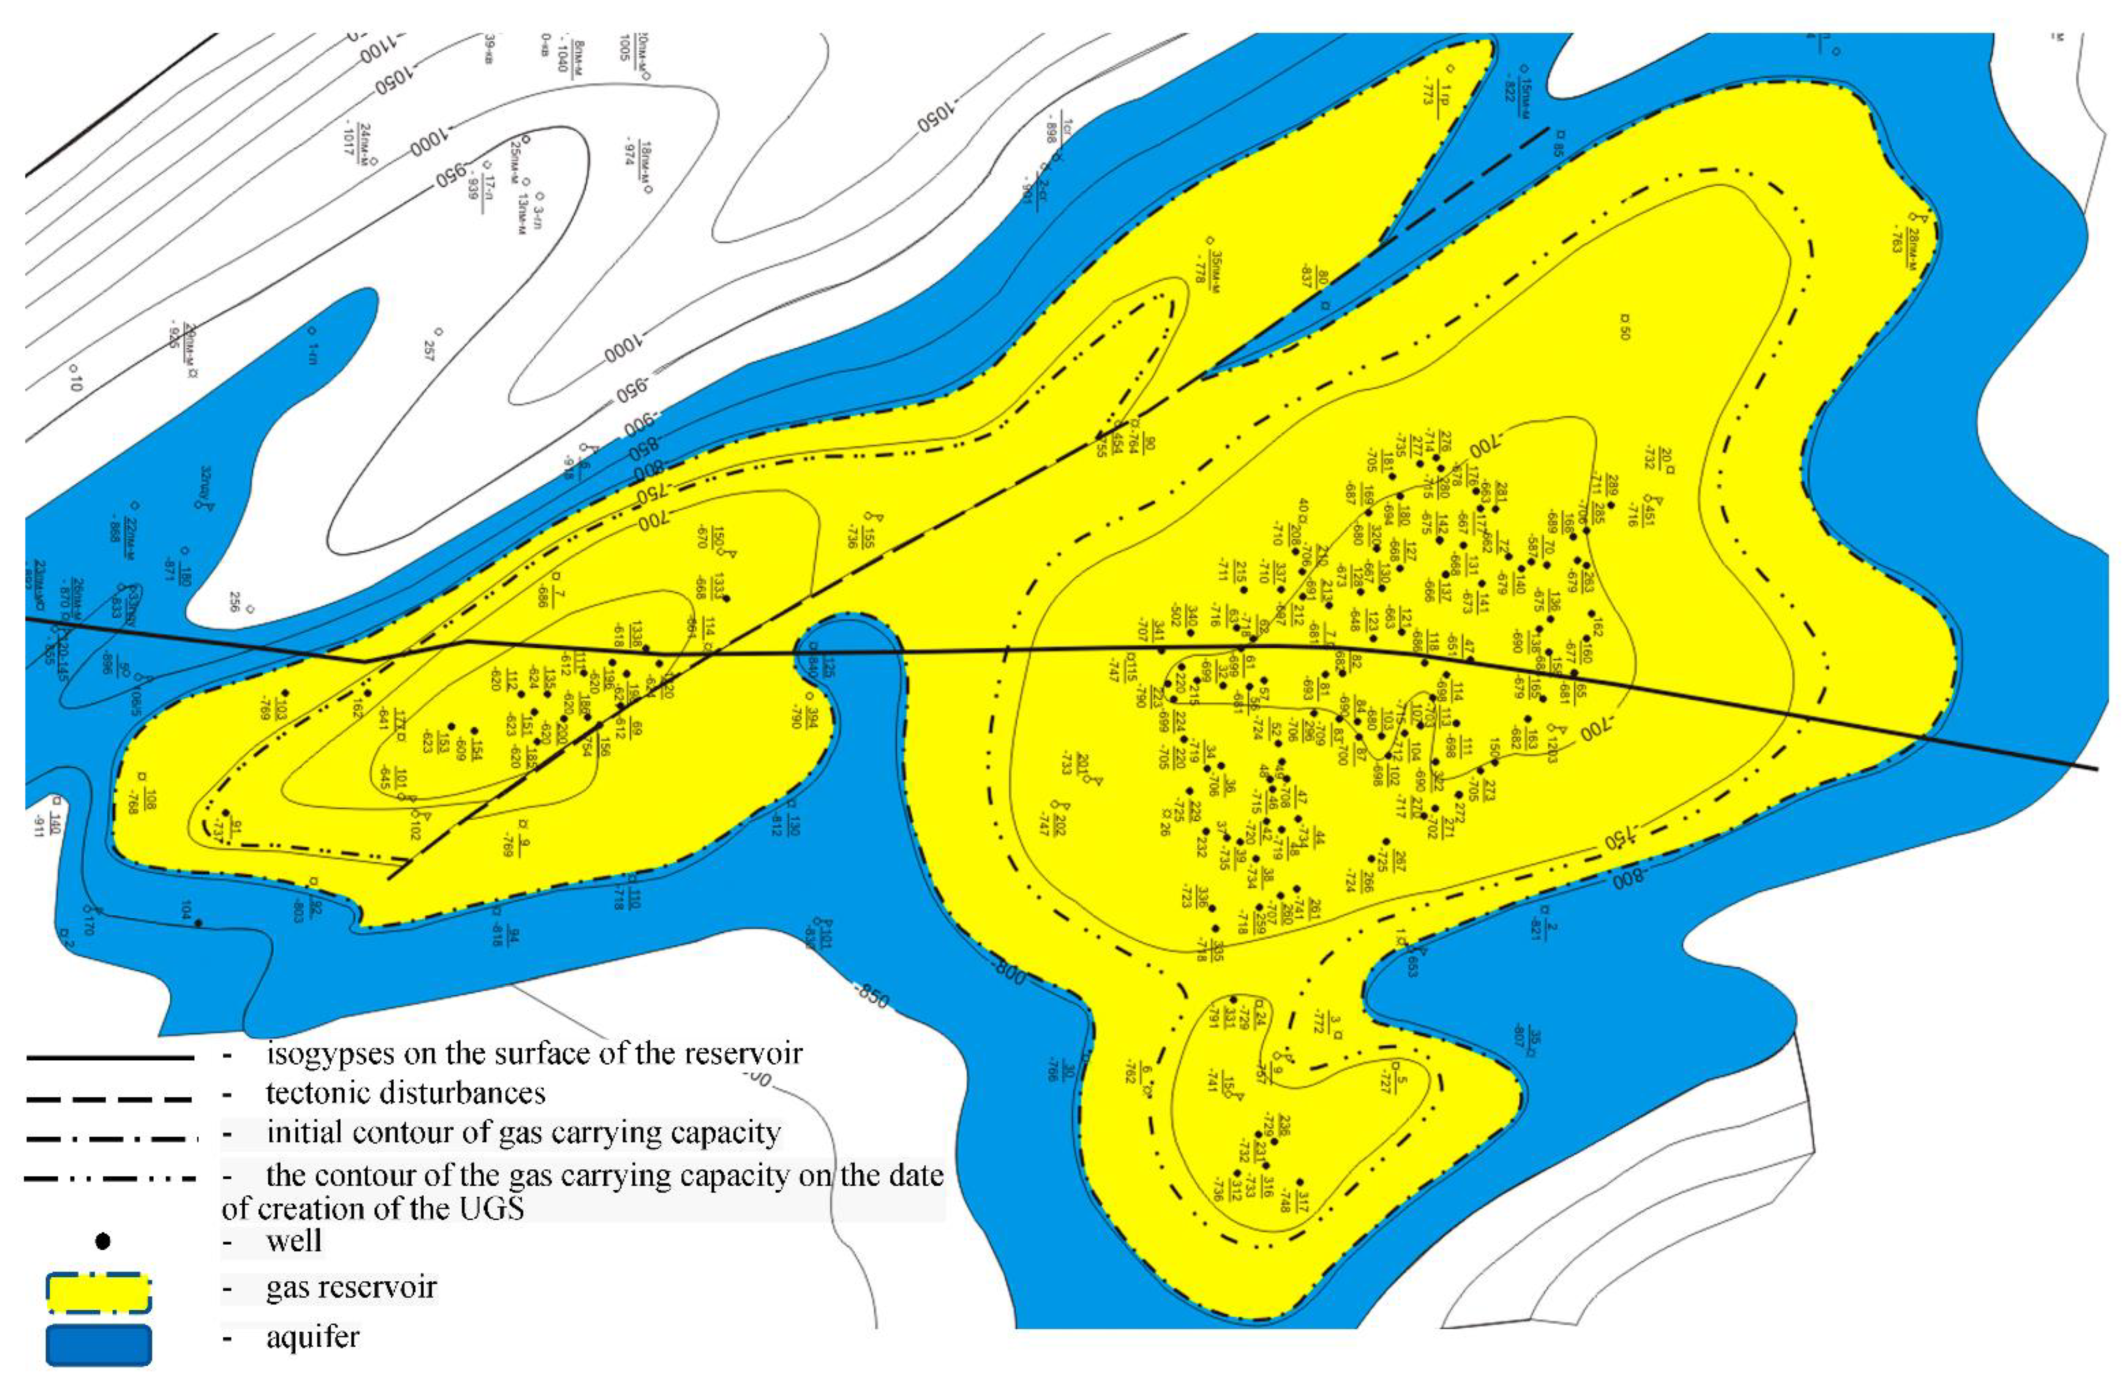
UGS are most often created in depleted gas, aquifers, gas condensate and oil fields. One of the most important issues in the process of creating underground gas storage facilities is the establishment of conditions for maintaining the volume of pumped gas. Structural gas traps are mostly used in the reservoirs of UGS in aquifers, and the volume of gas traps should be sufficient to maintain the required amount of gas. The reservoir must have a permeability that ensures the displacement of water by gas in a reasonable amount of time. The depth of the reservoir must meet certain requirements because at shallow depths, the pressure in the storage will be low. As the depth increases, the pressure increases, and the total and active gas volume increases. In this case, the injection conditions are complicated, and the probability of gas flow into the layers that lie above increases.
When choosing the location for UGS, preference is given to depleted orthotropic gas fields, which have:
Experience in the design and operation of underground storage facilities in depleted fields shows that information on the properties of reservoirs (obtained in the process of field development) is insufficient to manage the operation of UGS. When creating PSG, it is necessary to determine the following parameters:
The rational ratio of buffer and active gas;
The number of wells;
The maximum and minimum pressures in the reservoir; and
The compressor station capacity.
Calculations show that the higher the gas injection pressure, the more efficient the storage performance; as the active capacity increases, the flow rates of wells increase and the daily storage capacity increases. However, the risk of gas breakthrough into other (upper) horizons also increases. When designing and creating an underground storage facility, the choice of well placement grid is also of considerable importance.
The main technological indicators of UGS include active gas volume, gas buffer volume. maximum daily capacity of withdrawal/injection. the estimated number of days of operation of the UGS during withdrawal/injection. storage type. the depth of the reservoir layer. reservoir layer thickness, gas trap amplitude, mode of operation of the gas reservoir, the number of production wells, average flow rate of wells during withdrawal/injection, maximum reservoir pressure during injection, minimum pressure in the reservoir during withdrawal, power of the compressor station, the number of gas gathering stations, the average water factor during gas withdrawal, etc.
Daily withdrawal capacity of UGS is one of the most important indicators of UGS. This indicator is not constant over time for most gas storage facilities. In the process of gas withdrawal, the gas pressure in the storage decreases, as a result of which its daily withdrawal capacity also decreases. The dependence of the maximum possible daily withdrawal on the volume of gas contained in the underground storage facility is used to predict the work for the next withdrawal season. This dependence is ambiguous and significantly depends on the modes of gas withdrawal and the distribution of gas permeability in the reservoir, in particular, in the area of the wells. The number of days of operation of the storage facility is calculated based on the daily withdrawal capacity of the storage facility and the size of the active gas volume.
The system of placing wells is the site placement of gas wells of various purposes for the opening of a productive layer. These can be production or observation wells, etc. The placement system is justified on the basis of gas-hydrodynamic calculations, as well as technical and economic justification. There is a system of placement of wellheads on the gas bearing area and a system of placement of their bottomholes. Under previous systems of construction of vertical wells, the systems of placement of wellheads and bottomholes practically coincided. When mastering the technology of inclined and directional drilling from one bush of wellheads, their bottomholes can be separated by as much as 1 km or more.
The site gas collection system of production gas wells consists of uniform and non-uniform grids, non-uniform regular grids with a concentration of bottomholes at certain sites (usually on the most productive sites) in the form of square grids, circular batteries and other mixed grids. In general, the type of site placement and the distance between wells are established on the basis of technical and economic analysis of various options. Well bottomholes located on the gas-bearing plane can reveal only a part of the productive stratum, represented by several independent layers (interlayers), or the entire productive stratum with a single bottomhole.
The gas collection system is an extensive network of pipelines that connects individual wells and well bushes with industrial preparation facilities, as well as devices that ensure the reliable functioning of this network. The gas collection system also includes a system for the distribution and introduction of inhibitors; systems for periodic cleaning of pipelines from liquid and solid phases; and gas pre-separation installations and control and measuring devices (CMD), including measurements of temperature, pressure, flow of wells, temperature along the plume, etc.
The mode of operation of gas storage is determined by the nature and quality of the dominant manifestation of various sources of natural reservoir energy in the process of gas extraction without external intervention. In this case, the sources of natural energy are the elastic energy of rocks and the energy of reservoir fluids in the reservoir itself, as well as in the surrounding water pressure system. They distinguish:
The main characteristic of the reservoir energy manifestation of these regimes is the reservoir pressure, which decreases in the process of gas withdrawal. The rate of reservoir pressure drop (average weighted by the gas-saturated volume of the reservoir) is determined by the material balance equation, depending on the rate and nature of the flow of the contour or foot reservoir waters into the reservoir. The rate of reservoir pressure drop in the elastic water pressure mode is slower than in the gas mode. As a result of a drop in reservoir pressure, reservoir water enters the gas-saturated reservoir, which leads to the displacement of the gas–water contact (GWC). Due to the non-homogeneous filtration-capacity properties of the constituent rocks and the concentrated placement of wells in certain zones on the gas-bearing area, uneven movement of the gas–water contact (GWC) in the areas with the most drainage may occur. In addition, there may be local breakthroughs of subsoil water to well bottomholes.
2.2. Operational Problems
In recent years, the operation of Ukraine’s GTS took place under the conditions of its partial load in terms of volumes of imported and transit gas. The reasons for this state were frequent changes, import and transit flows of gas, its suppliers and points of entry of transit flows of gas into the system. The contract conditions for volumes, pressure and quality of gas were not fully implemented. Therefore, the GTS was often operated in non-design modes. In parts of the main gas pipelines, it was necessary to switch to the reverse method of gas transmission. Under such conditions, both the role of UGS in general and the load on each repository in particular increased significantly.
Separate problems that arise during the operation of UGS and GTS are characteristic not only of the Ukrainian GTS [
37]. For example, despite the surplus of capacity, in 2012 (during the cooling period), European UGS did not cope with the unevenness of gas consumption. The main problem was that there was no single control center for the operation of these facilities.
Ukrainian gas storage facilities are characterized by various technological indicators. Until 2020, the amount of gas storage did not significantly exceed 50% of the available capacity. Therefore, in order to ensure the necessary performance of UGS in the future (i.e., provide the maximum volumes of gas withdrawal at the forecasted time intervals), it is necessary, in addition to the “correct” planning of gas withdrawal, to “correctly” distribute the available active gas between the storage facilities in advance. In 2020, Ukrainian underground gas storage facilities accumulated a record gas reserve over the past 10 years: 28.3 billion cubic meters [
38]. However, today, the possibly of importing gas for injection has significantly decreased due to the high price at the European gas hubs—the highest in 13 years (more than USD 1000 per thousand cubic meters). Accordingly, the price of gas on the Ukrainian market also increased from USD 140 to USD 1000 per thousand cubic meters between May and October 2021 [
39]. Therefore, the tasks of effective management of gas injection/withdrawal processes according to the criteria of optimality and maintenance of “peak capacity” remain relevant in the future.
2.3. Modeling Problems
The complexity of underground gas storage facilities and the high cost of errors in their management make the task of improving the quality of decisions made by dispatchers during their operation extremely urgent. To eliminate the possibility of errors, the dispatcher must have a decision support system (DSS), which is an integral part of the dispatching control system of technological processes. A DSS is developed on the basis of mathematical and simulation models. It includes a system of information support for regulatory and technological tasks. According to the specified quality criteria, a DSS offers the dispatcher the ability to perform certain actions regarding the management of filtration and gas dynamic processes in UGS.
The central core of a DSS is a universal modeling complex, the development of which was preceded by an analysis of the functioning of all facilities that are part of the underground gas storage system. The main features of the modeling object are:
Non-stationarity of the system, i.e., constant change in the parameters of filtration and gas-dynamic processes;
Significant inertia, i.e., filtration processes continue for several months after the cessation of gas injection and extraction;
A significant time delay in identifying the situation; for identification, it is necessary to have operational data at a significant time interval, part of which is measured late and not at the same time and with insufficient frequency;
Multicriteria functioning; the quality of functioning of each object of the technological chain “reservoir—gas pipeline—outlet” is characterized by its individual parameters;
Uniqueness: the individuality of the structure and operating conditions of the technological equipment (as there are no two identical gas storage facilities);
Evolvability: object parameters, topology and composition of the object continuously change over time;
Functional situationality: the purpose of functioning and methods of UGS management depend on the specific situation; and
Incomplete information and significant uncertainty: a lack of measurements of many variables.
The abovementioned features and characteristics of processes (stationary and non-stationary; continuous and discrete; instantaneous and slow with varying frequency and amplitude of oscillation; and predicted and those that can be qualified as random) were taken into account in the development of the UGS model.
The works of many scientists are devoted to the problems of modeling and operation of UGS and its components (reservoirs, wells, gas collection systems and compressor stations). Most works concern the modeling problems of individual UGS subsystems [
40,
41,
42,
43,
44,
45,
46,
47,
48,
49]. However, there are few systematic works that cover most of the problems associated with modeling, adaptation and operation of both individual UGS and UGS integrated with the GTS. As the experience of developing models of the functioning of complex systems (including UGS) shows, the excessive division of a single hydraulic complex into subsystems, as well as the separate development of models and methods of their implementation, results in insoluble algorithmic problems at the stage of their iterative combination into a single integrated modeling complex (system).
The main processes in UGS (gas filtration processes in reservoirs and in the bottomhole zones of wells) are significantly non-stationary. A reservoir, as an anisotropic porous medium, is characterized by porosity, permeability, gas saturation, filtration coefficients, etc., as well as structural and geometric parameters, the number of collector reservoirs, depth of placement, etc. However, all of these parameters are only approximately determined. In addition, the specified parameters affect the processes of gas filtration in a non-linear manner, both in terms of intensity and direction of movement. During periods of sharp growth in gas consumption, the reliability of operation of the GTS depends on the productivity of UGS, i.e., the maximum possible gas withdrawals (peak capacity) per unit of time. This value is significantly influenced, in particular, by the filtration parameters of the bottomhole zones of the wells. The ability to change the volumes of gas extraction and injection in significant volumes for the GTS is an important tool that ensures both the control of gas flows in the main gas pipeline system and the optimization of the performance indicators of the GTS. UGS have varying complexities of gas collection systems. Among them, both individual (well pipelines) and group (pipeline-collector) systems stand out. The length of pipelines and collectors varies from hundreds to several thousand meters. In addition, the gas preparation system includes other facilities, such as equipment for gas cleaning and drying. Gas compression in storage facilities is provided by various types of compressors that can operate under conditions of several degrees of gas compression (from one to three).
Most Ukrainian storage facilities are formed in depleted gas fields. Among them there are one-, two- and three-layer systems, without significant manifestation of elastic-water-pressure or water-pressure operating modes. During the operation of the storage facilities, the movement of the gas–water contact is manifested mainly at the end of the gas withdrawal seasons and is controlled by piezometric wells.
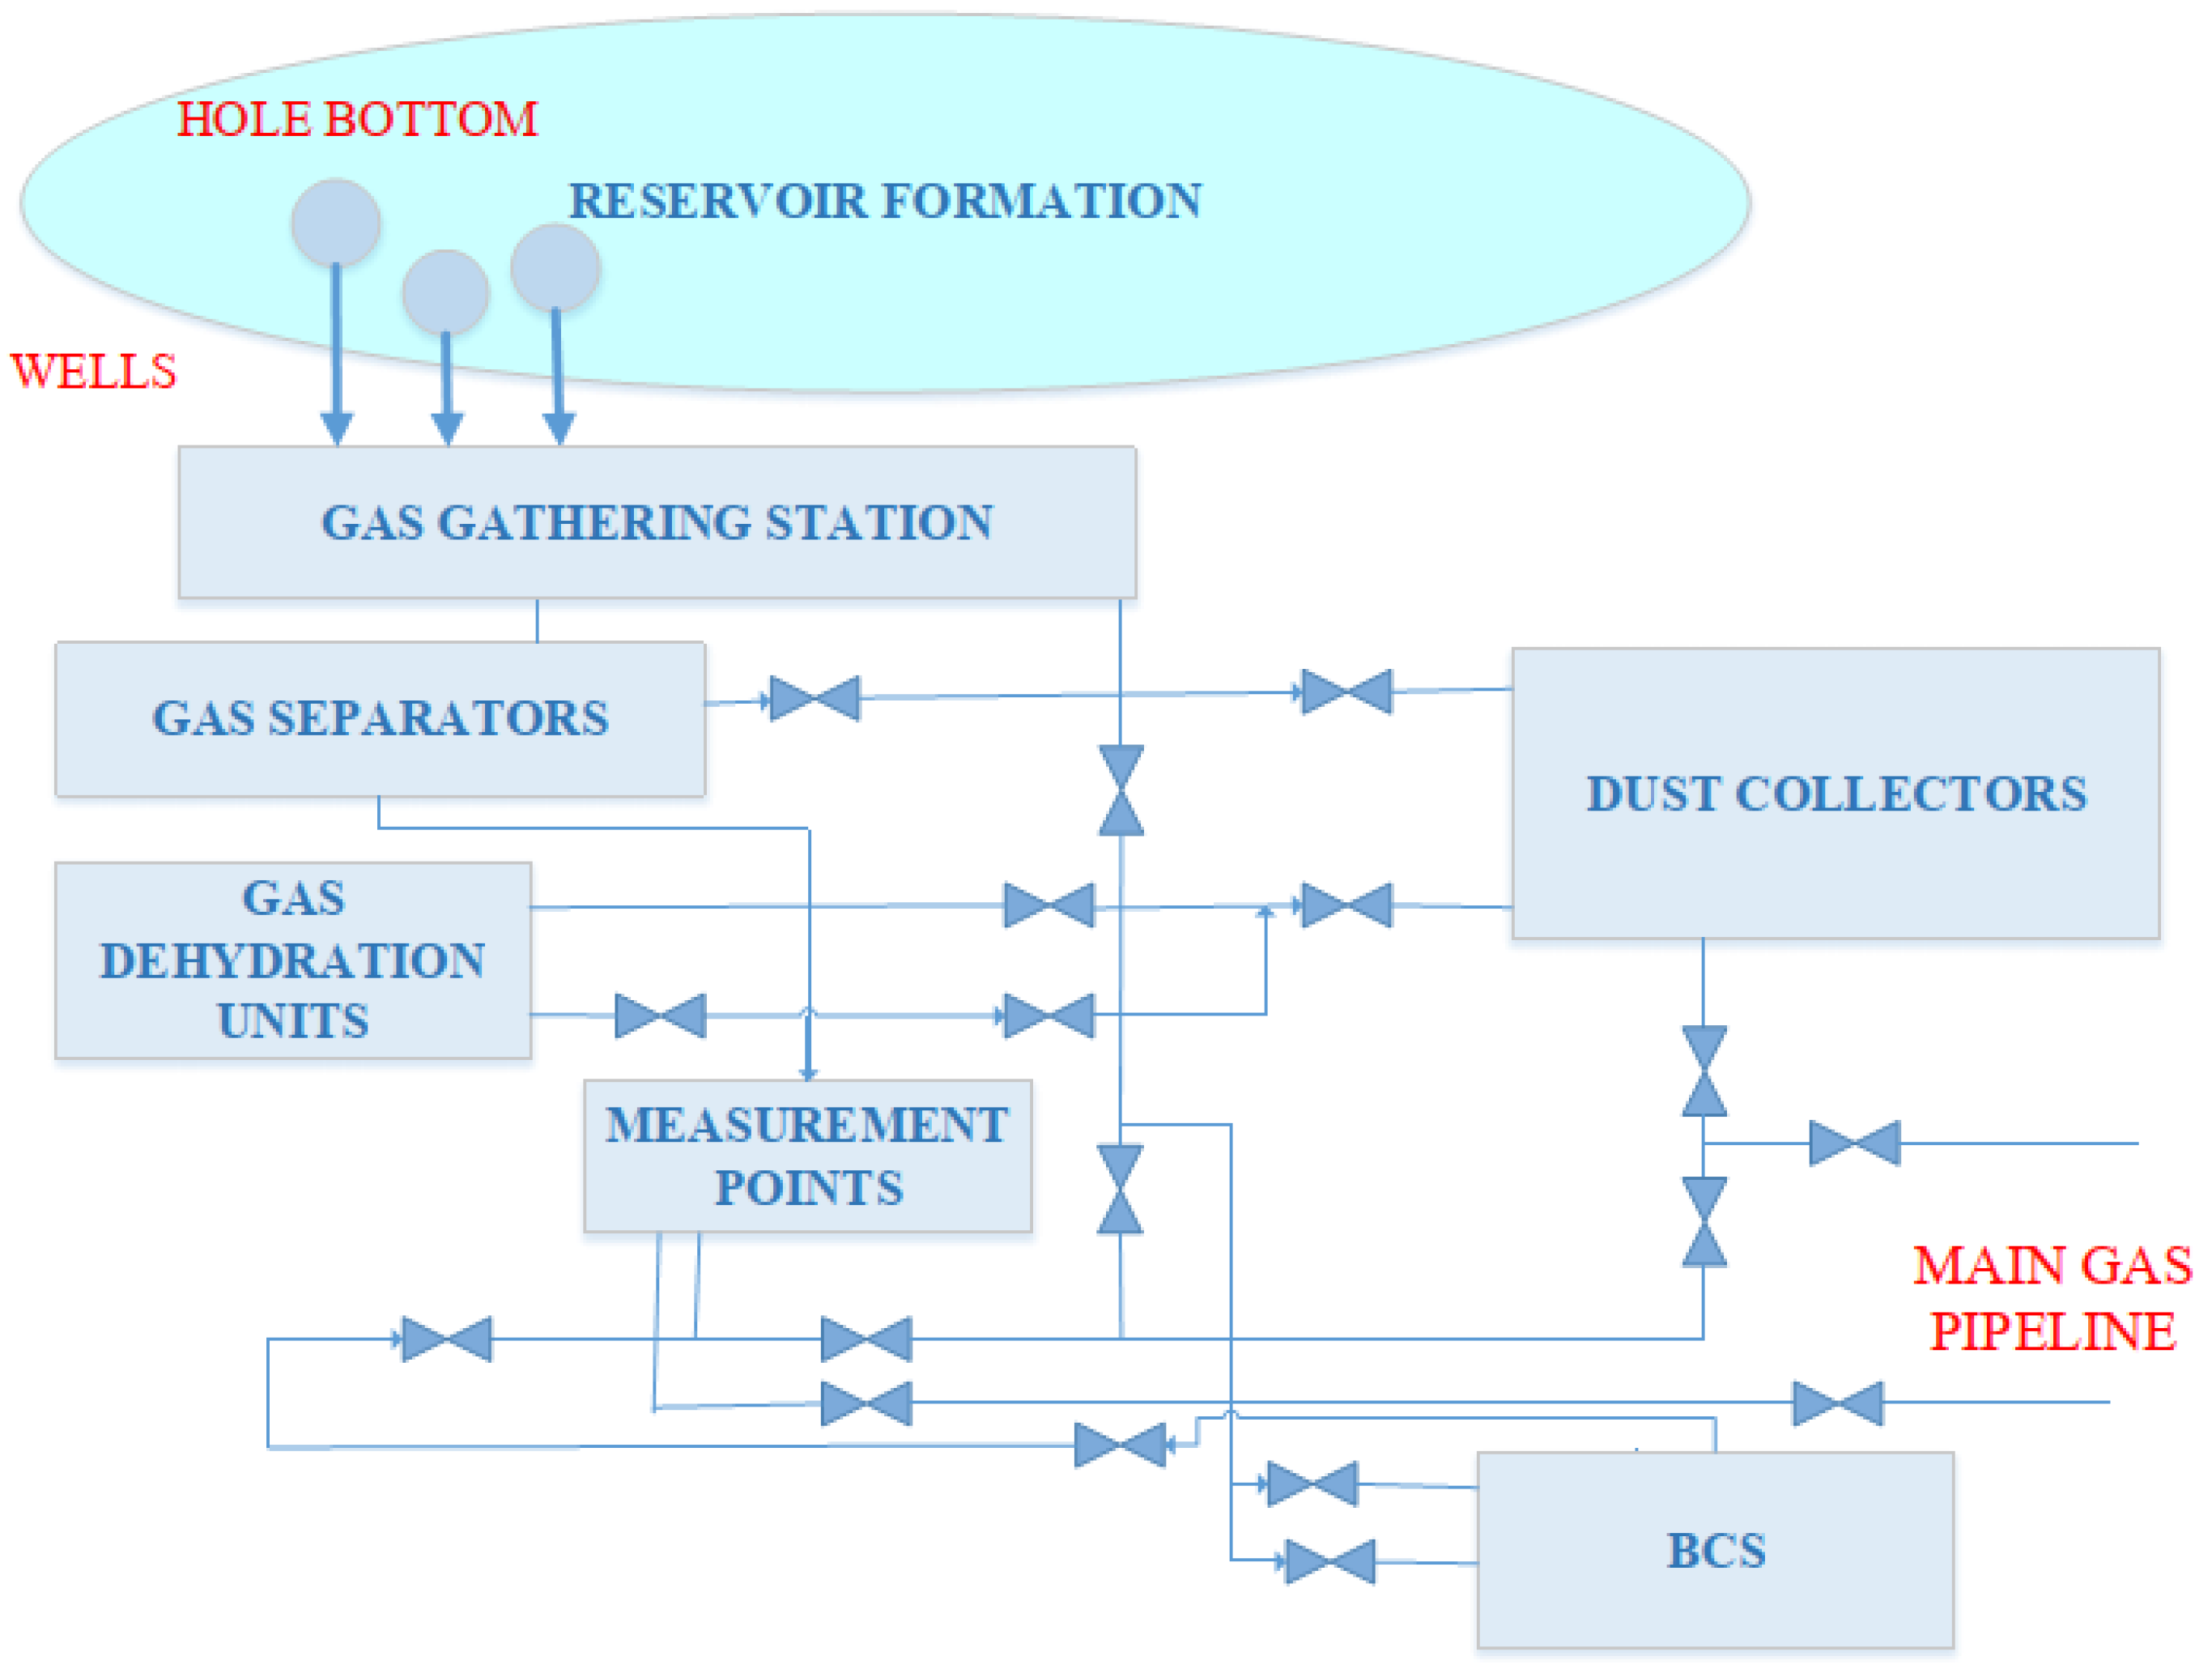
We formed a mathematical model of UGS (
Figure 1) on the basis of models of individual facilities, which are combined into a single hydraulic model according to the piping and instrumentation diagram. However, the variety of mathematical models of individual facilities complicates the development of iterative procedures to coordinate the parameters of gas flow at the boundaries of neighboring facilities. The fewer the places in the model of coordination of gas flow parameters, the faster and more stable the iterative calculation procedure. The mathematical support of our modeling complex assumes coordination of parameters on two borders:
We chose this option for numerical implementation of the integrated model because it provides:
A stable process of realization of each separate model, as well as a steady process of coordination of mode parameters on model borders;
Formulation and algorithmic implementation of the minimum complexity of the main direct and inverse optimization problems of planning, identification of model parameters and study of the capacity of facilities and the system as a whole; and
Analysis of current regimes and evaluation of the effectiveness of pre-design solutions, etc.
3. Mathematical Models of Underground Storage Facilities
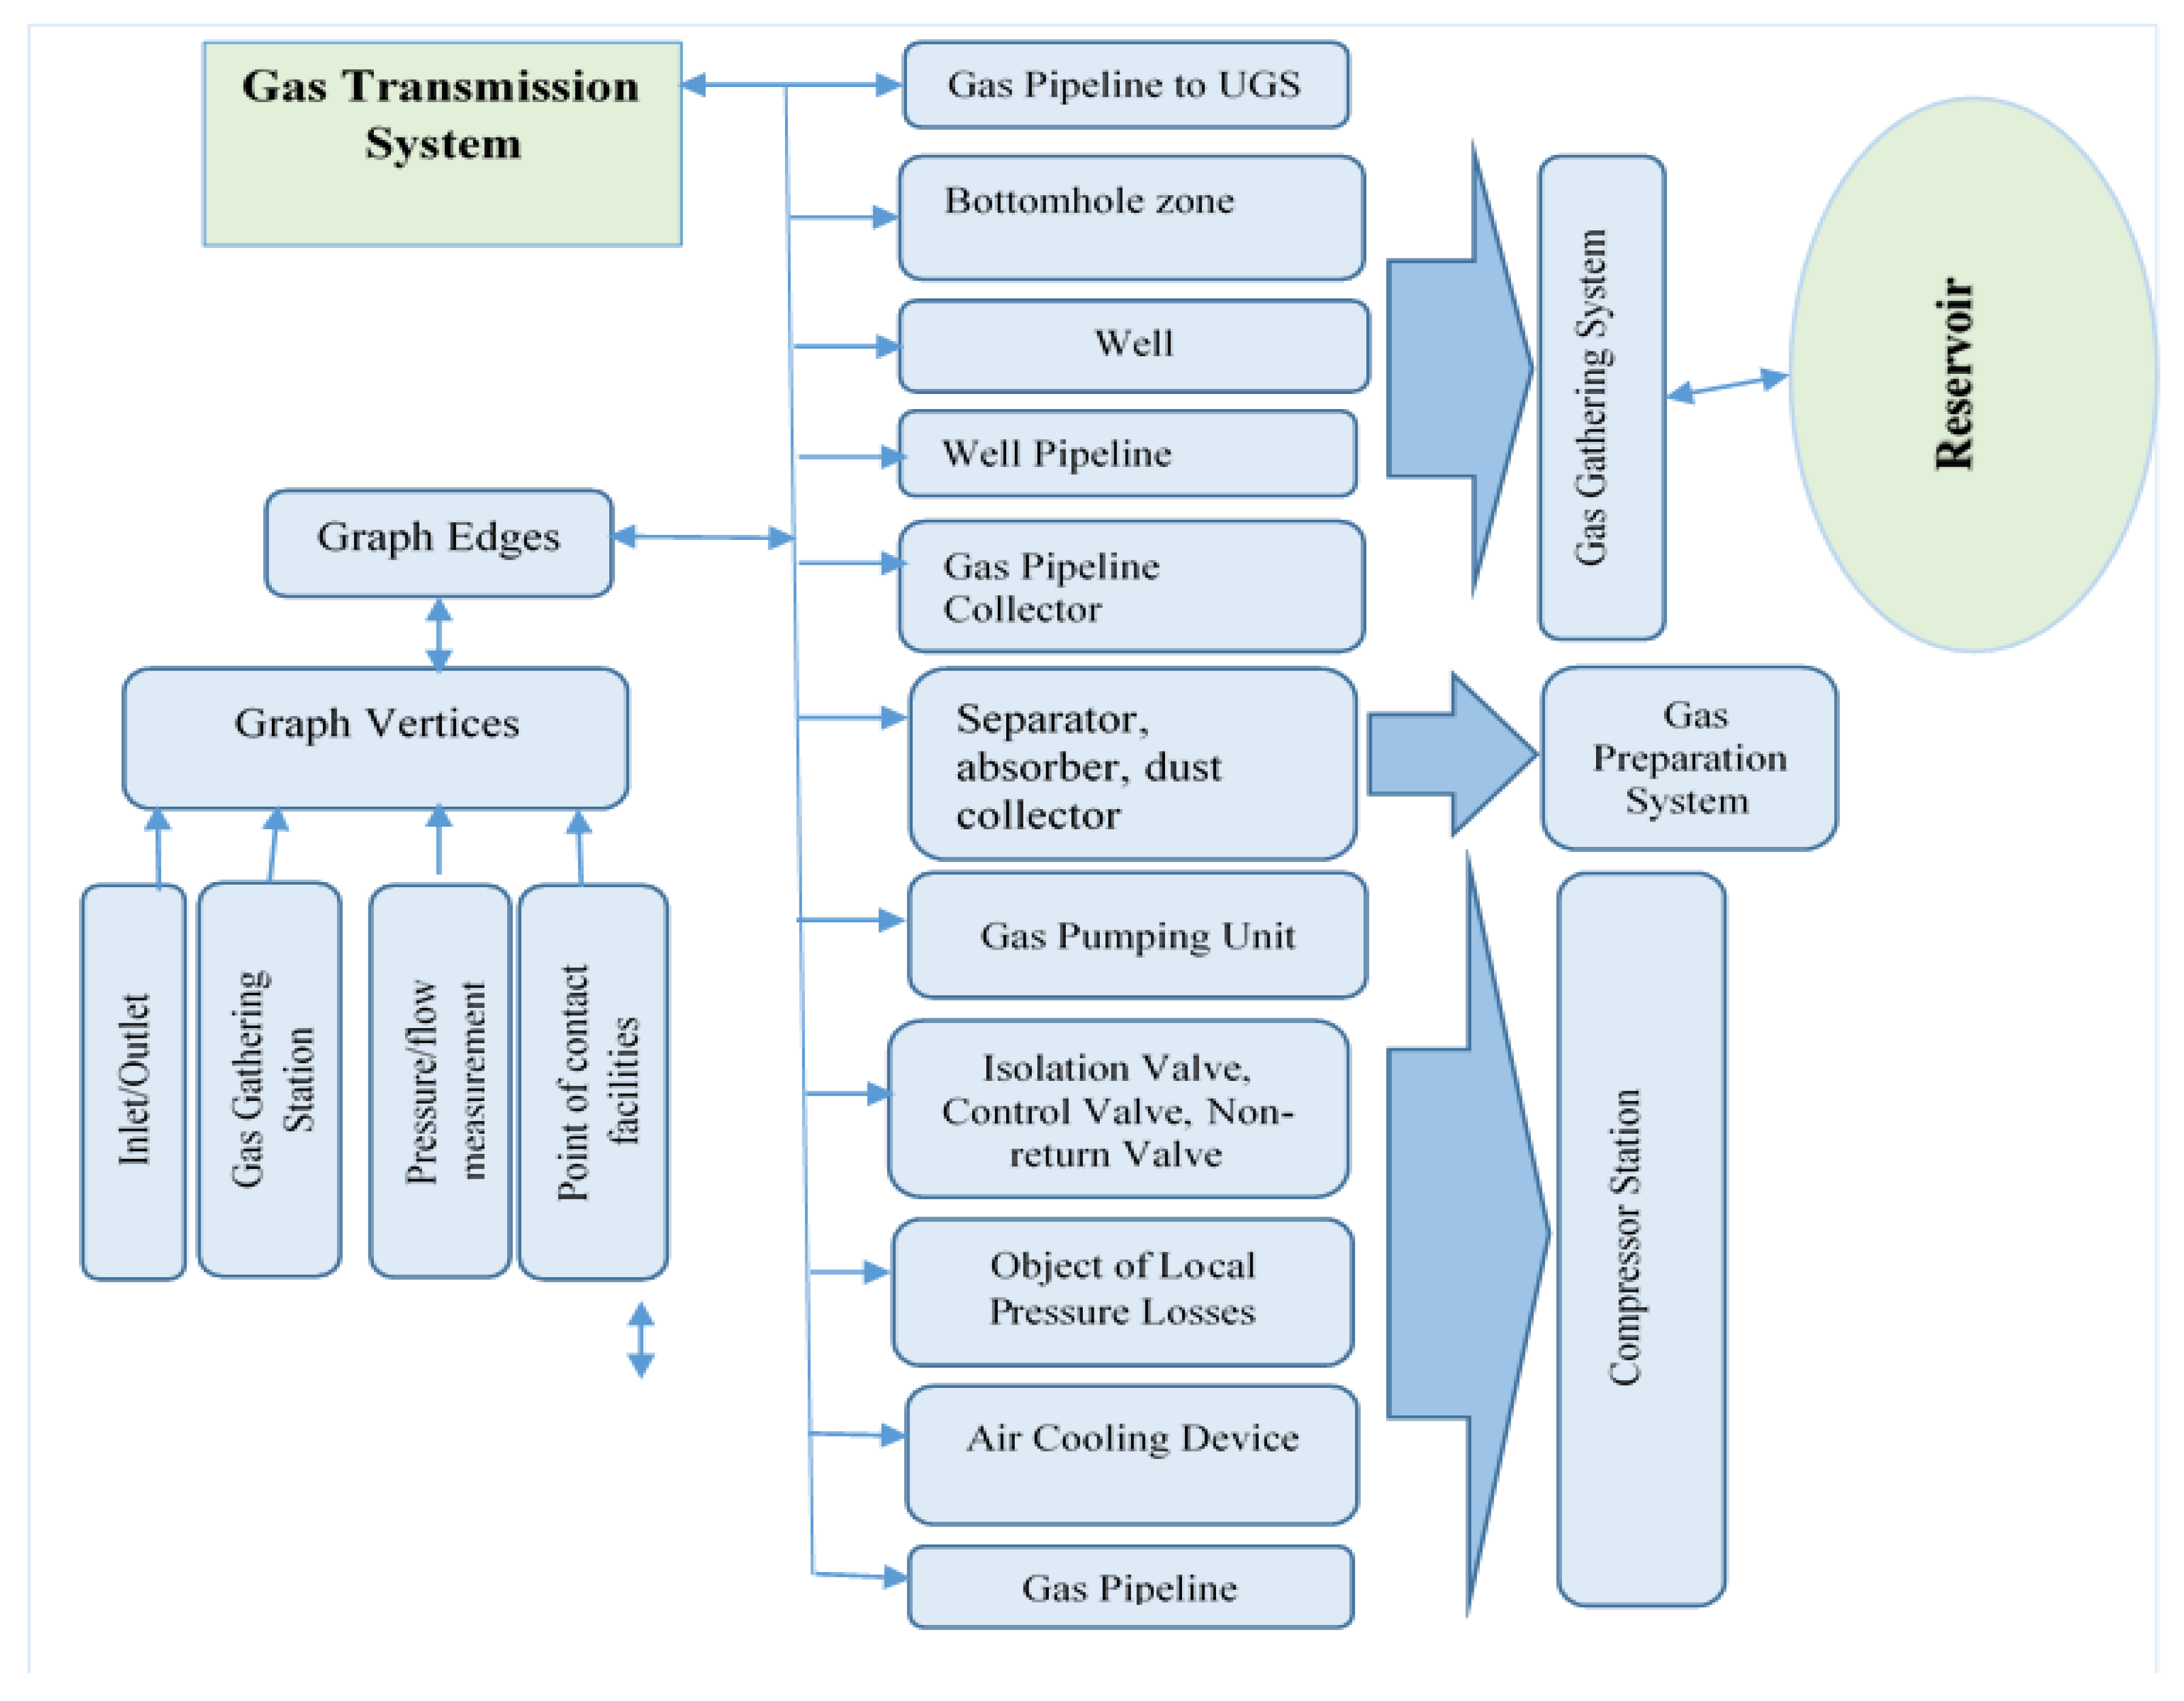
We formed a mathematical model of UGS on the basis of the filtration model of reservoirs, models of UGS structure and mathematical and algorithmic (simulation) models. These models are “stitched” into a single hydraulic system by conditions of conjugation of gas-dynamic parameters at the boundary of different types of facilities (balance models), as shown in
Figure 2. The mathematical model of the structure of UGS, in terms of graph theory, provides:
Correct formulation of tasks;
An automated process of UGS model construction with changes of facility models and topology of graph diagrams;
Development of universal procedures for the implementation of models;
Analysis and interpretation of modeling results and comparative analysis of UGS operation options; and
Development of UGS functional support without adjustment of existing (basic) mathematical methods and software, etc.
3.1. Mathematical Model of UGS Structure
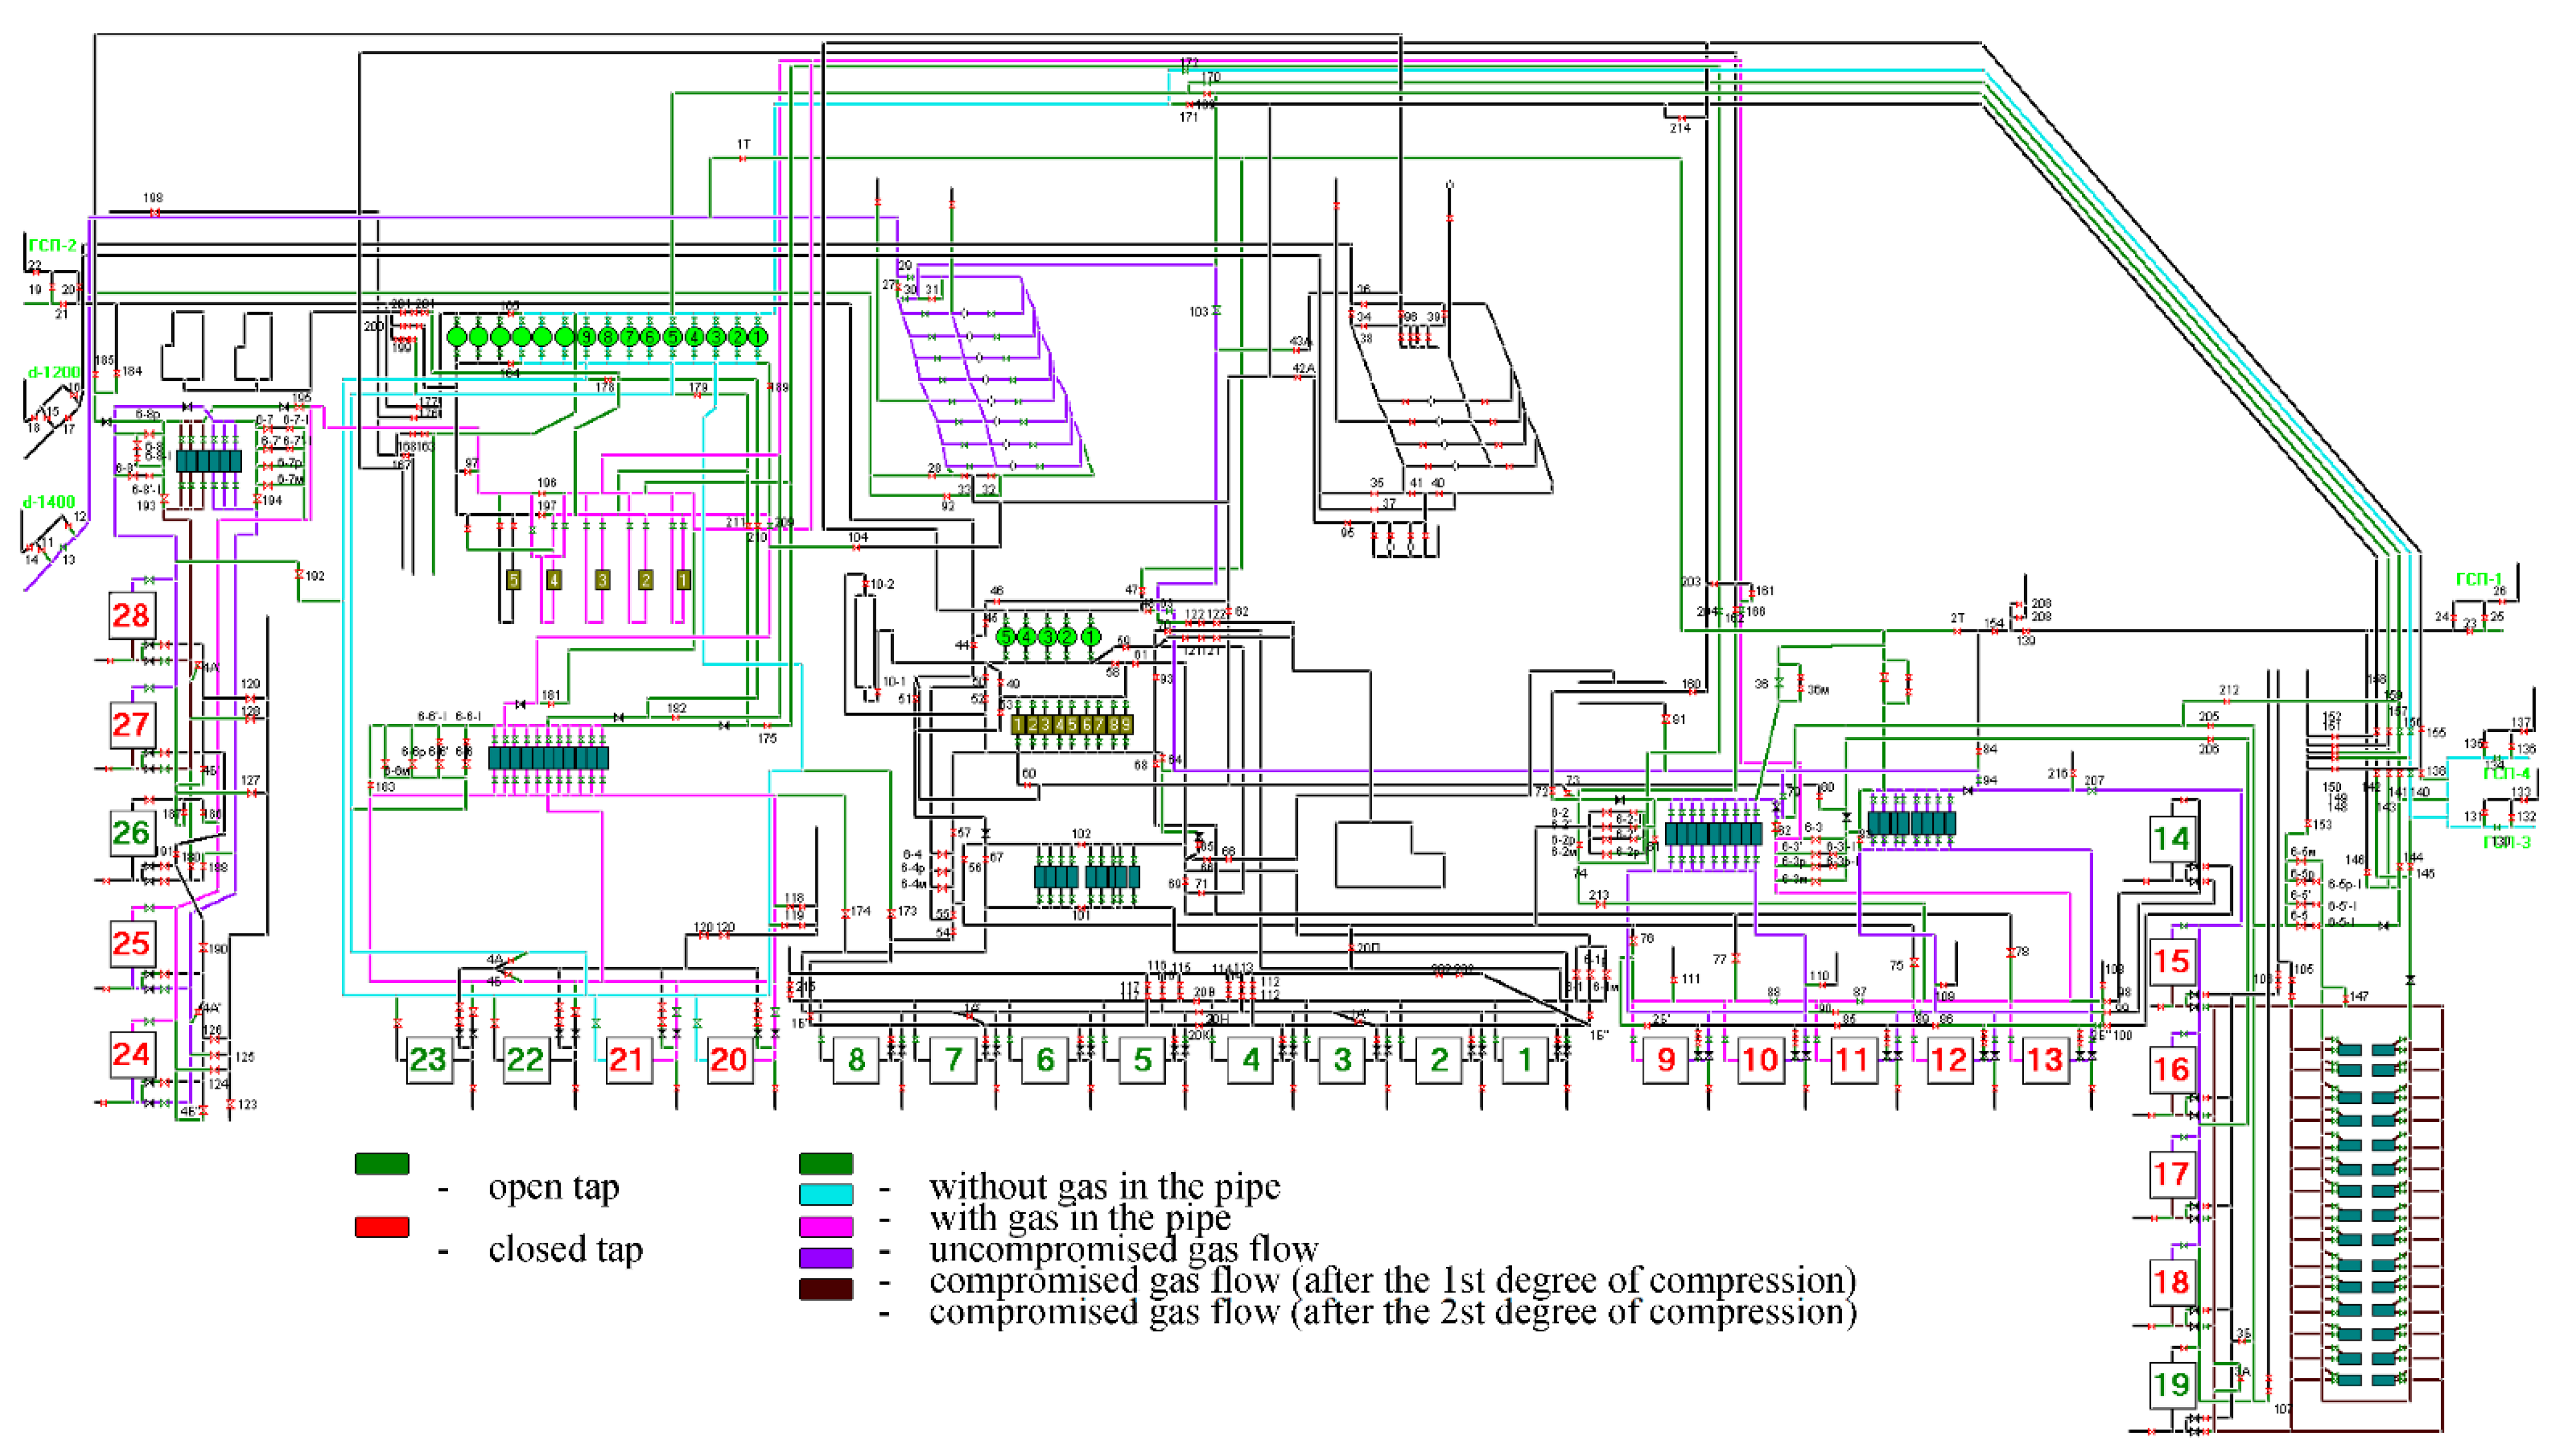
Underground gas storage facilities are structural components of the gas transmission system (
Figure 3).
For all UGS facilities, we developed their information models, as well as software for representation of the piping and instrumentation diagram of UGS in terms of the theory of graphs (
Figure 4).
We developed a graphic editor, algorithmic and software designed to create, edit and view the piping and instrumentation diagram (P&ID) and support decision making of the manager.
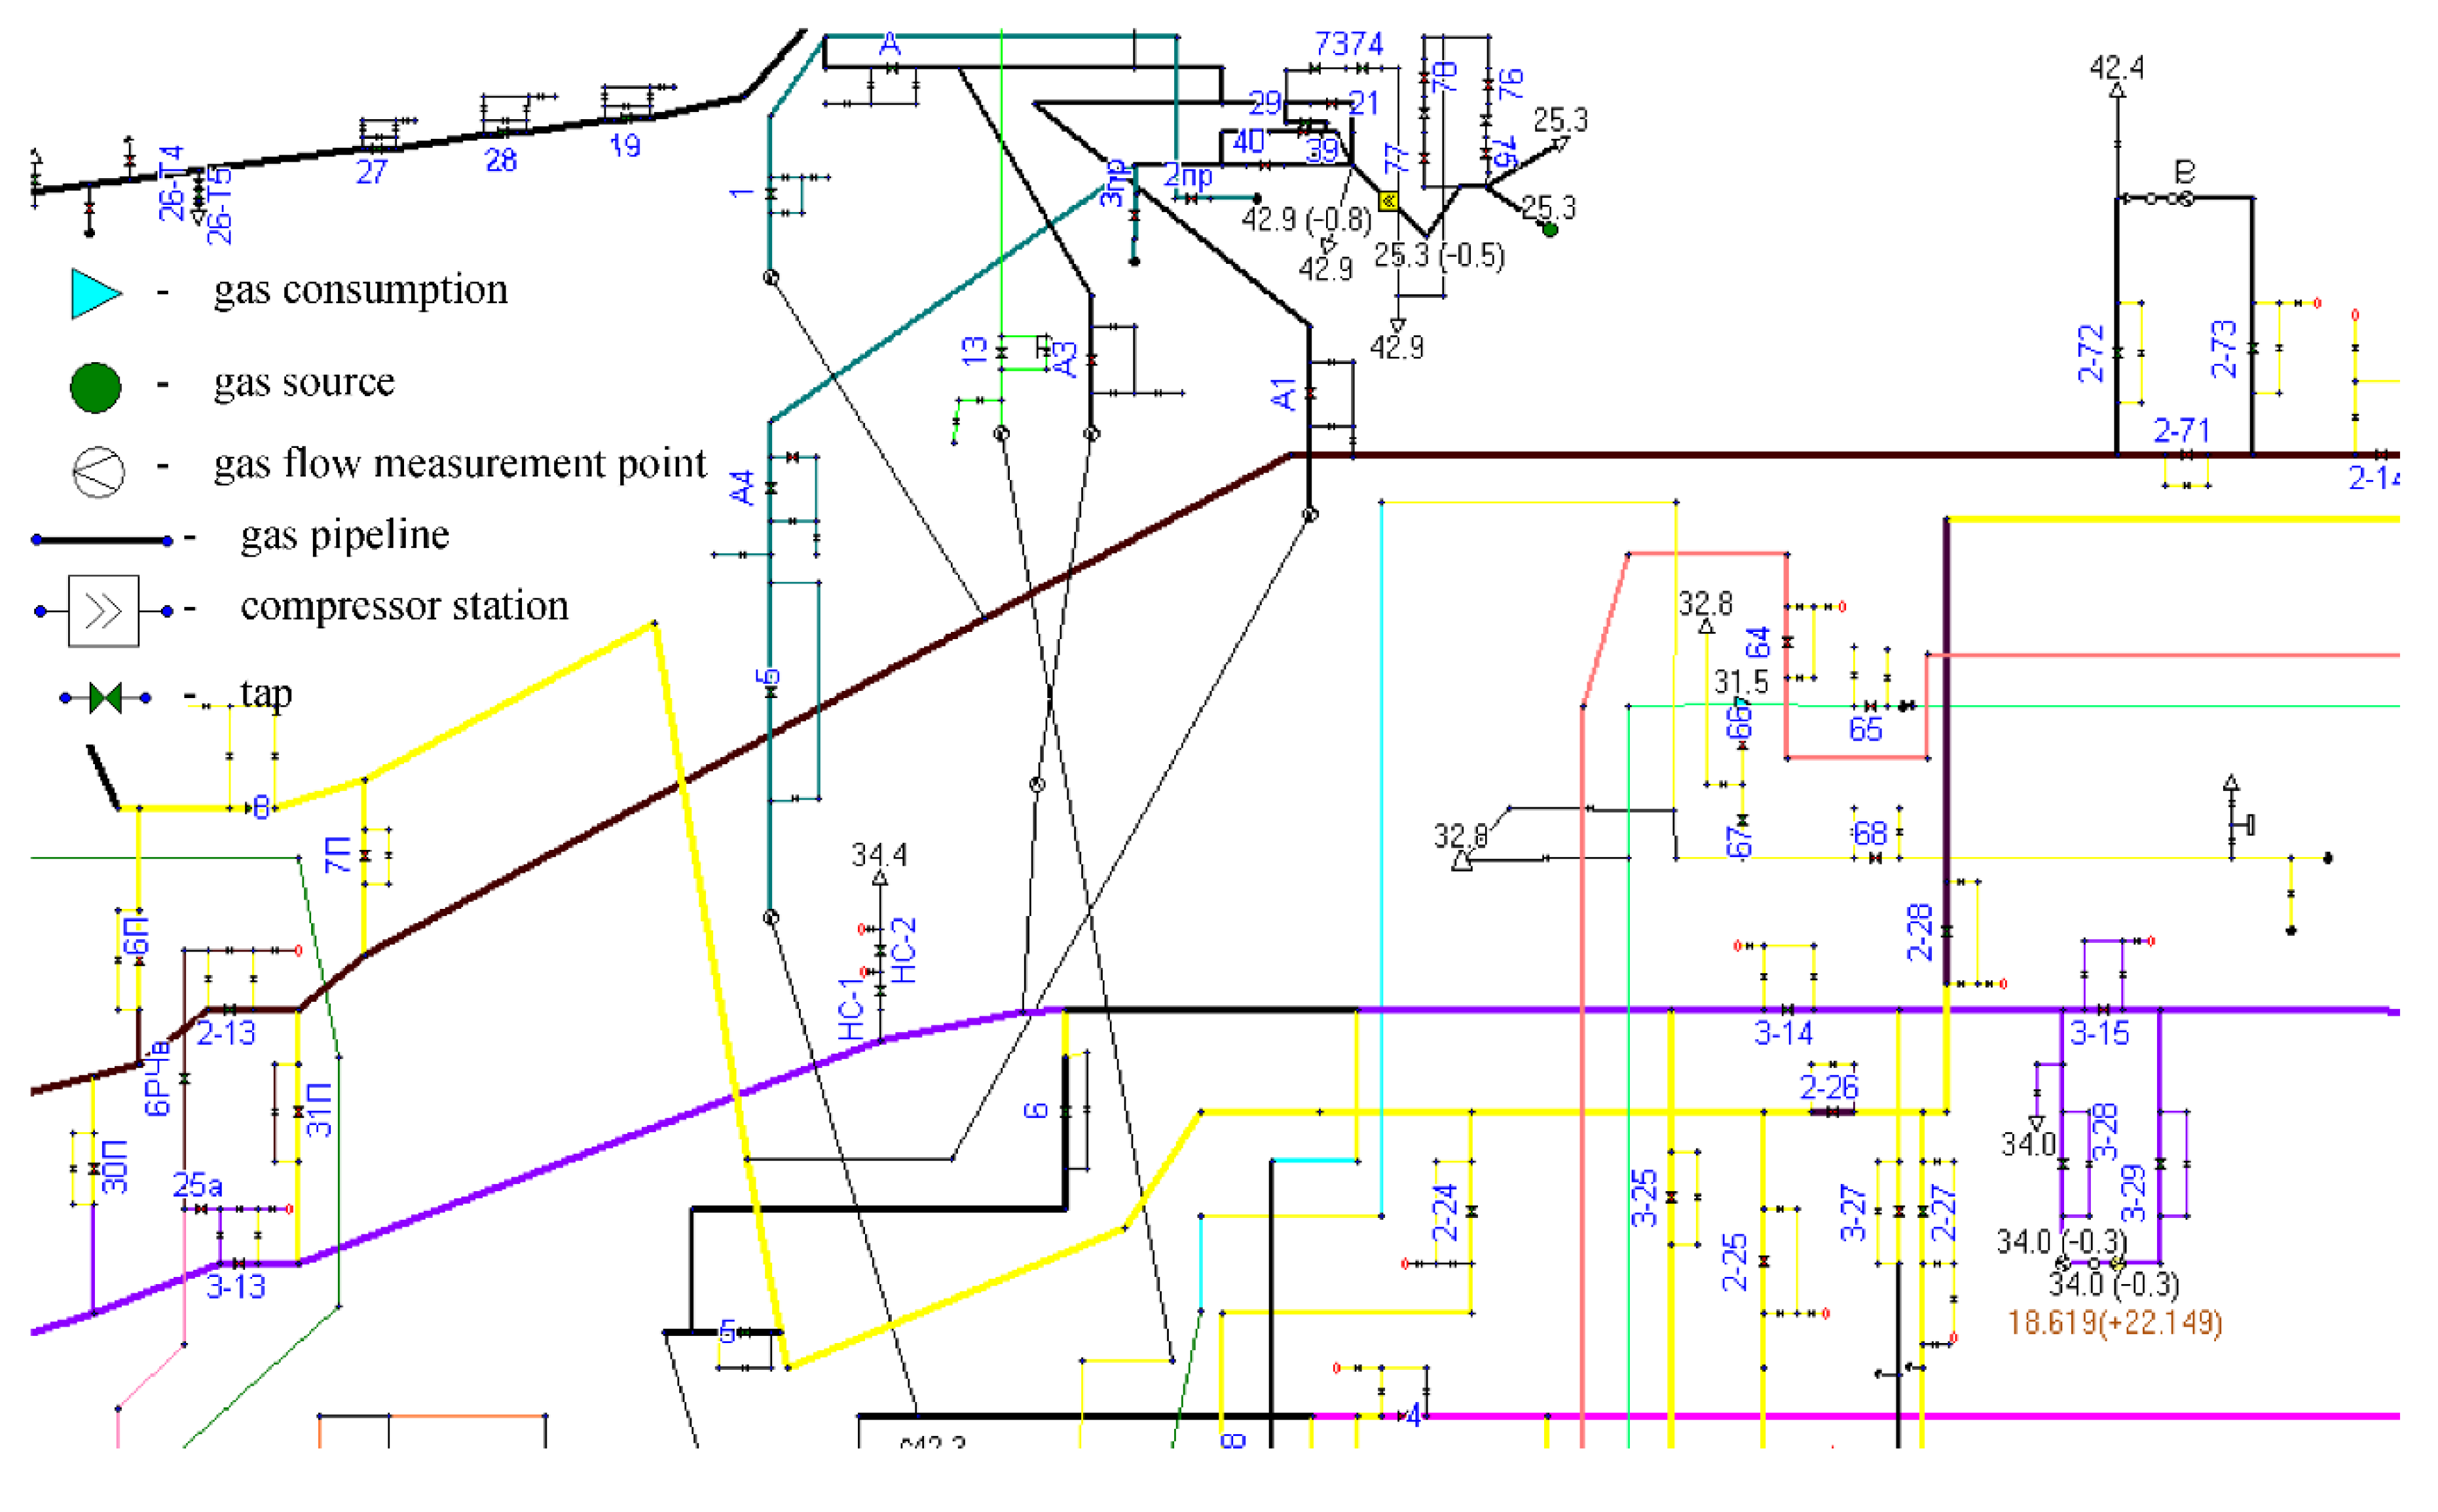
Figure 5 shows a piping and instrumentation diagram, which is a structural model of GTS and UGS. It is integrated with the measured parameter databases and is updated automatically.
Prompt updating of graphic information is the basis of relevance of the piping and instrumentation diagram. Therefore, it is generated, assembled and configured automatically at each mode time. The main functionalities of the editor of the piping and instrumentation diagrams provide:
Formation of a unified system of classification and coding of facilities of gas transmission and storage;
System connection of concepts, classes of objects and relations between objects of the subject area of gas storage;
End-to-end addressing of all facilities of the system, i.e., the code of the same object coincides across all diagrams;
Object orientation of all developed piping and instrumentation diagrams; and
Creation of a graphical database (DB) of integrated object-oriented information structures, which are then used in computer and analytical complexes in order to support the adoption of control decisions at all levels of UGS management within the GTS of Ukraine.
The subject area objects described in the database have unique identifier keys. The same graphic symbols of facilities are used at all levels of diagrams.
3.2. Mathematical Model of Gas Filtration in Reservoirs
Because most of the surfaces of reservoirs have small slopes, they can be considered horizontal. The thickness of the layers in the vertical component usually varies from a few meters to 50 m. Other dimensions of the layers are orders of magnitude larger. The pressure change within the reservoir capacity is insignificant. The numerical model of the reservoir takes into account its distributed power for each element of its triangulation.
Before developing the hydrodynamic model, we analyzed:
Geophysical information obtained during the operation of the UGS reservoir at the stage of the gas field;
Logging maps of wells;
Available UGS operational information;
Project information for the creation of UGS;
Technical and technological information of UGS equipment manufacturers; and
Detailed piping and instrumentation diagrams, etc.
The obtained results offer the opportunity to create information models of all involved facilities (those that have a model of gas flows) and an integrated detailed piping and instrumentation diagram of UGS in terms of graph theory.
In the next stage of constructing a hydrodynamic model of UGS (after creating an information base), we developed models of individual components of the integrated model. Because we developed the UGS model to solve a comprehensive set of tasks of UGS dispatch management, we set specific requirements: a set of direct and inverse tasks, functionality, sometimes complexity, the level of automation of problem solving and updating of information support, accuracy of modeling results, etc.
To create a model of gas filtration in reservoirs, we conditionally divided the area of gas filtration in reservoirs into: bottomhole zones of wells and the area of the reservoir outside bottomhole zone. This is due to the varying speed of filtration processes. In the bottomhole zones of wells, the linear Darcy’s law is violated, i.e., the linear relationship between the filtration rate and the pressure gradient.
Consider the formation as an area (Ω*) with a thickness of , which is significantly smaller than its other geometric dimensions, i.e., an insignificant value (on the order of several tens of meters). In connection with this, the pressure drop along the height can be neglected, and this area can be considered two-dimensional (Ω) with a contour (Γ). Pressure values are set in the Ω region, at the points with coordinates , , (reservoir pressures in the area of placement of production and observation wells). From the filtering area, we exclude subareas in which points , with contours Γi are placed.
During the filtration process, the gas pressure
in the UGS reservoir in Cartesian coordinates is described by the following equation [
50]:
Equation (1) at the boundary (Γi) of region Ω satisfies the boundary conditions:
—vector components external normal ν to the area ;
—permeability coefficient, m2;
—porosity coefficient;
—the thickness of the gas-saturated layer, m;
—source function, m3/s;
z—gas compressibility coefficient;
μ—coefficient of dynamic viscosity of the gas, Pa·s; and
p0—gas pressure under atmospheric conditions, Pa.
If gas is extracted (injection) from (into) underground storage facilities through
n wells located at points
, during a certain period of time (
,
), then the density of withdrawal is represented by the following formula:
where
—gas withdrawal from the i-th well, m3/s;
—Dirac delta function;
—single Heaviside function; and
V—the volume of the gas-saturated reservoir, m3.
To build a mathematical model of the pressure distribution in the well area, it is advisable to express Equation (1) as cylindrical coordinates. Given that the area of the well compared to the entire storage facility is small, the parameters included in Equation (1) can be considered constant in coordinates for a given time interval. Under such assumptions, the equation of gas filtration in terms of cylindrical coordinates will be expressed as [
50]:
where
represents the condition of an isothermal process of gas state change,
is the radius vector drawn from the center of the well and
is the initial value of the pressure and the value of the pressure at the boundary of the area according to Leibenzon.
Equation (1) includes empirical information, which is problematic enough to identify with the required accuracy because it is impossible to identify or separate the influencing factors for each empirical quantity in particular. The geophysical information and parameters of the reservoir structural map are also approximate.
3.3. Gas Gathering System
The process of gathering gas from wells is a system of small-diameter pipelines with lengths up to several kilometers long. The pipelines are laid on the ground with elevations that differ slightly from each other. Therefore, we can assume that the process of gas movement in such a system is stationary and isothermal. In this case, the parameters of gas flows in the pipes satisfy the following equation [
51]:
where:
υ—gas flow rate, m/s;
D—inner diameter of the pipeline, m;
h—elevation of pipeline, m;
λ—coefficient of hydraulic resistance;
—freefall acceleration, m/s2;
—current coordinate , m,
l—the length of the pipeline, m; and
ρ—gas density under operating conditions, kg/m3.
There are simple gas gathering systems and collector systems. A collector system comprises many wells connected to a collector gas pipeline. Several gas collector systems can be connected to the gas gathering station. In such cases, complex tree-like structures are formed that can be considered distribution gas networks.
3.3.1. Modeling the Process of Gas Movement in Well Gas Pipelines and Working Columns
To establish the hydraulic relationship between the gas mouth pressure (
pmp) and the pressure at the bottomhole zone (
ppw), the formula obtained by integrating Equation (6) is used:
where:
—the flow rate of the well under standard conditions, m3;
—gas density under standard conditions, kg/m3;
—the height of the working column, m;
—gas constant, Dj/kgK;
—gas temperature in degrees Kelvin; and
—the cross-sectional area of the working column, m2.
The mathematical model of gas motion in horizontal pipelines is obtained from Equation (7), assuming .
3.3.2. Model of Gas Inflow to the Bottomhole Zone of the Well
In the process of gas filtration, the reservoir pressure in the area of well placement (on the contours of the well supply area) changes slightly over several days. The most significant changes in gas pressure occur at the bottom of wells. When changing the mode of operation of wells, it changes rapidly. Over time, it changes, i.e., decreases or increases, depending on the flow rate of the wells and the filtration parameters of the near and far zones. The nature of the change in pressure at the bottom of the wells (over time) is sensitive to the filtration resistance of the gas inflow area. We will evaluate these changes under the condition of stationary gas flow and refine them in the process of conducting numerical experiments on non-stationary gas flow to wells.
Stationary Mode of Gas Inflow to the Well
To calculate the inflow of gas to the well, several mathematical models of varying complexity and adequacy were built. The most commonly used mathematical model is based on the assumption of a spherical law of gas flow. In [
21], the equation that simulates the process of gas movement in the bottomhole and connects the bottomhole pressure with the reservoir pressure (on the contour of the well supply zone) is expressed as:
where:
—values of pressure, well flow rate and gas density, respectively, under normal conditions; and
—filtration surface area.
The coefficient of vortex resistance (
) is the least studied. In [
52], data on the calculation of the coefficient of vortex resistance for gas filtration in the reservoir are formed from four grain sizes (from 3.1 to 0.42 mm). Processing of these data showed that the coefficient (
) is approximately equal to one. In particular, the coefficient (
) can be represented as [
53,
54,
55,
56]:
where
is the gas saturation coefficient, and
is the grain diameter of the rock.
The coefficient of macroroughness (
l) can be used to determine the
β coefficient. In the first approximation, the relationship between
l and
k is expressed as:
For uniformly anisotropic reservoirs, reservoir (
Pr) and bottomhole (
Pb) pressures are related by the following relation [
57,
58]:
In the case of isotropic reservoirs, the filtration resistance coefficients are expressed as follows:
where:
i —pressure and temperature under normal conditions; = 1013⋅105 Πa; = 273 K;
—the average temperature of the gas in the reservoir, K;
—the radius of the well along the bit, m; and
—the radius of the drainage zone, m.
To analyze the quality of the opening of the well bottomhole zone and model the inflow of gas to the well, the following the two-zone formula can be applied [
57]:
where:
where:
—radius of the bottomhole zone, m;
—the height of the part of the casing that is perforated;
and —perforation channels, where are the radii and lengths of perforation channels, respectively; and
—perforation density ().
Non-Stationary Mode of Gas Inflow to the Well
The mathematical problem of calculating the pressure change in the bottomhole zone for time
and at a constant flow rate is reduced to solving the equation of the theory of the elastic operating mode of filtration [
58]. The parameters of the gas movement process in the bottomhole zone can be calculated on the basis of Equation (5) under varying boundary conditions.
- 1.
At the initial moment of time, , , and at the boundary of the region:
—initial pressure;
—atmospheric pressure;
—the area of gas inflow to the well; and
—the condition of impermeability of the outer region of the gas flow to the well.
The flow rate of the well is calculated as follows:
Under such boundary conditions, the solution of the formulated boundary value problem for a small r value is expressed as [
59]:
where
is the integral exponential function.
Equation (13) can be used to calculate the parameters of the bottomhole zone of the well. To calculate the exponential function, it is expedient to use Ramanujan’s formula [
60], which provides fast convergence when calculating the definite integral:
where
γ = 0.5772 is the Euler–Mascheroni constant.
If the argument of the integral exponential function (
) is in between
then to calculate the pressure change in the bottomhole zone of the well, taking into account
, the following formula can be applied:
where
, and
.
- 2.
The radius of the outer circle () is , and the radius of the concentric inner circle () is . Boundary conditions are naturally set as follows:
The initial pressure distribution () is constant;
At the external border () condition, ; and
At the internal border, .
Here,
. Under such boundary conditions, the solution of Equation (5) is expressed as:
The last equality indicates:
where
is the Bessel function of a valid order argument (
),
is the Neumann function of order
,
of the equation
According to the definition of the weight flow of the well:
Then, to calculate the weight flow rate of the well, the following formula is obtained:
Here, the constant
must be determined, and function
satisfies the following equation:
Both integrals must be taken along the contour (
). Because for small values of the argument:
for small values,
is approximated as:
and
If parameter
decreases indefinitely, then the second integral goes to zero. In this case, the pressure distribution is determined by the following formula:
Determination of Gas Temperature at the Wellhead
The temperature of the gas moving along the wellbore is influenced by the following factors: throttling of gas in the bottomhole zone and in the wellbore, heat exchange of gas with the environment (multilayer rocks), mechanical lifting of gas and friction of gas with the walls of the well, among others. Taking into account the above factors, the expression for determining the mouth temperature of the gas has the following form [
61]:
where
—reduction in gas temperature in the bottomhole zone;
—thermal efficiency ();
—throttle effect;
—thermal conductivity of the rock;
—reservoir temperature;
—soil temperature; and
—the depth of the constant temperature zone, m.
The change in gas temperature in the bottomhole zone is calculated by the following formula [
61]:
where:
, —weight consumption of gas, kgF/h;
—well operation time, hours;
—effective reservoir capacity, m;
—specific heat capacity of gas;
—volume thermal conductivity of rocks; and
—average gas density.
The temperature of the gas at the bottomhole of the well is less than the value of the reservoir temperature of the gas by the value of the temperature drop as a result of the throttle effect in the bottomhole zone:
Balance Models of Reservoirs
The construction of a hydrodynamic model of gas reservoirs is often preceded by the construction of an appropriate, simplified, balance model, providing an assessment of the average gas depression at the location of wells. The volume of gas withdrawal
and the mean reservoir pressure
in the reservoir are related according to the following formula:
Gas withdrawal volumes
over time
can be estimated using the following formula:
In the last two formulae, are the gas temperature under standard conditions and the gas temperature in the underground storage facility, respectively; is the gas pressure under standard conditions; is the coefficient of gas compressibility at time . As shown in the last formula, the volume withdrawn gas depends on the ratio. The value of the open pore volume () of the reservoir is calculated in the process of numerical experimentation on long-term measured data, i.e., the average reservoir pressures and gas withdrawal volumes.
However, a small change in pore volume leads to a significant error in calculating the volume of gas
; therefore these formulae only provide estimates. In practice, the average reservoir pressure is calculated based on the measured pressures at the wellheads under the condition of stabilizing pressure in the bottomhole zones of the wells. In this case, the arithmetic mean of these values is taken as the average. In the general case, the average reservoir pressure is determined as follows:
Take the circular region of gas inflow to the bottom of the well with radius
. Then, the volume-weighted average pressure (
) in the reservoir is determined according to the following formula:
Under conditions of steady radial gas filtration, the pressure distribution is determined by the following formula:
where
is the pressure on the circular contour of the annular drainage area, limited by the radius (
); and
is the pressure on the contour of the well with a radius of
. From the last two formulae, the following formula is obtained:
where:
With sufficient accuracy for practice, the average value of pressure can also be calculated by the following formula:
Here, .
If the area of gas inflow to the well is given by a sphere with a radius of
and the well is a sphere with a radius of
, then in spherical coordinates, the steady motion of the gas is described by the following equation:
In the case of spatially radial steady motion under boundary conditions:
the pressure distribution in the area between the spheres with radii
and
is determined by the following formula:
Then, the average value of pressure in this area is calculated by the following formula:
Because the radius of the well is much smaller than the radius of the gas inflow area, then:
3.4. Model of the Gas Pumping Unit
The main facility of the CS is a gas pumping unit (GPU), comprising a drive and a centrifugal supercharger (CSC). It is known [
3] that the parameters of the gas at the inlet and outlet of CSC can be linked using the following set of empirical equations:
Other operating parameters of GPU can be determined according to the following formulae:
where:
—revolutions of the centrifugal supercharger (CSC), 1/s;
—gas consumption through CSC, m3/s;
—polytropic efficiency of CSC;
—nominal fuel gas consumption, m3/s;
—degree of compression;
—rated power of the gas turbine unit (GTU), W;
—coefficient of technical condition of gas turbine units (GTUs);
—coefficient that takes into account the influence of atmospheric air temperature;
—air temperature at the entrance to the gas turbine, °C;
—nominal air temperature at the entrance to the gas turbine, °C;
—absolute atmospheric pressure depending on altitude H, ata;
—internal power of CSC, W;
—nominal lower specific volume heat of combustion of fuel;
—nominal efficiency of GTU;
—mechanical efficiency;
—technical condition according to capacity;
, , —gas parameters at which the characteristics of the supercharger are experimentally determined;
—specific weight of gas under standard conditions ( = 0.1033 MPa; = 293 K), kg/m3;
—rated speed of the supercharger, 1/s; and
—empirically established functions.
The given characteristics take into consideration:
Deviation of the gas parameters at the inlet to the supercharger from their consolidated values;
Deviation of the actual speed of the supercharger () from its nominal value ().
The polytrope index is determined according to the following relation:
Its value is specified (according to the known
and
) using the following formula:
To calculate the internal power of the centrifugal supercharger the following known formula is used [
62]:
where
is the polytrope index.
In practice, there is a set of technological limitations for CSC GPU, in particular, related to:
The position of the operating points on the characteristics of CSC to ensure the pump-free operation of the GPU;
Minimum and maximum volumetric capacity of CSC;
Speed of rotation of the shaft CSC ();
Maximum capacity of the GTU of GPU;
The maximum outlet pressure of CSC, which is determined by the strength of the pipelines at the outlet of the CSC;
The maximum temperature at the outlet of CSC, which is determined by the insulating coating of the pipelines;
The minimum value of the pressure at the outlet of each CSC;
Conditions associated with the specified level of stability of the GPU (distance from the surge zone); and
Conditions of coordination of the scheme of connection of CSC with the inlet and outlet pipelines and main gas pipelines.
In a multishop CS, each shop is equipped with the same type of GPU, which can have different replaceable CSC impellers. A multishop CS is calculated according to the distribution of gas flows between the shops, enabling the minimization of total energy costs. Assume that a compressor station consists of GPU groups connected in parallel, each of which has sequentially operating shops (). Because the shops have different types of units, their restrictions also differ. They differ in terms of the following parameters:
Area of regulation by CSC revolutions;
The maximum permissible limits for the performance of aggregates; and
Limits on the volume performance of centrifugal superchargers.
Therefore, additional restrictions must be set for such compressor stations:
where:
—the flow rate in supercharger of the -th shop of the -th group;
—the productivity of the - th group;
—pressure increase in the -th stage of the -th workshop;
—pressure increase in the -th group of consecutively working shops; and
—the number of degrees of gas compression in the -th workshop of the -th group.
The functionality to minimize in this case is expressed as , where is the fuel gas consumption of the -th workshop of the -th group.
3.5. Integrated UGS Model
We formed an integrated UGS model on the basis of the following information support:
Piping and instrumentation diagram of GTS + UGS;
Piping and instrumentation diagram of the system “bottomhole—wells—gas collection system”;
Piping and instrumentation diagram of the compressor station;
Structural diagram of the reservoir;
Geological structure of the reservoir;
Technological indicators of underground storage operation;
Technical characteristics of UGS facilities;
Reports of geological and technological operation of underground storage facilities (operational indicators and gas-dynamic studies of wells);
Base of models of gas flows in facilities; and
Database of measured data.
We formed the integrated structural model conditionally based on three system models (
Figure 1):
- (1)
Reservoir model;
- (2)
Model of the technological chain, which consists of a model of gas flows of bottomhole zones of wells, a model of a well and a model of a gas gathering system; and
- (3)
Technological chain “gas gathering station—main gas pipeline”, with a compressor station as the main object of the chain.
It is often necessary to calculate the pressure at the inlet/outlet of the underground gas pipeline based on the pressure in the main gas pipeline. In this case, it is necessary to integrate a part of piping and instrumentation diagrams of GTS with piping and instrumentation diagrams of underground storage.
The latest technological chain additionally covers gas preparation systems (cleaning and drying to ensure a given dew point of gas) and its cooling, for each of which we built models such as hydraulic equivalents.
To integrate the models into a single hydraulic complex of models of facilities of the technological chain, “reservoir—gas collection point”, we use the following equation:
The mathematical model of the structure of the technological chain “bottomhole zone—gas gathering station” is represented by the graph . Each edge () of the graph has its own type. The type of edge corresponds to the facility or hydraulic equivalent. The following types of edges are included in the technological chain “bottomhole zone—collector pipeline”:
Bottomhole zone
Well
Well casing ; and
Well pipeline .
The area of the bottomhole zone is considered homogeneous according to the “permeability” parameter. All vertices () belong to a circular area with a contour (), i.e., the area of the bottomhole zone. The pressure at the vertices of the contour () is the reservoir pressure for the -th well.
The model of the compressor station is formed on the basis of the model of the structure (graph diagram) of the CS and models of its facilities. We present the model of the CS structure in the form of a graph (
Figure 7), in which objects that have a length are represented by edges, and all others are represented by vertices.
The model of the compressor station is formed on the basis of the model of the structure (graph diagram) of the CS and models of its facilities. The model of the structure of the CS is represented in the form of a graph (
Figure 7), in which facilities that have a length are edges, and all the others are vertices.
4. Discussion
In open-source models, there is no reliable and comprehensive information outside Ukraine on the basis of which it was possible to conduct a comparative analysis of our developed mathematical methods. It is difficult to assess the quality of mathematical methods for underground storage facilities based on the available open-source implementations, which are mainly for gas fields. The range and complexity of the tasks that accompany the operation of gas fields and UGS differ significantly. The tasks of UGS dispatching management set their requirements for the process models in the UGS facilities and the integrated UGS model in general, including:
The need to provide access to the adaptation parameters of each facility separately;
The requirement to identify and analyze the work of individual technologically related facilities;
The need to solve all the necessary direct and reverse tasks in the operational dispatching management of processes at the UGS within a satisfactory time frame; and
The requirement for the development of mathematical methods with minimal intervention in the existing mathematical methods.
In the process of forming a UGS model, it is necessary to avoid binding a significant number of gas flow parameters on the boundaries of various mathematical models (ensuring the implementation of thermal and balance equations). In such cases, incorrect mathematical problems arise; the binding of a significant number of parameters of gas flows results in the instability of the method.
The process of analysis and development of existing information support occurs in parallel with the process of constructing models. The completeness and quality of the measured data and existing empirical expressions affect the process of both constructing models and formulation of the problems. The insufficiency of measured data often requires simplification of gas flow models, the development balance models, the construction of hydraulic equivalents, simplification of the piping and instrumentation diagram, averaging of data and a reduction in the dimensionality of models.
In this article, we proposed a set of mathematical models of gas flows in the main facilities and a model of the structure of underground gas storage facilities. UGS operating modes often change day-to-day. Each mode requires changes in piping and instrumentation diagrams in accordance with changes in the model of underground storage. Therefore, the model of the structure (piping and instrumentation diagram/graph diagram) of the underground gas storage facility is presented in universal terms of graph theory. All edges of the UGS graph diagram have types. Each type of edge contains information and a mathematical model, which allows for automation of the process of constructing a model UGS in the process of building a piping and instrumentation diagram. This approach to developing a model of a complex system enables a combination of formulation of an exhaustive list of correct mathematical problems to ensure effective dispatch control of processes at UGS and simplifies the development of universal methods and algorithms for their implementation. The universality of methods and algorithms ensures the absolute convergence of methods in the field of manufacturability of underground storage operation and the operation of algorithms with minimal complexity, taking into account all technical and technological limitations on gas flows in facilities.
The proposed models solve a topical scientific and applied problem: an integrated model of a complex system of network type that is focused on solving the dispatching problems of the mathematical physics of the process control of UGS.
5. Summary and Conclusions
At significant time intervals, only hydrodynamic modeling provides a physically correct interpretation of the measured industrial data, provided that the main physical factors influencing the nature of filtration processes are sufficiently studied. No formalized approaches to building models of complex systems, including UGS, have been established to dated. In the process of building a model, ignoring certain features of the facility often leads to the inadequacy of the model. The peculiarity of the UGS model is that the UGS can be in an infinite number of states, and the model is verified in parallel with the process of UGS operation.
The results of the research allow us to draw the following conclusions:
Hydraulic models of underground storage facilities are often built on the basis of analysis of the results of petrophysical and geological modeling. This approach does not guarantee the required accuracy of the properties of the hydrodynamic model, as the geological information is fragmentary and heterogeneous in detail, reliability and completeness, with an unknown degree of adequacy. The correctness of the geological model is often clarified in the process of hydrodynamic modeling.
The main source of information support for the process of building models of UGS facilities is the available industrial operational information. In many cases, it cannot be unambiguously interpreted due to the impossibility of a separate study of many factors influencing their behavior. Thus, the volume of the pore space of the reservoir depends on its geometric dimensions, porosity distribution and, in part, on the distribution of gas saturation and permeability. The inaccuracy of estimating one parameter is transferred to the inaccuracy of estimating other parameters.
To construct hydraulic equivalents, multiple physical explanations are often available for the same array of available observed data.
The input data for hydrodynamic modeling contain random and systematic errors that do not allow for a correct physical explanation; therefore, it is often impossible to identify them.
Development of a UGS system model is one of the stages of the life cycle of the development of mathematical methods and software. The development of the model was preceded by the division of the facility into components (which are described by “simple” models) and their partial integration into several system components. This presentation was dictated by modern metrological support and technological information on facilities, as well as previously established lists of dispatching tasks. The selection of system components of the model was preceded by verification of the possibility of algorithmic consistency of the gas parameters of individual “neighboring” facilities on the border of their technological connection. If such algorithmic linking were not possible, the only solution would be to combine the models of these facilities into a system of equations, with the problem transferred to the development of a method for its solution.
Verification of models of both individual facilities and technologically connected facilities (system facilities) took place simultaneously with the development of mathematical methods and software. The path taken from individual equations and systems composed of these equations to the construction of models based on them will be presented in the second part of this work.
The integrated model proposed in this work is mainly focused on the development of operational and predictive decision support systems, which will contribute to the development of automated control systems for filtration and gas dynamic processes in UGS. This will ensure the improvement of UGS operating mode control systems using modern methods and technologies, the use of thermohydraulic modeling to directly solve geophysical and technological problems at UGS facilities and an increase in the efficiency of decision making in dispatch control of UGS operating modes.


