Abstract
People are increasingly using clean energy sources, contributing to environmental protection according to the general trend of the world. In the form of renewable energy, solar energy has contributed to solving current pressing problems, such as environmental pollution and air pollution, improving people’s quality of life. The design of solar power projects in Vietnam is mainly based on meteorological data sources from Meteonorm and NASA. However, the accuracy assessment of two data sources compared to the actual solar power data in Vietnam is not available, so there is no basis to determine better meteorological data source quality to serve the design of rooftop solar power projects. The content of this paper analyzes the simulation results of a typical rooftop solar power station at the Electric Power University, Hanoi city based on meteorological data sources from Meteonorm and NASA. After that, the simulation results will be compared with the actual operating data of a rooftop solar power station near the Electric Power University and other real PV systems in the world. The study results showed that the amount of electricity production using the Meteonorm meteorological data was closer to the actual data than the NASA data source. Therefore, solar power projects in Vietnam should use Meteonorm data source for the design process to determine the best economic and technical efficiency for investors.
1. Introduction
Currently, fossil energy sources are gradually depleted and accompanied by environmental pollution effects [1]. Finding new energy sources to replace traditional energy sources [2,3] is the task of all countries of the world [4]. Solar energy is a clean energy source and is very suitable for the current socio-economic development trend. Solar power generation is an industry that has been growing rapidly with continuous technological advancement, and creating millions of new jobs [5] from the production, supply, and operation chain of solar power systems.
In recent years, renewable power [6], including solar power, grew to a global record and reached 175 GWp in 2021, bringing the total installed solar power capacity to 942 GWp [7]. The investment cost of solar power still tends to continue to decrease [8] because of technological innovation, changing efficiency in the market, policies, and new business models.
Meteorological data plays an important role in evaluating the power generation efficiency and feasibility of solar power projects [9]. Ajith Gopi et al. [10] analyzed and modeled the weather impact of a utility-scale PV power plant in the tropical region. In the results of the study, a regression model of the amount of solar energy for all weather seasons was generated based on different weather parameters. A. Sadio et al. [11] used weather information (wind speed, ambient temperature, solar radiation) to determine the availability of solar power at Ngoundiane’s Site. Tarek AlSkaif et al. [12] analyzed various meteorological variables, including temperature, relative humidity, visibility, air pressure, wind speed, cloud cover, wind power, precipitation, and evaluated their impact on photovoltaic (PV) power output. In Stefan Kuchler’s study [13], weather parameters were collected to simulate a solar power station at the University of Surabaya, Indonesia. The results of the weather data collection showed that there was a discrepancy between satellite data and measurement data at the on-site meteorological station. Therefore, the weather data of the on-site measuring station will help to determine the amount of solar power more accurately. According to the research of the National Renewable Energy Laboratory (NREL) [14], the performance and degradation of the solar power system with other test results were carried out based on a comparison between the expected weather data values and the measured data. On the other hand, the Energy Assessment Test method is also proposed to record the long-term performance of a PV system. McIntyre, J.H. [15] evaluated the solar potential of Guelph, Canada with grid-mounted, roof-mounted photovoltaic (PV) and hot water (HW) panels. This work is based on atlases and meteorological data with an isolation model to assess solar resources and incorporate geographic information system data to quantify the roof area. P. A. G. M. Amarasinghe et al. [16] proposed a generalized master model that integrates deep learning techniques to generate accurate forecasts of solar power for 21 solar photovoltaic facilities located in Germany. Most of the important weather parameters for solar power generation are selected through a feature selection process. The study of Poudyal, R et al. [17] investigated the economic-technical feasibility of a 3 kWp photovoltaic (PV) system in Kathmandu, Nepal. The performance indicators applied in this study are electrical energy output, performance ratio, and economic payback. The main parameters used in the simulation are site-specific meteorological data, solar radiation, PV power factor, and electricity prices. Changsong Chen et al. [18] used weather parameters of solar radiation, humidity, and temperature in solar power projects to forecast solar power generation in the next 24 h. Y. J. Zhong and Y. K. Wu [19] identified that the availability of solar power generation systems was affected by various uncertainties, such as meteorological data on radiation, precipitation, wind speed, and temperature. According to the research of W. Derouich et al. [20], typical meteorological radiation based on satellite imagery results was necessary to be able to assess the suitable location for a solar power station.
In Vietnam, grid-connected solar power projects have been developed in recent years and they are considered a useful solution to contribute to ensuring energy security and combating climate change [21,22,23]. The Government of Vietnam has issued some mechanisms and policies to develop solar power source [24,25,26]. However, support policies for solar power including rooftop solar power expired [27] and they are waiting for new policy mechanisms from the Government next time.
Currently, there have been some research works in Vietnam forecasting the generating capacity [28] of solar power plants and designing rooftop solar power stations with the support of meteorological database sources of weather stations or satellite data sources of NASA and Meteonorm in specialized software, such as PVSYST [29,30,31]. However, there have been no domestic studies assessing the influence of different meteorological data sources on the design process of rooftop solar power projects.
The graphical abstract of the research is presented in Figure 1. In this paper, the research results of the impact of various meteorological data on the design performance of a typical rooftop solar power generation at Electric Power University in Hanoi city are calculated. In addition, the real operation data of a rooftop solar power station near the Electric Power University and other PV systems in different countries were also collected to compare with simulation results of the rooftop PV system at Electric Power University. Using various meteorological data can influence the performance ratio and economic feasibility of rooftop solar power projects. Thus, the study results will contribute to determining a better meteorological data source for the design process of solar power projects in Vietnam.
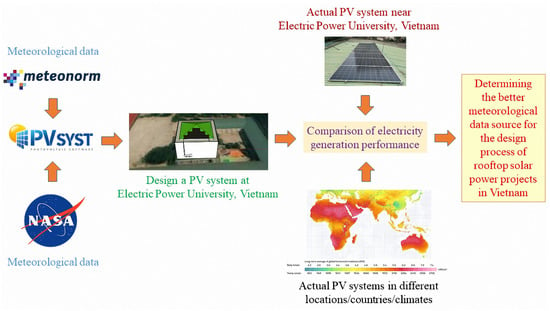
Figure 1.
Graphical abstract of the research.
2. Methodology
Firstly, the power generation and efficiency of the rooftop grid-tied solar power system with different weather data of Meteonorm and NASA were determined by using the PVSYST software.
Secondly, the power generation results corresponding to the different weather data will be compared with the power data of an actual solar power plant near the Electric Power University and other actual PV systems in different locations/countries/climates.
The method of data collection with the PV system project near the Electric Power University is to use actual data online through monitoring measurement equipment installed at the PV power station. On the other hand, this study also selects reputable published scientific works to evaluate the relevance of research results based on data of PV system works in different locations/countries/climates.
Finally, a better weather database will be proposed and recommended for use in design calculations of solar power projects in Vietnam.
The efficiency and loss in PVSYST program [32,33] are determined as below:
System efficiency (EffSyR):
where EOutInv is available energy at the inverter output (kWh).
EffSyR = EOutInv/total rough area of the modules
Array Efficiency (EffArrR):
where EArray is effective energy at the array output (kWh).
EffArrR = EArray/total rough area of Array
Normalized Reference nominal energy at standard test condition STC (Yr):
where EarrRef is array reference energy; PnomArray is Nominal Installed Power.
Yr = EarrRef/PNomArray [kWh/kWp]
Normalized Array Production (Ya):
Ya = Earray/PnomArray [kWh/kWp]
Normalized System Production (Yf):
where Egrid is Energy injected into the Grid, Eavail is Energy available from the Sun.
Yf = EGrid or EAvail/PNomArray [kWh/kWp]
Normalized Array Losses (Lc):
Lc = Yr − Ya
Normalized System Losses (Ls):
Ls = Ya − Yf
3. Case Study
3.1. Research Locations
The installation location of the system is on the roof of the Electronic Library building of the Electric Power University on Hoang Quoc Viet Street, Hanoi city with a longitude of 105°47′ East (E) and a latitude of 21°02′ North (N). The expected location of solar panel installation does not have obstacles in terms of deployment and construction site. Besides, this location is not covered by shade from surrounding buildings and trees as shown in Figure 2.
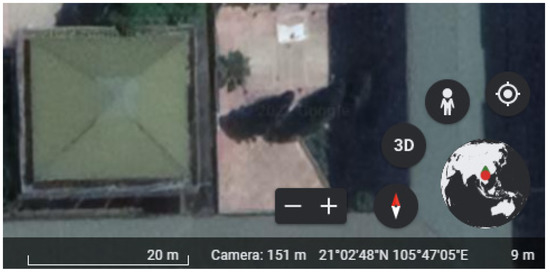
Figure 2.
Installation position of the rooftop solar power system (Google Earth).
3.2. Meteorological Data
Meteorological data for the design of solar power projects in Vietnam is mainly based on Meteonorm data and NASA data. Meteonorm [34] provides global historical hourly values of irradiation, temperature, humidity, wind, and precipitation from 2010 to the present, which is constantly updated. Meteonorm supplies state-of-the-art interpolation models and global weather data with high accuracy based on data from 8325 weather stations, five geostationary satellites, and 30 years of experience.
On the other hand, the NASA Database [35] was developed by the Global Energy Source Prediction of The National Aeronautics and Space Administration. The main purpose of this database is to provide public information regarding solar radiation and global meteorological data. It is particularly useful for locations where data is not available, encouraging the development of renewable energy projects [3]. The data was collected between 1983 and 2005. These values in the area provide monthly average data of global radiation, direct radiation, and radiation.
According to weather data parameters of NASA and Meteonorm, the installation area has the main weather data for solar power design, as can be seen in Table 1. The monthly average global radiation data of NASA is higher than Meteonorm data with the lowest global radiation difference in January (0.34 kWh/m2/day) and with the highest global radiation difference in March (0.87 kWh/m2/day). On the other hand, the monthly average global radiation data of Meteonorm from May to November was from 0.02 kWh/m2/day to 0.57 kWh/m2/day higher than the monthly average global radiation data of NASA. November has the lowest global radiation difference of 0.02 kWh/m2/day while July has the highest global radiation difference of 0.57 kWh/m2/day.

Table 1.
Weather data of NASA and Meteonorm.
Besides, Meteonorm’s temperature data for all months of the year were higher than NASA’s temperature data from 2.5 °C to 3.9 °C.
Both weather data sources are used to determine the different scenarios to compare solar power generation efficiency.
3.3. Rooftop Solar Power Station at Electric Power University
The operation principle of the rooftop solar power system is shown in Figure 3. The amount of direct current (DC) generated from the solar power system passes through the grid-tied inverter to convert to alternating current (AC), then AC electricity is transferred to the place where the equipment consumes, and the remaining part is generated to the utility grid; when the electricity on the solar power system is not enough for the equipment to use, electricity will be taken from the power grid to serve the load demand.
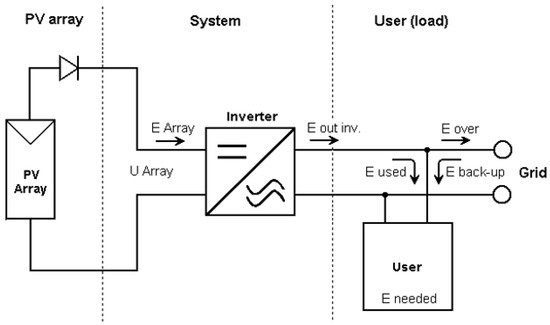
Figure 3.
The operation principle of a grid-connected solar power system.
The solar panels are installed on the iron roof with an inclination angle of 22° in the south direction to obtain the highest power generation efficiency. The total solar capacity is 9.6 kWp with 26 monocrystalline silicon solar panels of 370 Wp, and the project uses a 10 kW inverter. The rooftop solar panel layout of the design project is built on Sketchup 3D and AutoCad software, as shown in Figure 4 and Figure 5.

Figure 4.
Rooftop solar panel layout on Sketchup 3D.
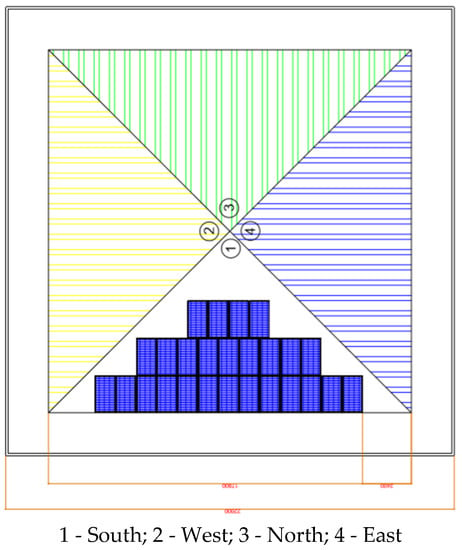
Figure 5.
Rooftop solar panel layout in AutoCAD.
The specifications of the 370 WP solar panel and 10 kW inverter of this rooftop solar power station can be shown in Figure 6 and Figure 7.

Figure 6.
Solar panel specifications.
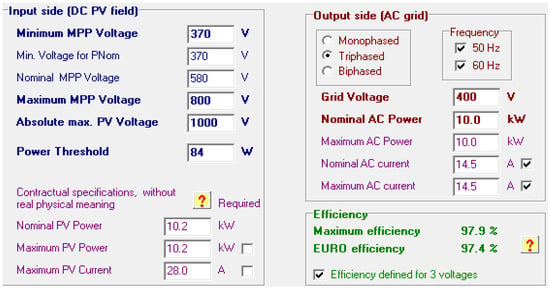
Figure 7.
Grid-connected inverter specifications.
4. Results and Discussion
4.1. Simulation Results
4.1.1. Based on Meteonorm Data
Figure 8 shows the simulation results based on Meteonorm data and analysis of generation electricity in the months of the year. It can be seen that the average amount of electricity emitted in the summer months is more than twice as high as that of the winter months. So, this is a common disadvantage of solar power systems when installed in the northern region of Vietnam due to the difference in solar radiation intensity between seasons. The simulation results showed that the average annual total electricity generation was 11,148 kWh/year. The average amount of electricity emitted in January was the lowest at approximately 616 kWh and August has the highest electricity amount of 1228 kWh. The simulation results presented that some losses reduce power generation efficiency during operation in which the loss related to solar panels is approximately 0.55 kWh/kWp/day, while the system loss is approximately 0.1 kWh/kWp/day. Therefore, the average system efficiency of the rooftop solar power station is 15.83% as can be seen in Table 2.
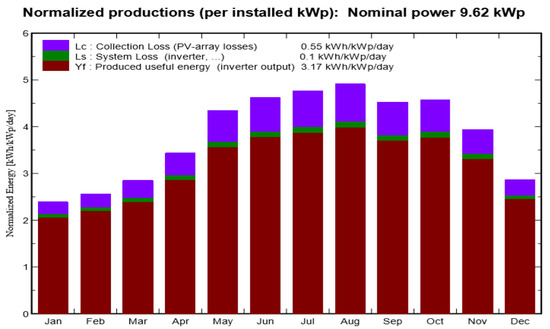
Figure 8.
Monthly electricity of simulation results according to Meteonorm data.

Table 2.
The simulation results according to Meteonorm data.
4.1.2. Based on NASA Data
The solar power generation based on NASA data is shown in Figure 9 and Table 3. The simulation results presented that the annual average total power generation was 11.948 kWh/year. The average electricity amount produced in January was the lowest at approximately 790 kWh, while September had the highest electricity amount of 1087 kWh. The collection loss including PV array losses is 0.51 kWh/kWp/day, but the system loss is only approximately 0.1 kWh/kWp/day. Thus, the average efficiency of the PV system is 16.16%.
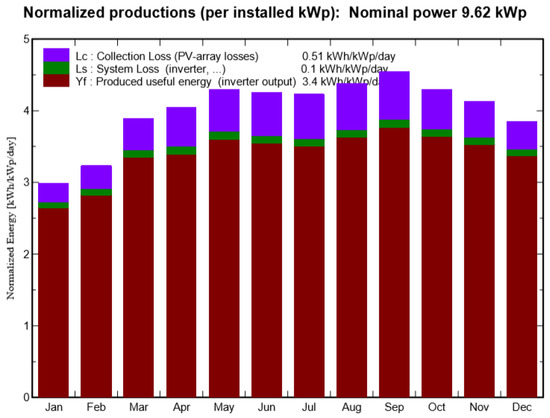
Figure 9.
Monthly electricity of simulation results according to NASA data.

Table 3.
The simulation results according to NASA data.
4.1.3. Discussion of Simulation Results
The power loss diagram based on Meteonorm data and NASA data is presented in Figure 10. It can be seen that there is a difference in the loss parameters related to global radiation and temperature of these two weather data sources. The study results showed that solar array losses due to temperature, global radiation, and inverter operating losses of the Meteonorm data are higher than the NASA data. As a result, the amount of generated electricity using Meteonorm data is 11,148 kWh/year, which is less than 800 kWh/year compared to the amount of generated electricity using NASA data of 11,948 kWh/year. Therefore, the payback period for solar power projects using NASA weather data will be shorter than the payback period for PV projects using Meteonorm weather data. However, actual solar power station operations will be affected by differences in radiation intensity and temperature. Therefore, the generated electricity per year of the PV system will also change when operating in the actual condition.
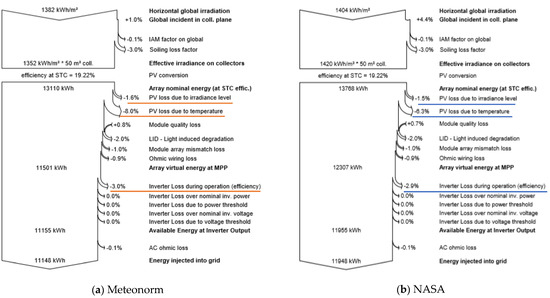
Figure 10.
Power loss diagram according to Meteonorm (a) and NASA (b) data.
4.2. Comparison of Simulation Results with Experimental Results
4.2.1. Actual Solar Power Station in Hanoi City, Vietnam
The results of the simulation of the grid-connected solar power station at the Electric Power University based on Meteonorm data and NASA data will be compared with the actual power generation results of the grid-connected solar power station at the Institute of Energy Science [21] due to its location on Hoang Quoc Viet Street, Hanoi city, as shown in Figure 11.
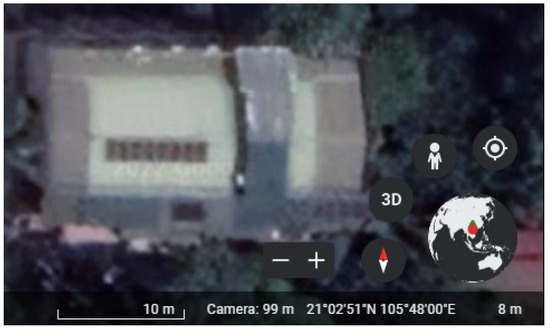
Figure 11.
The actual solar power station at the Institute of Energy Science (Google Earth).
Global solar irradiance data in Hanoi area is obtained from the ground measurement station of the World Bank (WB) [36] to calculate the amount of electricity generated by the rooftop solar power station at the Institute of Energy Science (IES) as can be seen in Table 4 and Figure 12. The annual global solar irradiance value is approximately 1329.8 kWh/m2/year, while the average generated electricity is 3415.3 kWh/year or 2.9 kWh/kWp/day.

Table 4.
The simulation results of the PV system of IES according to weather station data of WB.
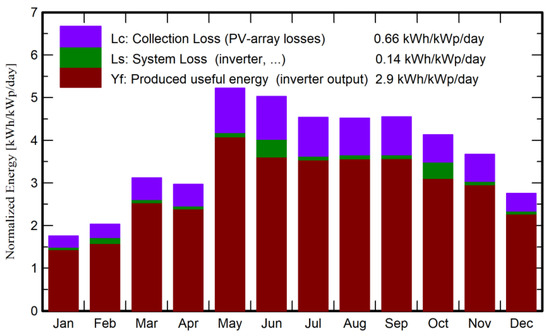
Figure 12.
Monthly electricity of simulation results of IES according to weather station of WB.
On the other hand, NASA data is used as a secondary source of meteorological data to simulate the PV system of IES (Figure 13). By which, the average generated electricity is 3790.1 kWh/year or 3.37 kWh/kWp/day.
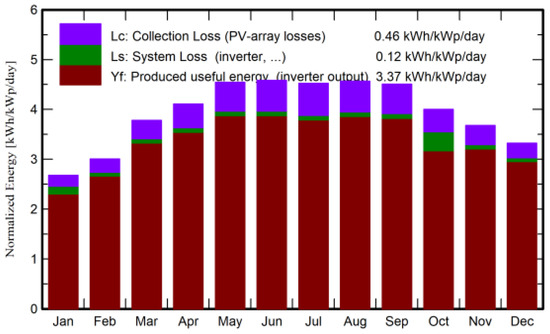
Figure 13.
Monthly electricity of simulation results of IES according to NASA data.
The solar power station using mono silicon solar panels was installed on the roof of the Institute of Energy Sciences at a latitude of 21.02° N and a longitude of 105.48° E. The total capacity of mono-crystalline silicon solar panels in this project is 3.08 kWp, including 8 solar modules of 385 Wp and an inverter of 3 kW. The power generation during the year of the solar power station at the Institute of Energy Science is shown in Figure 14. The months from May to September have more solar power than the rest of the year. The total amount of electricity in the year is approximately 2962 kWh/year and July has the highest amount of electricity of 368 kWh, while January has the lowest amount of electricity of 117 kWh.
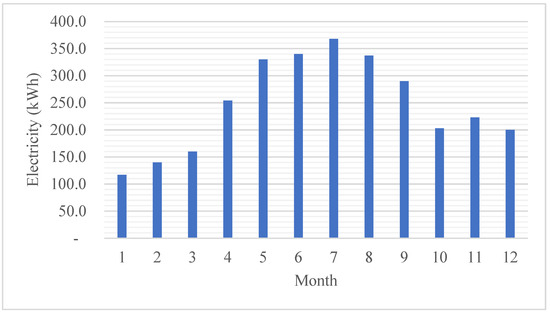
Figure 14.
Power generation during the year of the solar power station at IES.
Temperature data of the meteorological station in Hanoi city [37] were collected to compare with the temperature data of NASA and Meteonorm, as shown in Figure 15. The results showed that the actual average annual temperature data was approximately 5.1 °C higher than NASA’s average annual temperature data, while this data was only approximately 1.8 °C higher than Meteonorm’s average annual temperature data. In general, solar cell performance is influenced by external factors, such as ambient temperature and solar radiation [38]. The power generation of solar cells decreases by approximately 0.33% [39] for every degree Celsius in the environment above the standard temperature of 25 °C. Therefore, the actual power generation efficiency of the solar power station is lower than the simulation results. However, the accuracy of the simulation using Meteonorm’s temperature data is higher than that of NASA’s temperature data because the temperature data of Meteornorm is closer to the actual temperature data.
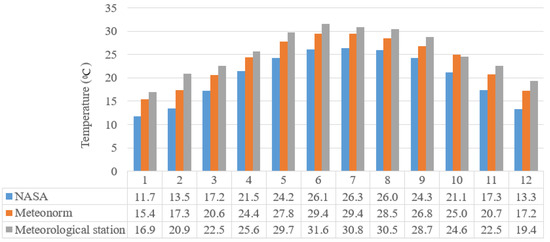
Figure 15.
Actual ambient temperature data versus temperature data of NASA and Meteonorm.
The simulation results of generated electricity from a grid-connected solar power station at the Electric Power University using weather data from Meteonorm and NASA will be compared with the actual power generation results of the grid-connected solar power station at the Institute of Energy Science, as shown in Table 5 and Figure 16.

Table 5.
Comparison parameters of solar power stations in Hanoi city, Vietnam.
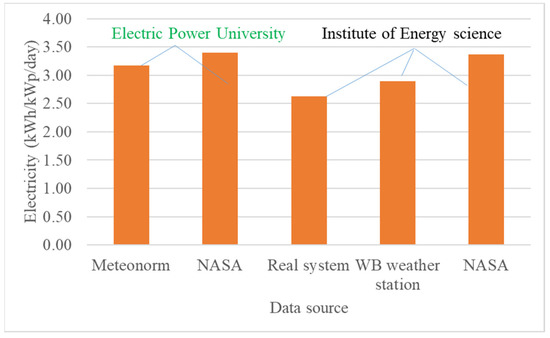
Figure 16.
Comparison parameters of solar power stations at Electric Power University and Institute of Energy Science.
Two solar power stations have the same installation coordinates in Hoang Quoc Viet street, Hanoi city and similar solar radiation conditions. The comparison results showed that the generated electricity of the actual solar power station at the Institute of Energy Science is lower than the simulated generation electricity of the PV system at Electric Power University using Meteonorm data and NASA data with the values of 0.54 kWh/kWp/day and 0.77 kWh/kWp/day, respectively. On the other hand, the comparison results of solar power generation at the Institute of Energy Science show that the simulated electricity generation using WB’s weather station data is 0.27 kWh/kWp/day higher than the actual electricity.
Besides, the solar power station operation may be more affected by the loss coefficients caused in real conditions due to dust, climatic conditions, such as ambient temperature, and solar radiation than calculation in the simulation design. The comparison results showed that the calculation result using Meteonorm weather data was closer to the actual data and weather station data of WB than NASA weather data.
4.2.2. Actual Solar Power Station in Other Locations in the World
The simulation results of generated electricity from the rooftop solar power station at the Electric Power University, Vietnam are also compared with other PV systems in operation in different countries, as can be seen in Table 6. In general, the design result of the solar power project at Electric Power University is quite consistent with the geographical location and solar energy potential compared to the reference works. It can be seen that the simulation result of electricity generated from the solar power station at Electric Power University, Vietnam is lower than those of solar power projects in countries with better solar energy potential, such as Palestine, India, Nepal, and Malawi. In contrast, Vietnam’s solar energy potential is better than Japan’s, so the average solar power output is also higher than the reference work in Tochigi, Japan.

Table 6.
Comparison parameters of PV power stations in the world.
Moreover, the comparison results of simulated and actual measured power data at the reference works show that the actual generated power data is always lower than the simulation result. The difference between simulated and actual power output data at Tochigi, Japan (simulation using Meteonorm data) is the lowest value of 0.41 kWh/kWp/day while the difference between simulation results and actual project at Nepal Telecom, Sundhara, Kathmandu, Nepal (simulation using NASA data) is the highest value of 1.18 kWh/kWp/day. The study results of the difference between simulated and actual data of the solar power projects at Electric Power University and Institute of Energy Science in Vietnam are similar to other real rooftop PV projects in the world.
Therefore, Meteonorm data usage in the design of rooftop solar power projects in Vietnam will ensure more reliable than NASA data, and it can determine better economic and technical efficiency for investors.
In addition, some studies on PV systems [45,46,47] close to Vietnam’s climatic conditions also show that the power degradation and performance ratio of the PV system depend on the location of project, material technologies of solar cells, optimal angle, and direction.
5. Conclusions
Rooftop solar power stations have been increasingly developed in Vietnam in recent years. The design of solar power projects in Vietnam is mainly based on meteorological data sources from Meteonorm and NASA. However, the accuracy assessment of two data sources compared to the actual solar power data in Vietnam is not available, so there is no basis to determine better weather data source quality.
In this study, simulations of typical rooftop power station operation at the Electric Power University based on Meteonorm data and NASA data sources were performed. In addition, the actual temperature data of the meteorological station in Hanoi city was also collected to compare with the temperature data of NASA and Meteonorm. The simulated generation electricity value based on NASA data is higher than the simulation result using Meteonorm data. However, the comparison results showed that the generated electricity of the actual PV system at the Institute of Energy Science is lower than the simulated generation electricity of the solar power station at Electric Power University using Meteonorm data and NASA data with the values of 0.54 kWh/kWp/day and 0.77 kWh/kWp/day, respectively. The simulation result using Meteonorm weather data was closer to the actual data than NASA weather data.
The study results of the difference between simulated and actual data of the solar power projects at Electric Power University and Institute of Energy Science in Vietnam are similar to other real PV projects in the world. Therefore, solar power projects in Vietnam should use Meteonorm data source for the design process to determine better economic and technical efficiency for investors.
Author Contributions
Conceptualization, M.-H.P., V.M.P.; methodology, V.M.P., N.N.T.; software, M.-H.P. and T.T.S.; data curation, V.M.P. and D.T.K.; writing—original draft preparation, V.M.P., M.-H.P., V.T.A.T. and N.N.T.; writing—review and editing, V.M.P., M.-H.P., V.T.A.T., T.T.S. and D.T.K.; supervision, M.-H.P. All authors have read and agreed to the published version of the manuscript.
Funding
Not applicable.
Data Availability Statement
Not applicable.
Acknowledgments
The authors specially thank the Electric Power University and Institute of Energy Science, Vietnam Academy of Science and Technology for creating favors in stakeholder communication, information collection, and funding provision during the implementation of the study.
Conflicts of Interest
The authors declare no conflict of interest.
References
- Adhikari, J.; Prasanna, I.; Panda, S. Voltage oriented control of the three-level VIENNA rectifier using vector control method. In Proceedings of the 2016 IEEE Applied Power Electronics Conference and Exposition (APEC), Long Beach, CA, USA, 20–24 March 2016; pp. 9–16. [Google Scholar]
- Li, Z.; Zhang, W.; Zhang, R.; Sun, H. Development of renewable energy multi-energy complementary hydrogen energy system (A Case Study in China): A review. Energy Explor. Exploit. 2020, 38, 2099–2127. [Google Scholar] [CrossRef]
- Li, L.; Lin, J.; Wu, N.; Xie, S.; Meng, C.; Zheng, Y.; Wang, X.; Zhao, Y. Review and outlook on the international renewable energy development. Energy Built Environ. 2022, 3, 139–157. [Google Scholar] [CrossRef]
- Abdul Latif, S.N.; Chiong, M.S.; Rajoo, S.; Takada, A.; Chun, Y.-Y.; Tahara, K.; Ikegami, Y. The Trend and Status of Energy Resources and Greenhouse Gas Emissions in the Malaysia Power Generation Mix. Energies 2021, 14, 2200. [Google Scholar] [CrossRef]
- The International Renewable Energy Agency (IRENA). Renewable Energy and Jobs—Annual Review 2021; The International Renewable Energy Agency (IRENA): Abu Dhabi, United Arab Emirates, 2021. [Google Scholar]
- Deshmukh, M.K.G.; Sameeroddin, M.; Abdul, D.; Sattar, M.A. Renewable energy in the 21st century: A review. Mater. Today Proc. 2021, 1–4. [Google Scholar] [CrossRef]
- International Energy Agency (IEA). Snapshot of Global PV Markets 2022; International Energy Agency (IEA): Paris, France, 2022. [Google Scholar]
- Xiao, M.; Junne, T.; Haas, J.; Klein, M. Plummeting costs of renewables—Are energy scenarios lagging? Energy Strat. Rev. 2021, 35, 100636. [Google Scholar] [CrossRef]
- Saglam, S. Meteorological Parameters Effects on Solar Energy Power Generation. WSEAS Trans. Circuits Syst. 2010, 9, 637–649. [Google Scholar]
- Gopi, A.; Sudhakar, K.; Keng, N.W.; Krishnan, A.R.; Priya, S.S. Performance Modeling of the Weather Impact on a Utility-Scale PV Power Plant in a Tropical Region. Int. J. Photoenergy 2021, 2021, 1–10. [Google Scholar] [CrossRef]
- Sadio, A.; Fall, I.; Mbodji, S.; Sissoko, G.G. Analysis of Meteorological Data for applications in Ngoundiane’s Site. EAI Endorsed Trans. Collab. Comput. 2017, 3, 153168. [Google Scholar] [CrossRef][Green Version]
- AlSkaif, T.; Dev, S.; Visser, L.; Hossari, M.; van Sark, W. A systematic analysis of meteorological variables for PV output power estimation. Renew. Energy 2020, 153, 12–22. [Google Scholar] [CrossRef]
- Kuchler, S. Solar Energy Assessment Based on Weather Station Data for Direct Site Monitoring in Indonesia. Master’s Thesis, Dalarna University, Dalarna County, Sweden, 2013. [Google Scholar]
- National Renewable Energy Laboratory (NREL). Analysis of Photovoltaic System Energy Performance Evaluation Method; Technical Report; National Renewable Energy Laboratory (NREL): Golden, CO, USA, 2013. [Google Scholar]
- McIntyre, J.H. Community-scale assessment of rooftop-mounted solar energy potential with meteorological, atlas, and GIS data: A case study of Guelph, Ontario (Canada). Energy Sustain. Soc. 2012, 2, 23. [Google Scholar] [CrossRef]
- Amarasinghe, P.A.G.M.; Abeygunawardana, N.S.; Jayasekara, T.N.; Edirisinghe, E.A.J.P.; Abeygunawardane, S.K. Ensemble models for solar power forecasting—A weather classification approach. AIMS Energy 2020, 8, 252–271. [Google Scholar] [CrossRef]
- Poudyal, R.; Loskot, P.; Parajuli, R. Techno-economic feasibility analysis of a 3-kW PV system installation in Nepal. Renew. Wind Water Sol. 2021, 8, 5. [Google Scholar] [CrossRef]
- Chen, C.; Duan, S.; Cai, T.; Liu, B. Online 24-h solar power forecasting based on weather type classification using artificial neural network. Sol. Energy 2011, 85, 2856–2870. [Google Scholar] [CrossRef]
- Zhong, Y.-J.; Wu, Y.-K. Short-Term Solar Power Forecasts Considering Various Weather Variables. In Proceedings of the 2020 International Symposium on Computer, Consumer and Control (IS3C), Taichung City, Taiwan, 13–16 November 2020; pp. 432–435. [Google Scholar]
- Derouich, W.; Besbes, M.; Olivencia, J.D. Prefeasibility Study of a Solar Power Plant Project and Optimization of a Meteorological Station Performance. J. Appl. Res. Technol. 2014, 12, 72–79. [Google Scholar] [CrossRef]
- Thanh, T.N.; Minh, P.V.; Trung, K.D.; Anh, T.D. Study on Performance of Rooftop Solar Power Generation Combined with Battery Storage at Office Building in Northeast Region, Vietnam. Sustainability 2021, 13, 11093. [Google Scholar] [CrossRef]
- Le, H.T.-T.; Sanseverino, E.R.; Nguyen, D.-Q.; Di Silvestre, M.L.; Favuzza, S.; Pham, M.-H. Critical Assessment of Feed-In Tariffs and Solar Photovoltaic Development in Vietnam. Energies 2022, 15, 556. [Google Scholar] [CrossRef]
- Phap, V.M.; Huong, N.T.T.; Hanh, P.H.; Duy, P.V.; Binh, D.V. Assessment of rooftop solar power technical potential in Hanoi city, Vietnam. J. Build. Eng. 2020, 32, 101528. [Google Scholar] [CrossRef]
- Prime Minister of Vietnam. Decision No. 428/QD-TTg on the Approval of the Revised National Power Development Master Plan for the 2011–2020 Period with the Vision to 2030; Prime Minister of Vietnam, 2016. [Google Scholar]
- Prime Minister of Vietnam. Decision No: 11/2017/QD-TTg On the Support mechanisms for the Development of Solar Power Projects in Vietnam; Prime Minister of Vietnam, 2017. [Google Scholar]
- Prime Minister of Vietnam. Decision 13/2020/QD-TTg on Mechanisms to Promote the Development of Solar Power Projects in Viet Nam; 2020. [Google Scholar]
- Stopping to Consider SPPs under FIT Mechanism. Available online: https://vietnamenergy.vn/stopping-to-consider-spps-under-fit-mechanism-23698.html (accessed on 4 August 2022).
- Nguyen, N.Q.; Bui, L.D.; Van Doan, B.; Sanseverino, E.R.; Di Cara, D.; Nguyen, Q.D. A new method for forecasting energy output of a large-scale solar power plant based on long short-term memory networks a case study in Vietnam. Electr. Power Syst. Res. 2021, 199, 107427. [Google Scholar] [CrossRef]
- Truong, N.X.; Tung, N.L.; Hung, N.Q.; Delinchant, B. Grid-connected PV system design option for nearly zero energy building in reference building in Hanoi. In Proceedings of the 2016 IEEE International Conference on Sustainable Energy Technologies (ICSET), Hanoi, Vietnam, 14–16 November 2016; pp. 326–331. [Google Scholar]
- Le, P.T.; Nguyen, V.D.; Le, P.L. Techno-Economic Analysis of Solar Power Plant Project in Binh Thuan, Vietnam. In Proceedings of the 2018 4th International Conference on Green Technology and Sustainable Development (GTSD), Ho Chi Minh City, Vietnam, 23–24 November 2018; pp. 82–85. [Google Scholar]
- Nguyen, T.B.; Van, P.H. Design, Simulation and Economic Analysis of A Rooftop Solar PV System in Vietnam. EAI Endorsed Trans. Energy Web 2021, 8, e11. [Google Scholar] [CrossRef]
- Phap, V.M.; Nga, N.T. Feasibility Study of Rooftop Photovoltaic Power System for A Research Institute towards Green Building in Vietnam. EAI Endorsed Trans. Energy Web 2020, 7, e9. [Google Scholar] [CrossRef][Green Version]
- PVsyst Tutorials. Available online: https://www.pvsyst.com/ (accessed on 14 August 2022).
- Meteonorm 8 Global Weather Data. Available online: https://aiguasol.coop/energy-software/meteonorm-8-global-weather-data/ (accessed on 15 August 2022).
- da Silva, M.K.; Narvaez, D.I.; de Melo, K.B.; Villalva, M.G. Comparative Analysis of Transposition Models Applied to Photovoltaic Systems Using Meteonorm and NASA SSE Databases. In Proceedings of the 2018 13th IEEE International Conference on Industry Applications (INDUSCON), Sao Paulo, Brazil, 12–14 November 2018; pp. 237–241. [Google Scholar]
- World Bank. 24-Month Report—Solar Measurement Campaign in Vietnam; World Bank: Washington, DC, USA, 2019. [Google Scholar]
- Statistical Yearbook of Vietnam in 2021. Available online: https://www.gso.gov.vn/wp-content/uploads/2022/08/Sach-Nien-giam-TK-2021.pdf (accessed on 22 August 2022).
- Hasan, K.; Yousuf, S.B.; Tushar, M.S.H.K.; Das, B.K.; Das, P.; Islam, S. Effects of different environmental and operational factors on the PV performance: A comprehensive review. Energy Sci. Eng. 2021, 10, 656–675. [Google Scholar] [CrossRef]
- Parthiban, R.; Ponnambalam, P. An Enhancement of the Solar Panel Efficiency: A Comprehensive Review. Front. Energy Res. 2022, 10, 937155. [Google Scholar] [CrossRef]
- Ibrik, I.; Hashaika, F. Techno-Economic Impact of Grid-Connected Rooftop Solar PV System for Schools in Palestine: A Case Study of Three Schools. Int. J. Energy Econ. Policy. 2019, 9, 291–300. [Google Scholar] [CrossRef]
- Bajracharya, S.M.; Maharjan, S. Techno economic analysis of grid tied solar system: A case study of Nepal Telecom, Sundhara, Kathmandu. Proc. IOE Grad. Conf. 2019, 7, 211–218. [Google Scholar]
- Abdullah, G.; Nishimura, H. Techno-Economic Performance Analysis of a 40.1 kWp Grid-Connected Photovoltaic (GCPV) System after Eight Years of Energy Generation: A Case Study for Tochigi, Japan. Sustainability 2021, 13, 7680. [Google Scholar] [CrossRef]
- Kanchikere, J. Online Monitoring and Simulation of 30KW Grid Connected Rooftop Solar Power Plant at St. Peter’s International School, Hyderabad using PV Syst. Int. J. Adv. Res. Innov. Ideas Educ. 2018, 4, 1890–1906. [Google Scholar]
- Banda, M.H.; Nyeinga, K.; Okello, D. Performance evaluation of 830 kWp grid-connected photovoltaic power plant at Kamuzu International Airport-Malawi. Energy Sustain. Dev. 2019, 51, 50–55. [Google Scholar] [CrossRef]
- Ye, J.Y.; Reindl, T.; Aberle, A.G.; Walsh, T.M. Performance Degradation of Various PV Module Technologies in Tropical Singapore. IEEE J. Photovoltaics 2014, 4, 1288–1294. [Google Scholar] [CrossRef]
- Kunaifi, K.; Reinders, A.; Lindig, S.; Jaeger, M.; Moser, D. Operational Performance and Degradation of PV Systems Consisting of Six Technologies in Three Climates. Appl. Sci. 2020, 10, 5412. [Google Scholar] [CrossRef]
- Anang, N.; Azman, S.S.N.; Muda, W.; Dagang, A.; Daud, M.Z. Performance analysis of a grid-connected rooftop solar PV system in Kuala Terengganu, Malaysia. Energy Build. 2021, 248, 111182. [Google Scholar] [CrossRef]
Publisher’s Note: MDPI stays neutral with regard to jurisdictional claims in published maps and institutional affiliations. |
© 2022 by the authors. Licensee MDPI, Basel, Switzerland. This article is an open access article distributed under the terms and conditions of the Creative Commons Attribution (CC BY) license (https://creativecommons.org/licenses/by/4.0/).