1. Introduction
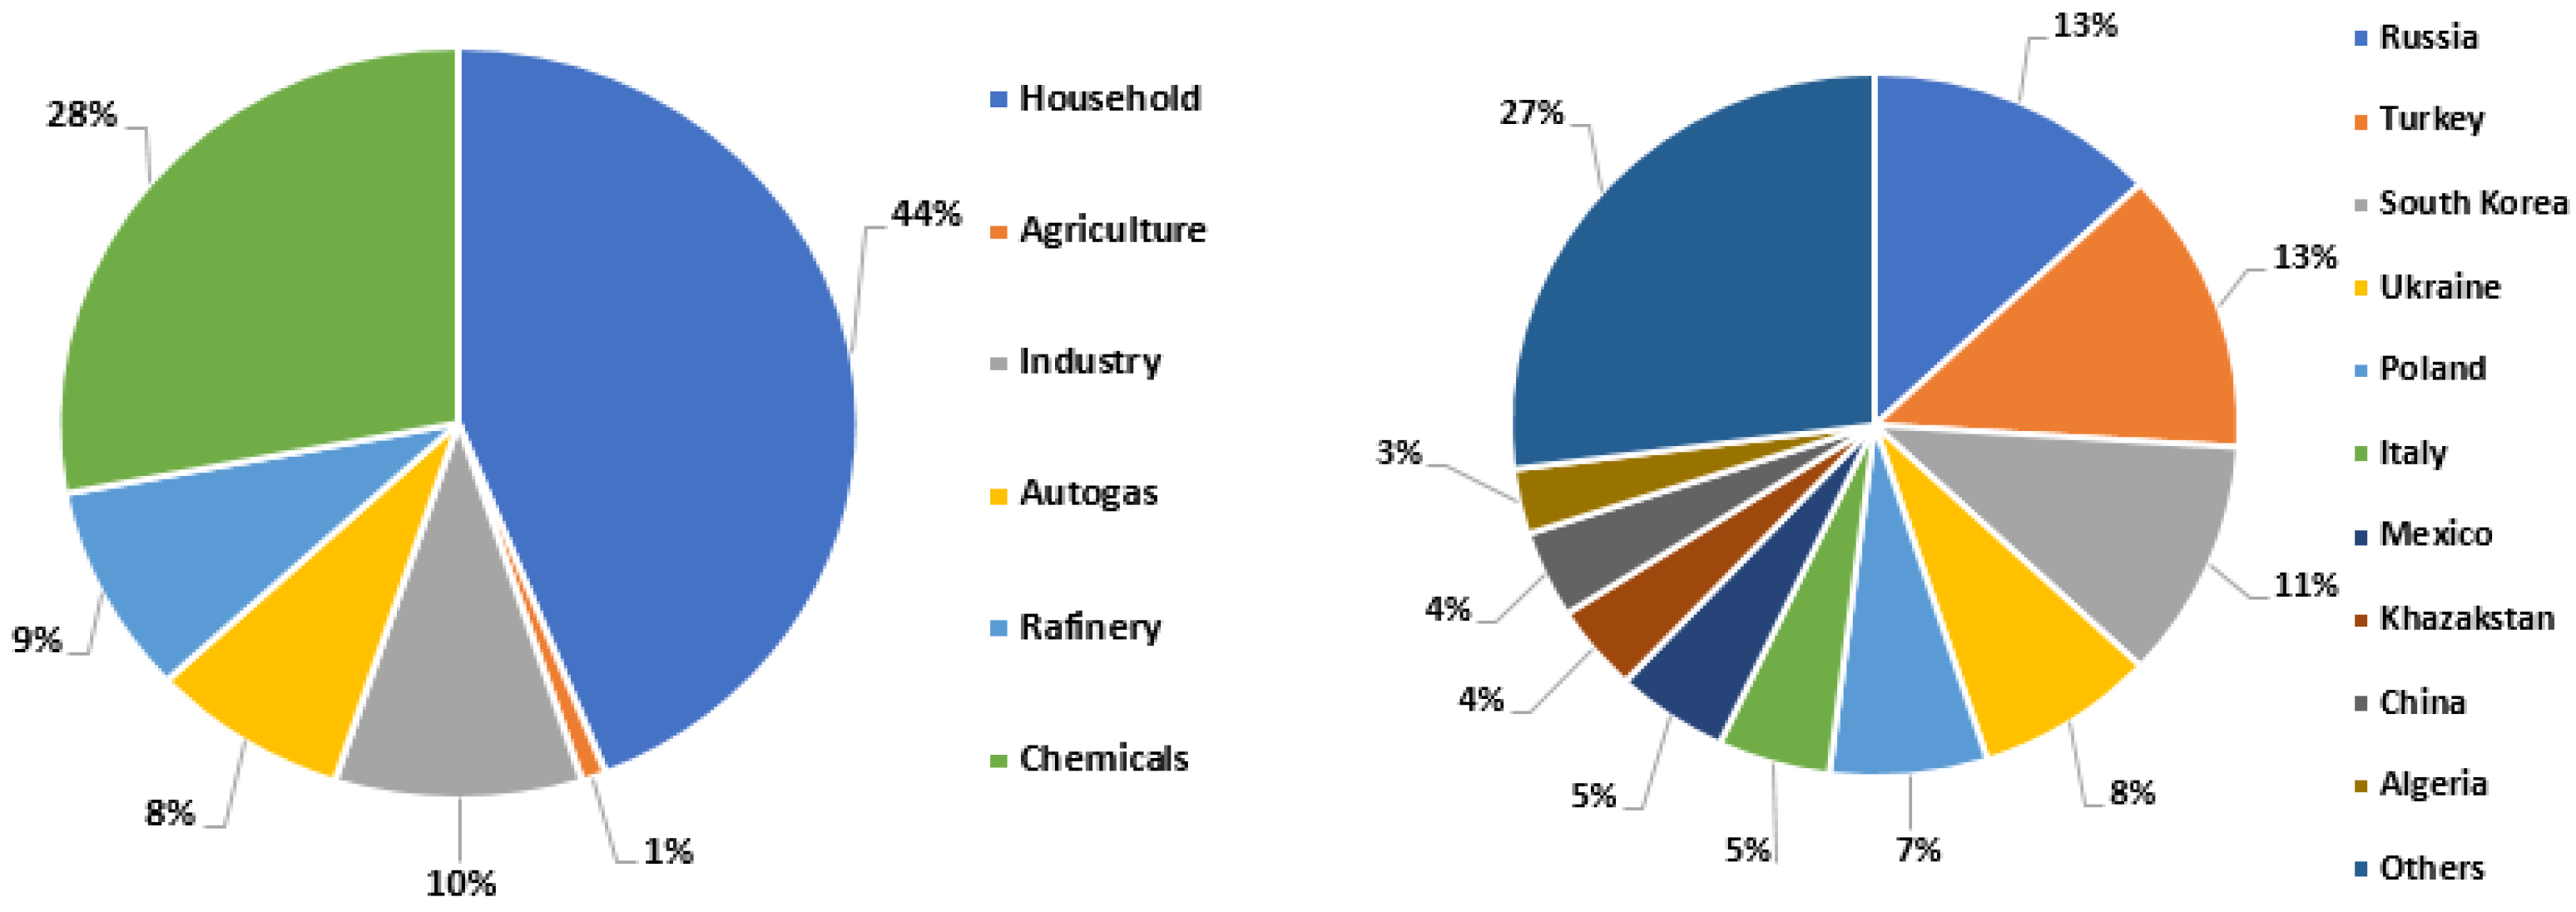
LPG, popularly known as Autogas, is currently the most widely used alternative fuel in the automotive sector, making clean mobility accessible and affordable to many vehicle users around the world (
Figure 1) [
1]. In addition, the growing production of BioLPG in the world should further reduce the environmental impact of this fuel. The technologies for producing this fuel are today being developed as part of the global drive to develop biofuels, and BioLPG is distributed through the existing supply chain, paving the way to a zero-emission economy. BioLPG is chemically identical to conventional LPG. Therefore, it can replace conventional LPG and be blended and used by vehicles powered by LPG without changing or upgrading equipment or appliances. The mission behind the development of BioLPG is to further reduce carbon emissions and the environmental impact of LPG, which already emits 35% less CO
2 than coal and 12% less than oil. BioLPG fulfills that mission—it emits 73% less CO
2 than conventional LPG [
2]. Moreover, LPG producers and distributors are seeing a new fuel, Renewable and Bio Dimethyl Ether (rDME or BioDME), a synthetic LPG obtained from the thermal conversion of waste, which may be an option for the LPG industry [
2].
Ensuring a sustainable future for vehicle fuels has also led to the consideration of advanced blending methods for fossil fuels without compromising their quality, improving the properties of these fuels for high-engine performance. The synergy effects offered by these fuels improve the properties of the fuels better than the individual components of the fuel mixture.
Pure DME is not compatible with gasoline engines; however, it can be used in a mixture with liquefied petroleum gas (LPG), reducing CO
2 emissions by up to 30% [
3,
4,
5]. Hence, mixing DME and LPG is the most common use of DME today. Its 15 to 30% share improves combustion, reducing harmful emissions while also reducing dependence on LPG. However, there are known disadvantages of DME as an alternative fuel used to power internal combustion engines. The main disadvantage is the lower calorific value (LHV), which is at the level of 63% of the value characteristic for LPG, consequently increasing the amount of fuel necessary to obtain the expected engine power. However, the impact of this disadvantage can be limited or eliminated by introducing changes in the engine’s design or the use of appropriate strategies for engine combustion management. These possibilities are confirmed by the results of studies presented in several publications. Changwei et al. [
6] tested the SI engine with a capacity of 1.6 L, fueled by gasoline and DME, and showed that the addition of DME is an effective way to improve the efficiency of energy conversion and reduce the emission of controlled exhaust components, especially when the share of DME energy in the mixture is lower than 10%. In addition, they found that the engine torque decreased with increasing the DME share. However, a DME share of less than 15% increases the thermal efficiency of the engine. In addition, the addition of DME lowered the maximum temperature in the cylinder and shortened the flame development time. HC and NO
x emissions decreased with an increase in the share of DME, and CO emissions decreased by 10%, when the share of energy contained in DME was 12.4% [
6].
Pathak et al. investigated the performance and emissions of three different fuels, i.e., Gasoline, LPG (Liquefied Petroleum Gas), and DME (Dimethyl ether) blend with a concentration of 20% by mass in LPG [
7]. They conclude that the drivability of suitably configured vehicles for DME 20 was like LPG and gasoline fuel. Similar work was presented at publication [
8,
9,
10]. Articles presented the possibility of using DME as a fuel for transport, especially for internal combustion engines.
Riesta et al., tested the four-cylinder 2.0 L SI engine fueled by the DME and LPG mixture, and they showed that the power produced by this engine is lower than that produced by fueling gasoline [
11]. Moreover, the mixture of LPG and DME decreased the fuel consumption and emission level of CO and HC compared to gasoline. Himabindu and Ravikrishna, while testing a spark-ignition engine, showed that the engine’s power fueled by LPG and a mixture of LPG and DME is lower than that produced by gasoline. They also showed that a higher DME ratio in the mixture reduces engine power. However, the addition of DME to LPG reduces fuel consumption and the level of CO and HC emissions compared to gasoline [
12].
DME is not the only fuel currently being considered to power IC engines. Some studies [
13,
14,
15,
16] have discussed the possibilities of using renewable plant-derived fuels. These fuels were fed into diesel engines, where the combustion process and the potential for changing the EGR valve settings were examined. Other studies have discussed the possibility of using ethanol to power IC engines. Manufacturers offering vehicles with engines adapted for ethanol fuel are featured in another study, which also analyses options for running on CNG, biodiesel, and electricity.
Studies on the use of DME as an engine fuel have shown that using DME is an effective way to improve the efficiency of chemical energy conversion and decrease exhaust gas components. Research on the use of DME as an engine fuel has shown that the use of DME is an effective way to improve the efficiency of chemical energy conversion and reduce the content of exhaust components. These currently significant advantages have become the basis for assessing the impact of using a DME-LPG mixture as fuel for SI engines from the point of view of vehicle performance.
2. Research Object and Fuel Properties
The torque and power characteristics, which were the basis for the calculation of the dynamic factor, were determined for a four-cylinder spark-ignition engine with a cylinder capacity of 1.6 dm
3. This engine is the main source of power in the OPEL Astra, the popular passenger car, whose characteristics are presented in
Table 1.
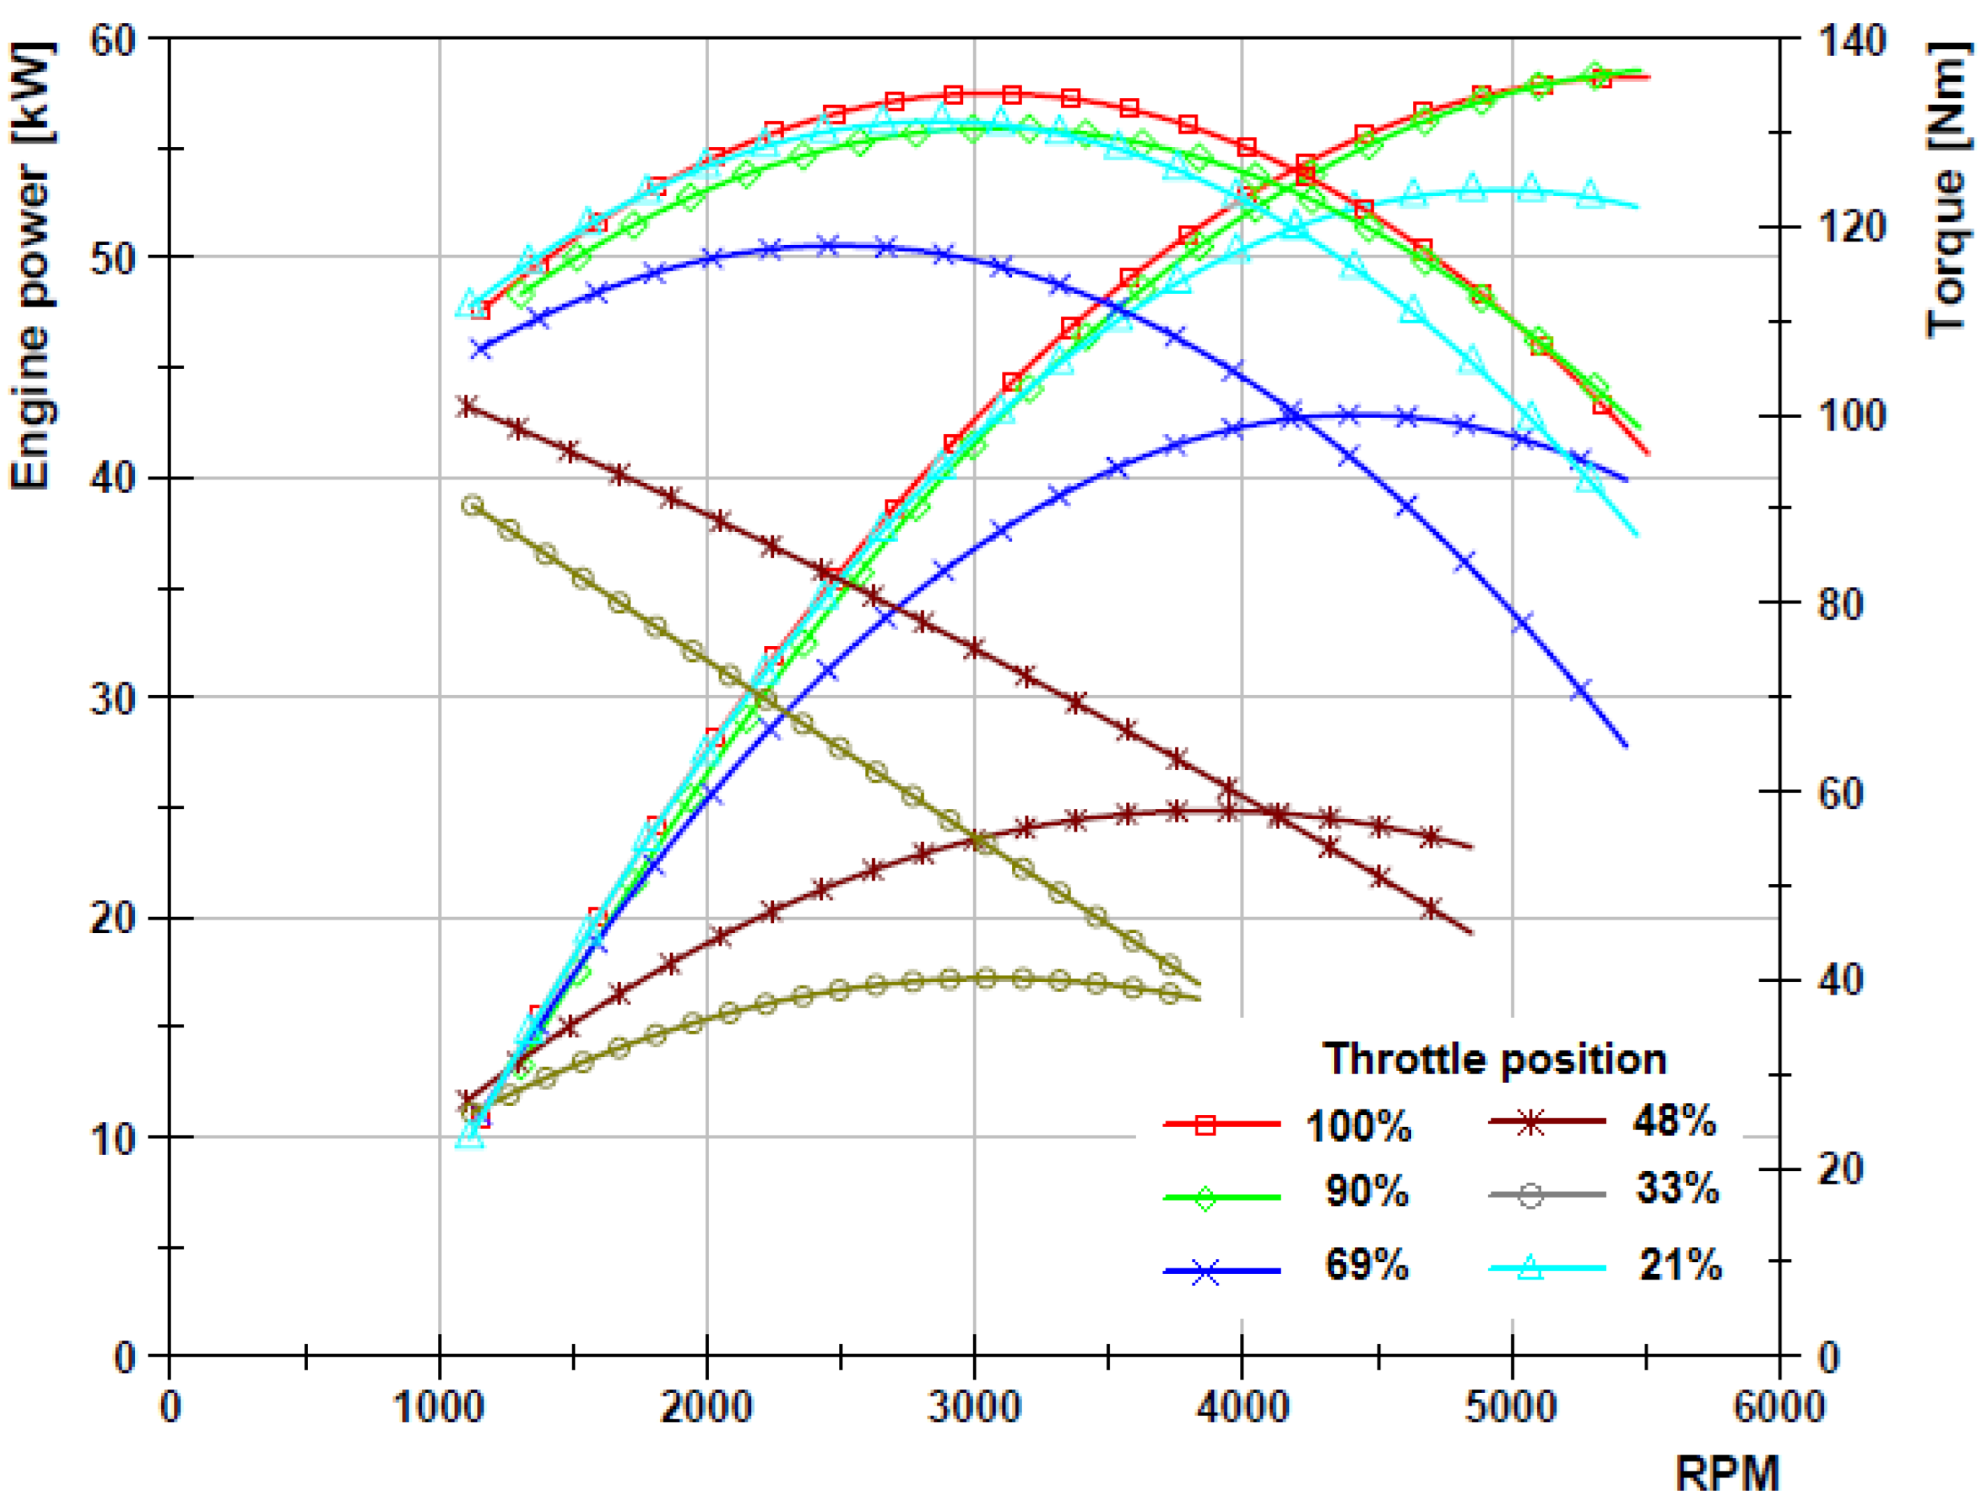
The T-ω and P-ω characteristics were determined for the engine powered by the LPG and DME mixtures with a different DME mass fraction from 7% to 30% and selected engine loads. The tests were carried out using the HSP-100 engine brake type HSP-100. Pre-prepared mixtures with a defined mass fraction of DME were injected into the engine inlet channels ensuring their stoichiometric composition. The amount of the injected mixture was determined by the engine management system [
18]. Exemplary characteristics are presented in
Figure 2 and
Figure 3, while
Figure 2 shows the courses of engine torque and power for various mass fractions of DME at full throttle. On the other hand,
Figure 3 shows the changes in these parameters for a mixture with a 7% mass fraction of DME at different engine loads. Finally, the maximum values of power and torque depending on the mass fraction of DME and the engine load are presented in
Figure 3. Adding DME to the fuel that powered the engine changes its physicochemical properties. The low heating value of DME reduces the energy contained in the injected fuel, but oxygen content contributes to reducing the demand for air. Consequently, the combustion process of the LPG and DME mixtures is different from the case of gasoline and LPG only [
19].
DME, as an alternative fuel, has properties that fulfill the requirement of automotive fuel. It has a cetane number of 55–60, which is higher than diesel fuel, but its heating value is the lowest compared to other fuels [
12]. As its physical and chemical properties are similar to LPG, it is possible to prepare mixtures of these fuels with different DME mass fractions.
The physical and chemical properties of DME compared with other alternative fuels are shown in
Table 2.
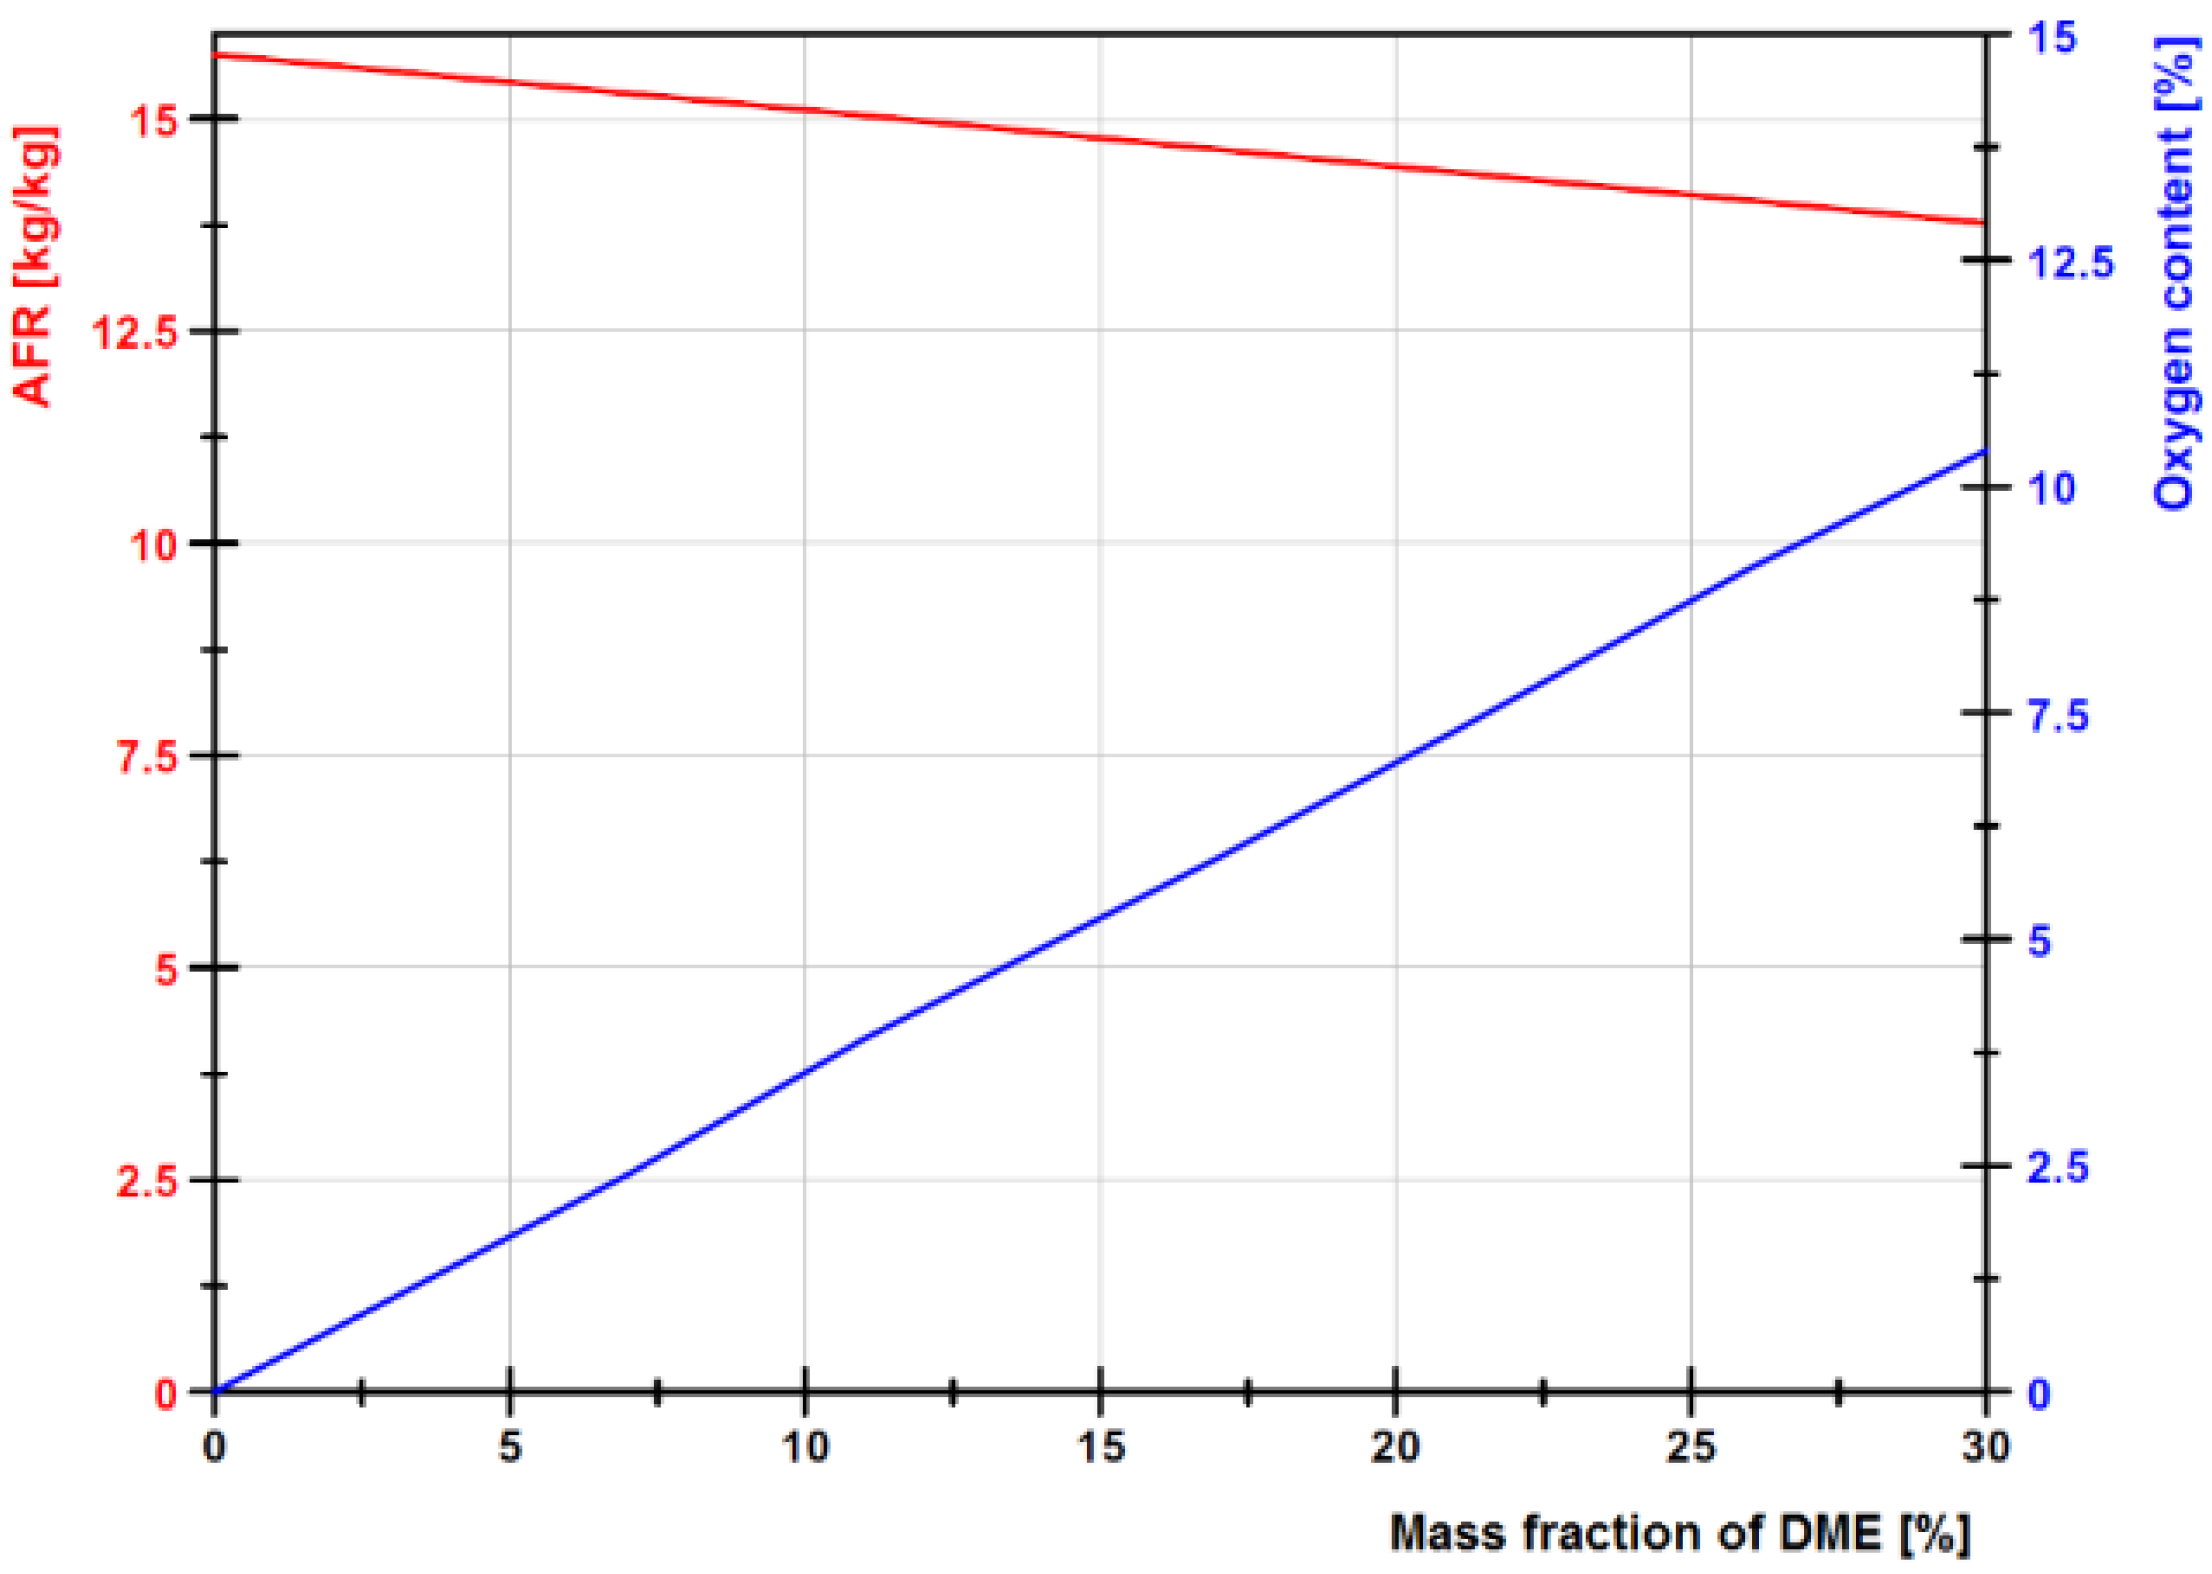
The DME and LPG mixture properties are presented in
Figure 4, while
Figure 5 shows the stoichiometric AFR, oxygen content, and heating value of the mixtures with different DME content.
The parameters shown in
Figure 4 and
Figure 5 were determined from the molar mass of each component, considering stoichiometric combustion.
3. Methodology
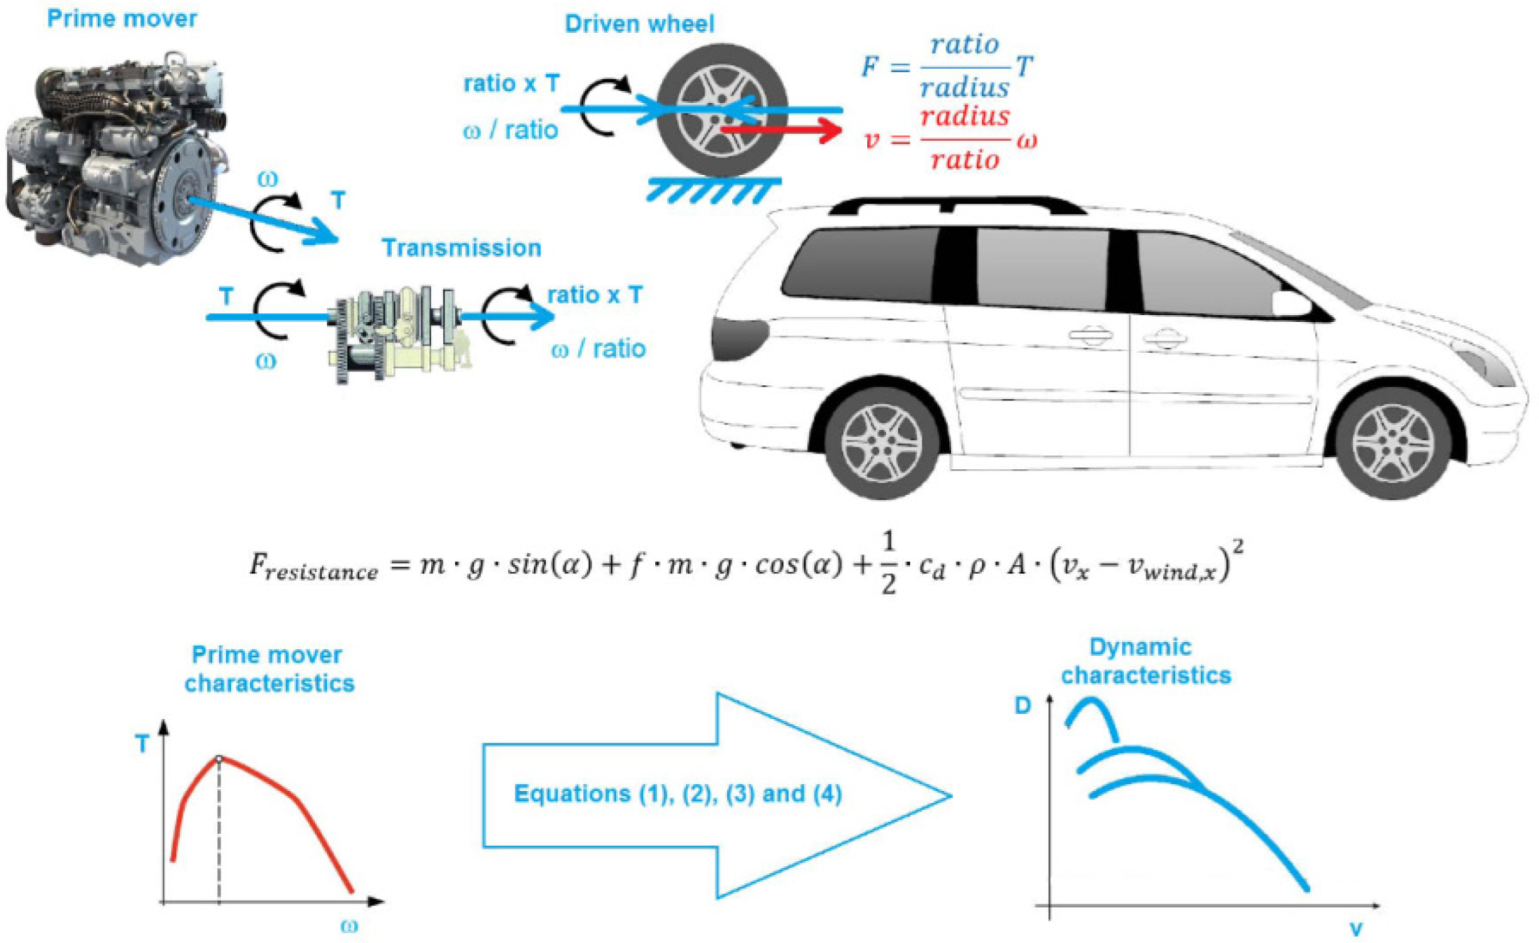
The traction and dynamic properties of motor vehicles are compared by employing indices expressing unit values of power, force, or mass related to other related parameters of the motor vehicle (
Figure 6). Among these indicators, the universal one is the dynamic factor of the car, which denotes driving force reserve per mass unit.
This indicator determines the car’s motion characteristics, e.g., the ability to climb hills and accelerate and overcome resistance to motion. Usually, this factor is calculated for the first and the highest gear and defined by the following equations:
For the first gear [
22]:
and for highest gear [
22]:
where:
F—driving force, N,
Gc = mg—total vehicle weight, N,
Temax—engine torque, Nm,
ig—final gear ratio,
iI—the ratio of the lowest gear,
iV—the ratio of highest gear,
rd—dynamic radius of the wheel,
ηm—mechanical efficiency.
For analyzing and comparing the dynamic properties of the car, the dynamic factor was used, which was calculated using Equations (1) and (2). The values of this index were determined for the highest gear for various driving speeds and various loads.
The most important result of the vehicle dynamics calculation is the acceleration of the vehicle, which we usually want to be as large as possible. The acceleration is calculated by Equation (3) from the calculated values of the dynamic factor [
22]:
where:
ai(v) [m/s2]—vehicle acceleration on chosen gear,
g [m/s2]—gravity acceleration,
δ [/]—coefficient of rotational masses.
Newton’s equation of motion was used to calculate the car acceleration time on each gear. The calculated time to reach maximum speed for each gear was summarized and compared with the manufacturer’s data:
where:
F—[N] traction force,
Fr—[N] total resistance,
ti—[s] acceleration time from v1 to v2,
vi1—[m/s] initial speed in a given gear,
vi2—[m/s] end speed in a given gear.
4. Results
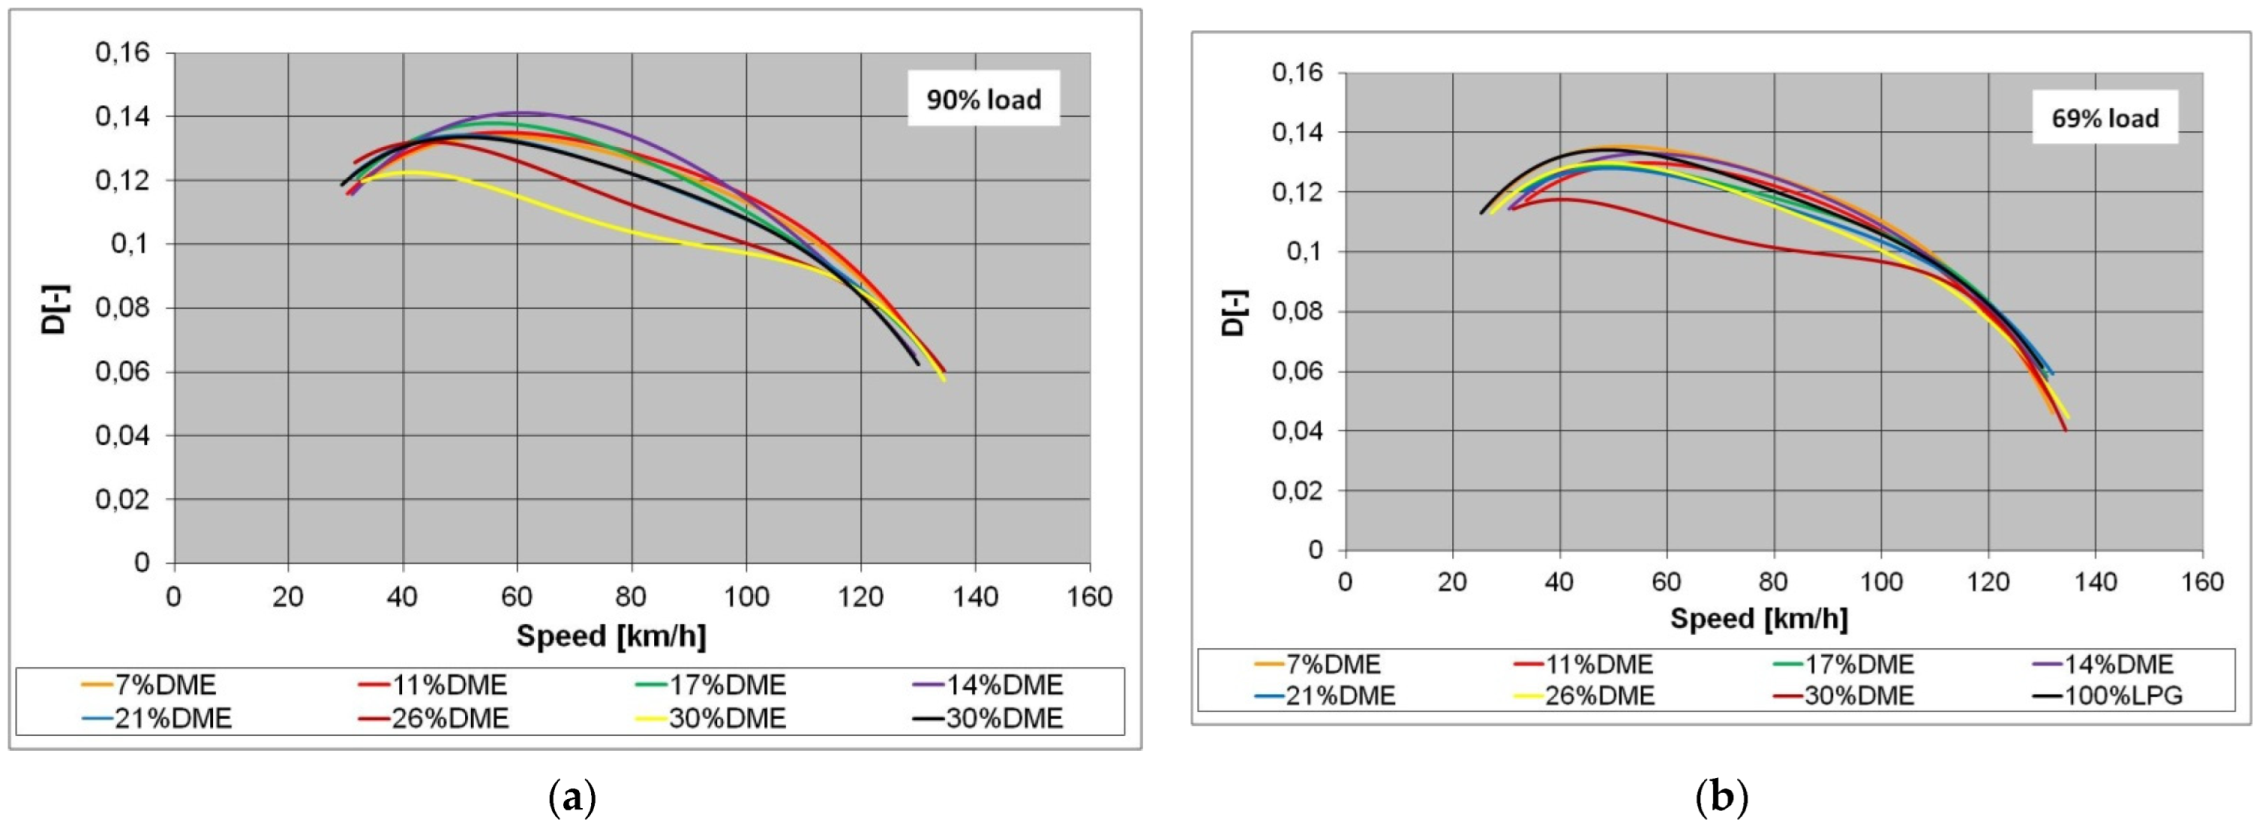
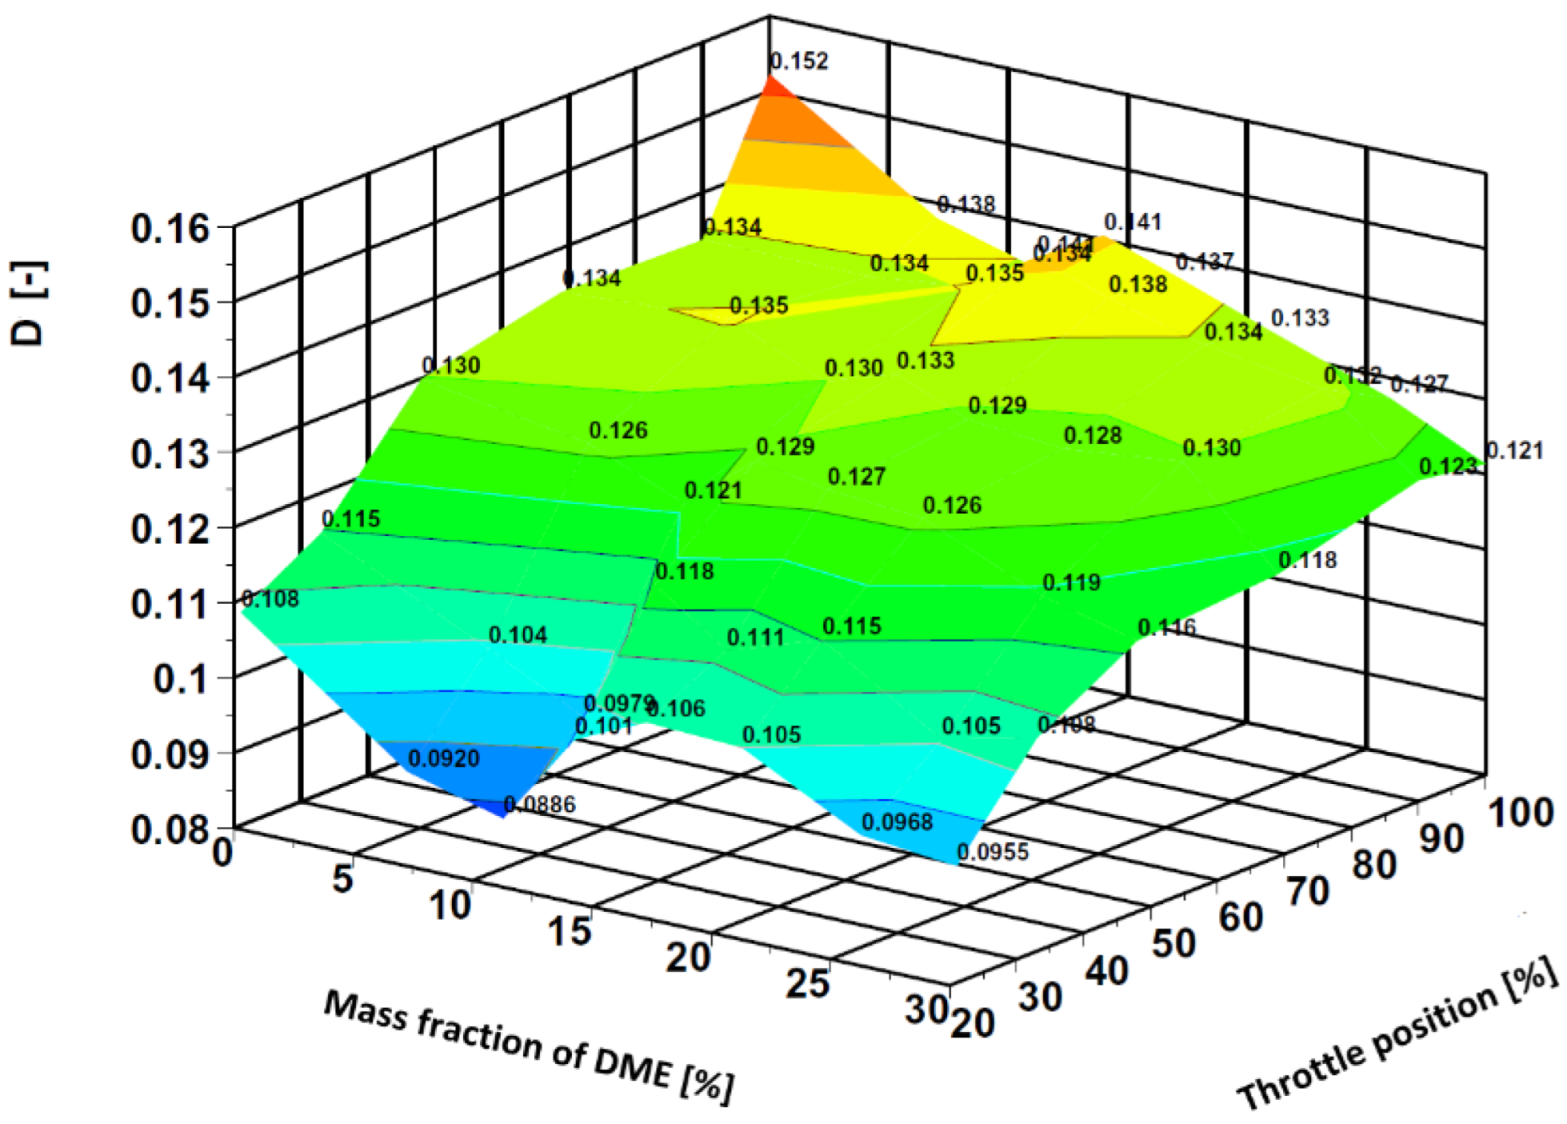
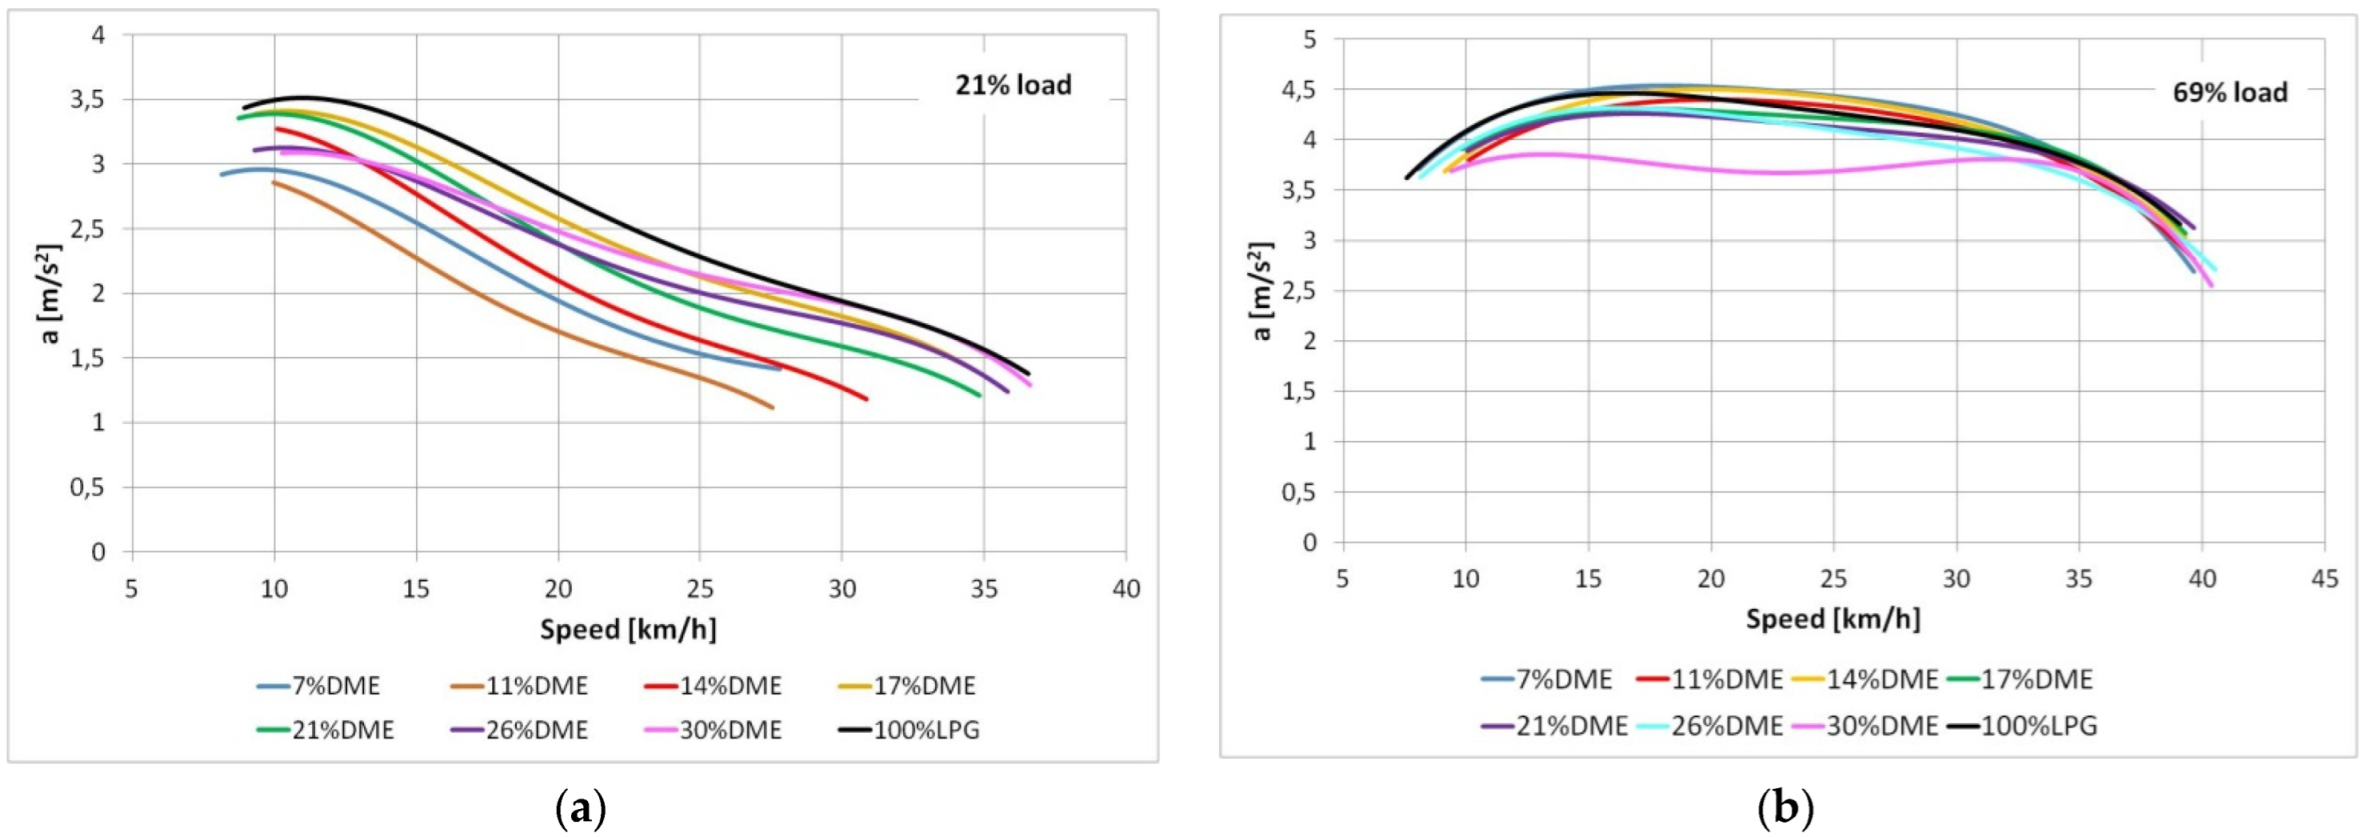
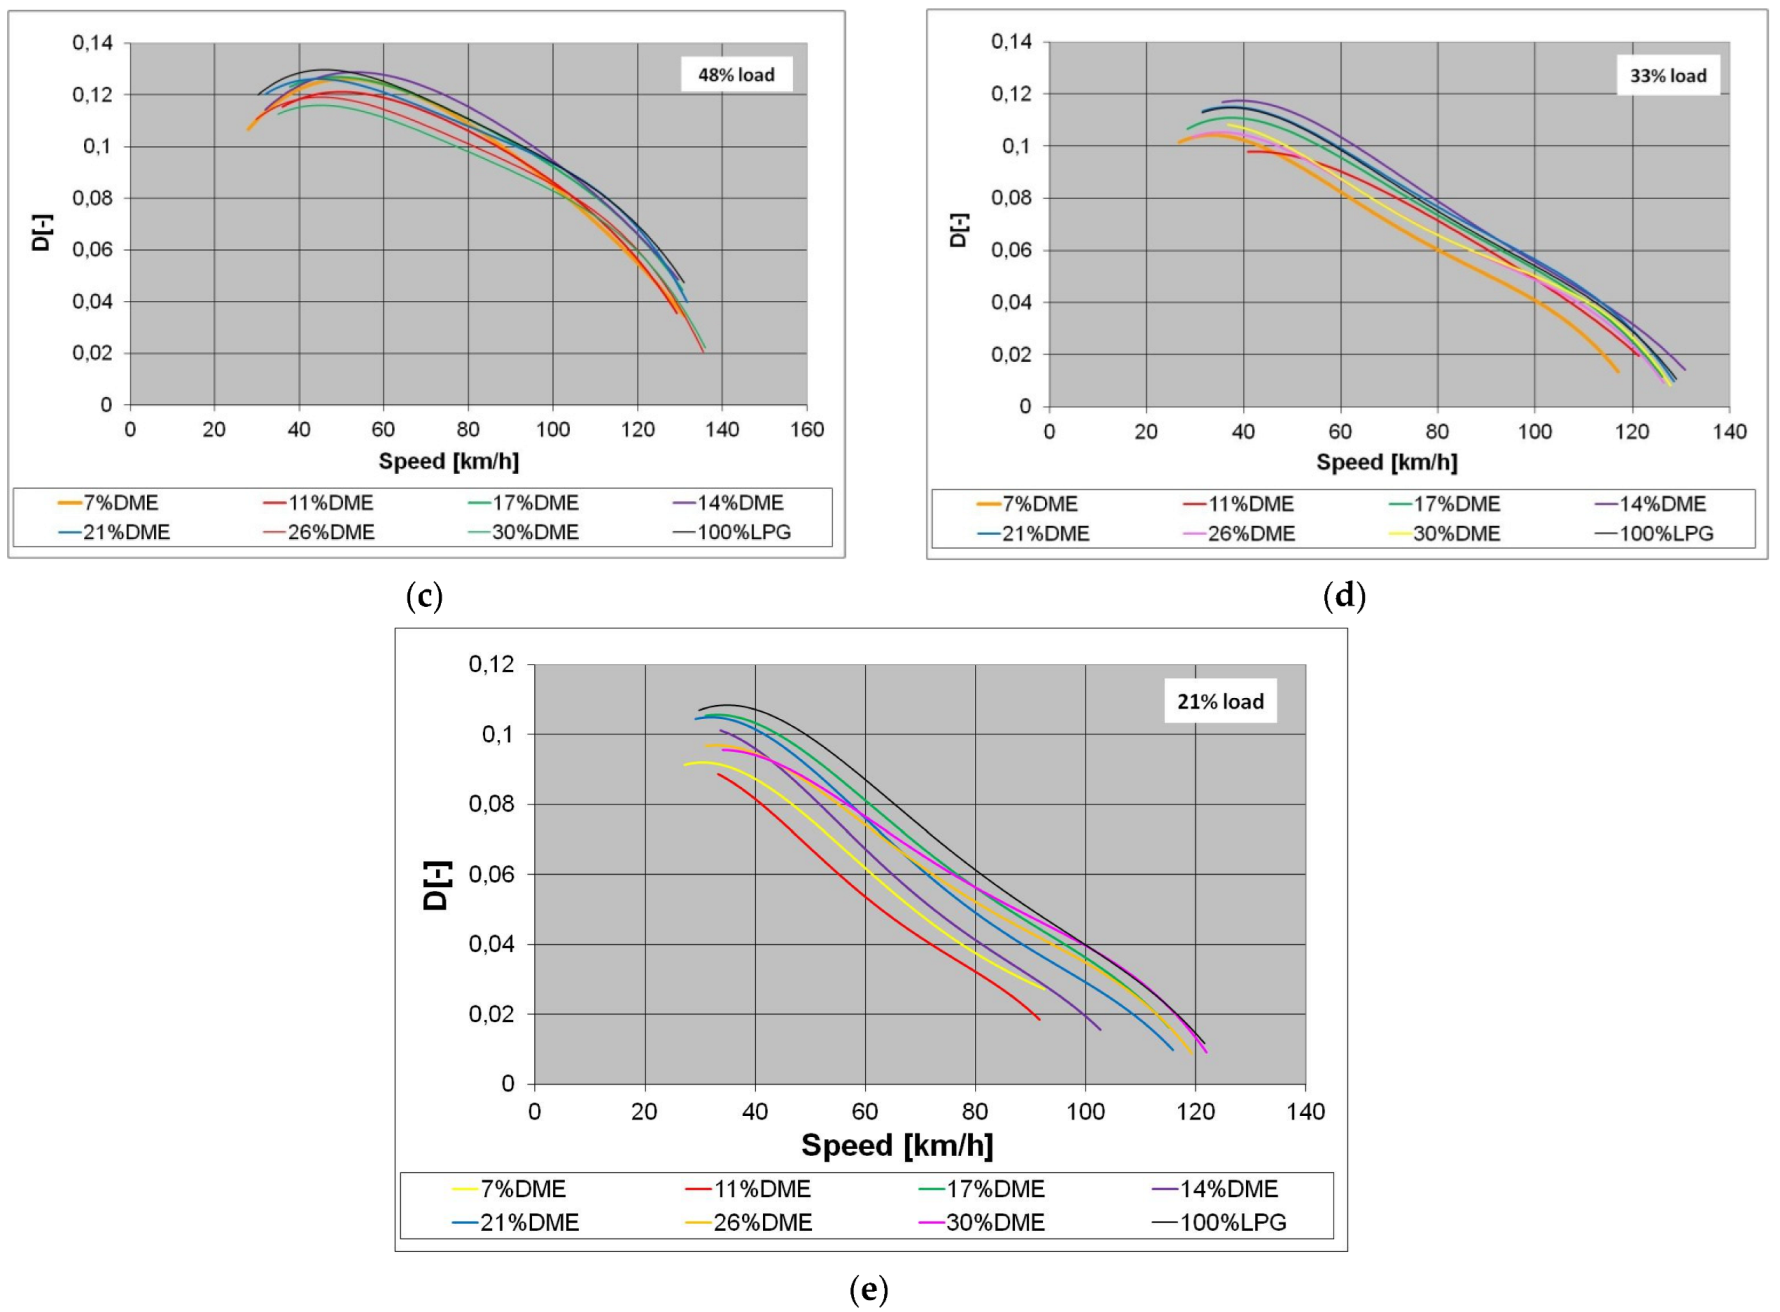
The courses of the dynamics factor depend on the speed of the tested car, with a different share of DME and selected engine loads; these are shown in
Figure 7. By contrast,
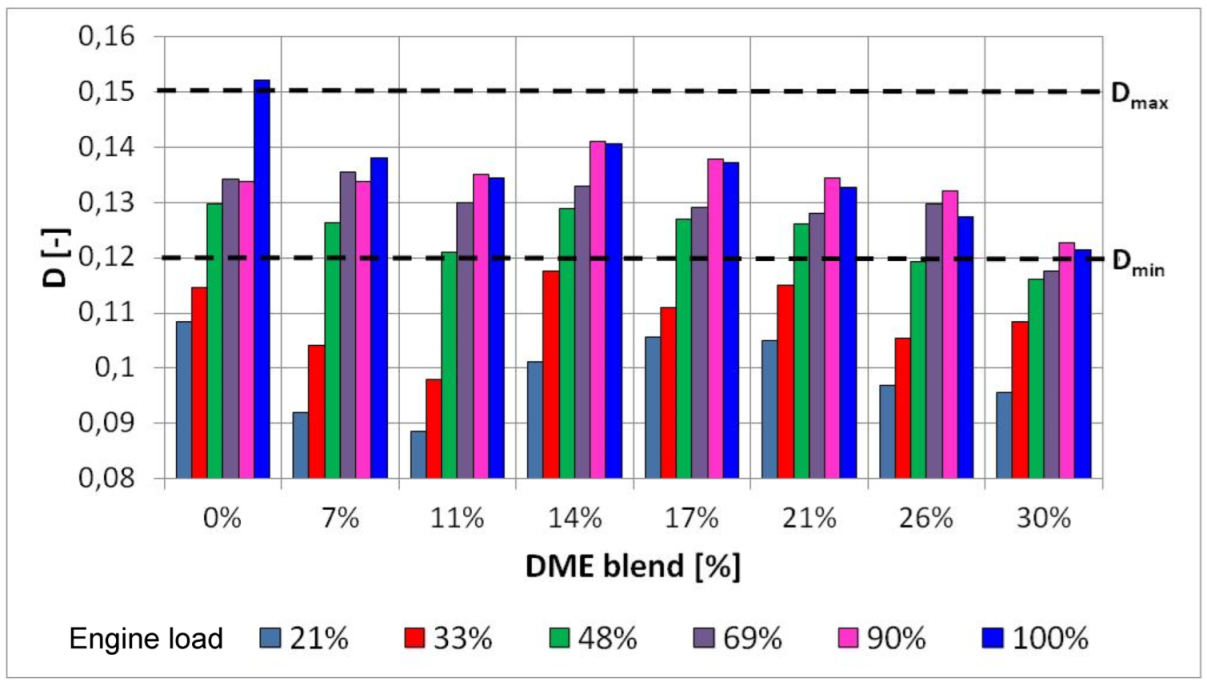
Figure 8 shows the maximum values of the dynamics factor obtained under the same conditions.
The obtained results of calculating the dynamic factor were compared with the data from the literature. According to the information contained in the literature, the dynamic factor for medium-sized passenger vehicles is 0.12–0.18 for the highest gear [
22,
23,
24].
Figure 9 shows the comparison of the obtained results with the factor from the bibliography.
Dotted lines are for data from the literature, but those data are received for maximum load (WOT). The obtained results pertain to variable loads (21–100%), which means that the results of the index for low loads are lower than the literature data.
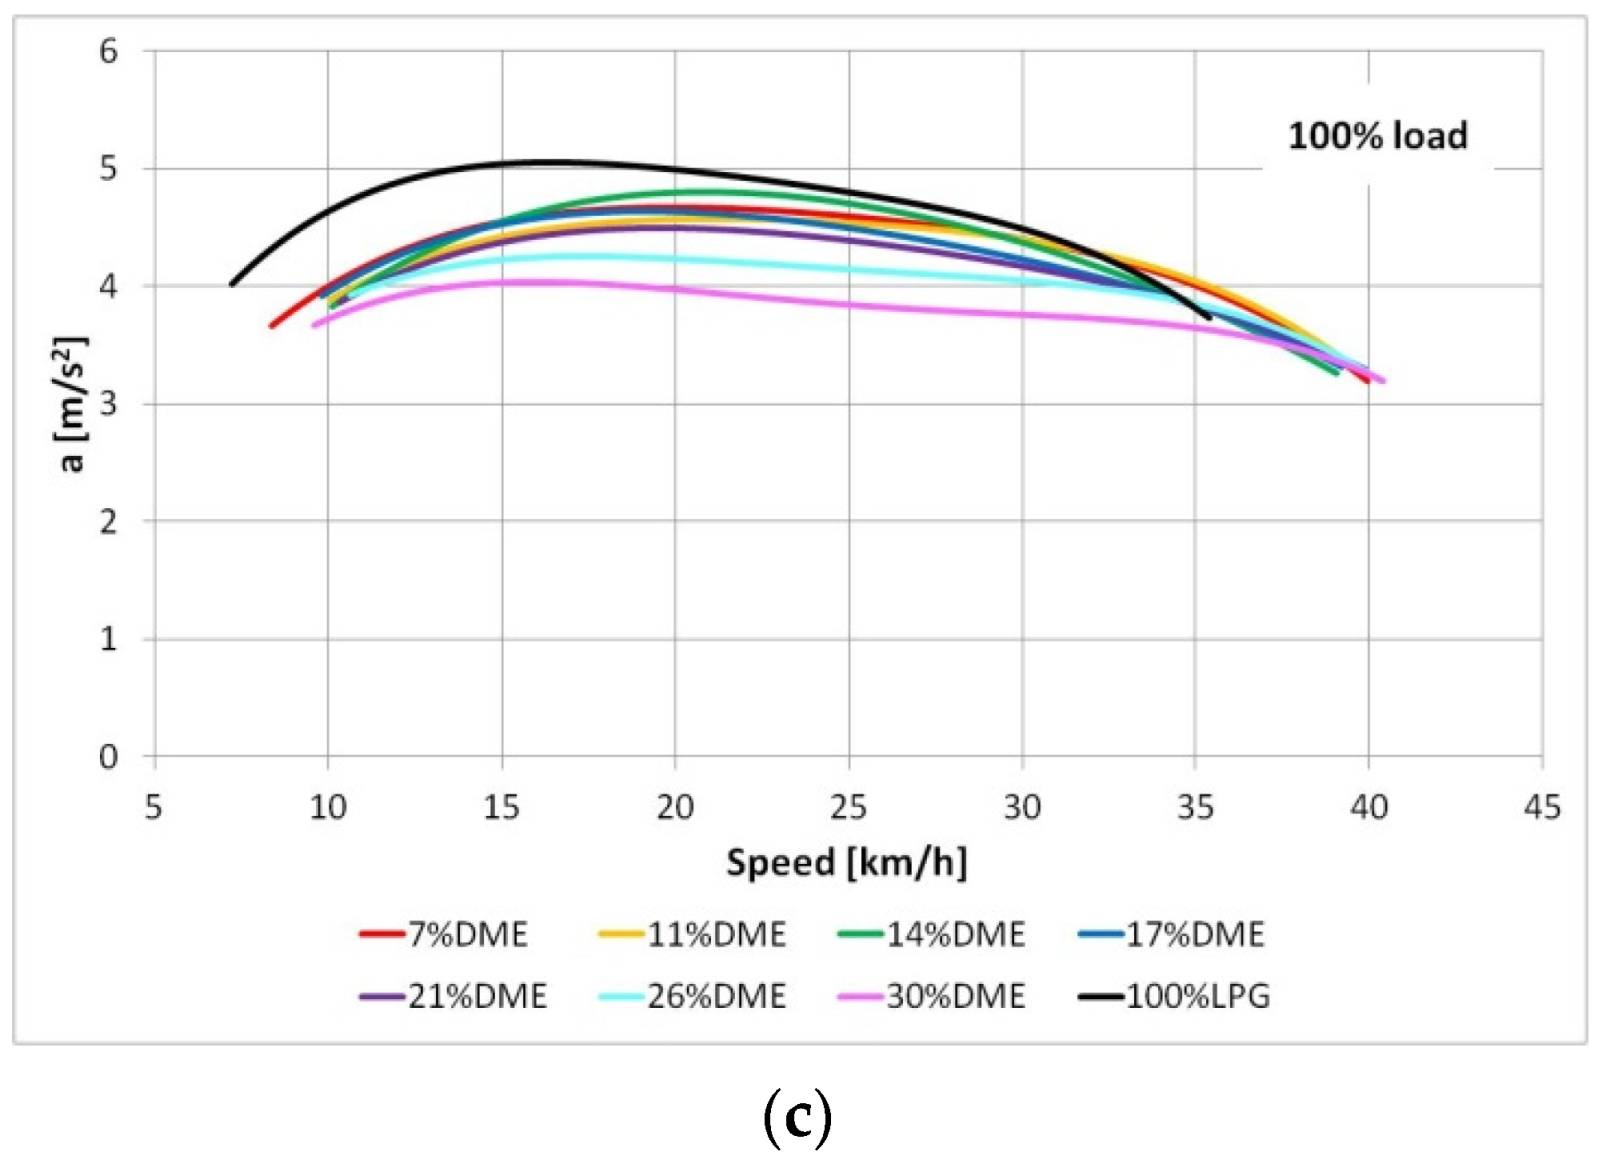
The course of changes in the accelerations calculated for the first gear are shown in
Figure 10, and for the highest gear in
Figure 11. Maximum values of the acceleration for the different mass fraction of DME and engine load are shown in
Figure 12.
The results presented above show that for the highest gear ratio and maximum engine load, the highest dynamics of vehicle motion are obtained for a mixture with a 14% mass fraction of DME. With the decrease in engine load, the value of the dynamic factor is the highest for the fuel with the 7% mass fraction of DME at the engine load of 69%.
The highest values of the dynamics factor were obtained for the fuel with a 14% mass fraction of DME at the loads corresponding to 90%, 48%, and 33% of the throttle opening. At the engine load corresponding to 21% of the throttle opening, the highest values of the dynamics factor were obtained for LPG (100%). However, the DME’s 17% mass fraction curve does not significantly deviate from these values.
In the case of accelerations calculated for the highest gear, the highest values were obtained for a 14% DME mass fraction for loads corresponding to 90% and 33% of the throttle opening. For loads corresponding to 100%, 48% and 21% of the throttle opening, the highest accelerations were obtained for LPG. However, in the case of a load corresponding to 48% of the throttle opening, the acceleration values obtained for LPG and fuel with a 14% mass share of DME are similar.
For the lowest gear, the changes of acceleration values are like those obtained for the highest gear. Changes in values of the dynamic factor and acceleration are shown concerning engine speed, which allows for the analysis of these parameters at different car rates.
Adding DME to the engine supply mixture does not reduce the dynamic factor by more than 12% compared to the engine supply only by LPG. However, for each LPG–DME blend, the changes in load reduce the dynamic factor value by approximately 33%. In the whole range of loads, the most favorable changes in dynamics were obtained for mixtures with 14 and 17% DME. The most favorable values of the dynamic coefficient in the entire engine load range were obtained for mixtures with a 14% and 17% mass ratio of DME. On the other hand, when considering values of the dynamic factor depending on the speed of the car, it can be noticed that for the loads corresponding to:
- −
90% throttle opening, the highest values were obtained for a mixture with a 21% DME mass fraction in the speed range from 30 to 70 km/h, and for speeds above 70 km/h for a mixture with an 11% of mass fraction DME,
- −
69% throttle opening, the most favorable values of the dynamic factor were obtained for the mixture with a 7% share of DME,
- −
48% throttle opening, the most favorable dynamic factor waveform was also obtained for a mixture with a 7% DME mass fraction,
- −
21% throttle opening, the best waveform of the dynamic factor, was obtained for a mixture with a 14% DME mass fraction.
The calculation results showed that mixtures containing 14 to 21% did not significantly reduce the car’s performance.
Since a car’s performance depends primarily on the developed torque and the achieved engine power, it seems necessary to control the composition of the mixture of LPG–DME and, most of all, the amount of DME contained in it.
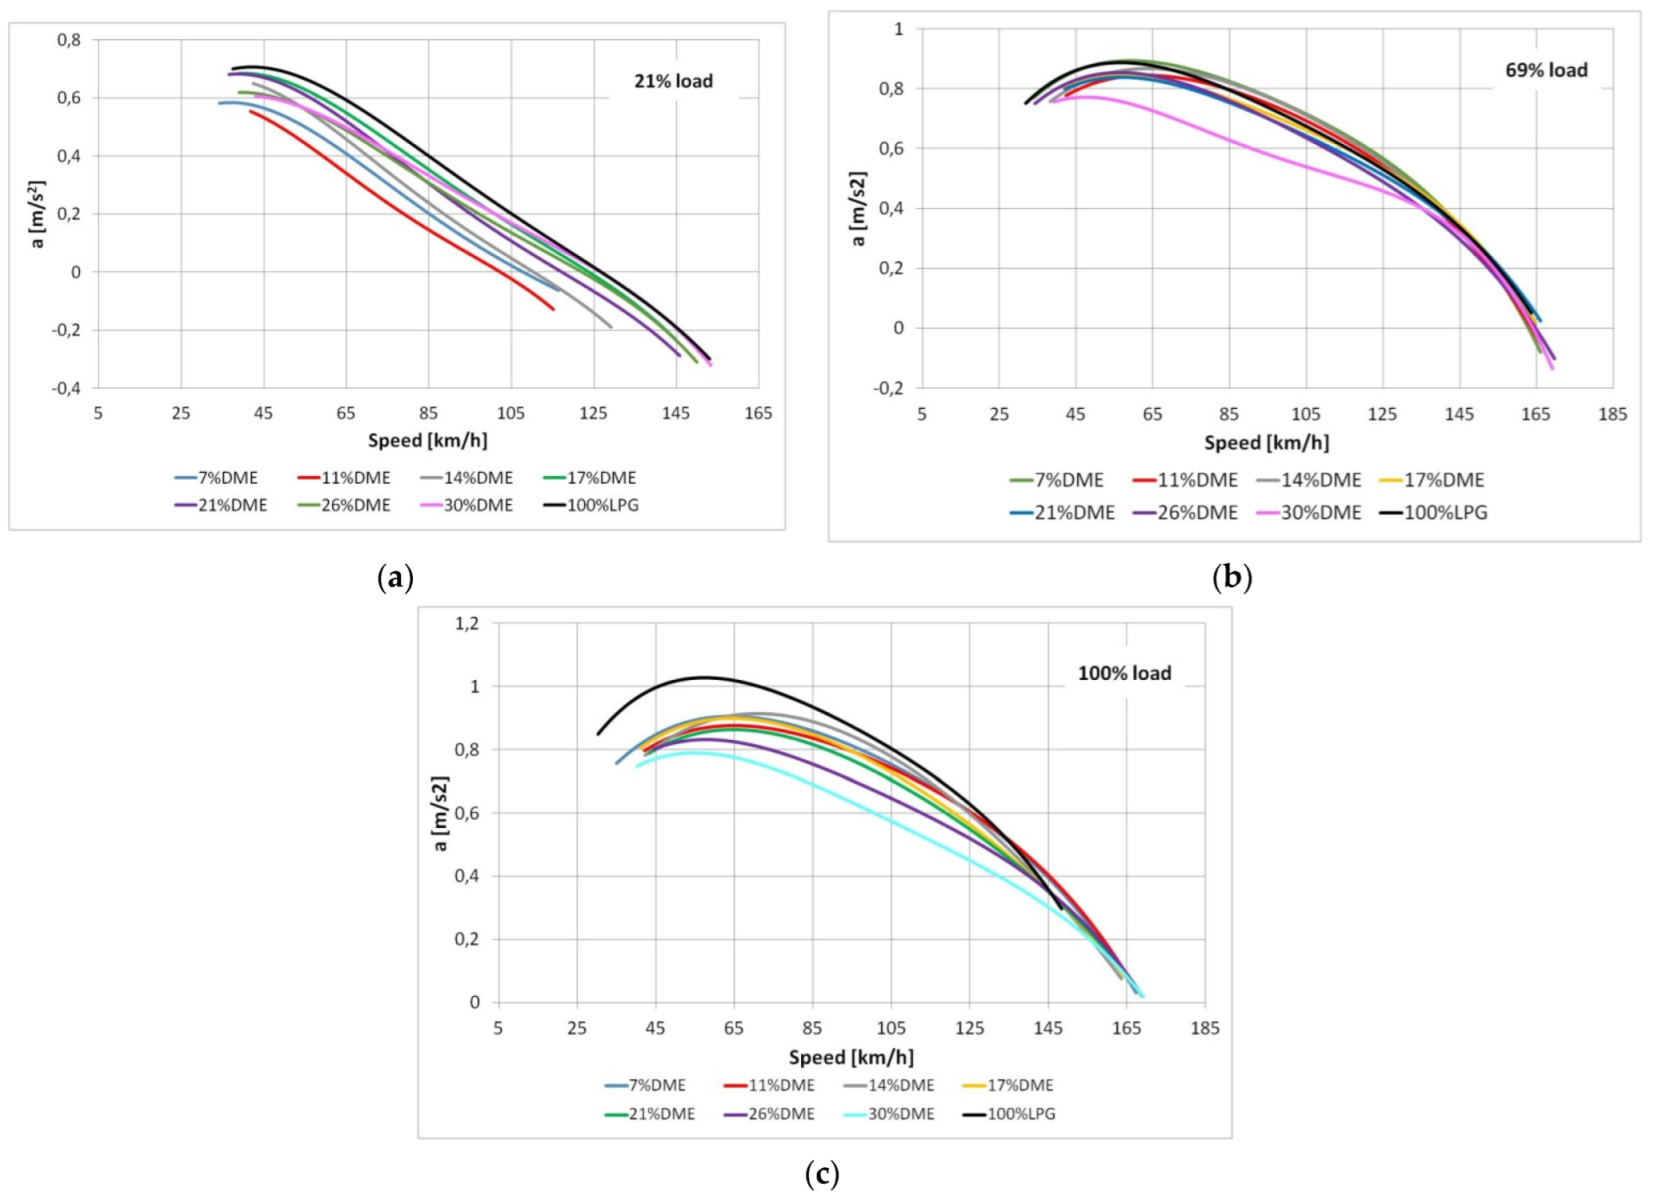
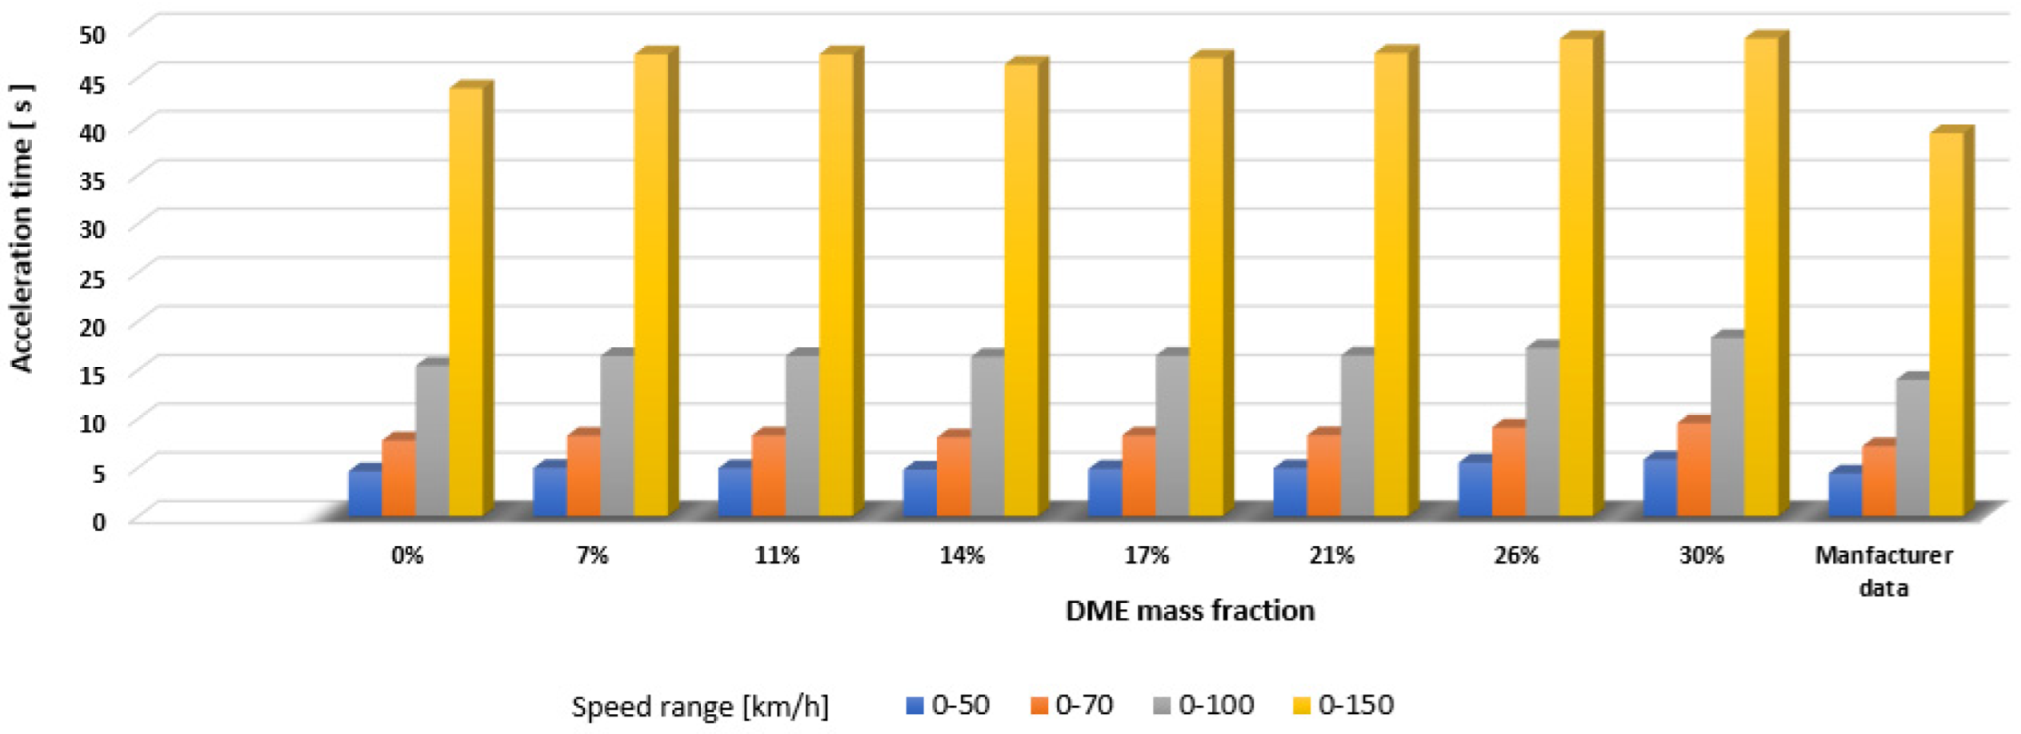
The time needed to accelerate a car powered by mixtures of different mass fractions of DME for WOT and different final speeds is summarized in
Figure 13. This table also summarizes the values of the acceleration time specified by the car manufacturer.
For mixtures containing 11, 14, and 17% DME, the car acceleration time in selected speed ranges differs from the factory data by 9 to 15%. In the case of LPG, these differences are much more minor; for the same mixtures, they amount to 4 to 6%.
5. Conclusions
The article analyses the influence of the mass share of DME in the LPG–DME mixture on the dynamics of a vehicle powered by a SI engine. The performed calculations made it possible to determine changes in the value of the maximum dynamic coefficient, maximum acceleration, and car acceleration time for selected engine loads and various DME shares in the mixture.
The findings of the carried research indicate that DME in the mixtures with LPG has the potential to be used as a fuel for SI engines. Exploring experimental and calculation results, it has been shown that the value of the dynamic factor decreases no more than 12% compared to the fueling only by LPG. Moreover, the calculated values of the dynamic factor fall within the range characterized by passenger cars [
22,
23,
24]. In order to obtain the values of the dynamic index close to or than those obtained for the supply of LPG only, it seems advisable to carry out research on a system that would ensure smooth and quick control of the mass fraction of DME in the mixture. In addition, the following conclusions can be drawn from the current study:
Reducing the engine load causes a uniform reduction in the value of the dynamic factor.
DME mass fraction in the range of 7 to 11% causes decreases in the value of the dynamic index, regardless of the engine load. But when the mass fraction of DME exceeds 11%, the dynamic factor increases.
Mixtures containing up to 20% DME can be used as an alternative fuel without any changes in the fuel system.
The increasing mass fraction of DME in the mixture increases the acceleration time. However, the variation in acceleration time is not uniform. A mass fraction of more than 11% is preferable to the content of less than 11% and more than 21%.


