
Impact of Reactive Power from Public Electric Vehicle Stations on Transformer Aging and Active Energy Losses

Abstract
:1. Introduction
2. Modeling System Components
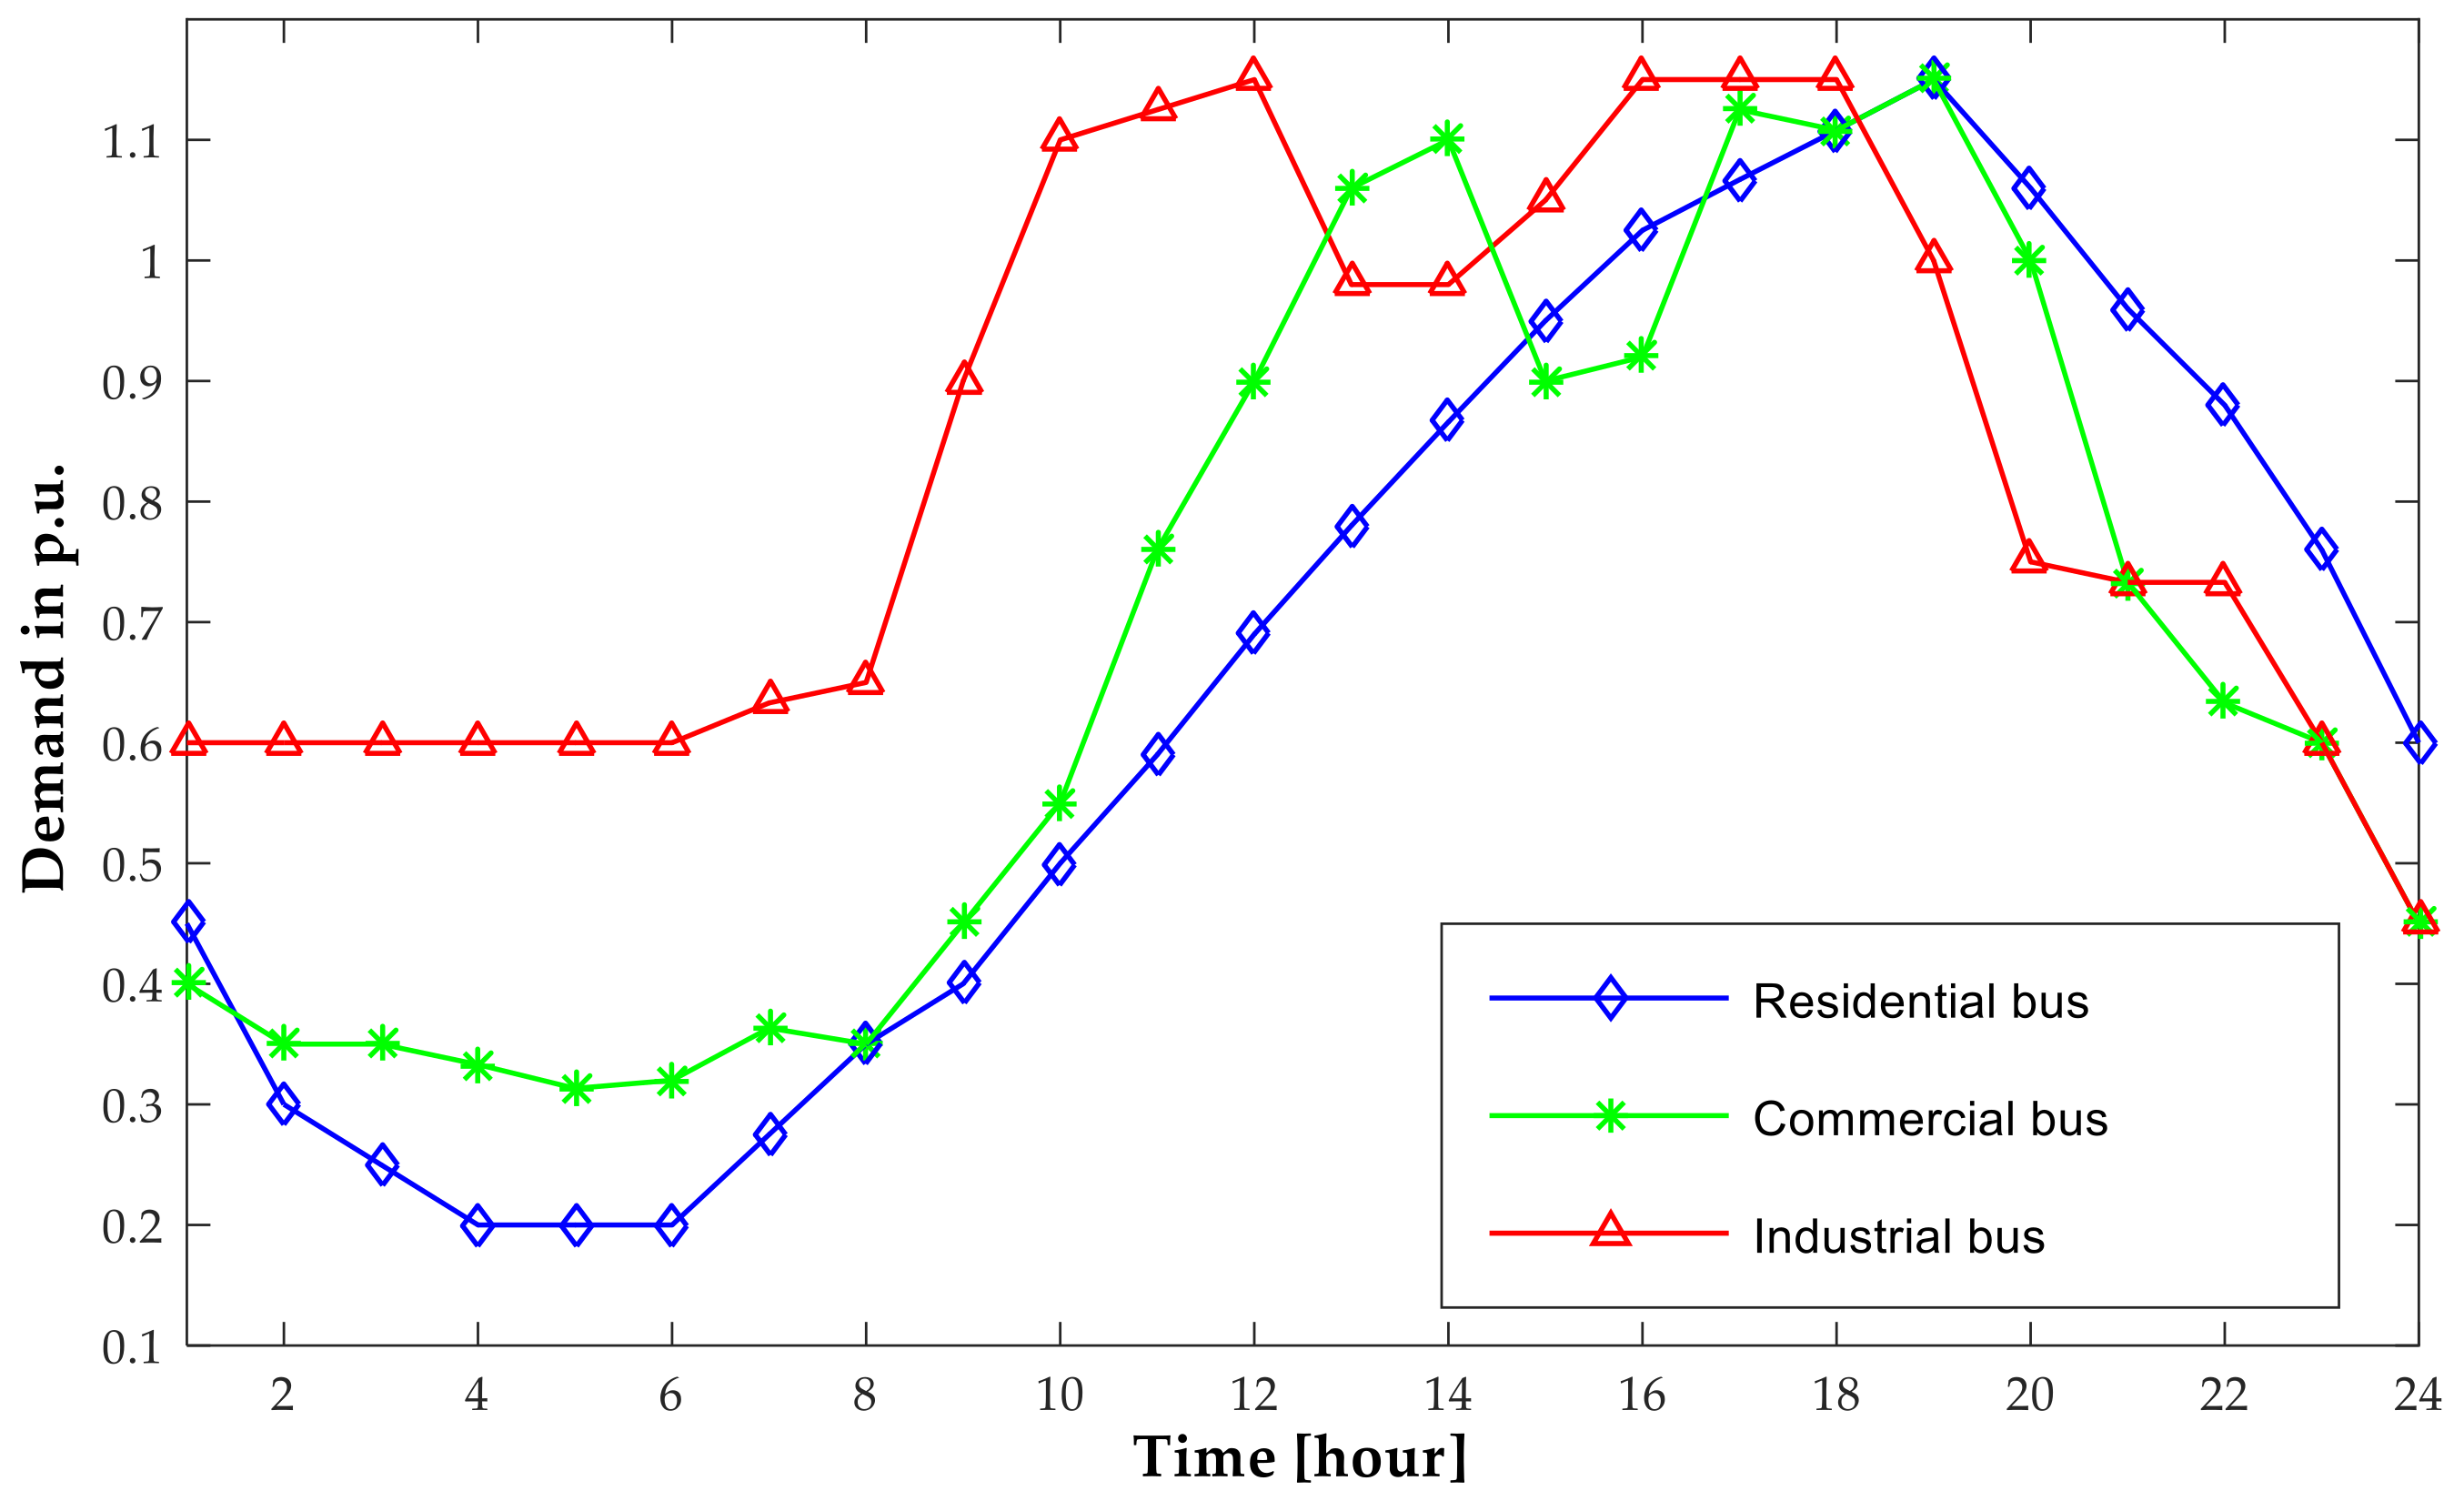
2.1. Load Modeling
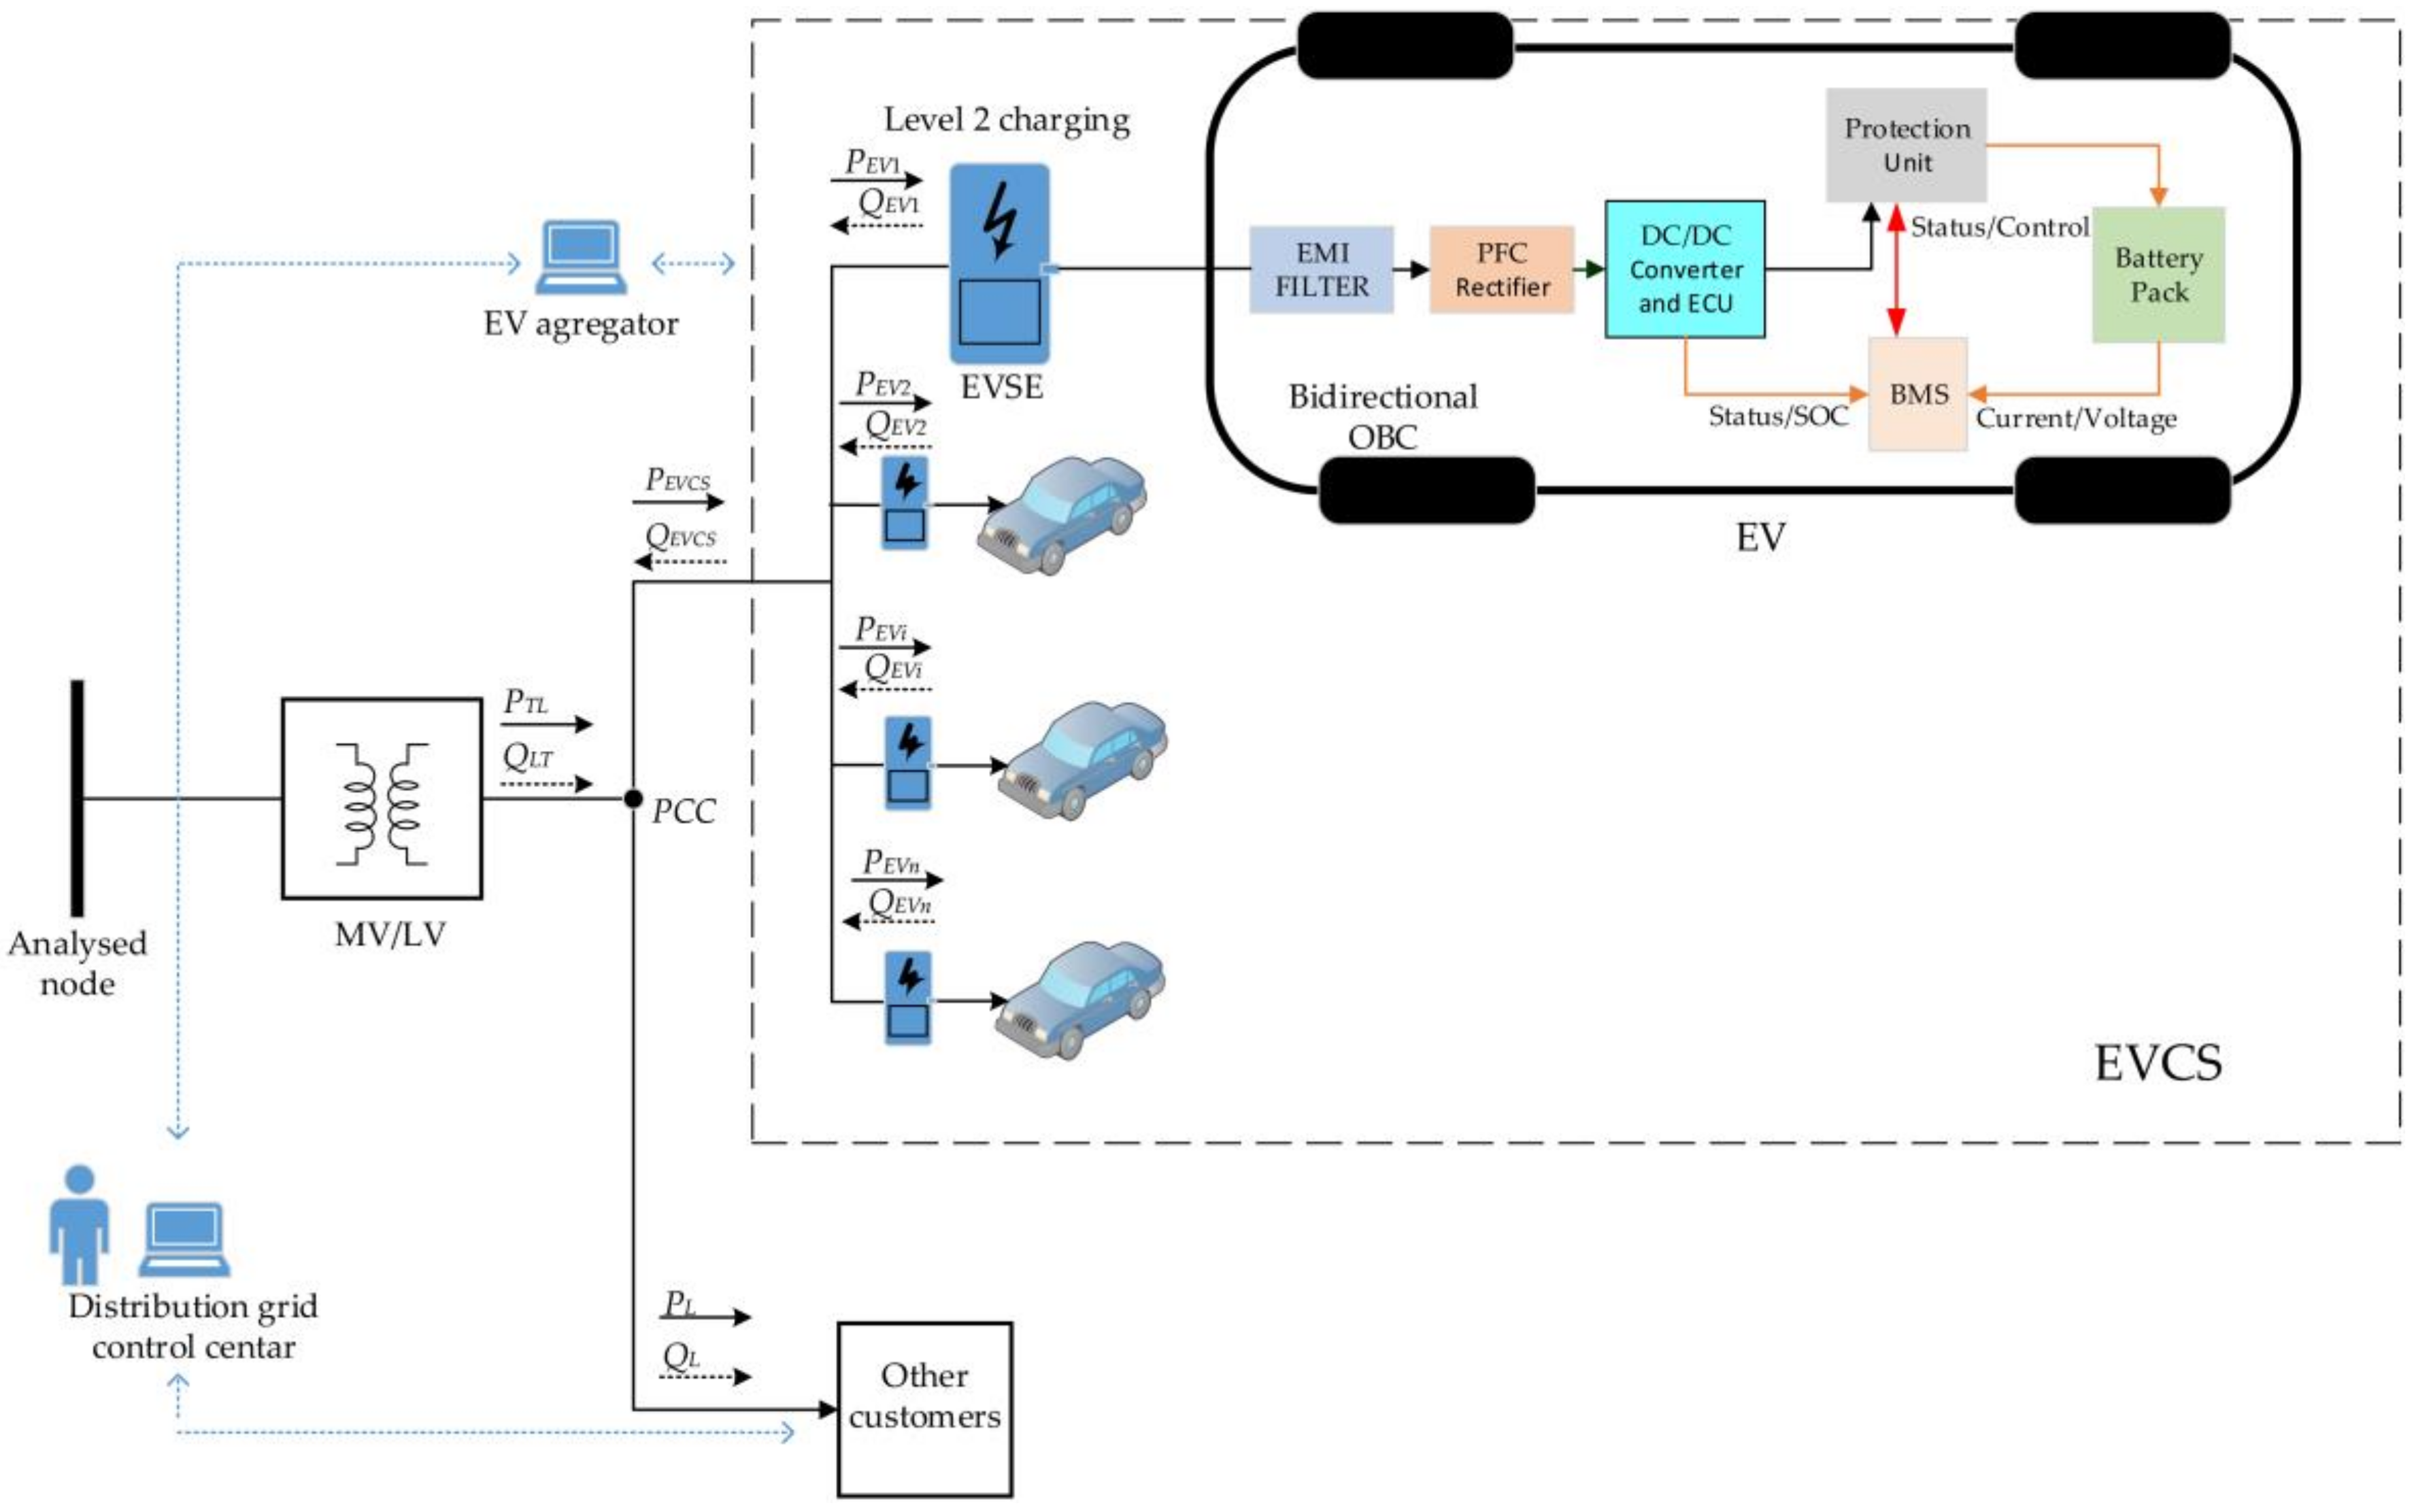
2.2. Public EVCS Modeling
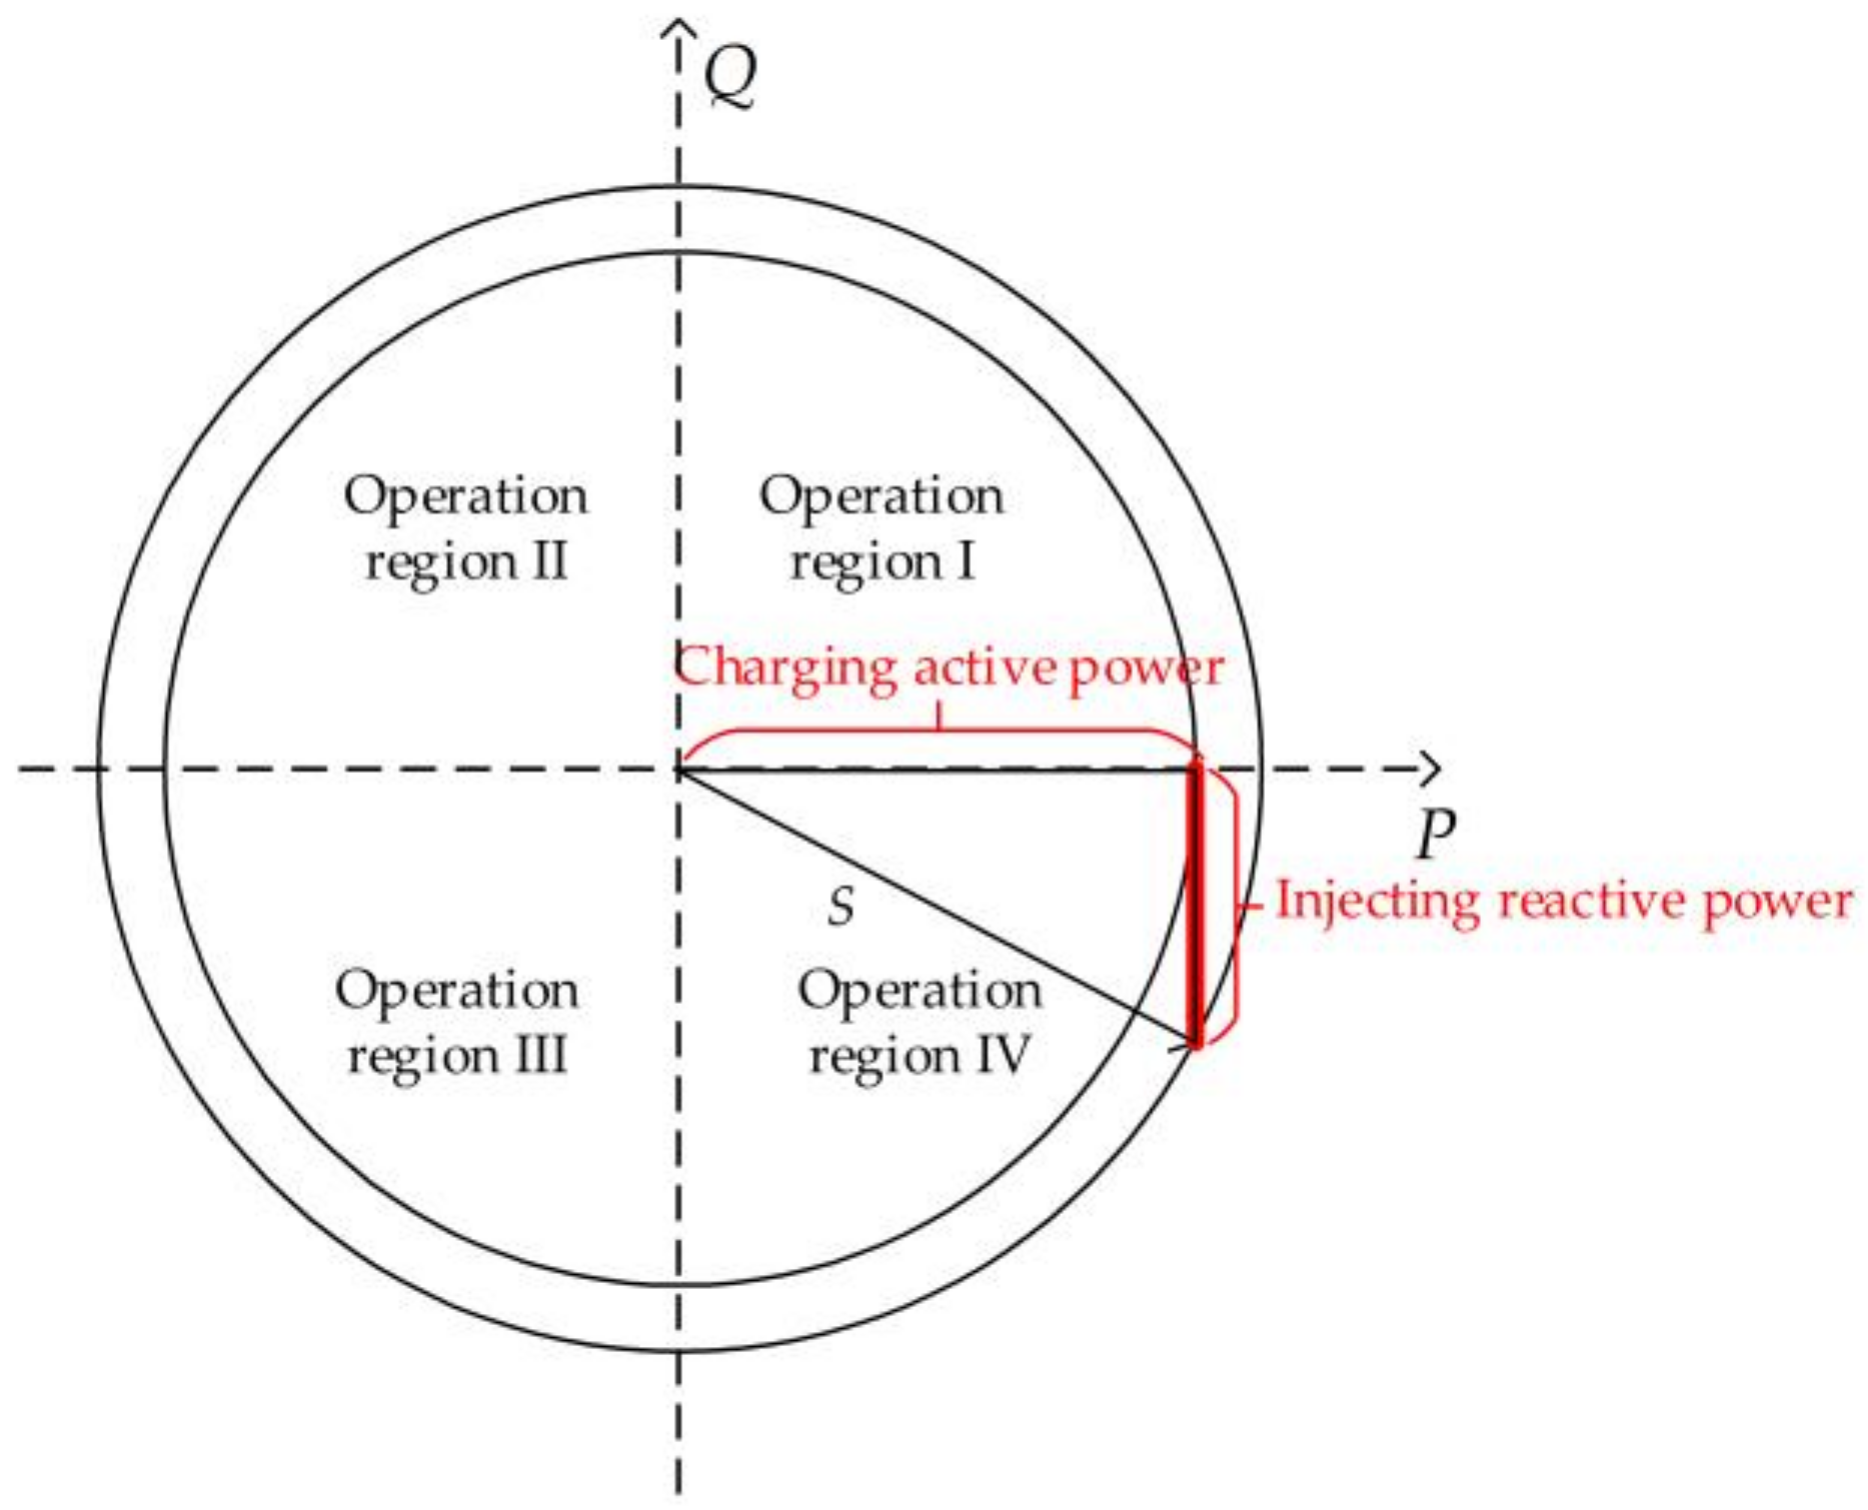
2.2.1. Operation Region of EV Chargers
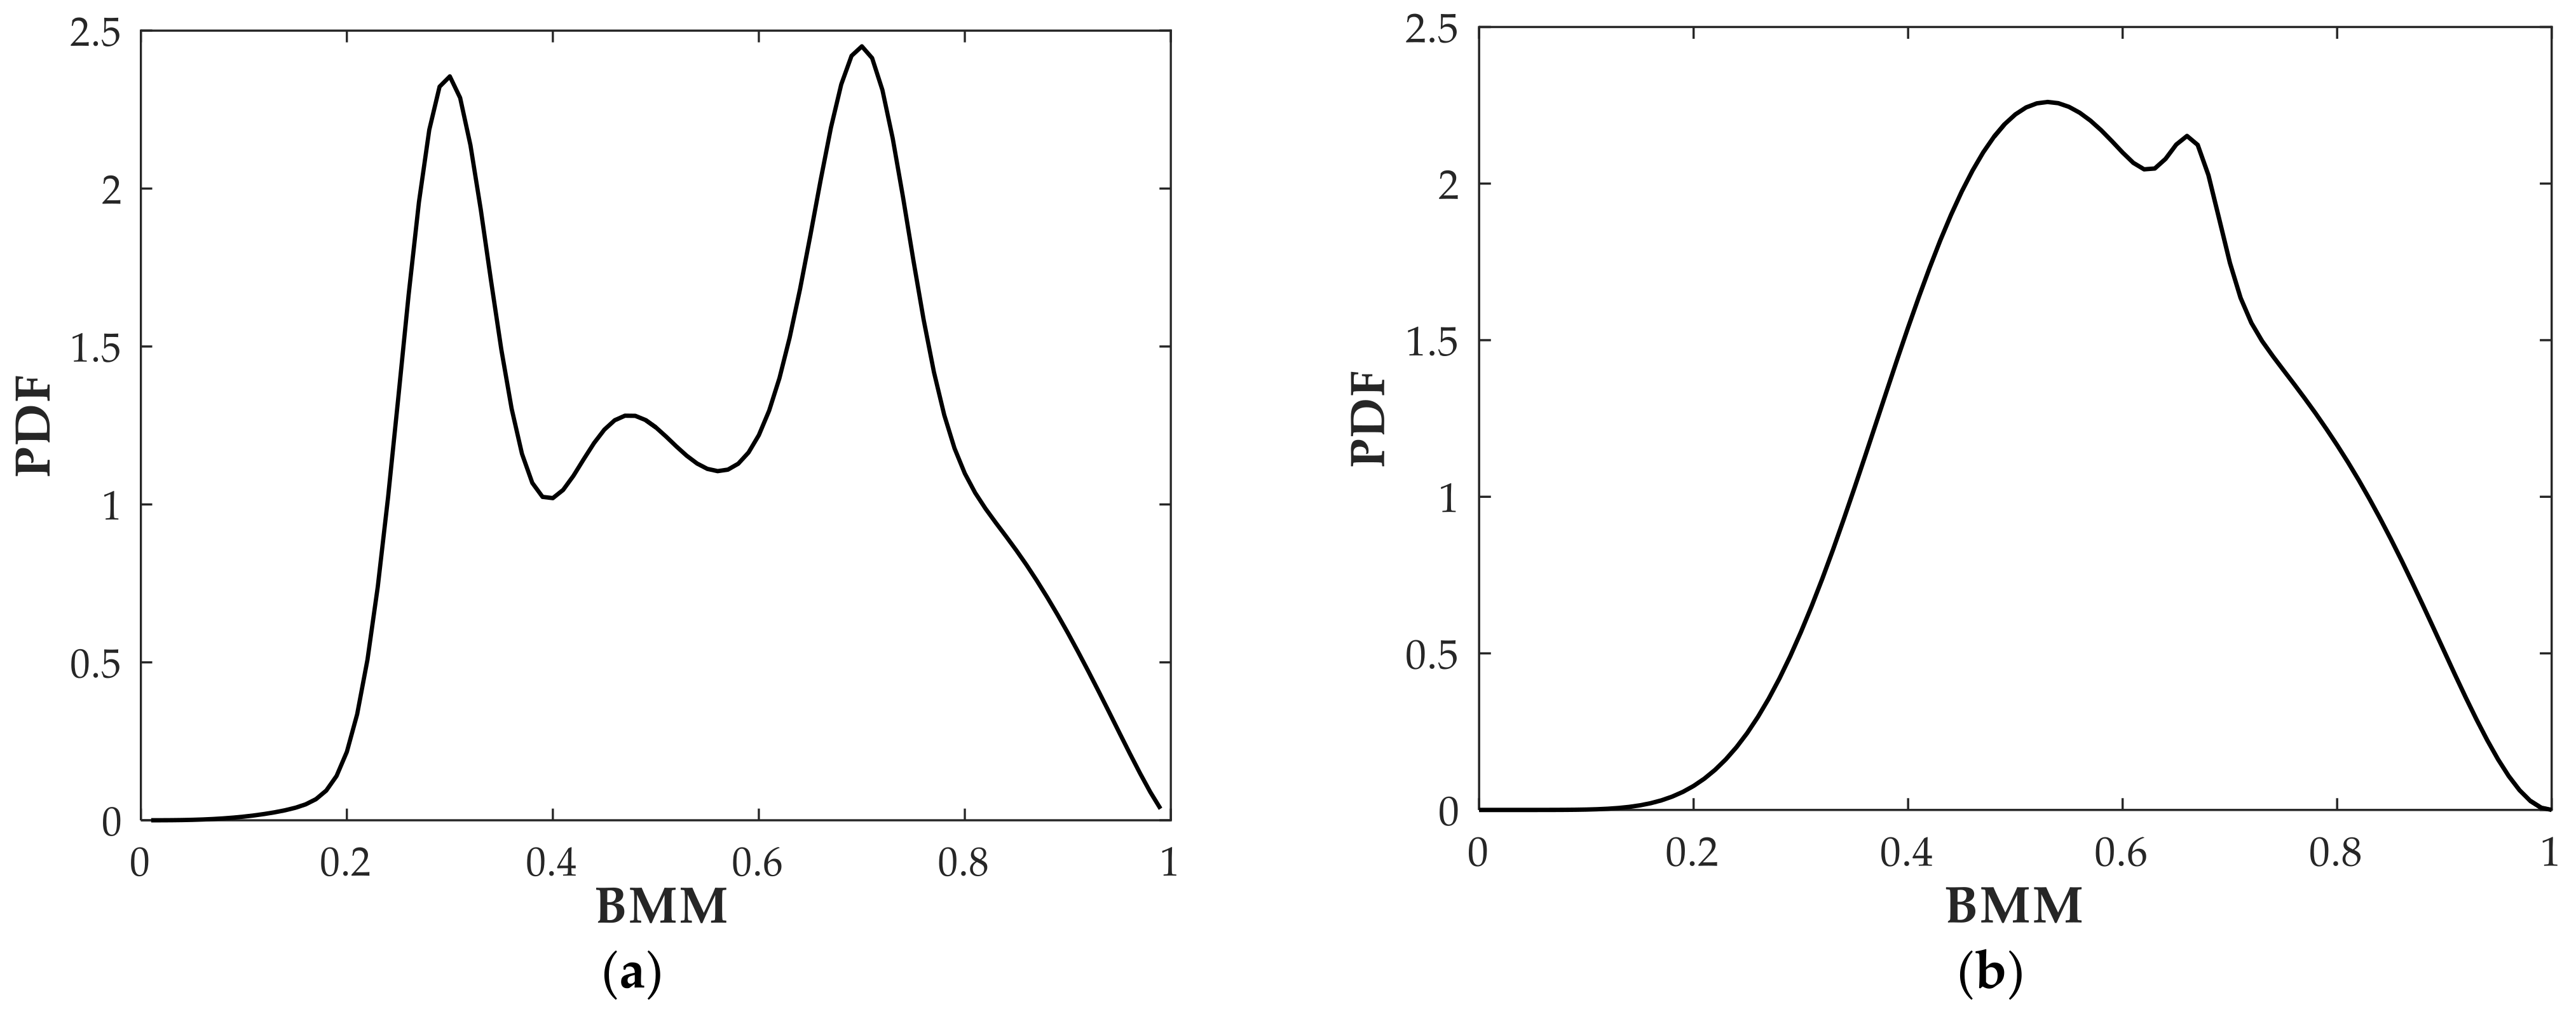
2.2.2. Mobility Stochastic Behavior Model
- Behavior of start charging time
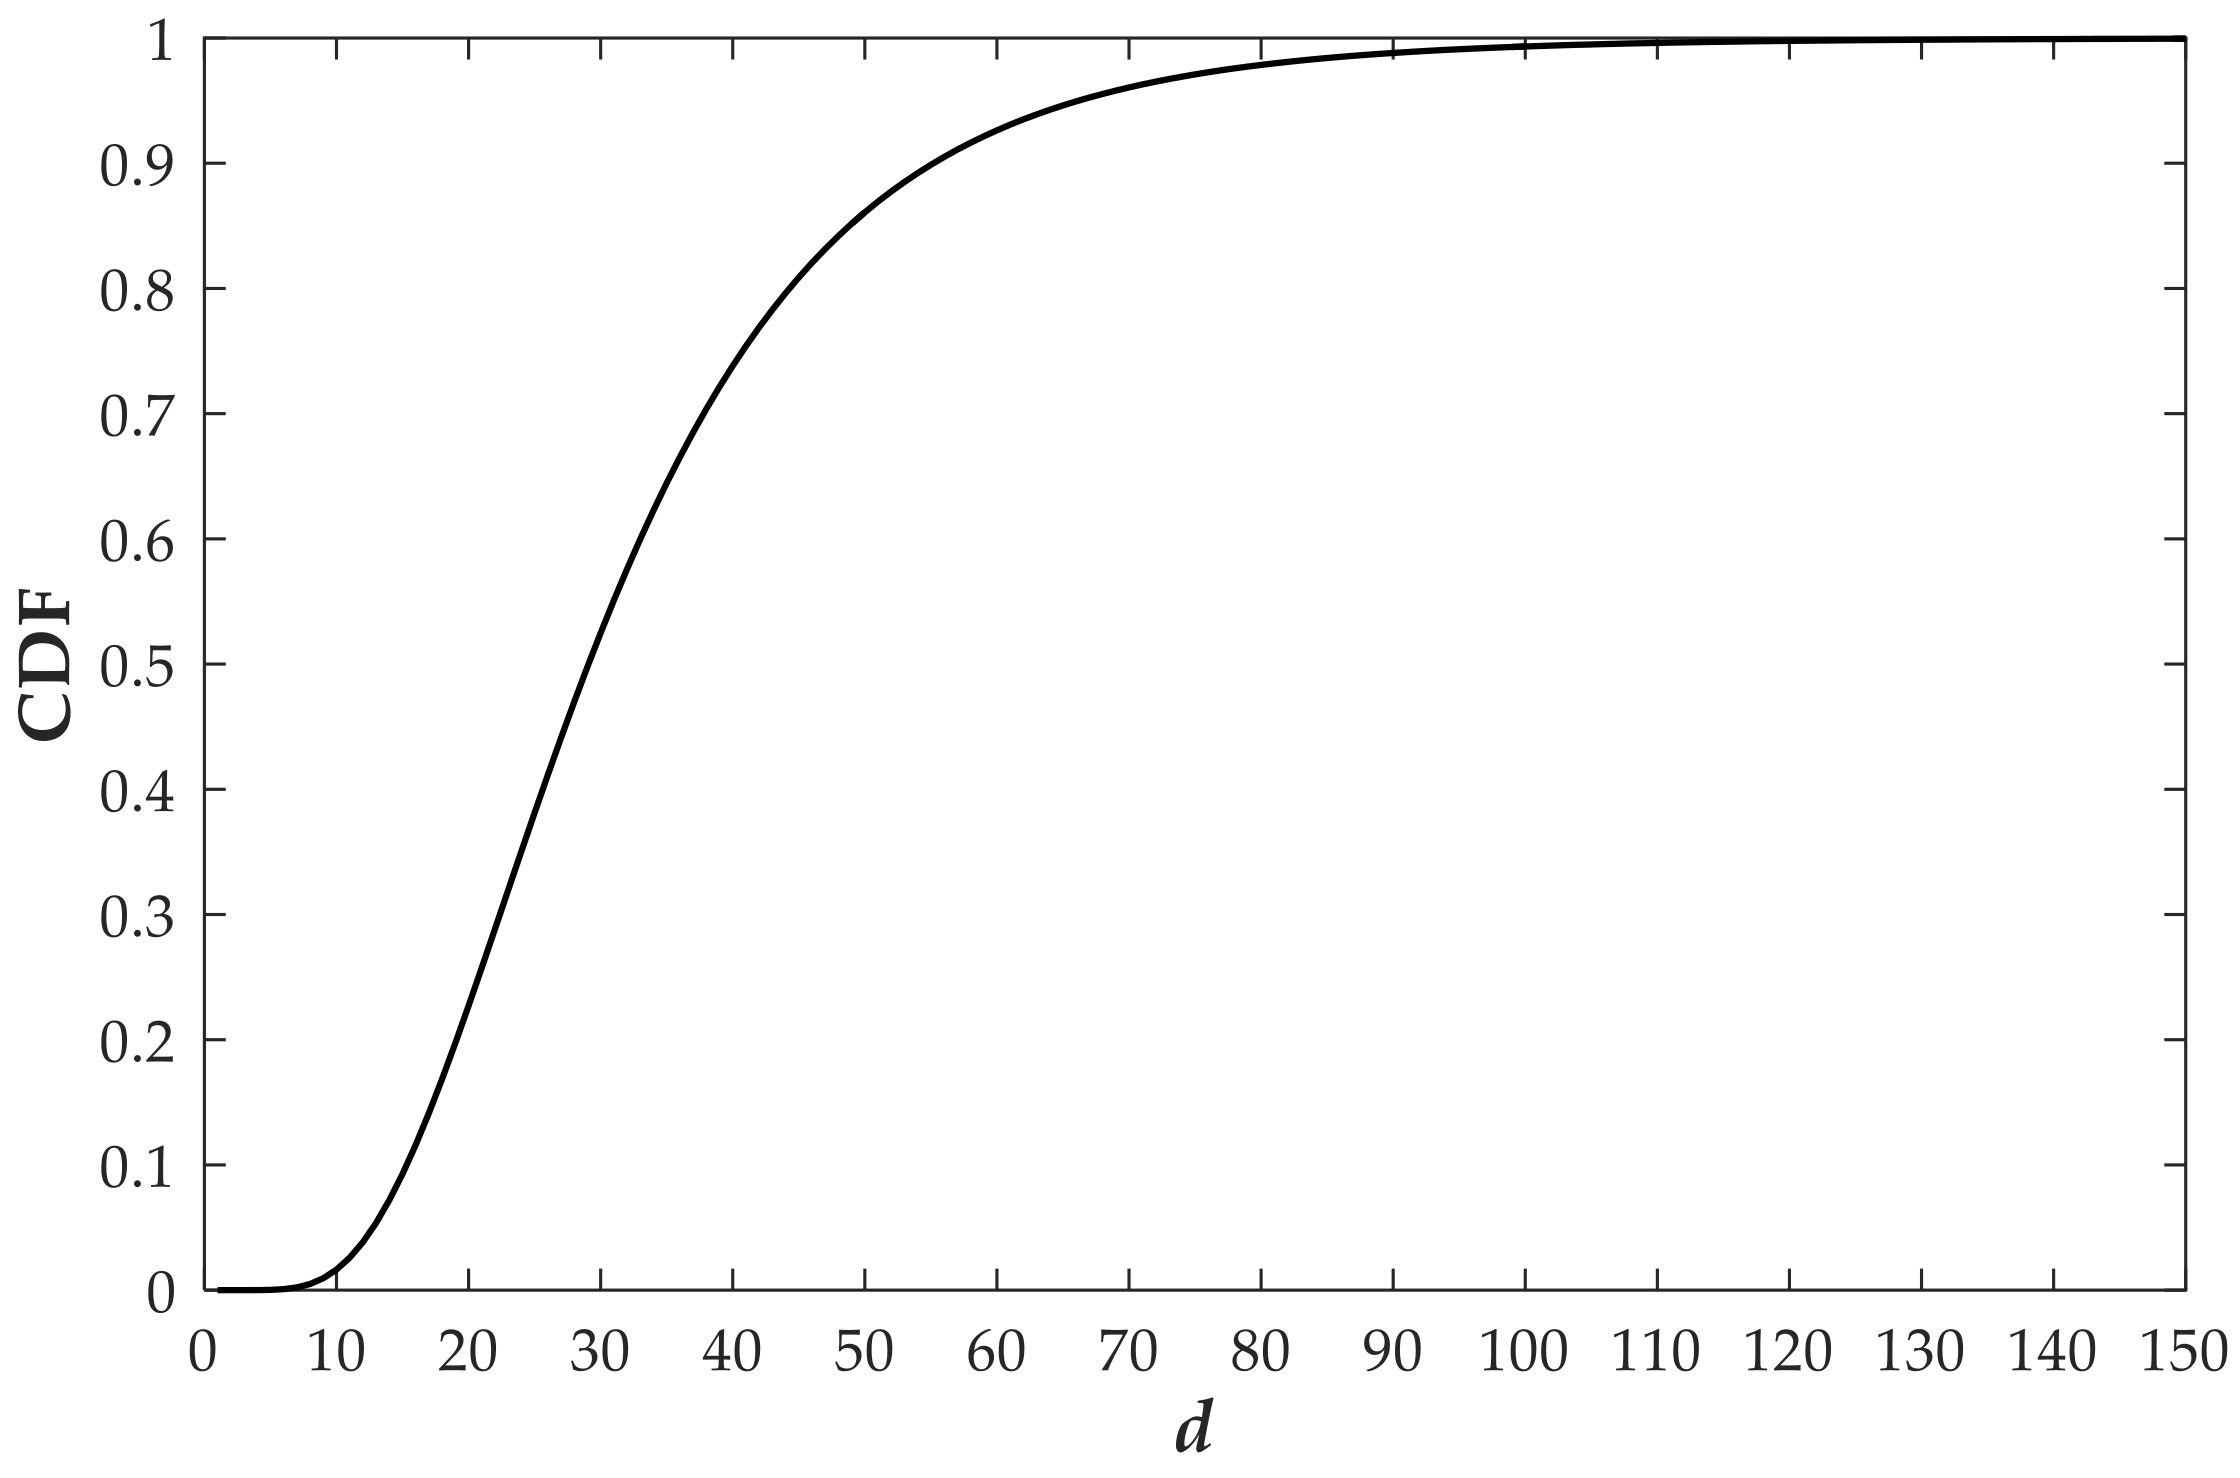
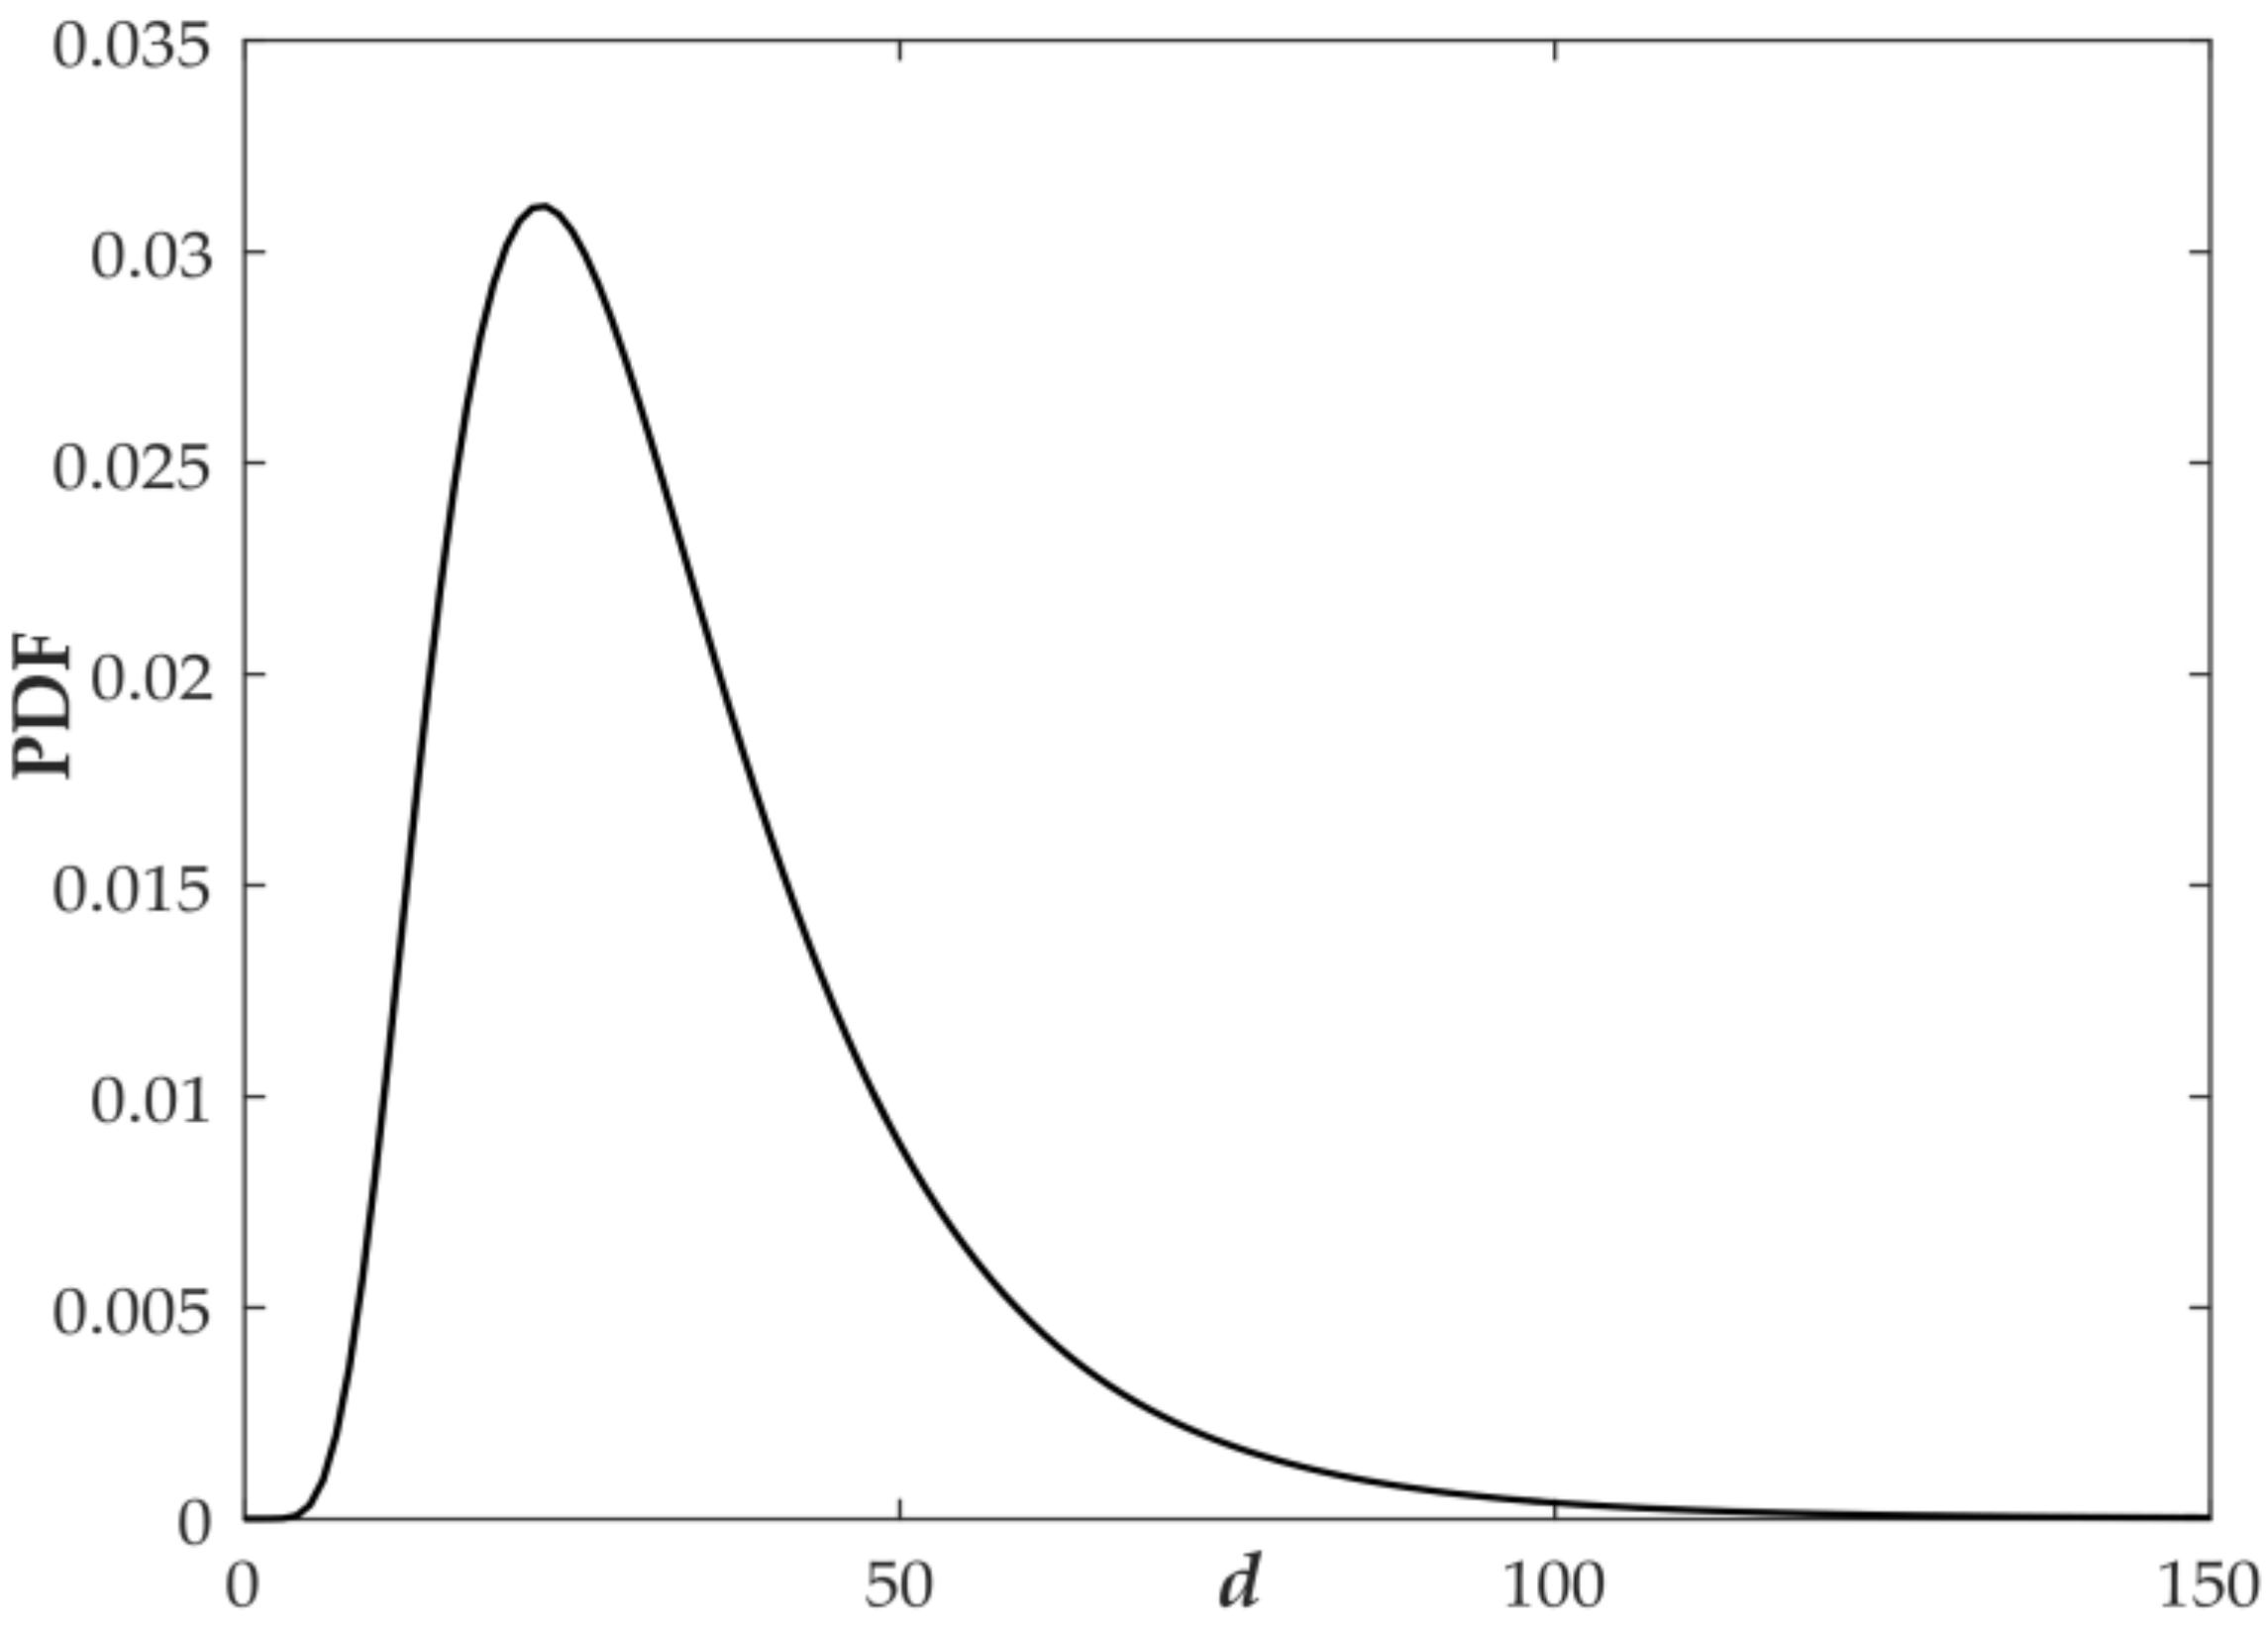
- Behavior of distance travelled and initial state of charge
2.2.3. Charging Power Model
2.3. Power Flow Analysis
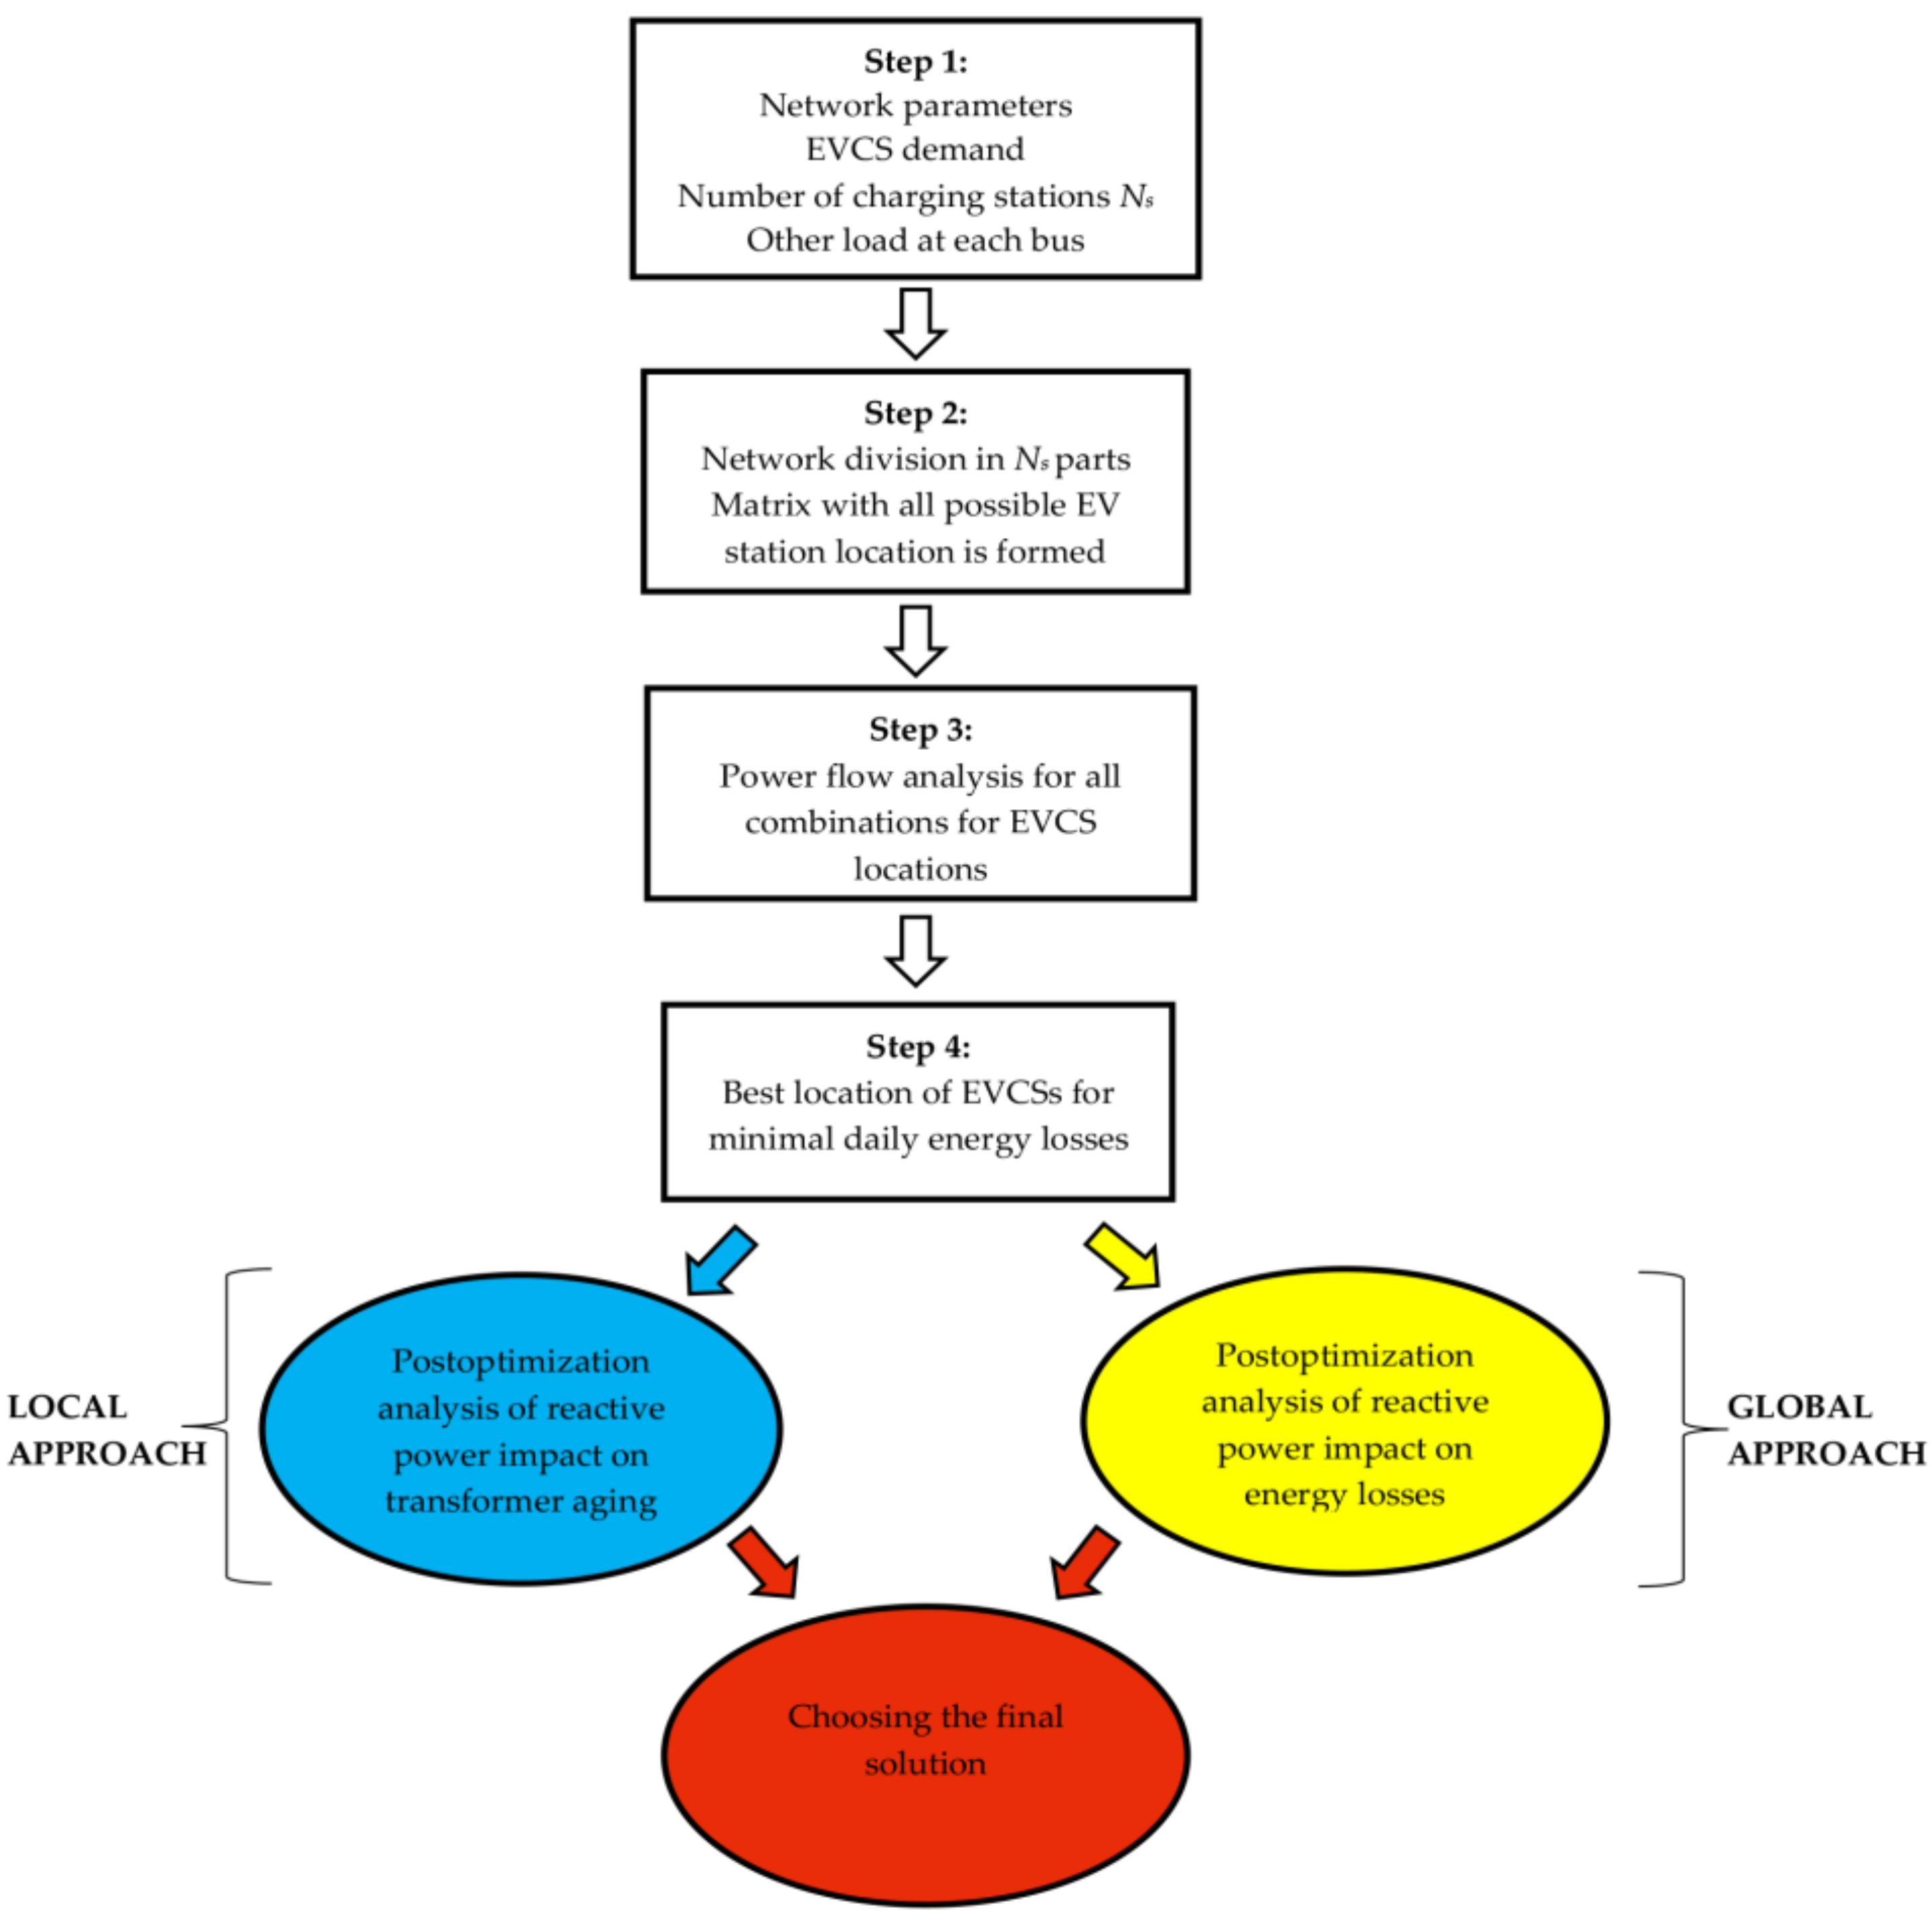
3. Methodology
3.1. Description
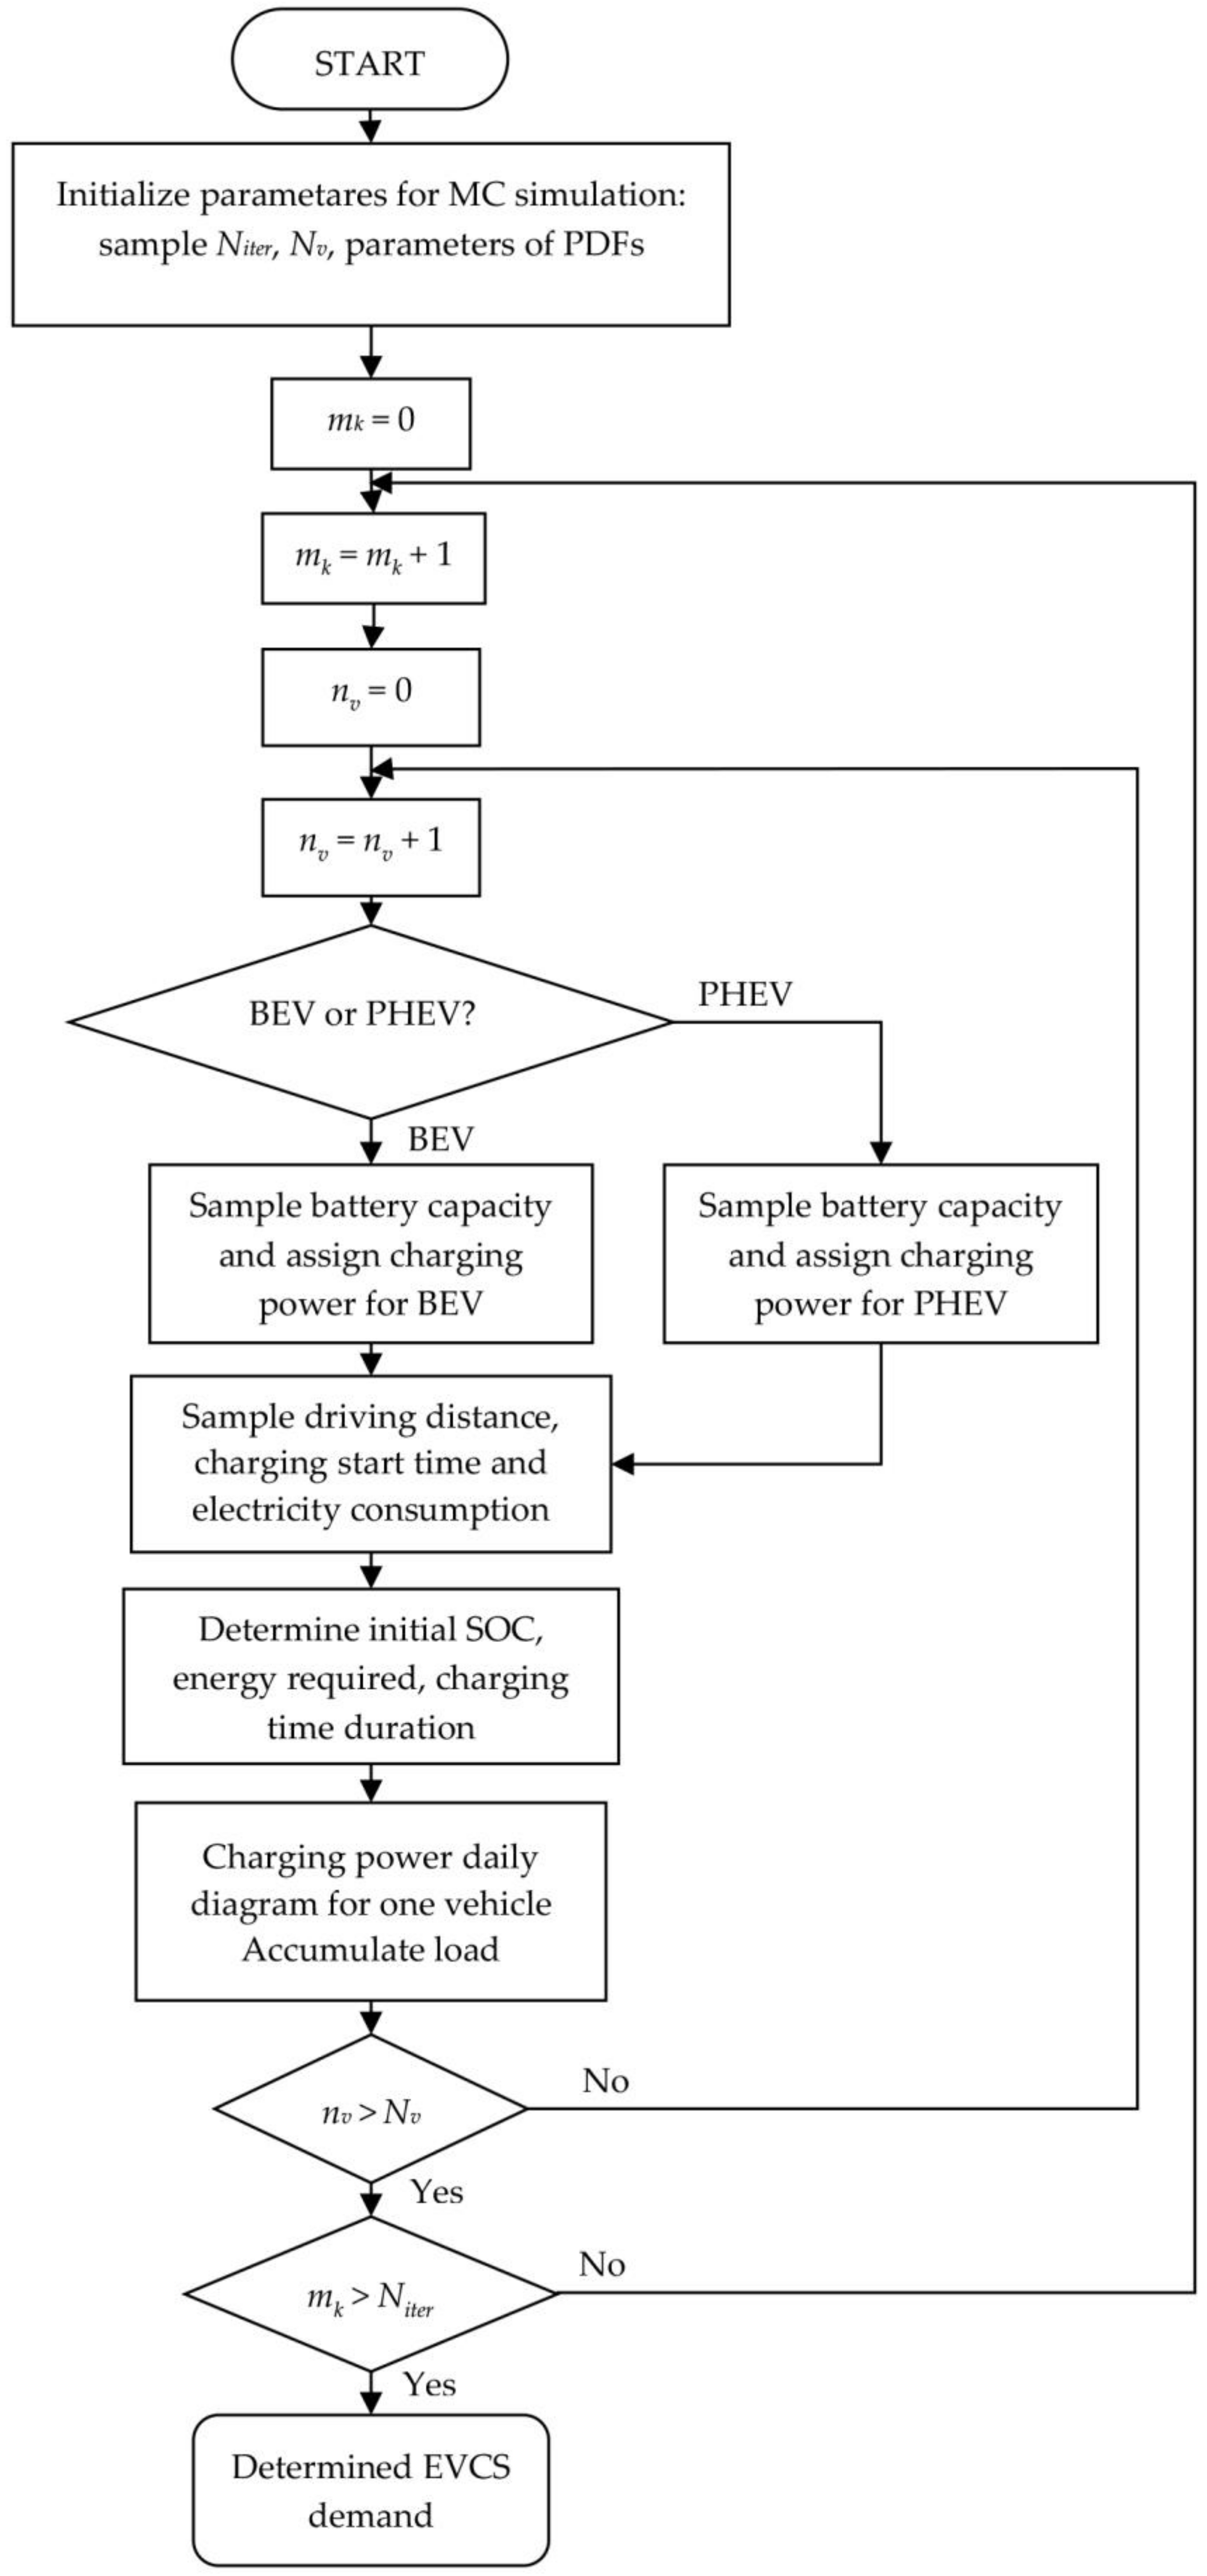
3.2. Sample Generation with Monte Carlo
3.3. Transformer Aging Model
3.4. Transformer Loading with EVCS
3.5. Grey Relational Analysis (GRA)
4. Analysis and Results
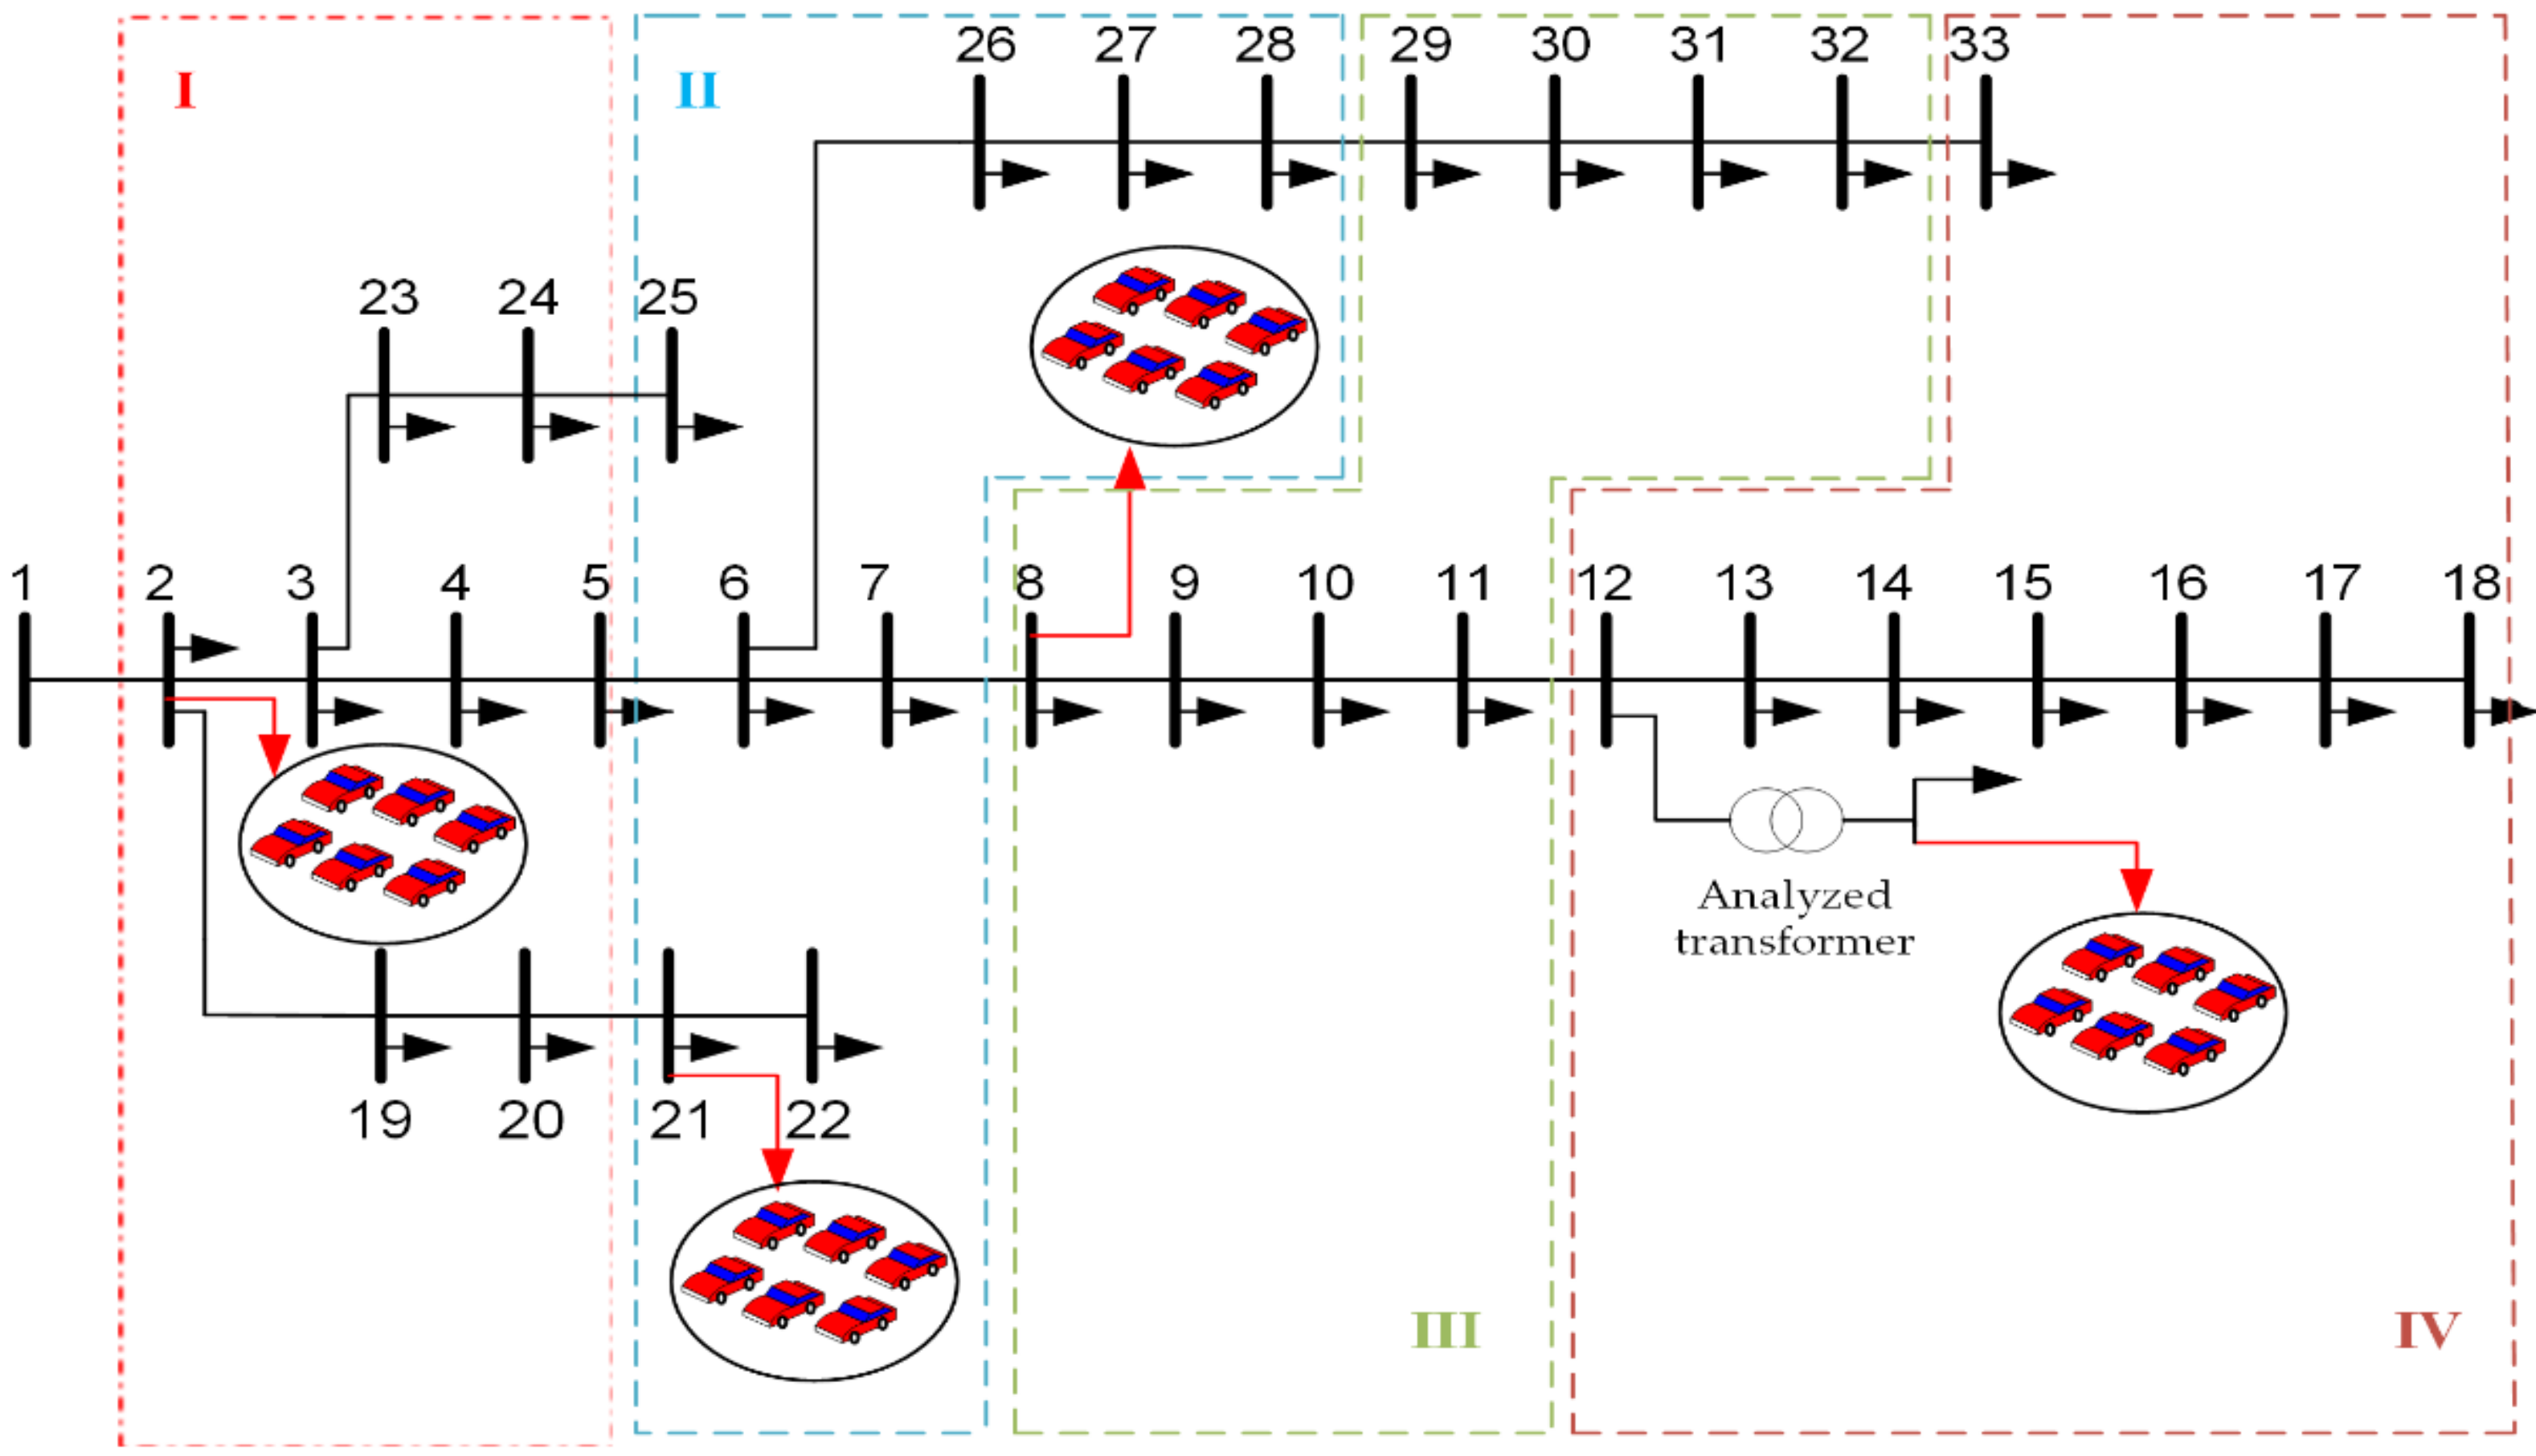
4.1. EVCSs Location Impact of Active Energy Losses
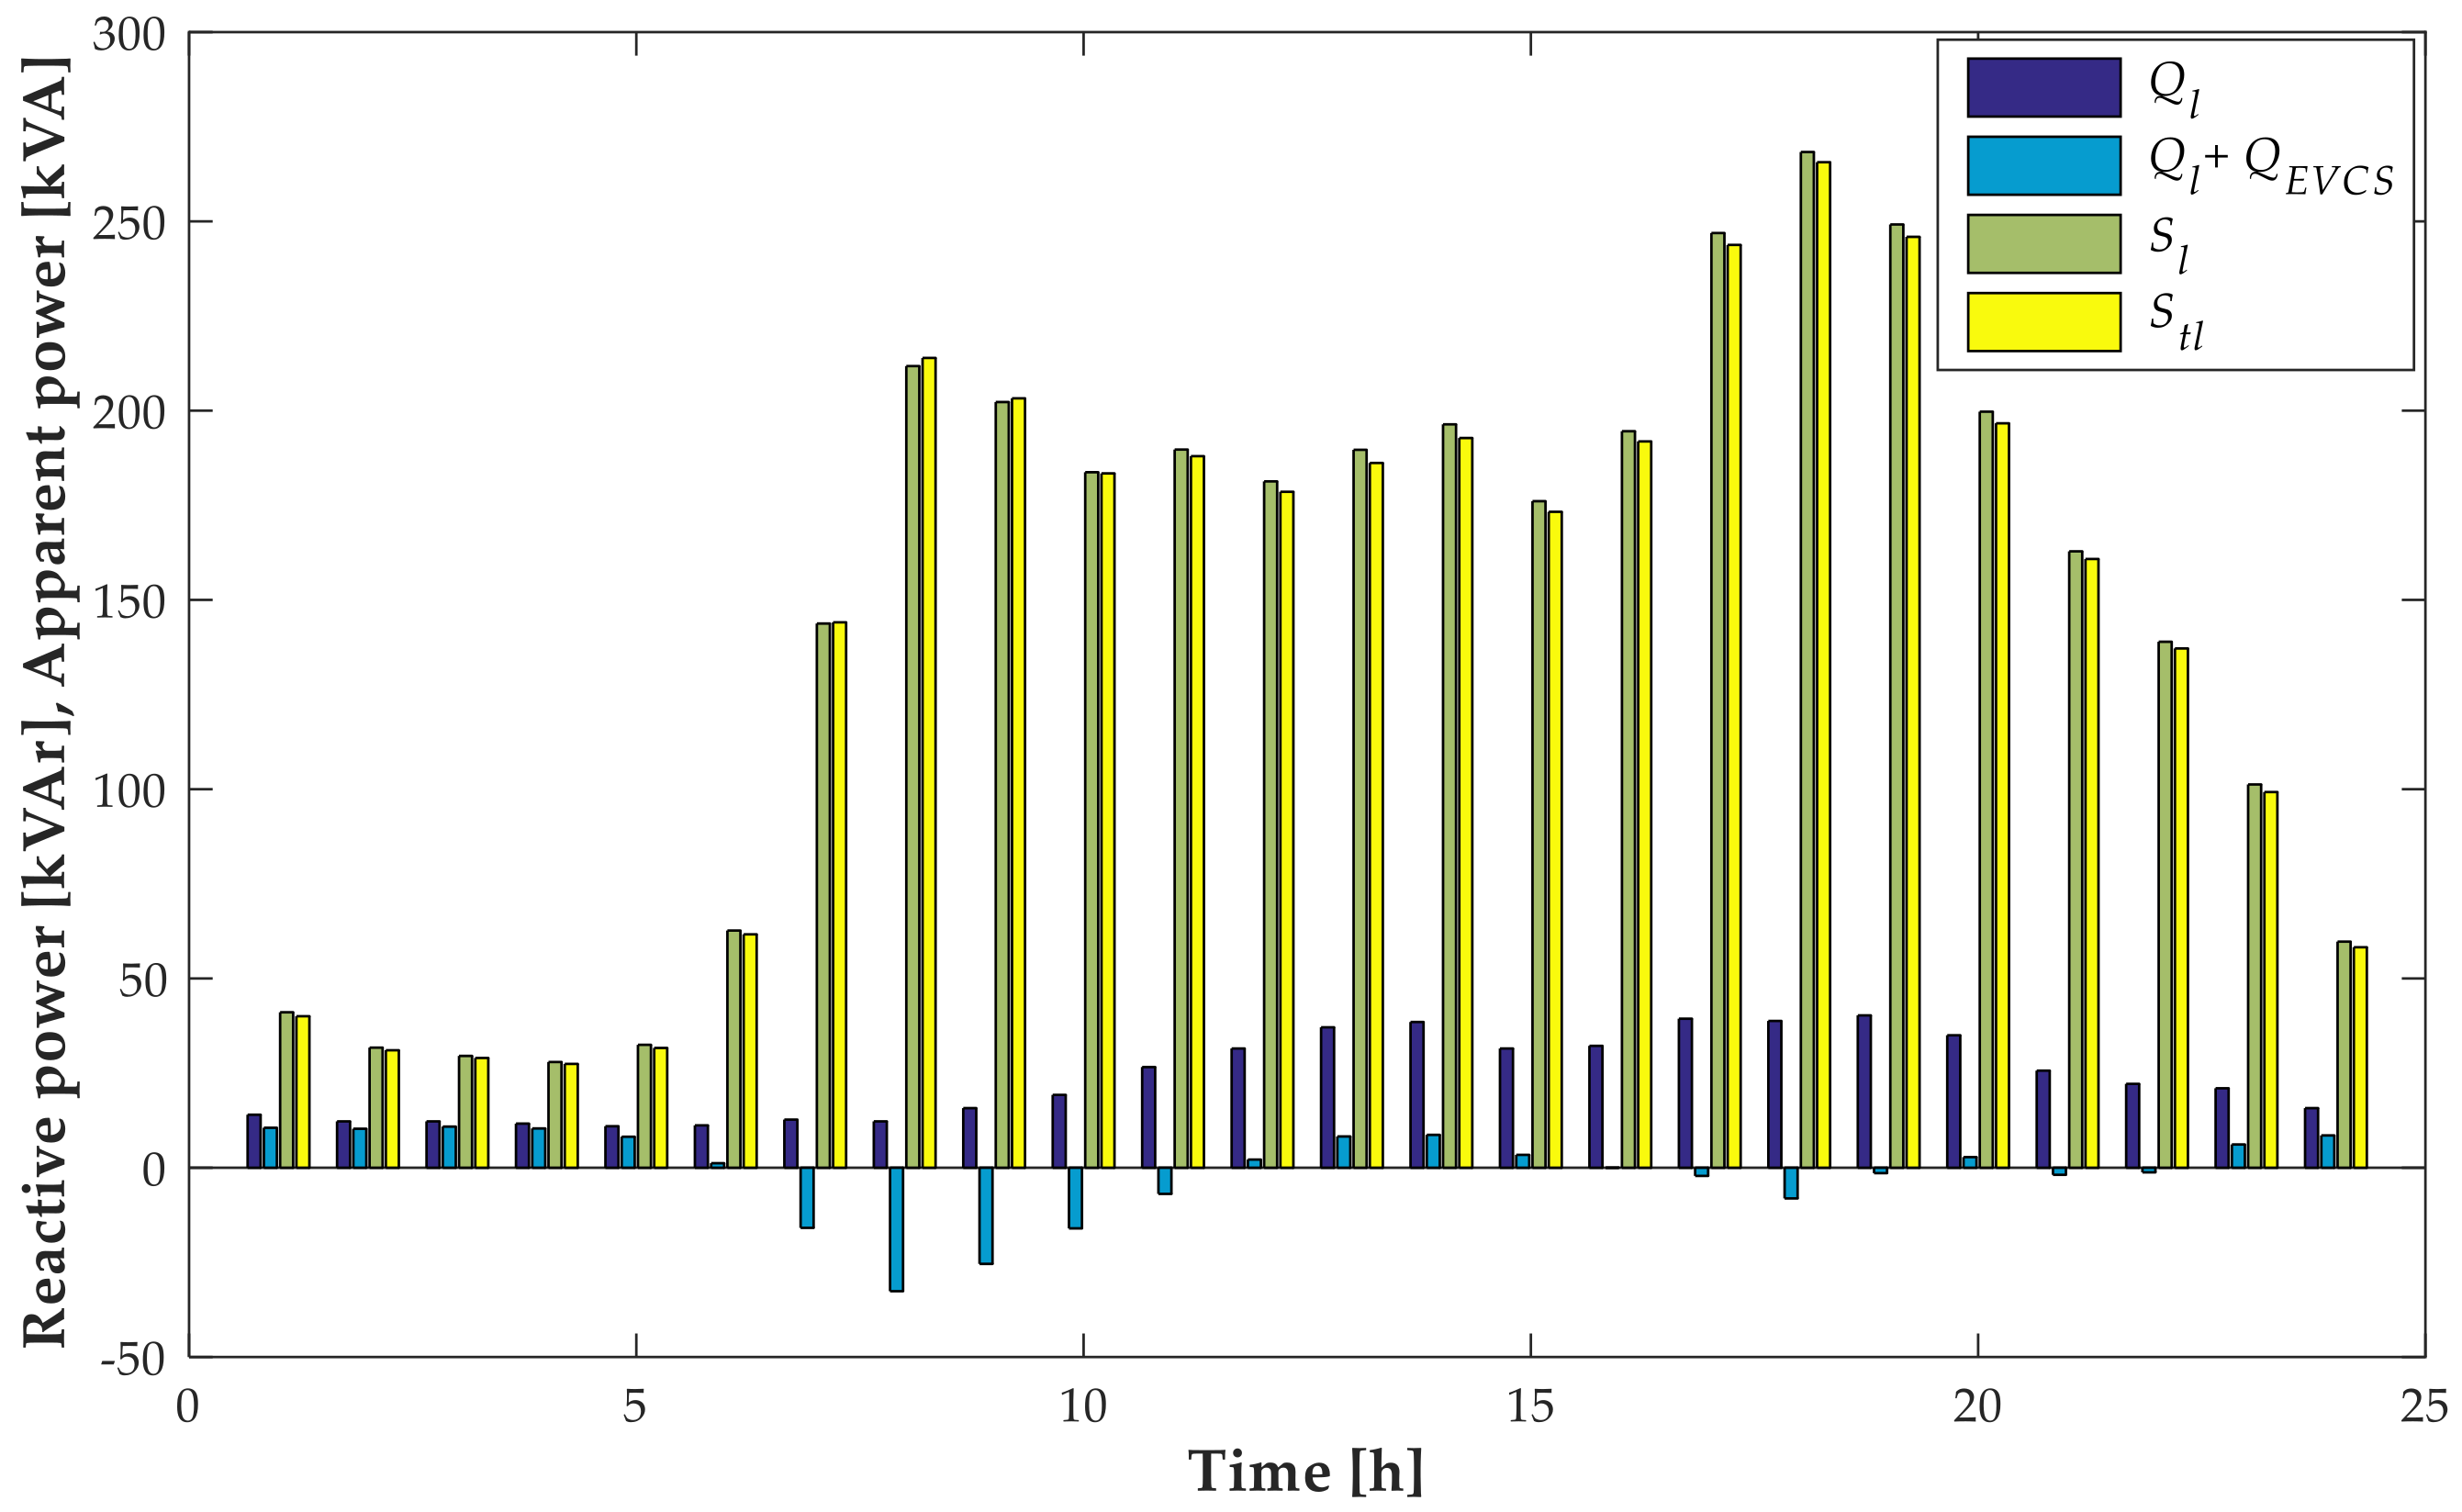
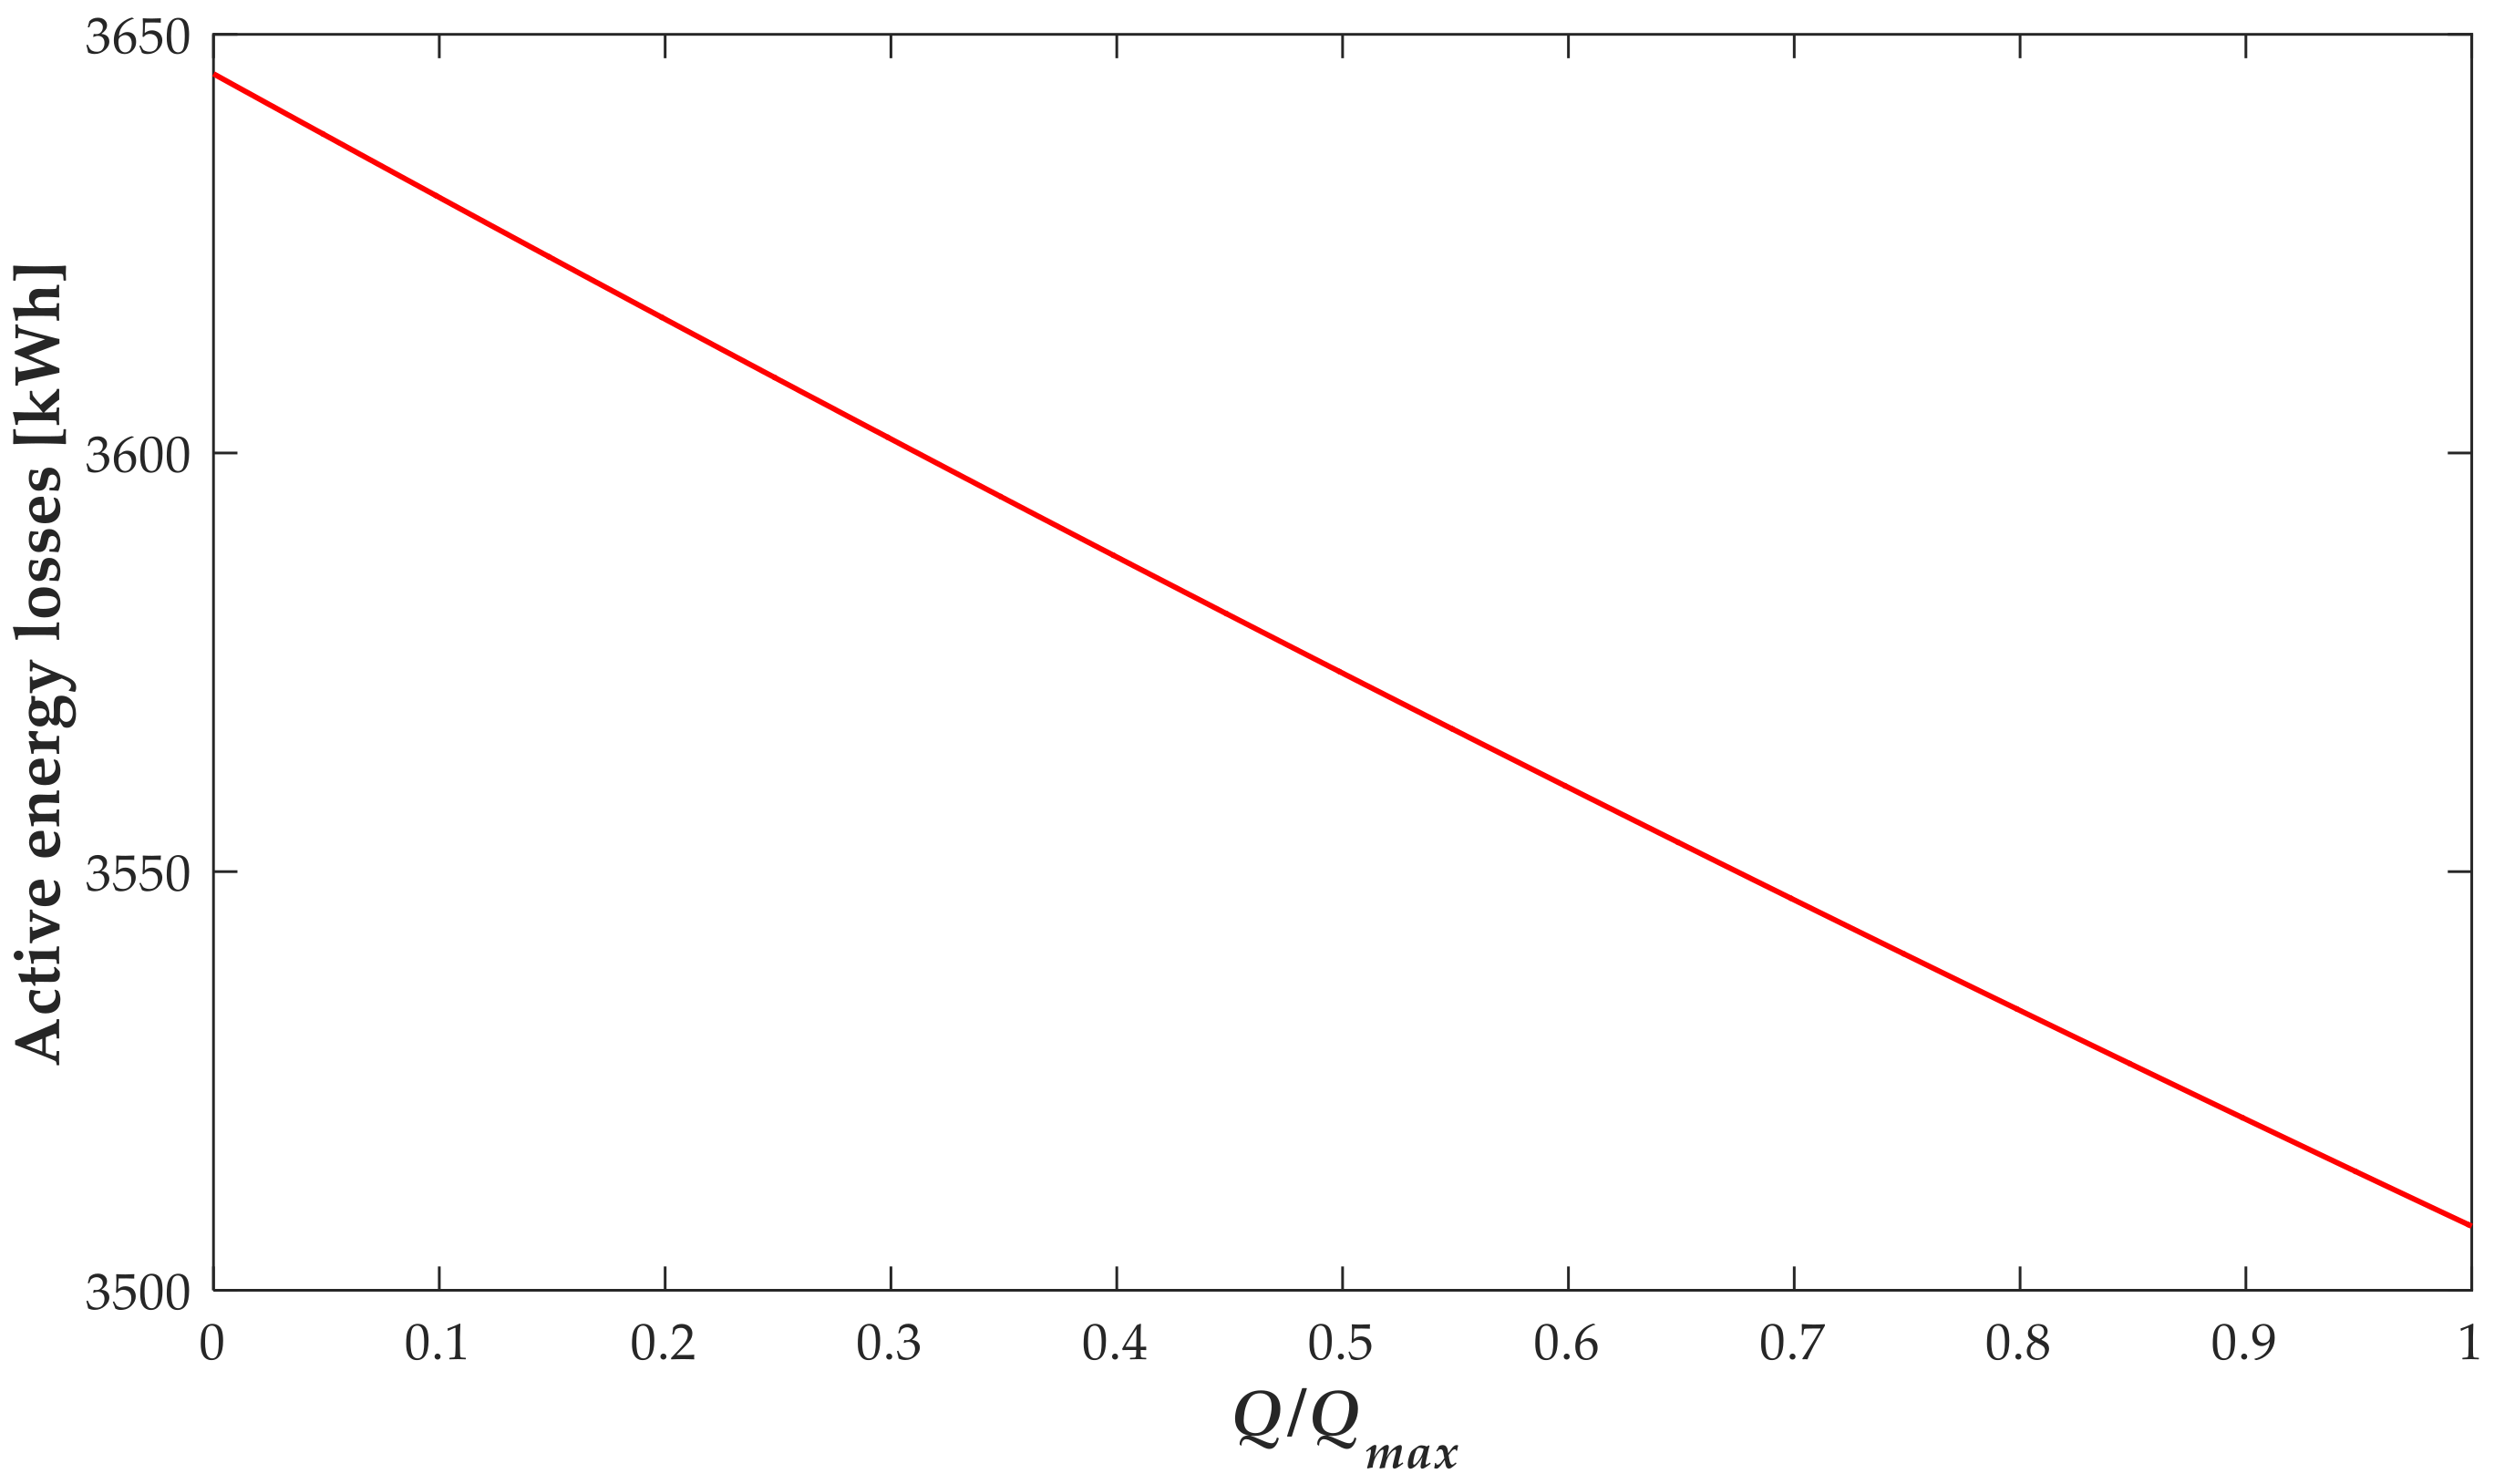
4.2. Impact of Reactive Power from EVCSs on Energy Losses
4.3. Impact of Reactive Power from EVCS on Transformer Aging
5. Conclusions
Author Contributions
Funding
Acknowledgments
Conflicts of Interest
References
- Communication from the Commision to the European Parliment, the Council, the European Economic Social Committee a 7nd the Committee of the Regions—A Roadmap for Moving to a Competitive Low Carbon Economy in 2050. 2011. Available online: https://eravisions.archiv.zsi.at/stocktaking/7.html (accessed on 20 September 2022).
- Alame, D.; Azzouz, M.; Kar, N. Assessing and Mitigating Impacts of Electric Vehicle Harmonic Currents on Distribution Systems. Energies 2020, 13, 3257. [Google Scholar] [CrossRef]
- Khalid, M.S.; Lin, X.; Zhuo, Y.; Kumar, R.; Rafique, M.K. Impact of Energy Management of Electric Vehicles on Transient Voltage Stability of Microgrid. World Electr. Veh. J. 2015, 7, 577–588. [Google Scholar] [CrossRef]
- Gao, Y. Assessment of Future Adaptability of Distribution Transformer Population under EV Scenarios; Univeristy of Manchester: Manchester, UK, 2016. [Google Scholar]
- Thermal Performance of Transformers. Available online: https://e-cigre.org/publication/ELT_246_4-thermal-performance-of-transformers (accessed on 7 September 2022).
- Soleimani, M.; Affonso, C.M.; Kezunovic, M. Transformer Loss of Life Mitigation in the Presence of Energy Storage and PV Generation. In Proceedings of the 2019 IEEE PES Innovative Smart Grid Technologies Europe (ISGT-Europe)), Bucharest, Romania, 29 September–2 October 2019; pp. 1–5. [Google Scholar]
- Hong, S.-K.; Lee, S.G.; Kim, M. Assessment and Mitigation of Electric Vehicle Charging Demand Impact to Transformer Aging for an Apartment Complex. Energies 2020, 13, 2571. [Google Scholar] [CrossRef]
- Affonso, C.d.M.; Kezunovic, M. Technical and Economic Impact of PV-BESS Charging Station on Transformer Life: A Case Study. IEEE Trans. Smart Grid 2019, 10, 4683–4692. [Google Scholar] [CrossRef]
- Sanchez, A.; Romero, A.; Rattá, G.; Rivera, S. Smart Charging of PEVs to Reduce the Power Transformer Loss of Life. In Proceedings of the 2017 IEEE PES Innovative Smart Grid Technologies Conference—Latin America (ISGT Latin America), Quito, Ecuador, 20–22 September 2017; pp. 1–6. [Google Scholar]
- Konstantinidis, G.; Karapidakis, E.; Paspatis, A. Mitigating the Impact of an Official PEV Charger Deployment Plan on an Urban Grid. Energies 2022, 15, 1321. [Google Scholar] [CrossRef]
- Smith, T.; Garcia, J.; Washington, G. Novel PEV Charging Approaches for Extending Transformer Life. Energies 2022, 15, 4454. [Google Scholar] [CrossRef]
- Hilshey, A.D.; Hines, P.D.H.; Rezaei, P.; Dowds, J.R. Estimating the Impact of Electric Vehicle Smart Charging on Distribution Transformer Aging. IEEE Trans. Smart Grid 2013, 4, 905–913. [Google Scholar] [CrossRef]
- Paterakis, N.; Pappi, I.; Erdinc, O.; Godina, R.; Rodrigues, E.; Catalão, J. Consideration of the Impacts of a Smart Neighborhood Load on Transformer Aging. IEEE Trans. Smart Grid 2015, 76, 2793–2802. [Google Scholar] [CrossRef]
- Aravinthan, V.; Jewell, W. Controlled Electric Vehicle Charging for Mitigating Impacts on Distribution Assets. IEEE Trans. Smart Grid 2015, 6, 999–1009. [Google Scholar] [CrossRef]
- Leemput, N.; Geth, F.; Van Roy, J.; Büscher, J.; Driesen, J. Reactive Power Support in Residential LV Distribution Grids through Electric Vehicle Charging. Sustain. Energy Grids Netw. 2015, 3, 24–35. [Google Scholar] [CrossRef]
- Gao, X.; De Carne, G.; Langwasser, M.; Liserre, M. Online Load Control in Medium Voltage Grid by Means of Reactive Power Modification of Fast Charging Station. In Proceedings of the 2019 IEEE Milan PowerTech, Milan, Italy, 23–27 June 2019; pp. 1–6. [Google Scholar]
- Wu, C.; Mohsenian-Rad, H.; Huang, J. PEV-Based Reactive Power Compensation for Wind DG Units: A Stackelberg Game Approach. In Proceedings of the 2012 IEEE Third International Conference on Smart Grid Communications (SmartGridComm), 5–8 November 2012; pp. 504–509. [Google Scholar]
- Mojdehi, M.N.; Ghosh, P. Modeling and Revenue Estimation of EV as Reactive Power Service Provider. In Proceedings of the 2014 IEEE PES General Meeting|Conference & Exposition, National Harbor, MD, USA, 27–31 July 2014; pp. 1–5. [Google Scholar]
- Injeti, S.K.; Thunuguntla, V.K. Optimal Integration of DGs into Radial Distribution Network in the Presence of Plug-in Electric Vehicles to Minimize Daily Active Power Losses and to Improve the Voltage Profile of the System Using Bio-Inspired Optimization Algorithms. Prot. Control Mod. Power Syst. 2020, 5, 3. [Google Scholar] [CrossRef]
- Jamian, J.J.; Mustafa, M.W.; Mokhlis, H.; Baharudin, M.A. Minimization of Power Losses in Distribution System via Sequential Placement of Distributed Generation and Charging Station. Arab. J. Sci. Eng. 2014, 39, 3023–3031. [Google Scholar] [CrossRef]
- Chippada, D.; Reddy, M.D. Optimal Planning of Electric Vehicle Charging Station along with Multiple Distributed Generator Units. IJISA 2022, 14, 40–53. [Google Scholar] [CrossRef]
- Dharavat, N.; Sudabattula, S.K.; Velamuri, S. Integration of Distributed Generation and Electric Vehicles in a Distribution Network Using Political Optimizer. In Proceedings of the 2021 4th International Conference on Recent Developments in Control, Automation & Power Engineering (RDCAPE), Noida, India, 7–8 October 2021; pp. 521–525. [Google Scholar]
- Velamuri, S.; Cherukuri, S.H.C.; Sudabattula, S.K.; Prabaharan, N.; Hossain, E. Combined Approach for Power Loss Minimization in Distribution Networks in the Presence of Gridable Electric Vehicles and Dispersed Generation. IEEE Syst. J. 2022, 16, 3284–3295. [Google Scholar] [CrossRef]
- Chang, R.-F.; Chang, Y.-C.; Lu, C.-N. Loss Minimization of Distribution Systems with Electric Vehicles by Network Reconfiguration. In Proceedings of the 2012 International Conference on Control Engineering and Communication Technology, Shenyang, China, 7–9 December 2012; pp. 551–555. [Google Scholar]
- Wang, J.; Wang, W.; Wang, H.; Zuo, H. Dynamic Reconfiguration of Multiobjective Distribution Networks Considering DG and EVs Based on a Novel LDBAS Algorithm. IEEE Access 2020, 8, 216873–216893. [Google Scholar] [CrossRef]
- Reddy, M.S.K.; Selvajyothi, K. Optimal Placement of Electric Vehicle Charging Stations in Radial Distribution System along with Reconfiguration. In Proceedings of the 2019 IEEE 1st International Conference on Energy, Systems and Information Processing (ICESIP), Chennai, India, 4–6 July 2019; pp. 1–6. [Google Scholar]
- Melo, D.F.R.; Leguizamon, W.; Massier, T.; Beng Gooi, H. Optimal Distribution Feeder Reconfiguration for Integration of Electric Vehicles. In Proceedings of the 2017 IEEE PES Innovative Smart Grid Technologies Conference—Latin America (ISGT Latin America), Quito, Ecuador, 20–22 September 2017; pp. 1–6. [Google Scholar]
- Reddy, M.S.K.; Panigrahy, A.K.; Selvajyothi, K. Minimization of Electric Vehicle Charging Stations Influence on Unbalanced Radial Distribution System with Optimal Reconfiguration Using Particle Swarm Optimization. In Proceedings of the 2021 International Conference on Sustainable Energy and Future Electric Transportation (SEFET), Hyderabad, India, 21–23 January 2021; pp. 1–6. [Google Scholar]
- Wang, C.; Dunn, R.; Lian, B. Power Loss Reduction for Electric Vehicle Penetration with Embedded Energy Storage in Distribution Networks. In Proceedings of the 2014 IEEE International Energy Conference (ENERGYCON), Cavtat, Croatia, 13–16 May 2014; pp. 1417–1424. [Google Scholar]
- Yang, Y.; Zhang, W.; Jiang, J.; Huang, M.; Niu, L. Optimal Scheduling of a Battery Energy Storage System with Electric Vehicles’ Auxiliary for a Distribution Network with Renewable Energy Integration. Energies 2015, 8, 10718–10735. [Google Scholar] [CrossRef]
- Acha, S.; Green, T.C.; Shah, N. Effects of Optimised Plug-in Hybrid Vehicle Charging Strategies on Electric Distribution Network Losses. In Proceedings of the IEEE PES T&D 2010, New Orleans, LA, USA, 19–22 April 2010; pp. 1–6. [Google Scholar]
- Sortomme, E.; Hindi, M.M.; MacPherson, S.D.J.; Venkata, S.S. Coordinated Charging of Plug-In Hybrid Electric Vehicles to Minimize Distribution System Losses. IEEE Trans. Smart Grid 2011, 2, 198–205. [Google Scholar] [CrossRef]
- Sinha, R.; Moldes, E.; Zaidi, A.; Mahat, P.; Pillai, J.; Hansen, P. An Electric Vehicle Charging Management and Its Impact on Losses. In Proceedings of the IEEE PES ISGT Europe 2013, Lyngby, Denmark, 6–9 October 2013; pp. 1–5. [Google Scholar]
- Nafisi, H.; Agah, S.M.M.; Askarian Abyaneh, H.; Abedi, M. Two-Stage Optimization Method for Energy Loss Minimization in Microgrid Based on Smart Power Management Scheme of PHEVs. IEEE Trans. Smart Grid 2016, 7, 1268–1276. [Google Scholar] [CrossRef]
- Rajesh, P.; Shajin, F.H. Optimal Allocation of EV Charging Spots and Capacitors in Distribution Network Improving Voltage and Power Loss by Quantum-Behaved and Gaussian Mutational Dragonfly Algorithm (QGDA). Electr. Power Syst. Res. 2021, 194, 107049. [Google Scholar] [CrossRef]
- Suresh, V.; Sudabattula, S.; Cherukuri, S.H.C. Coordinated Power Loss Minimization Technique for Distribution Systems in the Presence of Electric Vehicles. In Proceedings of the 2019 National Power Electronics Conference (NPEC), Tiruchirappalli, India, 13–15 December 2019; pp. 1–5. [Google Scholar]
- IEEE SA—IEEE C57.91-2011. Available online: https://standards.ieee.org/ieee/C57.91/5297/ (accessed on 10 August 2022).
- Waseem, M.; Sajjad, I.A.; Haroon, S.S.; Amin, S.; Farooq, H.; Martirano, L.; Napoli, R. Electrical Demand and Its Flexibility in Different Energy Sectors. Electr. Power Compon. Syst. 2020, 48, 1339–1361. [Google Scholar] [CrossRef]
- Abdelaziz, A.Y.; Hegazy, Y.G.; El-Khattam, W.; Othman, M.M. A Multi-Objective Optimization for Sizing and Placement of Voltage-Controlled Distributed Generation Using Supervised Big Bang–Big Crunch Method. Electr. Power Compon. Syst. 2015, 43, 105–117. [Google Scholar] [CrossRef]
- Mo, T.; Li, Y.; Lau, K.-t.; Poon, C.; Wu, Y.; Luo, Y. Trends and Emerging Technologies for the Development of Electric Vehicles. Energies 2022, 15, 6271. [Google Scholar] [CrossRef]
- Ravi, S.; Aziz, M. Utilization of Electric Vehicles for Vehicle-to-Grid Services: Progress and Perspectives. Energies 2022, 15, 589. [Google Scholar] [CrossRef]
- Germanà, R.; Liberati, F.; De Santis, E.; Giuseppi, A.; Delli Priscoli, F.; Di Giorgio, A. Optimal Control of Plug-In Electric Vehicles Charging for Composition of Frequency Regulation Services. Energies 2021, 14, 7879. [Google Scholar] [CrossRef]
- Neofytou, N.; Blazakis, K.; Katsigiannis, Y.; Stavrakakis, G. Modeling Vehicles to Grid as a Source of Distributed Frequency Regulation in Isolated Grids with Significant RES Penetration. Energies 2019, 12, 720. [Google Scholar] [CrossRef]
- Lan, T.; Jermsittiparsert, K.; Alrashood, S.T.; Rezaei, M.; Al-Ghussain, L.; Mohamed, M.A. An Advanced Machine Learning Based Energy Management of Renewable Microgrids Considering Hybrid Electric Vehicles’ Charging Demand. Energies 2021, 14, 569. [Google Scholar] [CrossRef]
- Aziz, M.; Oda, T.; Mitani, T.; Watanabe, Y.; Kashiwagi, T. Utilization of Electric Vehicles and Their Used Batteries for Peak-Load Shifting. Energies 2015, 8, 3720–3738. [Google Scholar] [CrossRef]
- Tovilović, D.M.; Rajaković, N.L.J. The Simultaneous Impact of Photovoltaic Systems and Plug-in Electric Vehicles on the Daily Load and Voltage Profiles and the Harmonic Voltage Distortions in Urban Distribution Systems. Renew. Energy 2015, 76, 454–464. [Google Scholar] [CrossRef]
- Deilami, S.; Masoum, A.; Moses, P.; Masoum, M. Real-Time Coordination of Plug-In Electric Vehicle Charging in Smart Grids to Minimize Power Losses and Improve Voltage Profile. Smart Grid. IEEE Trans. Smart Grid 2011, 2, 456–467. [Google Scholar] [CrossRef]
- Khatiri-Doost, S.; Amirahmadi, M. Peak Shaving and Power Losses Minimization by Coordination of Plug-in Electric Vehicles Charging and Discharging in Smart Grids. In Proceedings of the 2017 IEEE International Conference on Environment and Electrical Engineering and 2017 IEEE Industrial and Commercial Power Systems Europe (EEEIC/I&CPS Europe), Milan, Italy, 6–9 June 2017; pp. 1–5. [Google Scholar]
- Wang, J.; Bharati, G.R.; Paudyal, S.; Ceylan, O.; Bhattarai, B.P.; Myers, K.S. Coordinated Electric Vehicle Charging With Reactive Power Support to Distribution Grids. IEEE Trans. Ind. Inf. 2019, 15, 54–63. [Google Scholar] [CrossRef]
- Kisacikoglu, M.C. Vehicle-to-Grid (V2G) Reactive Power Operation Analysis of the EV/PHEV Bidirectional Battery Charger; Univeristy of Tennessee: Knoxville, TN, USA, 2013. [Google Scholar]
- IEEE Standards 519-1992; IEEE Recommended Practices and Requirements for Harmonic Control in Electrical Power Systems. InSMute of Elmeal and Ehxtronics Engineers, Inc.: New York, NY, USA, 1993; pp. 1–112. [CrossRef]
- IEEE Standards 1547-2003; IEEE Standard for Interconnecting Distributed Resources with Electric Power Systems. InSMute of Elmeal and Ehxtronics Engineers, Inc.: New York, NY, USA, 2003; pp. 1–28. [CrossRef]
- Xu, D.; Pei, W.; Zhang, Q. Optimal Planning of Electric Vehicle Charging Stations Considering User Satisfaction and Charging Convenience. Energies 2022, 15, 5027. [Google Scholar] [CrossRef]
- Campaña, M.; Inga, E.; Cárdenas, J. Optimal Sizing of Electric Vehicle Charging Stations Considering Urban Traffic Flow for Smart Cities. Energies 2021, 14, 4933. [Google Scholar] [CrossRef]
- Baik, S.H.; Jin, Y.G.; Yoon, Y.T. Determining Equipment Capacity of Electric Vehicle Charging Station Operator for Profit Maximization. Energies 2018, 11, 2301. [Google Scholar] [CrossRef]
- Flammini, M.G.; Prettico, G.; Julea, A.; Fulli, G.; Mazza, A.; Chicco, G. Statistical Characterisation of the Real Transaction Data Gathered from Electric Vehicle Charging Stations. Electr. Power Syst. Res. 2019, 166, 136–150. [Google Scholar] [CrossRef]
- Sanna, L. Driving the Solution the Plug-in Hybrid Electric Vehicle. EPRI J. 2005, 1, 8–17. [Google Scholar]
- Mohamed, A.; Salehi, V.; Ma, T.; Mohammed, O. Real-Time Energy Management Algorithm for Plug-In Hybrid Electric Vehicle Charging Parks Involving Sustainable Energy. IEEE Trans. Sustain. Energy 2014, 5, 577–586. [Google Scholar] [CrossRef]
- EV-Volumes—The Electric Vehicle World Sales Database. Available online: https://www.ev-volumes.com/ (accessed on 10 August 2022).
- Worldwide Electric Vehicle Sales by Model. 2021. Available online: https://www.statista.com/statistics/960121/sales-of-all-electric-vehicles-worldwide-by-model/ (accessed on 10 August 2022).
- Grunditz, E.A.; Thiringer, T. Performance Analysis of Current BEVs Based on a Comprehensive Review of Specifications. IEEE Trans. Transp. Electrif. 2016, 2, 270–289. [Google Scholar] [CrossRef]
- De Freige, M.; Ross, M.; Joos, G.; Dubois, M. Power & Energy Ratings Optimization in a Fast-Charging Station for PHEV Batteries. In Proceedings of the 2011 IEEE International Electric Machines & Drives Conference (IEMDC), Niagara Falls, ON, Canada, 15–18 May 2011; pp. 486–489. [Google Scholar]
- Kawambwa, S.; Mwifunyi, R.; Mnyanghwalo, D.; Hamisi, N.; Kalinga, E.; Mvungi, N. An Improved Backward/Forward Sweep Power Flow Method Based on Network Tree Depth for Radial Distribution Systems. J. Electr. Syst. Inf. Technol. 2021, 8, 7. [Google Scholar] [CrossRef]
- Ghosh, S.; Das, D. Method of Load Flow Solution of Radial Distribution Network. Gener. Transm. Distrib. IEE Proc. 1999, 146, 641–648. [Google Scholar] [CrossRef]
- Rizwan, M.; Waseem, M.; Liaqat, R.; Sajjad, I.A.; Dampage, U.; Salmen, S.H.; Obaid, S.A.; Mohamed, M.A.; Annuk, A. SPSO Based Optimal Integration of DGs in Local Distribution Systems under Extreme Load Growth for Smart Cities. Electronics 2021, 10, 2542. [Google Scholar] [CrossRef]
- Waseem, M.; Lin, Z.; Liu, S.; Zhang, Z.; Aziz, T.; Khan, D. Fuzzy Compromised Solution-Based Novel Home Appliances Scheduling and Demand Response with Optimal Dispatch of Distributed Energy Resources. Appl. Energy 2021, 290, 116761. [Google Scholar] [CrossRef]
- Waseem, M.; Lin, Z.; Liu, S.; Sajjad, I.A.; Aziz, T. Optimal GWCSO-Based Home Appliances Scheduling for Demand Response Considering End-Users Comfort. Electr. Power Syst. Res. 2020, 187, 106477. [Google Scholar] [CrossRef]
- Abdmouleh, Z.; Gastli, A.; Ben-Brahim, L.; Haouari, M.; Al-Emadi, N.A. Review of Optimization Techniques Applied for the Integration of Distributed Generation from Renewable Energy Sources. Renew. Energy 2017, 113, 266–280. [Google Scholar] [CrossRef]
- Smart City—INVEST IN PODGORICA. Available online: http://investinpodgorica.me/?page_id=1040 (accessed on 18 September 2022).
- Rubinstein, R.Y.; Kroese, D.P. Simulation and the Monte Carlo Method, 3rd ed.; Wiley Series in Probability and Statistics; John Wiley & Sons, Inc.: Hoboken, NJ, USA, 2017; ISBN 978-1-118-63220-8. [Google Scholar]
- Malekpoor, H.; Chalvatzis, K.; Mishra, N.; Mehlawat, M.K.; Zafirakis, D.; Song, M. Integrated Grey Relational Analysis and Multi Objective Grey Linear Programming for Sustainable Electricity Generation Planning. Ann. Oper. Res. 2018, 269, 475–503. [Google Scholar] [CrossRef]
- Durković, V.; Savić, A.S. ATC Enhancement Using TCSC Device Regarding Uncertainty of Realization One of Two Simultaneous Transactions. Int. J. Electr. Power Energy Syst. 2020, 115, 105497. [Google Scholar] [CrossRef]
- Xu, G.; Yang, Y.; Lu, S.; Li, L.; Song, X. Comprehensive Evaluation of Coal-Fired Power Plants Based on Grey Relational Analysis and Analytic Hierarchy Process. Energy Policy 2011, 39, 2343–2351. [Google Scholar] [CrossRef]
- Liu, G.; Baniyounes, A.; Rasul, M.; Than Oo, A.; Khan, M.M. General Sustainability Indicator of Renewable Energy System Based on Grey Relational Analysis. Int. J. Energy Res. 2013, 37, 1928–1936. [Google Scholar] [CrossRef]
- Dharageshwari, K.; Nayanatara, C. Multiobjective Optimal Placement of Multiple Distributed Generations in IEEE 33 Bus Radial System Using Simulated Annealing. In Proceedings of the 2015 International Conference on Circuits, Power and Computing Technologies [ICCPCT-2015], Nagercoil, India, 19–20 March 2015; pp. 1–7. [Google Scholar]
- Karadimos, D.I.; Karafoulidis, A.D.; Doukas, D.I.; Gkaidatzis, P.A.; Labridis, D.P.; Marinopoulos, A.G. Techno-Economic Analysis for Optimal Energy Storage Systems Placement Considering Stacked Grid Services. In Proceedings of the 2017 14th International Conference on the European Energy Market (EEM), Dresden, Germany, 6–9 June 2017; pp. 1–6. [Google Scholar]
- Chen, C.-S.; Wu, T.-H. Optimal Distribution Transformer Sizing by Dynamic Programming. Int. J. Electr. Power Energy Syst. 1998, 20, 161–167. [Google Scholar] [CrossRef]
- Aravinthan, V.; Argade, S. Optimal Transformer Sizing with the Presence of Electric Vehicle Charging. In Proceedings of the 2014 IEEE PES T&D Conference and Exposition, Chicago, IL, USA, 14–17 April 2014; pp. 1–5. [Google Scholar]


| Bus Type | Bus Numbers |
|---|---|
| Residential | 2, 3, 5, 6, 7, 8, 9, 10, 13‚ 14, 15, 16, 17, 20, 21, 23, 24, 25 |
| Commercial | 4, 11, 12, 18, 19 |
| Industrial buses | 22, 26, 27, 28, 29, 30, 31, 32, 33 |
| Bus Type | Working Day | Weekend |
|---|---|---|
| Number of modes | 4 | 3 |
| Parameter a | 32.80 76.42 4.13 36.12 | 300.71 8.69 6.22 |
| Parameter b | 76.76 33.40 2.34 42.65 | 150.08 9.12 3.05 |
| Weights | 0.23 0.14 0.56 0.08 | 0.02 0.48 0.50 |
| EV Types | BEV | PHEV |
|---|---|---|
| Number of vehicles [%] | 71 | 29 |
| Battery capacity [kWh] | 40–80 | 10–16 |
| Electrical efficiency [kWh/mile] | 0.25–0.40 | 0.25–0.40 |
| Parameters | Without PEV Load | With Public Charging Stations | |
|---|---|---|---|
| Best Case | Worst Case | ||
| Location of charging station | - | 2, 19, 20, 21 | 15, 16, 17, 18 |
| Daily active power demand [kWh] | 62,557 | 72,152 | 72,152 |
| Daily active energy loss [kWh] | 2924 | 3008 | 4486 |
| Lowest voltage value in p.u. | 0.9016 (18 h, bus 18) | 0.9012 (18 h, bus 18) | 0.8422 (18 h, bus 18) |
| Parameter | Scenario 1 No Reactive Power Support | Scenario 2 Reactive Power Support |
|---|---|---|
| Location of charging station | 2, 21, 8, 12 | 2, 21, 8, 12 |
| Daily active energy loss [kWh] | 3419.34 | 3320.00 |
| Lowest voltage value in p.u (time and number of bus) | 0.8889 (18 h, bus 18) | 0.8920 (18 h, bus 18) |
| Q/Qmax | Working Day EV Additional Penetration [%] | Weekend EV Additional Penetration [%] | ||||||||
|---|---|---|---|---|---|---|---|---|---|---|
| 0 | 4 | 7 | 10 | 20 | 0 | 4 | 7 | 10 | 20 | |
| LOL % | LOL % | |||||||||
| 1 | 0.0082 | 0.0129 | 0.0183 | 0.0260 | 0.0831 | 0.0065 | 0.0102 | 0.0142 | 0.0198 | 0.0613 |
| 2/3 | 0.0076 | 0.0119 | 0.0168 | 0.0235 | 0.0728 | 0.0061 | 0.0094 | 0.0130 | 0.0180 | 0.0537 |
| 1/3 | 0.0080 | 0.0124 | 0.0174 | 0.0242 | 0.0740 | 0.0063 | 0.0097 | 0.0133 | 0.0184 | 0.0540 |
| 1/5 | 0.0084 | 0.0131 | 0.0182 | 0.0253 | 0.0771 | 0.0066 | 0.0102 | 0.0139 | 0.0192 | 0.0563 |
| 0 | 0.0094 | 0.0145 | 0.0202 | 0.0282 | 0.0856 | 0.0074 | 0.0112 | 0.0155 | 0.0213 | 0.0623 |
| Q/Qmax | Working Day EV Additional Penetration [%] | Weekend EV Additional Penetration [%] | ||||||||
|---|---|---|---|---|---|---|---|---|---|---|
| 0 | 20 | 40 | 50 | 60 | 0 | 20 | 40 | 50 | 60 | |
| LOL % | LOL % | |||||||||
| 1 | 0 | 0.0024 | 0.0148 | 0.0379 | 0.0977 | 0 | 0.0020 | 0.0118 | 0.0294 | 0.0729 |
| 2/3 | 0 | 0.0021 | 0.0127 | 0.0316 | 0.0787 | 0 | 0.0018 | 0.0101 | 0.0244 | 0.0591 |
| 1/3 | 0 | 0.0022 | 0.0124 | 0.0305 | 0.0749 | 0 | 0.0018 | 0.0099 | 0.0234 | 0.0559 |
| 1/5 | 0 | 0.0022 | 0.0128 | 0.0313 | 0.0768 | 0 | 0.0019 | 0.0102 | 0.0241 | 0.0572 |
| 0 | 0 | 0.0024 | 0.0139 | 0.0341 | 0.0835 | 0 | 0.0020 | 0.0110 | 0.0261 | 0.0620 |
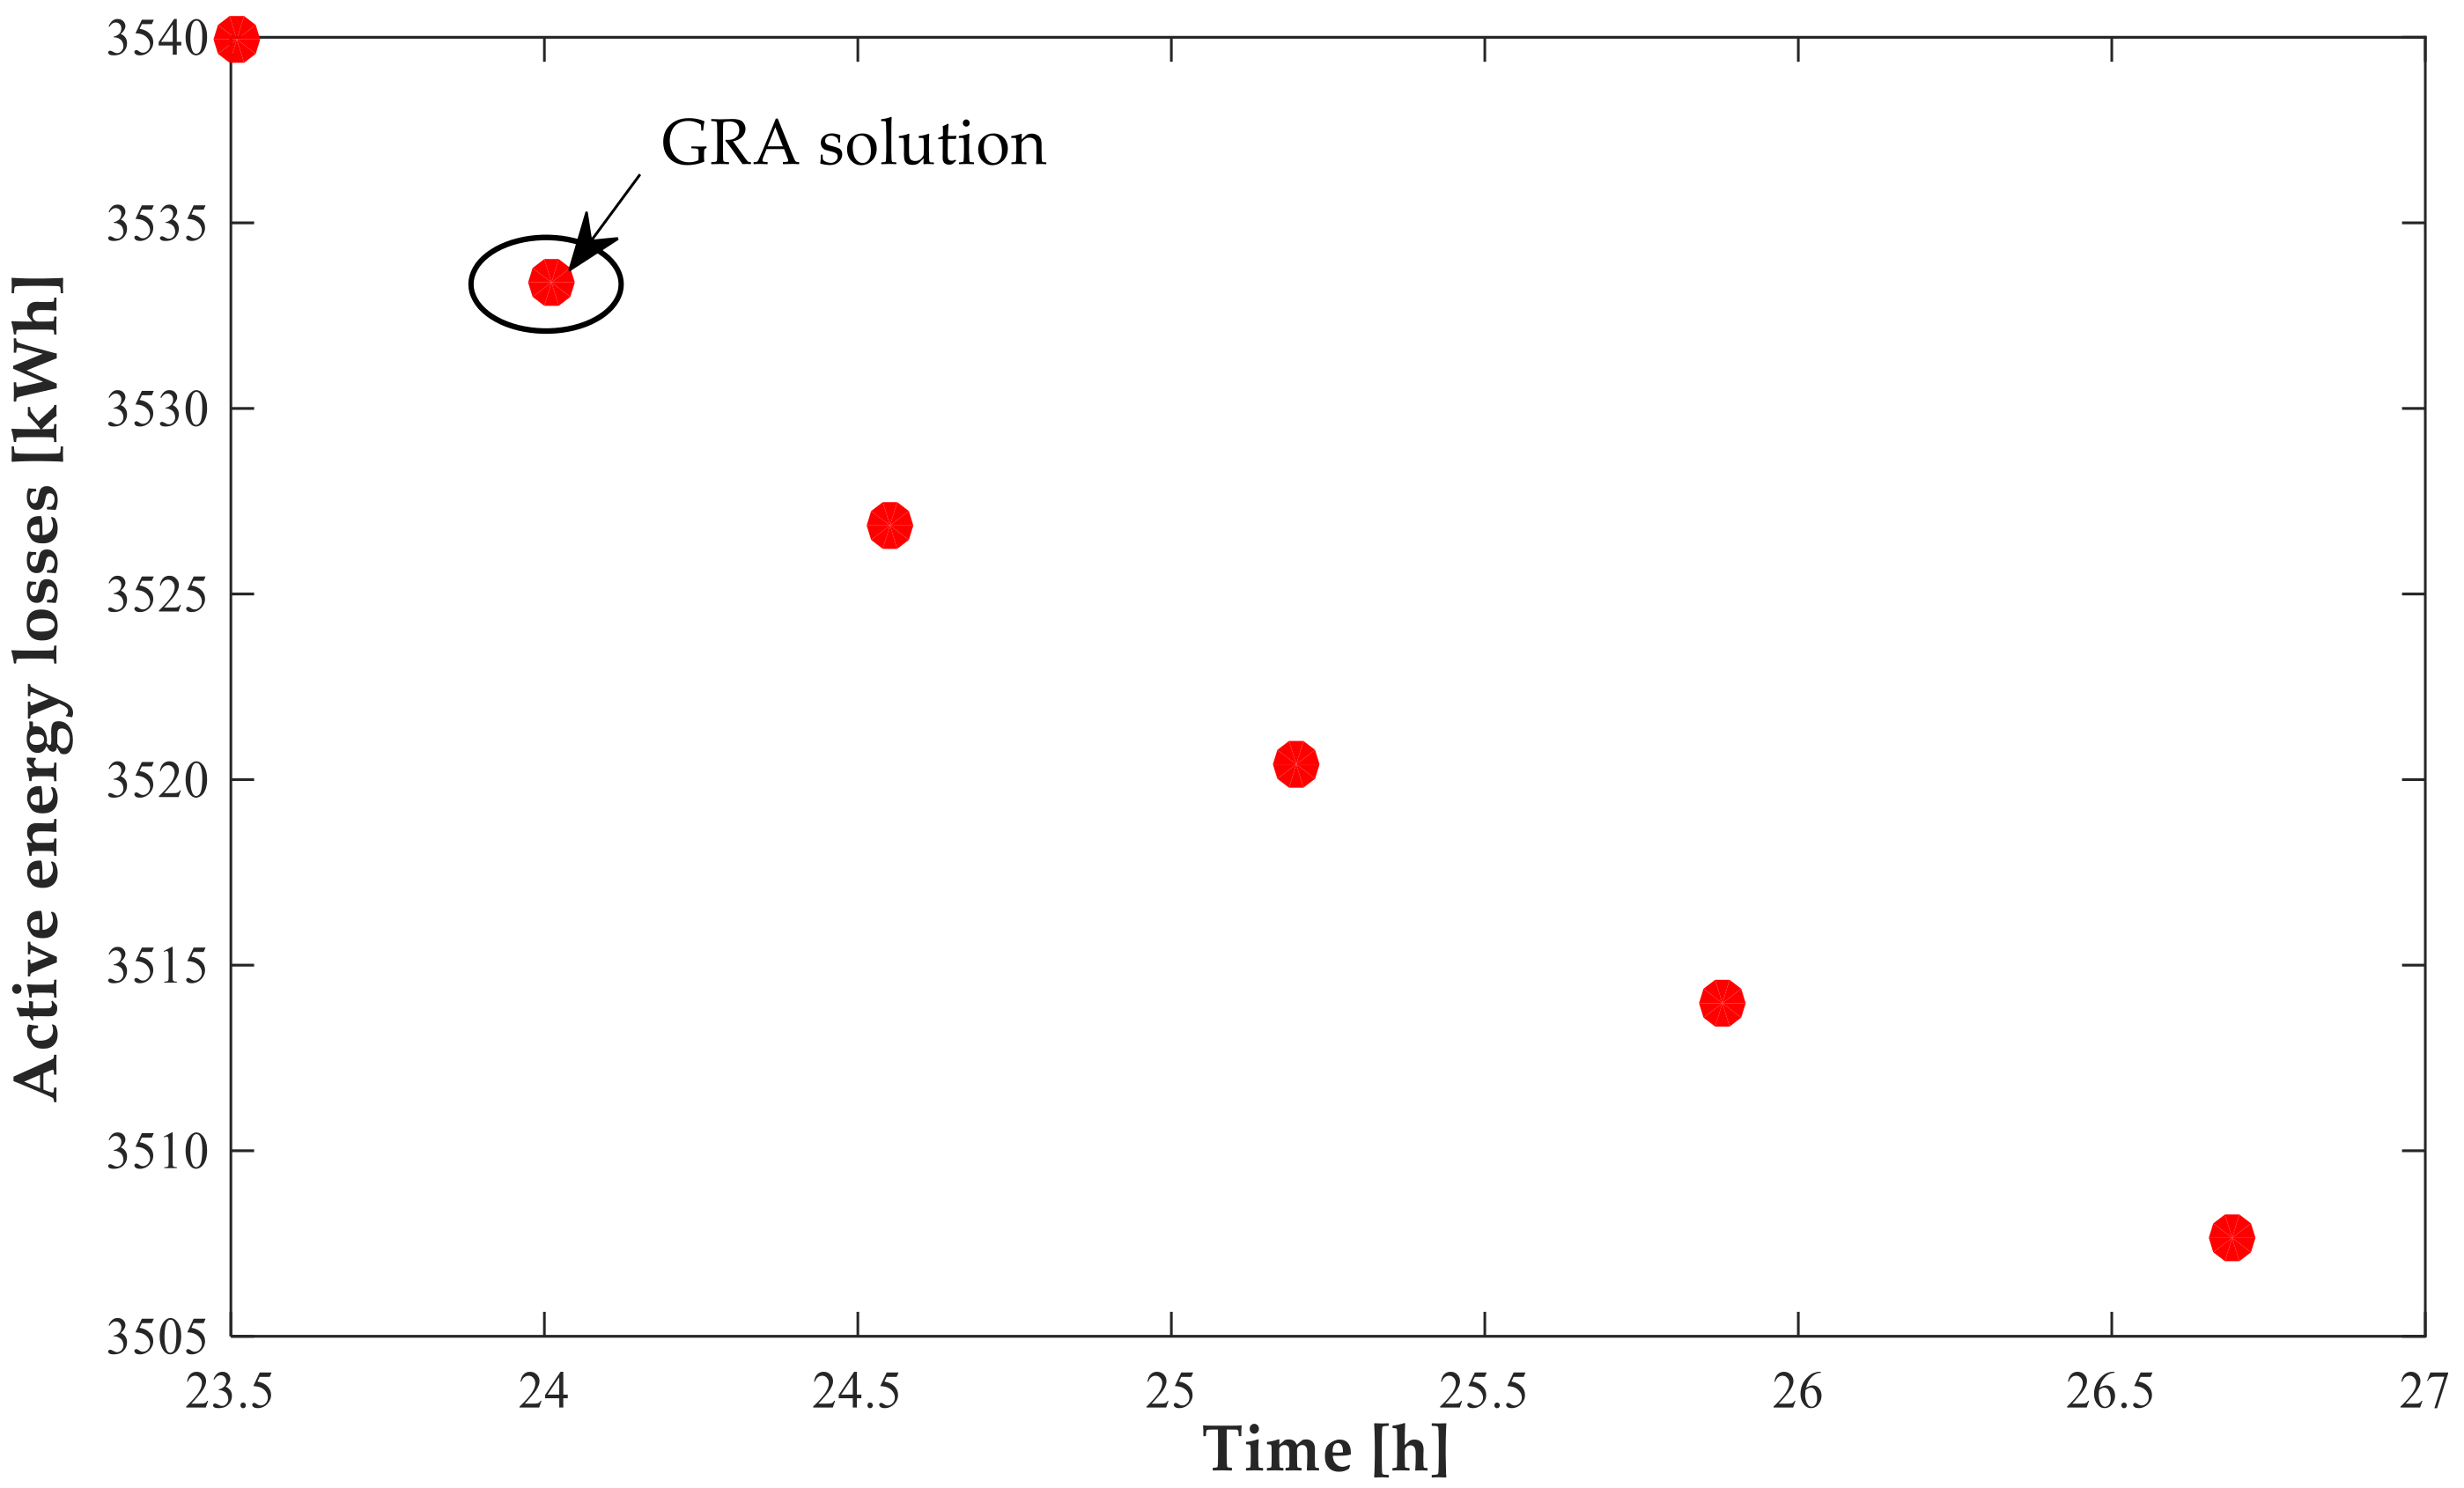
| Daily Transformer Aging [h] | Active Daily Power Losses [kWh] | Q/Qmax | Γ0i | Ranking Solution |
|---|---|---|---|---|
| 24.000 | 3540.0 | 0.75 | 0.66667 | 2 |
| 24.012 | 3533.4 | 0.80 | 0.68824 | 1 |
| 24.553 | 3526.9 | 0.85 | 0.58257 | 4 |
| 25.200 | 3520.4 | 0.90 | 0.54352 | 6 |
| 25.880 | 3514.0 | 0.95 | 0.56736 | 5 |
| 26.689 | 3507.7 | 1.00 | 0.66667 | 2 |
Publisher’s Note: MDPI stays neutral with regard to jurisdictional claims in published maps and institutional affiliations. |
© 2022 by the authors. Licensee MDPI, Basel, Switzerland. This article is an open access article distributed under the terms and conditions of the Creative Commons Attribution (CC BY) license (https://creativecommons.org/licenses/by/4.0/).
Share and Cite
Pavlićević, A.; Mujović, S. Impact of Reactive Power from Public Electric Vehicle Stations on Transformer Aging and Active Energy Losses. Energies 2022, 15, 7085. https://doi.org/10.3390/en15197085
Pavlićević A, Mujović S. Impact of Reactive Power from Public Electric Vehicle Stations on Transformer Aging and Active Energy Losses. Energies. 2022; 15(19):7085. https://doi.org/10.3390/en15197085
Chicago/Turabian StylePavlićević, Ana, and Saša Mujović. 2022. "Impact of Reactive Power from Public Electric Vehicle Stations on Transformer Aging and Active Energy Losses" Energies 15, no. 19: 7085. https://doi.org/10.3390/en15197085
APA StylePavlićević, A., & Mujović, S. (2022). Impact of Reactive Power from Public Electric Vehicle Stations on Transformer Aging and Active Energy Losses. Energies, 15(19), 7085. https://doi.org/10.3390/en15197085