Article

Examining the Relationship between Renewable Energy and Environmental Awareness

by
András Szeberényi
1,
Tomasz Rokicki
2,* and
Árpád Papp-Váry
3
1
Institute of Marketing, Budapest Metropolitan University, 1148 Budapest, Hungary
2
Institute of Economics and Finance, Warsaw University of Life Sciences, 02-787 Warsaw, Poland
3
Alexandre Lamfalussy Faculty of Economics, Sopron University, 9400 Sopron, Hungary
*
Author to whom correspondence should be addressed.
Energies 2022, 15(19), 7082; https://doi.org/10.3390/en15197082
Submission received: 1 September 2022 / Revised: 19 September 2022 / Accepted: 23 September 2022 / Published: 27 September 2022

Abstract

:
The use of green and renewable energies undeniably plays an essential role in today’s society. Energy from these sources plays a key role in transforming the energy sector and significantly impacts the way of life and the quality of life of different social groups. The main aspects of this study are to briefly describe the situation of clean and renewable energy in Hungary and to investigate the extent to which the younger generation of different social groups is involved in using renewable energy sources in their everyday lives and their attitudes towards environmental awareness. In our research, we also investigate whether there is a strong statistical correlation between environmental awareness, environmentally damaging activities and the perceptions of different environmental problems among the target groups and, if so, how these affect the research topic. Our primary research can be considered representative, as we surveyed all primary and secondary school students in the Gyöngyös micro-region of the North-Hungarian region and also included the opinion of university students in the mentioned micro-region. The questionnaire was asked in person, and 2180 students completed it. The research was carried out in several phases, the first occurring between 2017 and 2019 and the second between 2020 and 2021. Three research questions were formulated, and the main findings show that the students’ main goal in the research was not to protect or support the environment but to prefer material well-being and related factors. On the results of statistical correlation analyses, overall, the examination by educational level (primary, secondary and higher) does not show significant differences between student groups, i.e., students with higher education do not have higher levels of environmental awareness and attitudes. Another important finding is that using renewable energy sources is considered too expensive for low-income families to take advantage of this kind of energy.

1. Introduction

1.1. The Situation of Clean and Renewable Energy in Hungary

Today, a large part of energy production still relies on exhaustible and non-renewable energy sources for electricity generation and heat for heating [1]. Polluting and irresponsible energy-wasting behaviour can lead to the depletion of natural resources in the long term, and alternative energy sources are increasingly replacing fossil fuels [2]. The limited availability of ‘conventional’ or fossil fuels means a sustainable energy economy cannot be built on them [3]. The solution is to use renewable energy sources driven by environmental concerns, which is why the importance of green energy is increasingly being highlighted. Bögeholz [4] repeatedly mentions the concept of green energy, which refers mainly to renewable and non-polluting energy sources. By choosing any renewable energy source that falls into this category, consumers support the development of clean energy that reduces the environmental impact of conventional energy production and increases energy independence [4,5,6]. The European Union also emphasises this and is applying more consistent regulations and tax incentives, for example, to increase biodiesel and bioethanol [7,8]. The spread of renewable energy technologies can be even more effective in the case of renewables, which can be accelerated by public support. In recent years, promoting renewable energy sources through various subsidies has become essential in countries’ energy policies [9,10]. Looking to the future, it is in renewable energy sources that we will find the opportunities to preserve our planet’s renewable potential and provide future generations with similar or better environmental conditions, according to the possibilities available. However, consumers have little incentive to change for reasons such as the high investment costs of using renewable energy [11]. A significant proportion of these resources are located in geographically defined, mainly rural areas and are, therefore, endogenous resources that offer clear competitive advantages over non-rural areas. In Hungary, there have been significant efforts to increase the role of alternative energy production since 2012. Szabó et al. [12] mention that renewable energy in Hungarian municipalities shows that smaller municipalities are more advantageous in some respects. For example, waste-to-energy power plants have a future in small settlements of 1000–2000 inhabitants, while in larger settlements of 4000–5000 inhabitants, thermal and solar energy could be an option. Based on previous research, a concrete example is biomass heating, which is most appropriate in rural areas, where the feedstock is produced, because it is not environmentally damaging to transport and is more economical in terms of space [13].
It is worth briefly discussing how renewable energy is reflected in the territorial development objectives of Hungary. The National Development and Regional Development Concept of Hungary (hereinafter: The Concept) [14] sets out several territorial development goals, needs and tasks. As in the European Union’s regional policy, The Concept also sets out objectives for regional and urban development, with the single overarching aim of promoting economic growth and improving quality of life through strategic investment. Its other aim is to efficiently use national resources, maintain a balance between population, culture and, most relevant to the research article, the environment, and ensure integration within a broader economic space. The Concept also covers the area of Heves County, which is the subject of our study.
In line with the aforementioned territorial development goals, the tasks of the Hungarian National Rural Strategy until 2020 included the need to strengthen the population retention and sustainability of rural areas [15,16]. Agriculture is essential for this, but other sectors such as local industry, businesses, tourism, and municipal human and social policy are just as important. The use of green energy can form the basis of this complex approach. As almost two-thirds of the EU’s population live in rural areas, it is also an important policy area for rural development [17,18]. Agricultural activities and forestry will continue to play a crucial role in the future management of resources in rural areas of the EU. They also provide an opportunity to raise the economic profile of rural communities, with eco-energy production also playing a role in creating employment and new jobs [19,20]. In this context, Magda [21] has already stated that the question to be examined is how individual renewable energy production systems can impact employment or what role they can play in areas and regions where this can be expected.
For rural areas, localisation linked to globalisation is also an important factor in the valorisation of rural areas and the expansion of opportunities by focusing on resources and local values. In countries with more advanced market economies, changes in the role and functions of the countryside and processes underway in Central and Eastern European countries for a much shorter time or that have only recently gained momentum [22,23] have manifested themselves. These changes have led to the development of new uses of space (e.g., tourism, conservation, energy management), which facilitate the spread of industry, services and technology [24]. In this respect, renewable energy sources will play an even more critical role in the near future in rural areas’ complex development, solving the environmental problems of rural communities and creating new rural jobs [25]. All this will provide a platform for reducing territorial disparities and for spatial and rural development interventions.
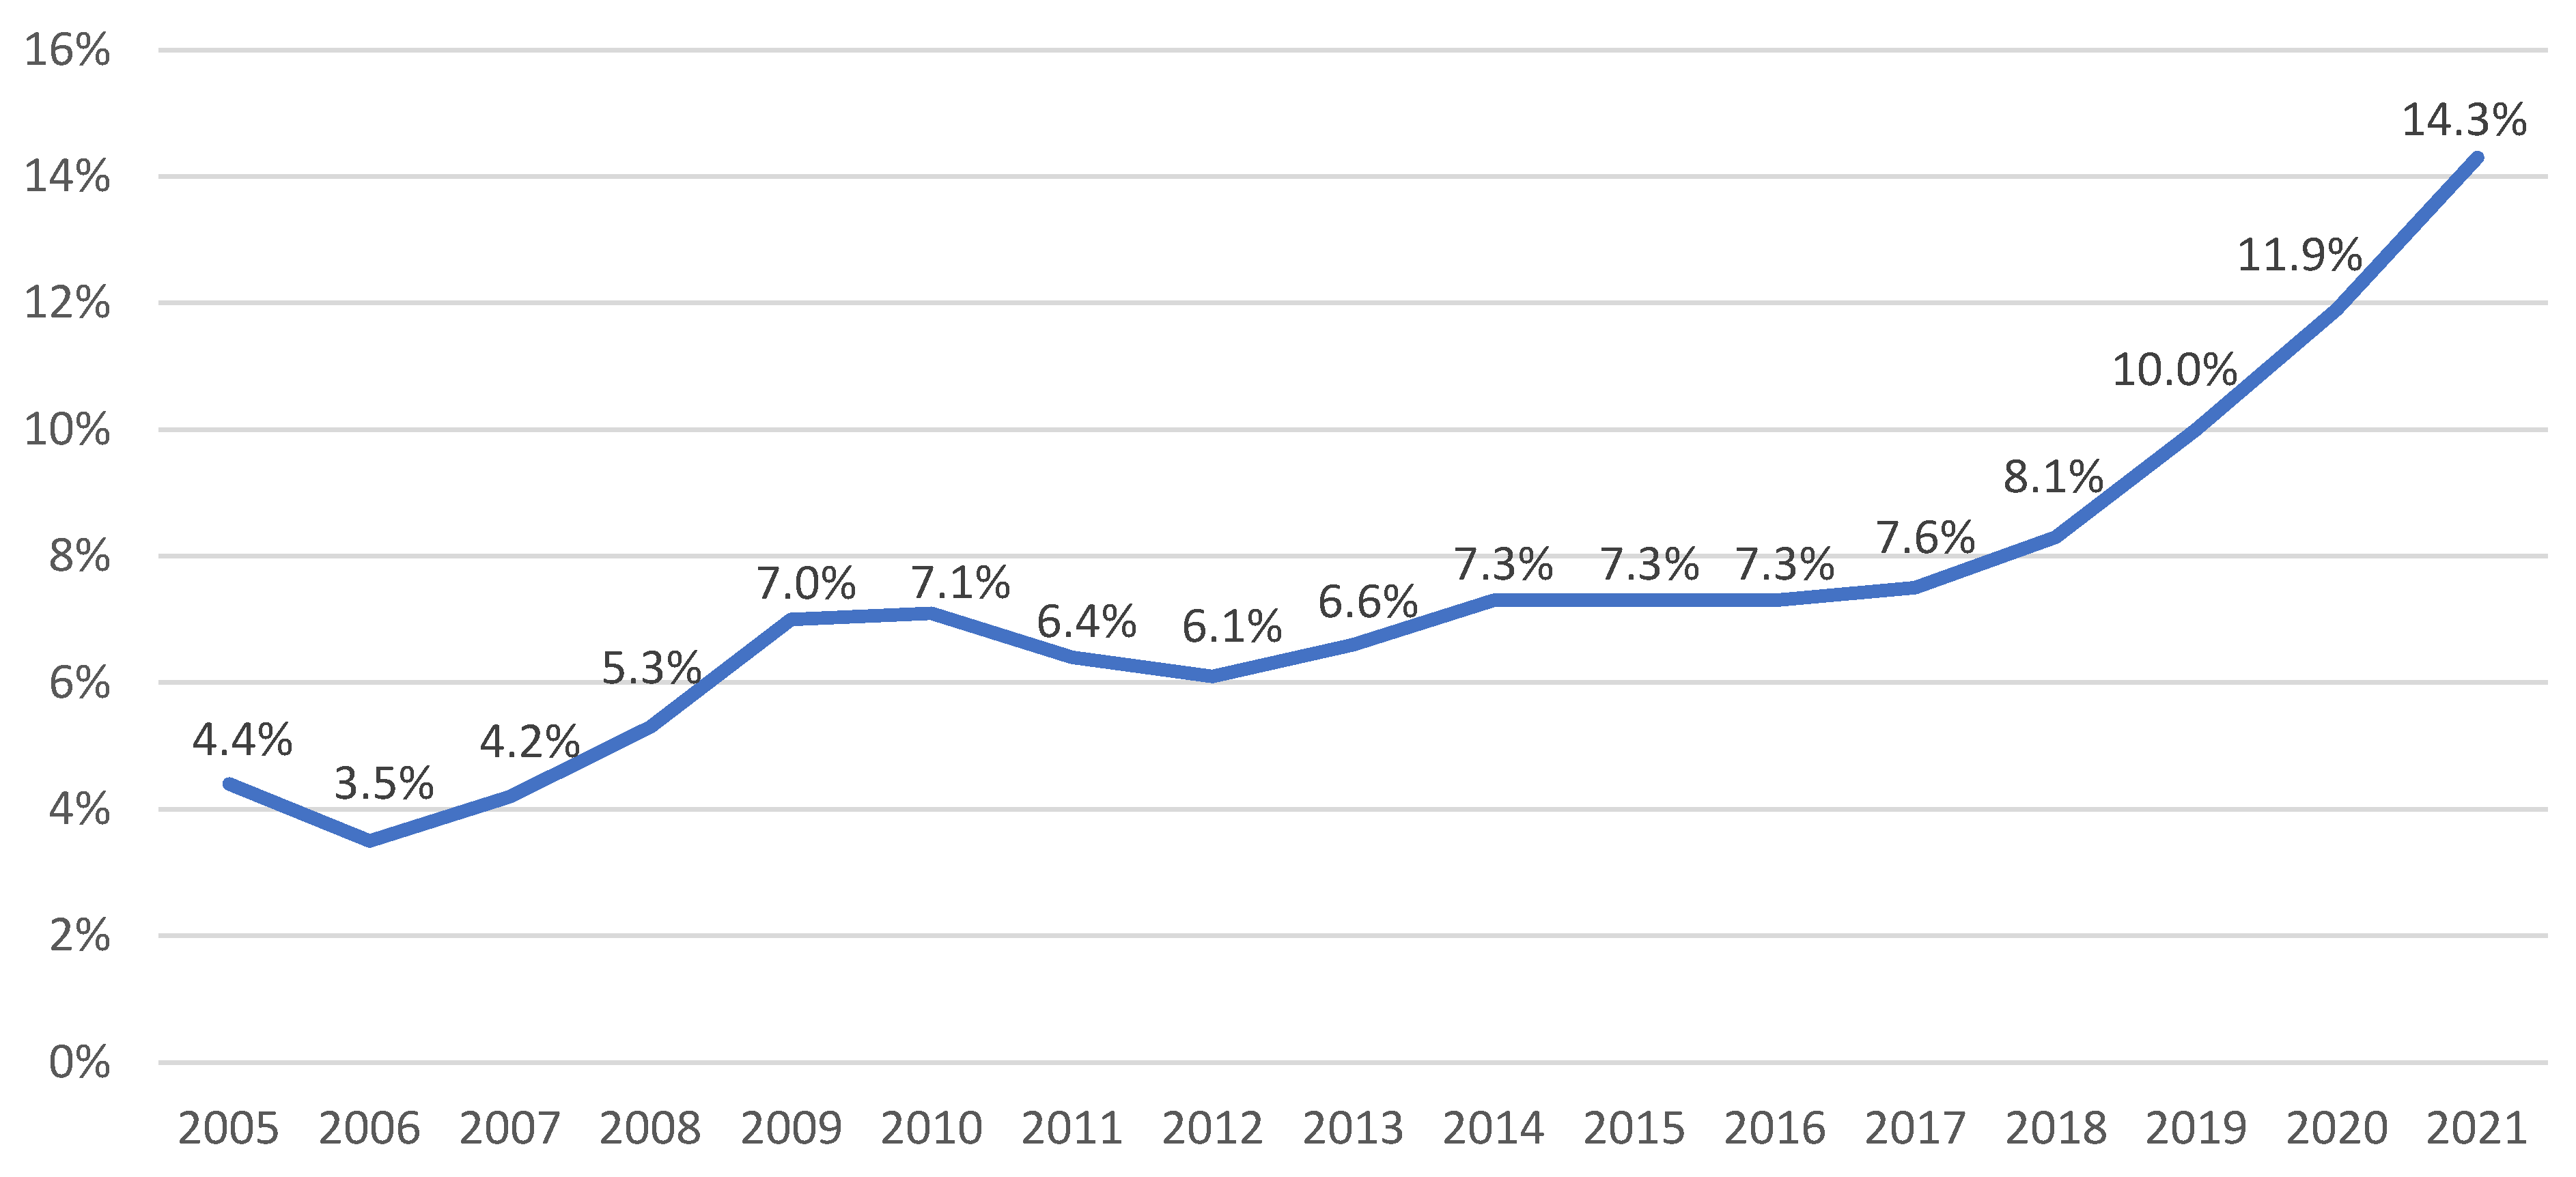
Hungary’s potential in renewable energy is good. Figure 1 shows the share of energy generated from renewable energy sources in Hungary, which has significantly increased, especially in 2018–2021.
The results in Figure 1 show that the share of electricity generated from renewable energy sources increased slightly between 2006 and 2010 and then decreased. The share of electricity generated from renewable energy sources stagnated between 2014 and 2016 (7.3%) and then increased significantly from 2017 onwards, reaching 14.3% in 2021.
According to the reports prepared by the Hungarian Energy and Public Utility Regulatory Office and the Hungarian Central Statistical Office, Hungary has the right conditions for the exploitation of geothermal energy; the use of wind energy is economical; the number of sunshine hours is favourable for the installation of solar panels and solar collectors, and there is a significant amount of biomass available [24]. It is worth noting, however, that although the European Union explicitly supports biomass combustion as a green energy source, the condition of Hungary’s forests has deteriorated considerably over the past decades. One of the reasons for this is that most of the wood lost through biomass burning is replanted with acacia trees, which does not contribute to maintaining the natural ecosystem, and it is also not at all important which forests are planted and how fast-growing they are after the biomass is burned in order to offset the carbon dioxide released into the atmosphere by burning [26].
The shares of electricity produced from renewable energy sources in Hungary are shown in Table 1, broken down by energy type for 2010–2020.
Partly for the reasons mentioned before, the use of electricity generated from biomass has been on a steady downward trend since 2010, falling from around 67.4% to 30.1%. Similarly, wind power utilisation has been steadily declining since 2012. However, it is worth noting that, as of 2018, geothermal energy is also being used to generate electricity, although its share is still negligible (0.3% in 2020). The use of solar energy has increased significantly, particularly between 2018 and 2020, with the share of electricity generated from this source rising from 16.7% to 44.5% [26].
Plans include Hungary contributing nearly USD 6 million to international climate finance by 2023, part of which will support the Green Climate Fund in the fight against global warming [27]. In line with EU ambitions, Hungary is also planning to increase its solar power capacity tenfold by 2030 to end coal-to-energy and expand nuclear power generation. According to statistics, Hungary has reduced its carbon dioxide emissions by around 32% since 1990, while at the same time its energy consumption has fallen, and its economic performance has increased significantly. It also aims to make 90% of Hungary’s electricity generation carbon dioxide-free by 2030, to use only e-buses for public transport in Hungarian cities with a population of more than 25,000, and to improve the energy efficiency of buildings by at least 30% by 2050, thus balancing the constraints of the energy crisis [28,29].

1.2. The Role of Renewable Energy in the Lives of the Younger Generation

Environmental awareness, conservation of natural resources, and the human–environment nexus are increasingly emphasised by researchers at the national and international levels [30]. Since the 1960s, the extent of damage to nature caused by artificial, harmful chemicals created or used by industry and technological development has been increasingly highlighted. It has become necessary to make people aware of the need to adopt an approach that seeks to further society’s best long-term environmental interests through a harmony of scientifically-based thinking and behaviour [31,32]. The most common aim is to combine the two factors: the relationship between man and the environment. We fully agree with the definition of Banerjee et al. [33] that we should not divide people into “environmentally conscious” and “non-environmentally conscious” groups because within environmental consciousness, we can distinguish a variety of other groups, or “shades” as they are also called. These are determined mainly by people’s life stages and their perception of what constitutes environmentally conscious behaviour or so-called ‘actions’ [33].
At different stages of our lives, from childhood to adulthood, we are in constant contact with nature. The literature also states that the younger a child is when taught the importance of protecting nature, the more he or she will take it to heart as an adult [34]. These findings, alongside our own experience, emphasise the need to examine the role of the younger generation and education.
The relationship between renewable energy and environmental awareness is quite obvious. Environmental awareness means supporting renewable energy sources and being aware of the current energy system that pollutes the environment. In addition, environmentally conscious people have a positive attitude towards the environment and fully recognize the need for an energy transition.

1.3. Justification, Aims and Structure of the Article

Our primary initial objective was to assess and investigate the potential of the green and renewable energy in the North-Hungarian region, such as electricity generation, fuel use (biodiesel, bioethanol), geothermal heat (thermal water), passive and active solar energy (solar collectors), hydropower (hydroelectric power plants, water turbines), and wind energy (wind power, wind turbines). This investigation combined the themes of environmental protection, environmental lifestyle and environmental sustainability.
The reason for writing the study was the subject’s topicality, and the aim was to explore the aspects of the environmental behaviour of the target group we studied. Although the issue concerns all age groups, the situation of young people is the most critical, as they will be the most affected by the lack of fossil energy, extreme climate change and natural disasters in the coming decades. For these reasons, it was considered necessary to target them as the primary target group in the micro-region of Gyöngyös.
In this research, we focused on better integrating green energy and environmental education in primary and secondary education and how smart devices and applications [35], as well as social media, can contribute to a more practical approach to the younger generation. Our research was preceded by several preliminary studies [36,37], which found that, as a consequence of the development of current technological tools, the younger generation of today can be trained more effectively and in a more time-efficient manner than in previous decades. For this reason, it is vital to start as soon as possible to consciously build in them the spirit of striving for solutions to counteract the problems of climate change, as they are one of the ideal target groups for the issues addressed in this research [38,39].
Usually, researchers focus only on a specific research sample and, on this basis, make conclusions about the entire population. Our research covers the entire population in a given region. In addition, they approach the problem quite comprehensively. We have not encountered such comprehensive studies so far. We study various aspects related to the ecological awareness of young people. Therefore, they fill the research gap. The conducted research is necessary because, based on our results, it is possible to make a diagnosis and then implement tools that may contribute to an increase in the ecological awareness of young people who, in a dozen or so years, make daily choices on environmental protection.
In the article, we set the following research goals:
(1) Determining the level of environmental education on renewable energy, environmental protection and awareness among students of primary, secondary and higher schools;
(2) Exploring the potential of online tools and methods to promote environmental awareness.
We asked the following research questions:
(1) How do the younger generation view environmental problems? Do they contribute to mitigating them, and if so, how?
(2) How can education contribute to preventing and solving environmental problems?
(3) What role should online communication and online media play in environmental awareness?
Based on the literature, previous studies, our own practical experience and preliminary research, we aim to test the following hypotheses:
Hypothesis 1.
The primary and secondary school students in the study have lower levels of knowledge about renewable energy, their level of environmental awareness and the role of online communication tools they use in emphasising environmental awareness, while the university students in the study have stronger knowledge and attitudes towards environmental awareness, environmental protection and renewable energy.
Hypothesis 2.
Online communication tools can provide a good basis for encouraging environmentally conscious behaviour among the target groups.
The topic we are examining is presented as follows: in the first section, we briefly describe the situation of renewable energy in Hungary and the role of renewable energy sources for the younger generation. This section also contains the hypotheses that are relevant to our study. The second section illustrates the methods used in our representative primary research. In the third section, we present the results of our research. The fourth section contains our further findings on the study. The fifth section summarises and concludes the research.

2. Materials and Methods

2.1. Data Collection, Processing, and Limitations

Our primary initial objective was to assess and investigate the potential of green and renewable energy in the North Hungarian region. After starting the research, we narrowed down the research area to the latter topic, geographically to Heves County and then to the micro-region of Gyöngyös, because this allowed us to conduct representative primary research.
More and more countries are emphasising the importance of environmental awareness through government decisions. In Hungary, too, the presence of solar panels, solar collectors and institutions specialising in the use of biomass can be observed in an increasing number of municipalities [9,40,41]. In most EU Member States, capital cities and their surrounding agglomerations can use renewable energies more efficiently and effectively [42,43]. One reason for this is the implementation conditions of the tenders that are often decisive for the level of development of municipalities and regions. There are thus considerable differences between the various areas, in which the environmental awareness of the inhabitants of the areas concerned also plays an important role. The first part of the research presented here was conducted in 2017–2019, and the second part in 2020–2021 in the micro-region of Gyöngyös. The main focus of the study was on students’ attitudes towards environmental awareness.
The micro-region of Gyöngyös, with an area of 751 km2, is located in the Heves County region of Northern Hungary. Of the 25 settlements in the micro-region, the closest is about 76 km from Budapest. The seat of the micro-region is the town of Gyöngyös, another town is Gyöngyöspata, and the other 23 settlements are registered as villages. According to the 2019 data, the micro-region’s population is 69,624, which decreased by an average of 600 persons per year from 2011 to 2016, then decreased to 135 persons per year in 2018, but the micro-region’s population continues to decrease. By the end of 2016, there was a positive change, as new factories were built and other large companies (e.g., Apollo Tyres, Procter & Gamble) started their activities. As a result, a significant proportion of the active workers in the micro-region spend 2–3 or more hours a day commuting (100–160 km) rather than strengthening the micro-region-level labour market [44].
Table 2 presents the stages of the research process.
In our research, we first used data from various open (KSH, EUROSTAT) and publication databases (Science Direct, ResearchGate, Scopus) as a starting point for secondary research. Unfortunately, while processing and analysing the literature background, we could not obtain the quantity and quality of data that would have allowed a more detailed analysis of the topic. However, we used the literature experience, previous field research and results to prepare our final primary research with our questionnaire.
The backbone of the study is based on collecting and processing primary data. The primary research was conducted in a multi-stage system, whereby the primary objectives, target group and subject areas of the research were first formulated. Then, after defining a specific target group, a first primary survey was carried out, mainly using open-ended questions, which helped to gather in-depth and substantial information on the topic. This allowed us to simplify the following target groups and objectives into predefined criteria and categorised question areas, thus increasing the willingness and effectiveness of respondents [45].
The research presented in the study was preceded by a groundwork study, which revealed that most of the tenders and projects implemented included the installation of solar panels—such as in the case of hospitals, community centres, and schools—or biomass recycling (for more details on the results of the groundwork studies, see the report of the European Commission, p. 33). The preliminary research also allowed for a more thematic division of topics and related issues through a targeted narrowing down of the themes, thus allowing for the inclusion of issues related to the impact and level of influence of online communication and social media. One of these is to explore how social media can be used to raise awareness among the younger generation of the importance of living an environmentally conscious lifestyle or of environmental protection.
To visualise and process our research results, we used a geospatial software programme, Adobe Illustrator, and data processing software, including SPSS [46,47] and Google Analytics. We also used online communication during the research, significantly accelerating the surveys and primary research. The software package IBM SPSS Statistics 22 was used to process the questionnaire database. The results were primarily characterised by descriptive statistics, while secondary analysis was also used to explore dependency relationships, mainly using cross-tabulation and occasionally ANOVA.

2.2. Applied Methods

The complex primary research focused on the environmental lifestyle and attitudes of primary and secondary school students and university students living and studying in the micro-region Gyöngyös. These groups were chosen because the current 14–25 age group is already actively affected by the consequences of environmental problems that are likely to increase in the future. We believe that they will be the ones who will be able to acquire the knowledge that will provide solutions to the environmental difficulties that are emerging and that they are likely to be the new generation who will not necessarily be able to use all fossil fuels to the extent that we can now.
Regarding research design, we first started with secondary school students from grade 9 to grade 12, and the questionnaires were divided into grade and class. With a view to the research representativeness, we sought to reach and survey all grades in all secondary schools in the micro-region. However, this was influenced by the willingness of respondents and the cooperation of schools on several levels. Unfortunately, there were some schools whose management did not wish to participate in the research and were therefore not included in the primary survey. In the next step, we also surveyed 8th-grade students in primary schools, using the same 39-question questionnaire we used for secondary school students. Only 8th-grade students were interviewed for primary school students because they were considered the most relevant at the primary level regarding age, mindset and accumulated experience. The final step for students was to interview students at the university in the micro-region. These steps made it possible to investigate how the mindset and attitudes of 8th-grade primary school students, mostly aged 13–14, differed from those of secondary school students and university students aged 19–25.
Table 3 details the distribution of all assessable completions (n = 2180) in the survey, including responses from primary and secondary schools and students at a university in the micro-region. The methods used and the number of research items completed for each group is presented alongside the target groups.
Several studies were carried out during the research, but in this paper, we will only present the results closely related to our hypotheses for the students.
The main problems with students’ willingness to respond when completing the questionnaire:
-
Intermittent completion due to student absences and illness;
-
For students under 14, requiring a separate written request for permission from parents and school authorities slowed down the process considerably;
-
The process of questionnaire filling classes was challenging to coordinate due to a large number of students (more than 30 per class);
-
Some institutions distanced themselves from the research or responded after repeated requests due to other problems—e.g., institutional and restriction problems, GDPR law, or not wanting to disclose data for public use.
The statistical methods used to process the results for the students were mainly cross-tabulation analysis and analysis of variance (i.e., ANOVA). ANOVA assumes H0 that the means of the responses are the same in all samples. Suppose the significance level between the explanatory variables (e.g., gender, class) and the variables to be explained (e.g., level of environmental awareness) is less than 0.05. In that case, we reject H0, as it is statistically supported that there is a difference in the level of environmental awareness between, e.g., groups by demographic characteristics [48,49]. The results are presented in a cross-tabulation and textual descriptive statistics.
The existence of a relationship was tested using Pearson’s chi-square, and the strength of the relationship was tested using Cramer’s V, Gamma and Eta association coefficients.
Pearson’s chi-square indicator measures the statistical significance of the relationship between two variables, which is used to determine whether there is a statistical relationship between the two variables. Pearson’s chi-square can be calculated using the following formula [48]:
χ 2 = i = 1 n ( O i E i ) 2 E i = N i = 1 n ( O i / N p i ) 2 p i
where χ 2   = Pearson’s cumulative test statistic, which asymptotically approaches χ 2 distribution; O i   = the number of observations of type i; N = total number of observations; E i = N p i = the expected count of type i, asserted by the null hypothesis that the fraction of type i in the population is p i ; n = the number of cells in the table.
The chi-squared statistic can be used to calculate a p-value by comparing the value of the statistic to a chi-squared distribution. The number of degrees of freedom equals the number of cells n, minus the reduction in degrees of freedom, p [48].
Cramer’s V is a measure of association between two nominal variables, giving a value between 0 and 1. It has the advantage of applying to any cross-tabulation, and many studies have found it to be one of the most reliable indicators to test in any case. To calculate this indicator, it is first necessary to calculate the coefficient of contingency (denoted: C), whose formula is as follows [48]:
Step 1
C = χ 2 χ 2 + N
where χ 2 = Pearson’s cumulative test statistic, asymptotically approaches χ 2 distribution; N = the total number of observations.
The Cramer’s V (denoted: V) indicator can then be calculated according to the following formula [48]:
Step 2
V = χ 2 N ( k 1 )
where χ 2 = Pearson’s cumulative test statistic, which asymptotically approaches χ 2 distribution; N = total number of observations; k = the smaller possible values of the two variables.
According to H0, there is no correlation between the variables under study, but if H0 is rejected in the analysis, a significant relationship can be identified and tested using Pearson’s chi-square. For the Asymptotic Significance Index (2-sided), the accepted level below 0.05% means an existing relationship. Listed ranges refer to Cramer’s V indicator [48]. The indicator is scattered between 0 and 1, so the closer the value is to “1”, the stronger the relationship between the two variables.
We interpreted the strength of the relationship in our analysis as follows:
(1)
0.000–0.199: weak relationship;
(2)
0.200–0.399: moderate relationship;
(3)
0.400–: strong relationship.
Analysis of variance (ANOVA) is a type of explanatory model and is a method of analysis that examines the effect of one (or more) independent variables on one (or more) dependent variables. Analysis of variance examines the effect of each independent variable’s outcome on the dependent variable’s values. The premise of the analysis is that while the independent variables are nominal, categorical variables (i.e., their outputs are not numbers), the dependent variables are metric (i.e., their outputs are numbers). In order to tell whether each group differs significantly for a given criterion, it is necessary to examine the composition of each group. Three classes of models can be used in the analysis of variance: fixed-effects, random-effects and mixed-effects models. In our research, we used the fixed-effects model of ANOVA, which applies to situations in which we applied three ”treatments” to the participating students to see whether the variable response values changed. To get the values, the following formula should be used [48]:
j = 1 M i = 1 n j ( y i j y ¯ ) 2 = j = 1 M i = 1 n j ( y i j y ¯ j ) 2 + j = 1 M n j ( y j ¯ y ¯ ) 2
where y i = individual observation; y j ¯ = average of category j; y ¯ = mean of the whole sample; y i j = the i-th observation in the j-th category.

3. Results

In our research, we formulated two hypotheses, which we presented in detail in the first part of our study. In terms of results, we present the research findings on primary and secondary school students and university students in the micro-region of Gyöngyös.
Throughout the research, we aimed to be fully representative. The problems we encountered in this respect during the research have already been explained above. Since our questionnaire consisted of 39 questions, we obtained a large number of results, but in this article, we will only present the results that are closely related to the hypotheses. The gender distribution of the students who completed the questionnaire was 43.4% boys and 56.6% girls. In terms of their distribution at grade/class level: attending grade 8: 32.8%; attending grade 9: 11.6%; attending grade 10: 15.3%; attending grade 11: 10.7%; attending grade 12: 10.3%; attending university: 19.3%.
In terms of municipalities, all 25 municipalities in the micro-region completed the questionnaires and agreed to provide data. We hypothesised that the characteristics of university students within the target group differed from those of primary and secondary school students in terms of environmental protection and environmental awareness, and so we also examined each question group by group. In presenting the results, however, we will only discuss the differences between the groups where we have found significant, characteristic differences. We used cross-tabulation analysis and ANOVA statistical methods across grades/classes to test our hypotheses about the students. Where this is not explicitly indicated, no statistically significant difference was found between the groups studied.
For the first outcome, we asked if and when they had first learned about environmental education in school or elsewhere (Figure 2). The results show that most students surveyed had heard about environmental education in kindergarten (28.1%) and lower primary school (41.5%). Sixteen point three percent had heard about it for the first time in upper primary school, covering grades 5–8. Interestingly, of the 2180 students surveyed, only 0.3% had learned about it relatively late, in the 11th grade of secondary school, while 8% of students had first heard about it at home, mainly from their parents, family members or close friends. Two percent had never heard of eco-living, which may seem unbelievable in this day and age, with the climate catastrophe news.
Cross-tabulation analysis shows that younger age groups receive more intensive environmental education earlier than their older counterparts. The statistical relationship values for this relation are presented in Table 4 (n = 2180).
This statistical relationship is presumably explained by the increasing emphasis in recent years on awareness-raising in curricula and extra-curricular activities/programmes. Overall, there was a significant (weak) relationship between the year in which the students were in school and when they first encountered environmental awareness.
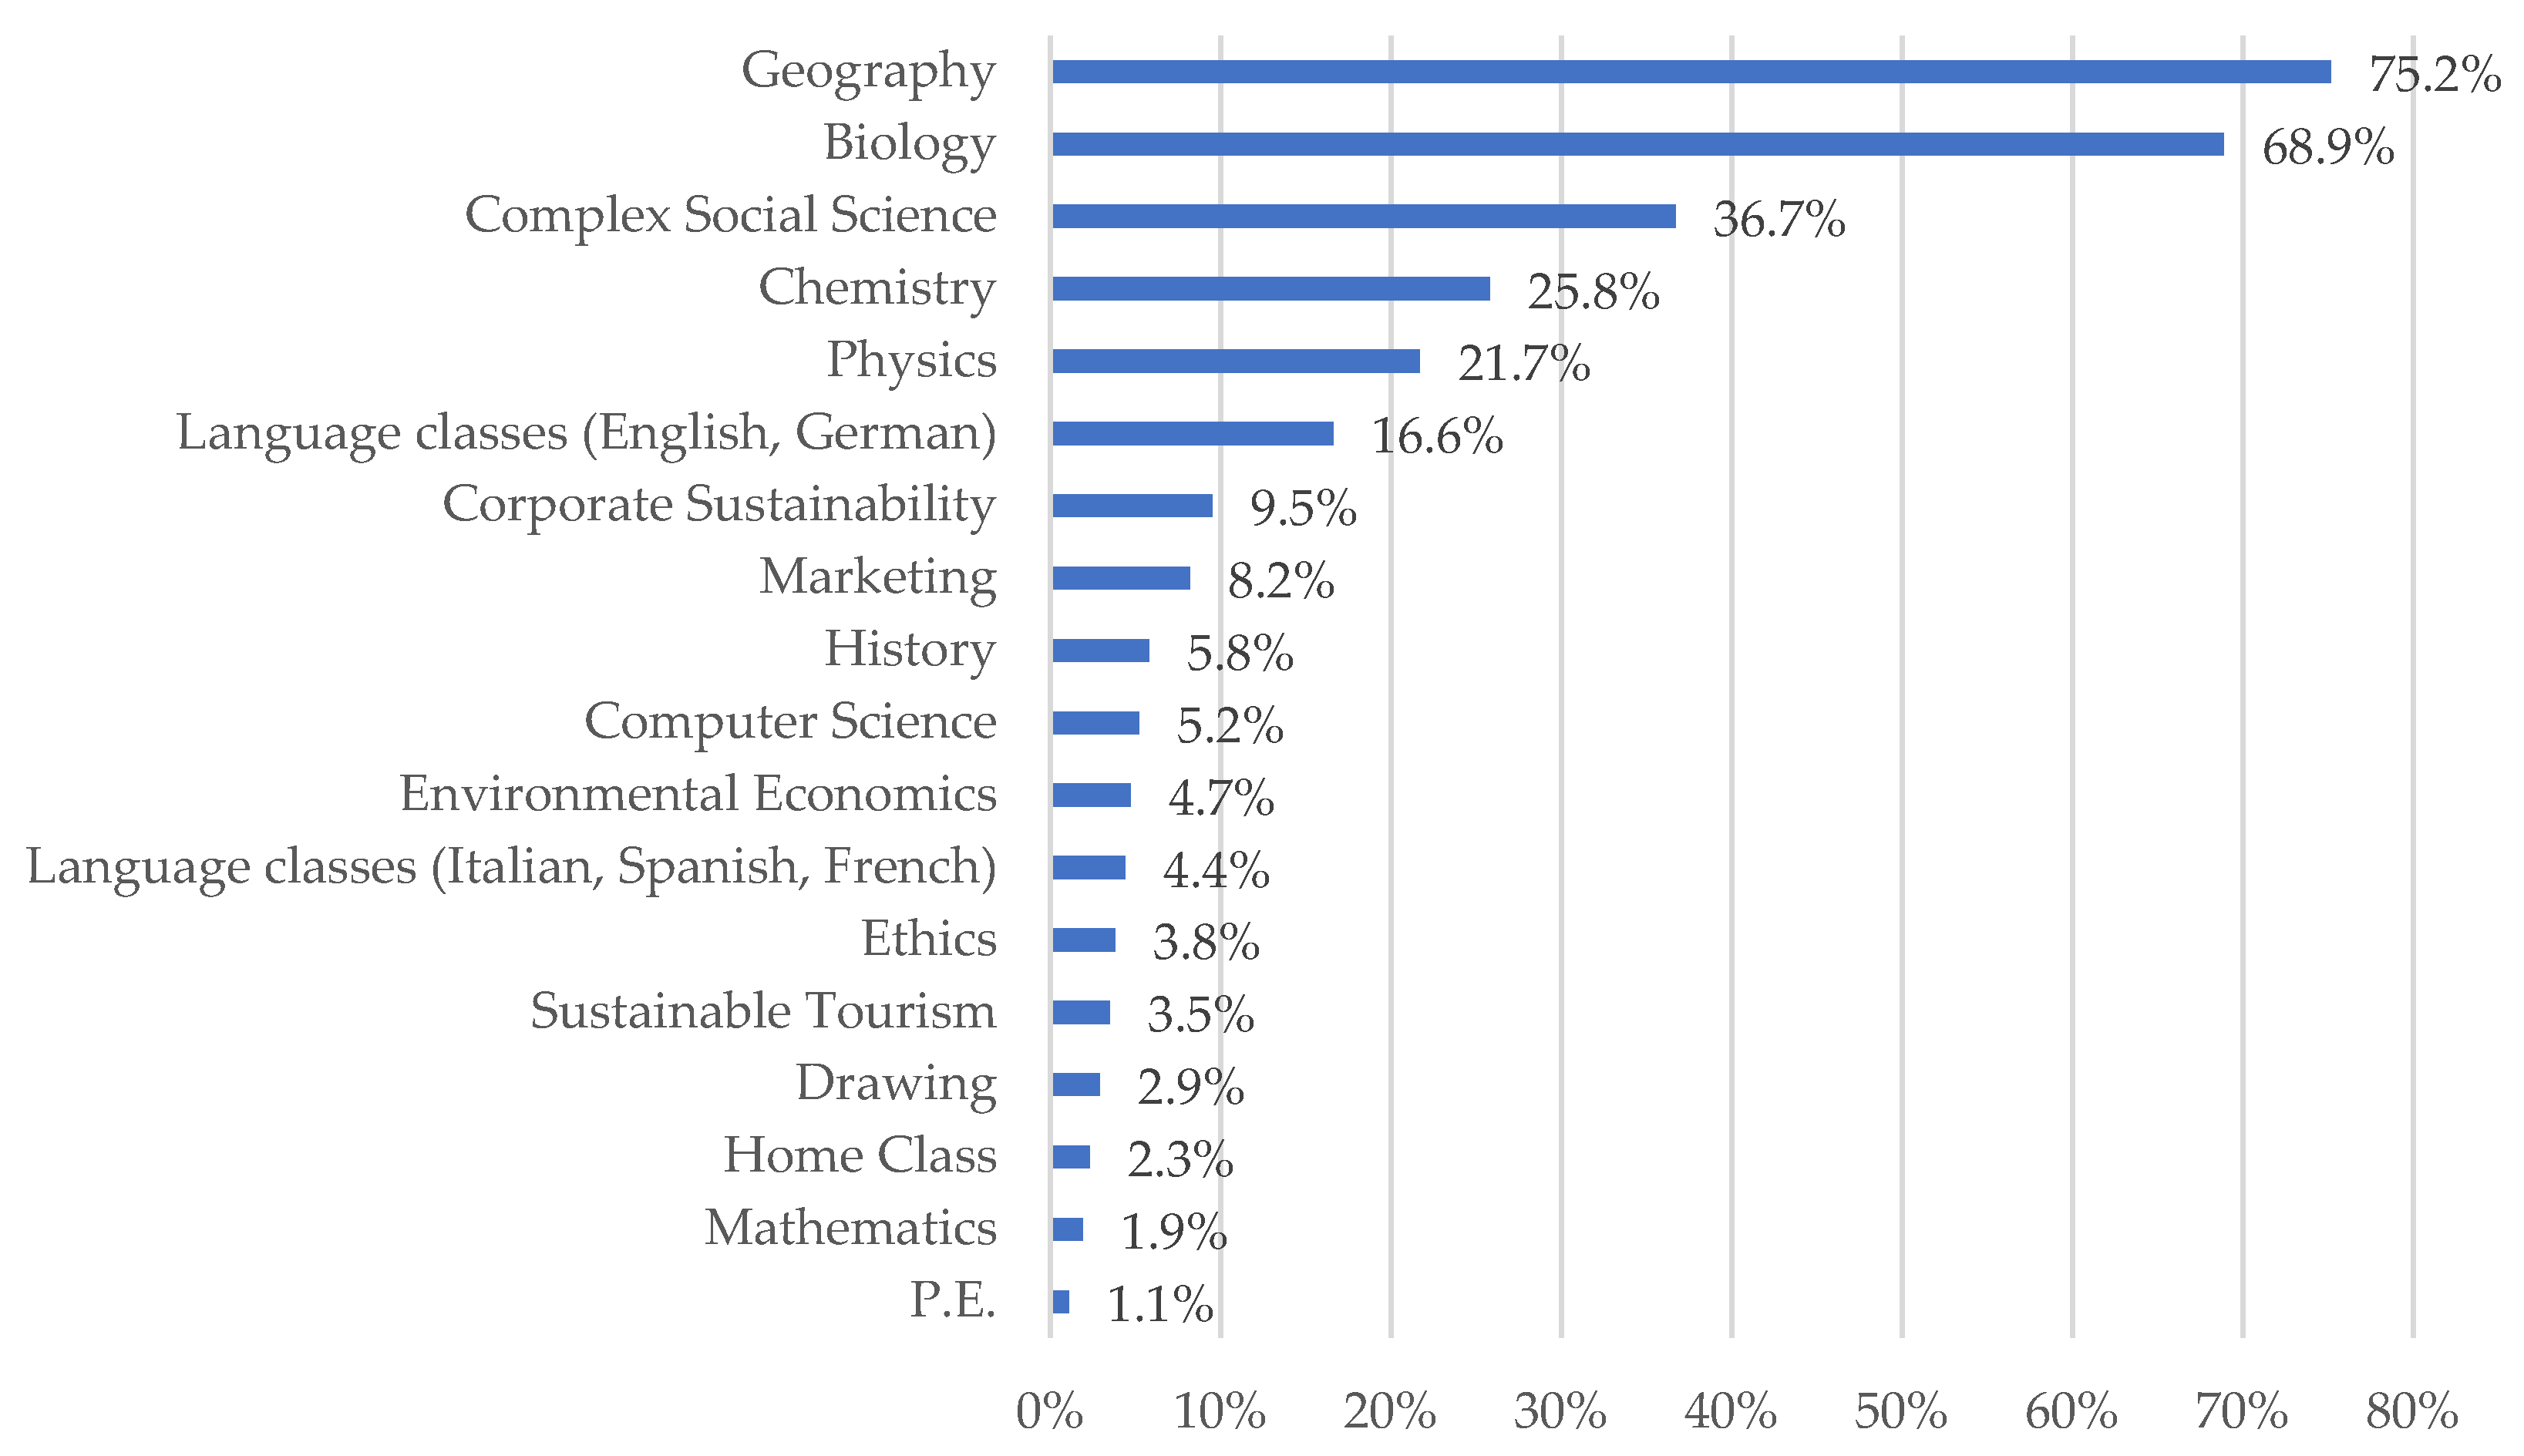
The results show that in the case of 13–14-year-olds, many first learned about environmental awareness, conservation and renewable energy when they entered grade 9. In this context, we were also curious to know which subjects they might come into contact with. It was possible to indicate more than one subject, so Figure 3 shows the total number of students (n = 2180) and the percentage of students within this population who had some form of learning about these topics. Logically, it is not surprising that a significant proportion of students, about 75.2% in geography and 68.9% in biology, had some knowledge about environmental awareness. Of the subjects listed, history and ethics may be of interest, mainly in terms of the subject matter, with 5.8% of students in the former and 3.8% in the latter having acquired knowledge about renewable energy or environmental awareness.
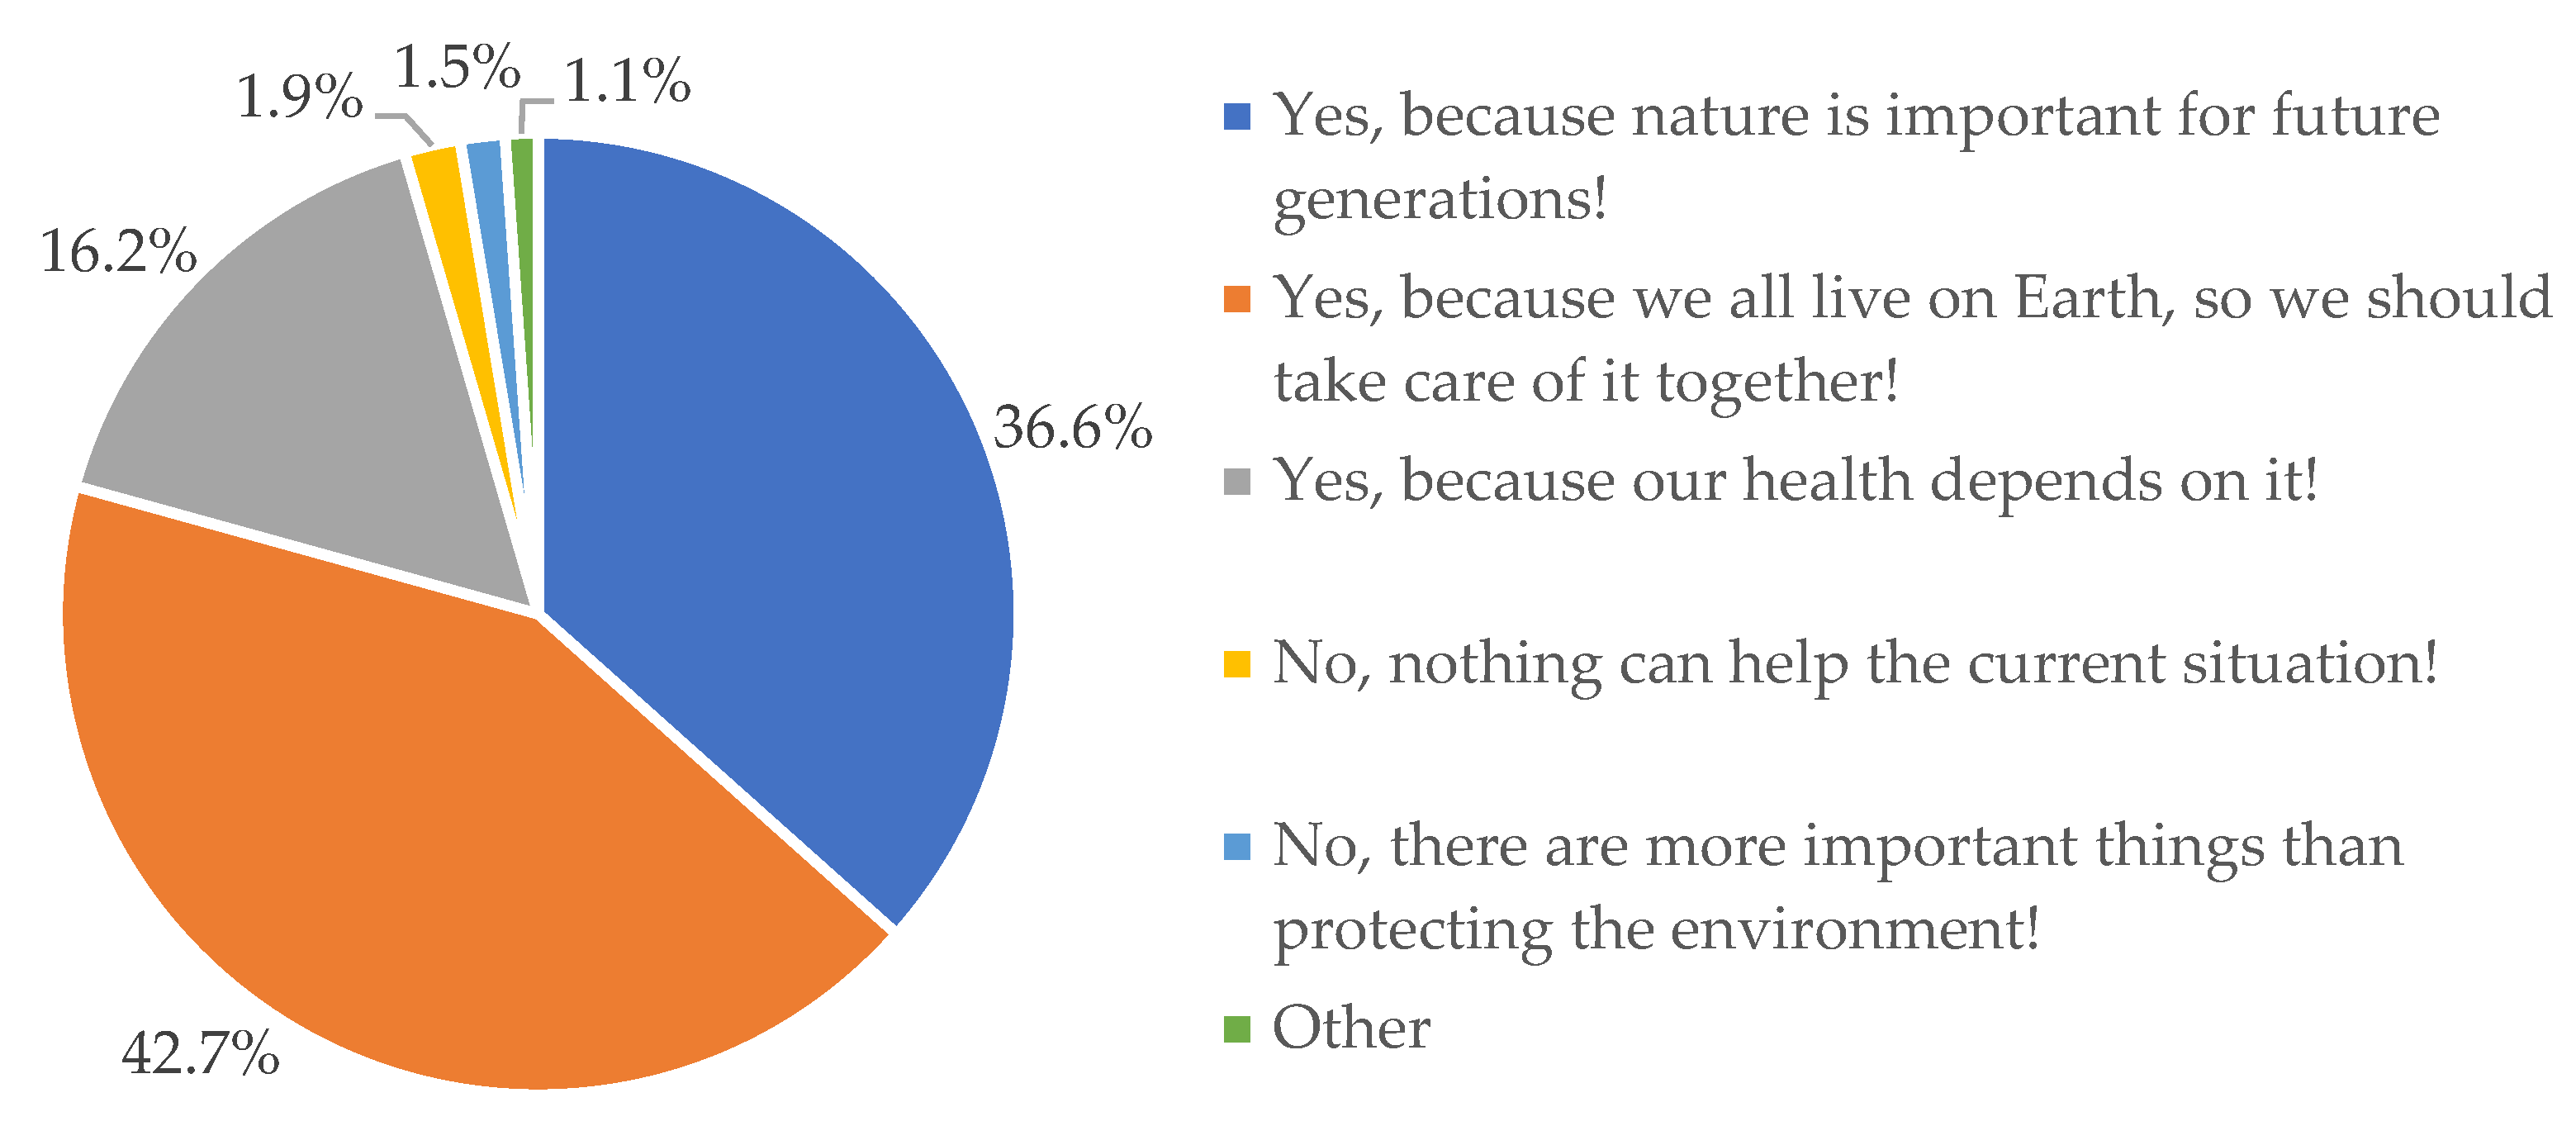
In the case of the question on the importance of the environment, students were allowed to mark only one answer, of which five were suggested by us and four by the students (Figure 4).
The aggregated results (Figure 4) show that 42.7% of students thought the environment was essential because we all live on Earth and must take care of it together. A further 36.6% said that the environment is important because it is as vital for future generations as it is for us now. Health was mentioned by 16.2%, who said that our health depends on the aspect of the environment. A small percentage of students believed that nothing can help the current situation (1.9%) and that there were more important things than the environment (1.5%).
The cross-tabulation analysis showed that there was a weak but significant relationship between the number of classes and the perceived importance of environmental protection (Table 5).
The results show that 8th-grade students were significantly more likely to select the first two answers than university students, meaning that compared to 8th-grade students, university students were less likely to consider environmental protection important (or valuable).
In the environment context, we wanted to know how regularly students used public transport. Figure 5 clearly shows that 39.5% of all students surveyed use some form of public transport daily. Unfortunately, almost a third of students used it only rarely (21.9%) or not at all (10.5%). The obtained results could have been influenced by the financial status of the surveyed students.
The correlation test shows a relationship between class number and frequency of public transport use (Table 6).
Around 65% of 8th graders used public transport several times a week, compared to 31% of students. This result can be considered logical and can be explained in several ways. On the one hand, it has to do with where the students in this group went to school (e.g., they lived in the same municipality as the educational institution, or they had to commute to another municipality). On the other hand, most of the students at university were of the age to have a driving licence and therefore used a car or were in college.
The reasons given by many for not using public transport were that they preferred to walk or cycle due to the proximity of schools and the size of the settlement. Closely related to this was the question of how they most often used public transport. According to the survey, most students used the bus (38.5%), a further 32.8% walked most often, 25% drove, and only a few used bicycles (2.9%) or trains (0.8%).
In the primary research, we also used the Likert scale analysis, where students were asked to rate the importance of a predefined statement on a scale of 1 to 6 (where 1 = least important and 6 = most important). In the study, the paired scaling method was used, using single-question and multiple-question scales, as one of our main objectives for the environmental awareness aspects was to determine whether or not the students were environmentally aware. An average was calculated from the aggregated results (n = 2180), which shows the order of the statements according to the evaluation criteria of students.
Based on the results for some statements related to the environment and environmental problems (Figure 6), the statement “People have a sense of responsibility for the environment” was the least typical (3.17) according to respondents. Slightly more typical were the statements that “People can change their environment to meet their needs” (4.32) and “We need to change our consumption habits to reduce environmental problems” (4.41). Of the four statements, the average rating of the impact of environmental problems on our health was 5.24, which also indicates that students were aware that even at such a young age, the increase in environmental problems is causing many chronic diseases in humans.
Our survey also examined how much students focus on buying organic food and whether they are familiar with the organic label system. There were no significant differences between the groups studied. The results show that 25.3% of the students paid attention to buying organic, which indicates a positive attitude. However, 41.6% did not pay attention to it, and another 33.1% were unaware of these foods. For those who preferred these products, we were also interested to know if they were familiar with the eco-blend scheme and its certification. The results showed that almost 70% of students knew about eco-blends, but only 11.1% preferred these products. For 44.3%, this was not a primary consideration when making a purchase, and for 14.2% of students, even though they were aware of these labels, they did not buy these products, which may be mainly due to pricing. In addition, 30.4% did not know eco-labels.
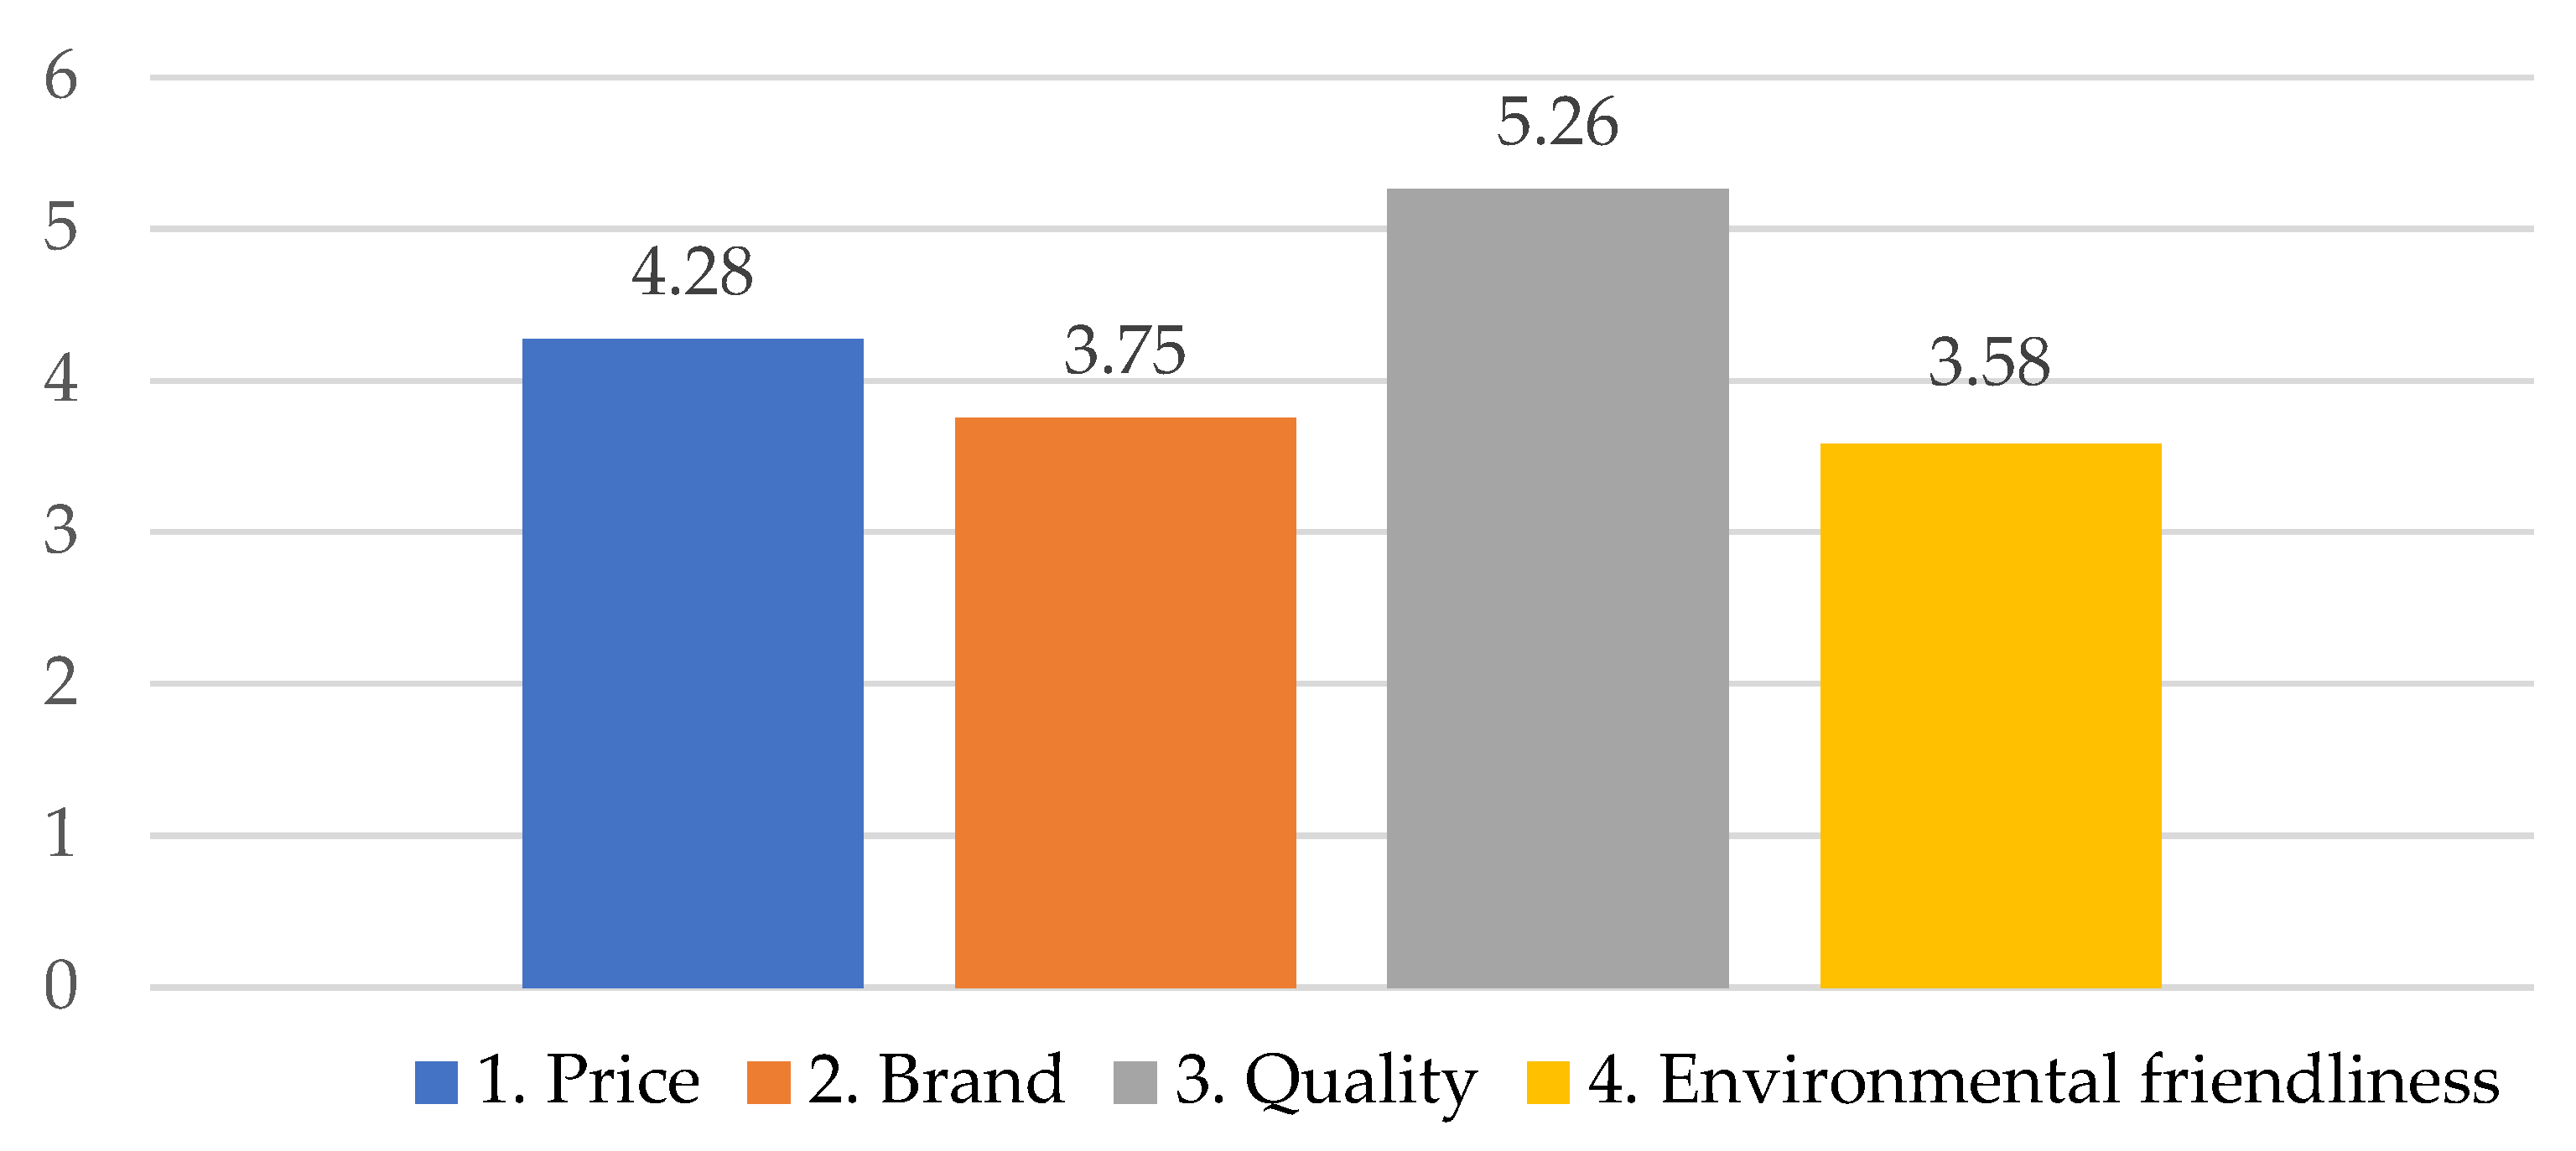
Again, scaling was used to examine how important each listed product characteristic was to students when shopping. The results (Figure 7) show that the least important aspect was environmental friendliness (3.58), which is interesting in light of the previous results. The increasing fashion orientation of recent years and the push forward of various advertising campaigns has not fully influenced the students’ attitudes in the micro-region, as the average of the results obtained shows that brand was also a less important (3.75) product characteristic for them. In contrast, price (4.28) was slightly more important, but quality (5.26) was the essential factor they prioritised when buying a product.
The results thus show that the relationship between price and quality is not a negligible factor, as it contributed significantly to the decision-making process when making purchases.
We also used ANOVA to test whether there was a relationship between a class number and product characteristics (Table 7).
The results obtained statistically confirm that the preferences for “price”, “brand”, and “environmental friendliness” was affected by age specificity, while the preference for “quality” was not. Scheffe’s test reveals that university students (4.7) tended to be more price sensitive compared to elementary (4.1) and high school students (4.3). In our view, one reason for this is that university students are already self-sufficient significantly, while primary school students are more dependent on their parents and have no income. There is also a further correlation in environmental friendliness, with primary school students having a higher level of this characteristic (3.9) compared to university students (3.2), further reinforcing the finding that primary school students have a more assertive attitude towards environmental friendliness compared to university students.
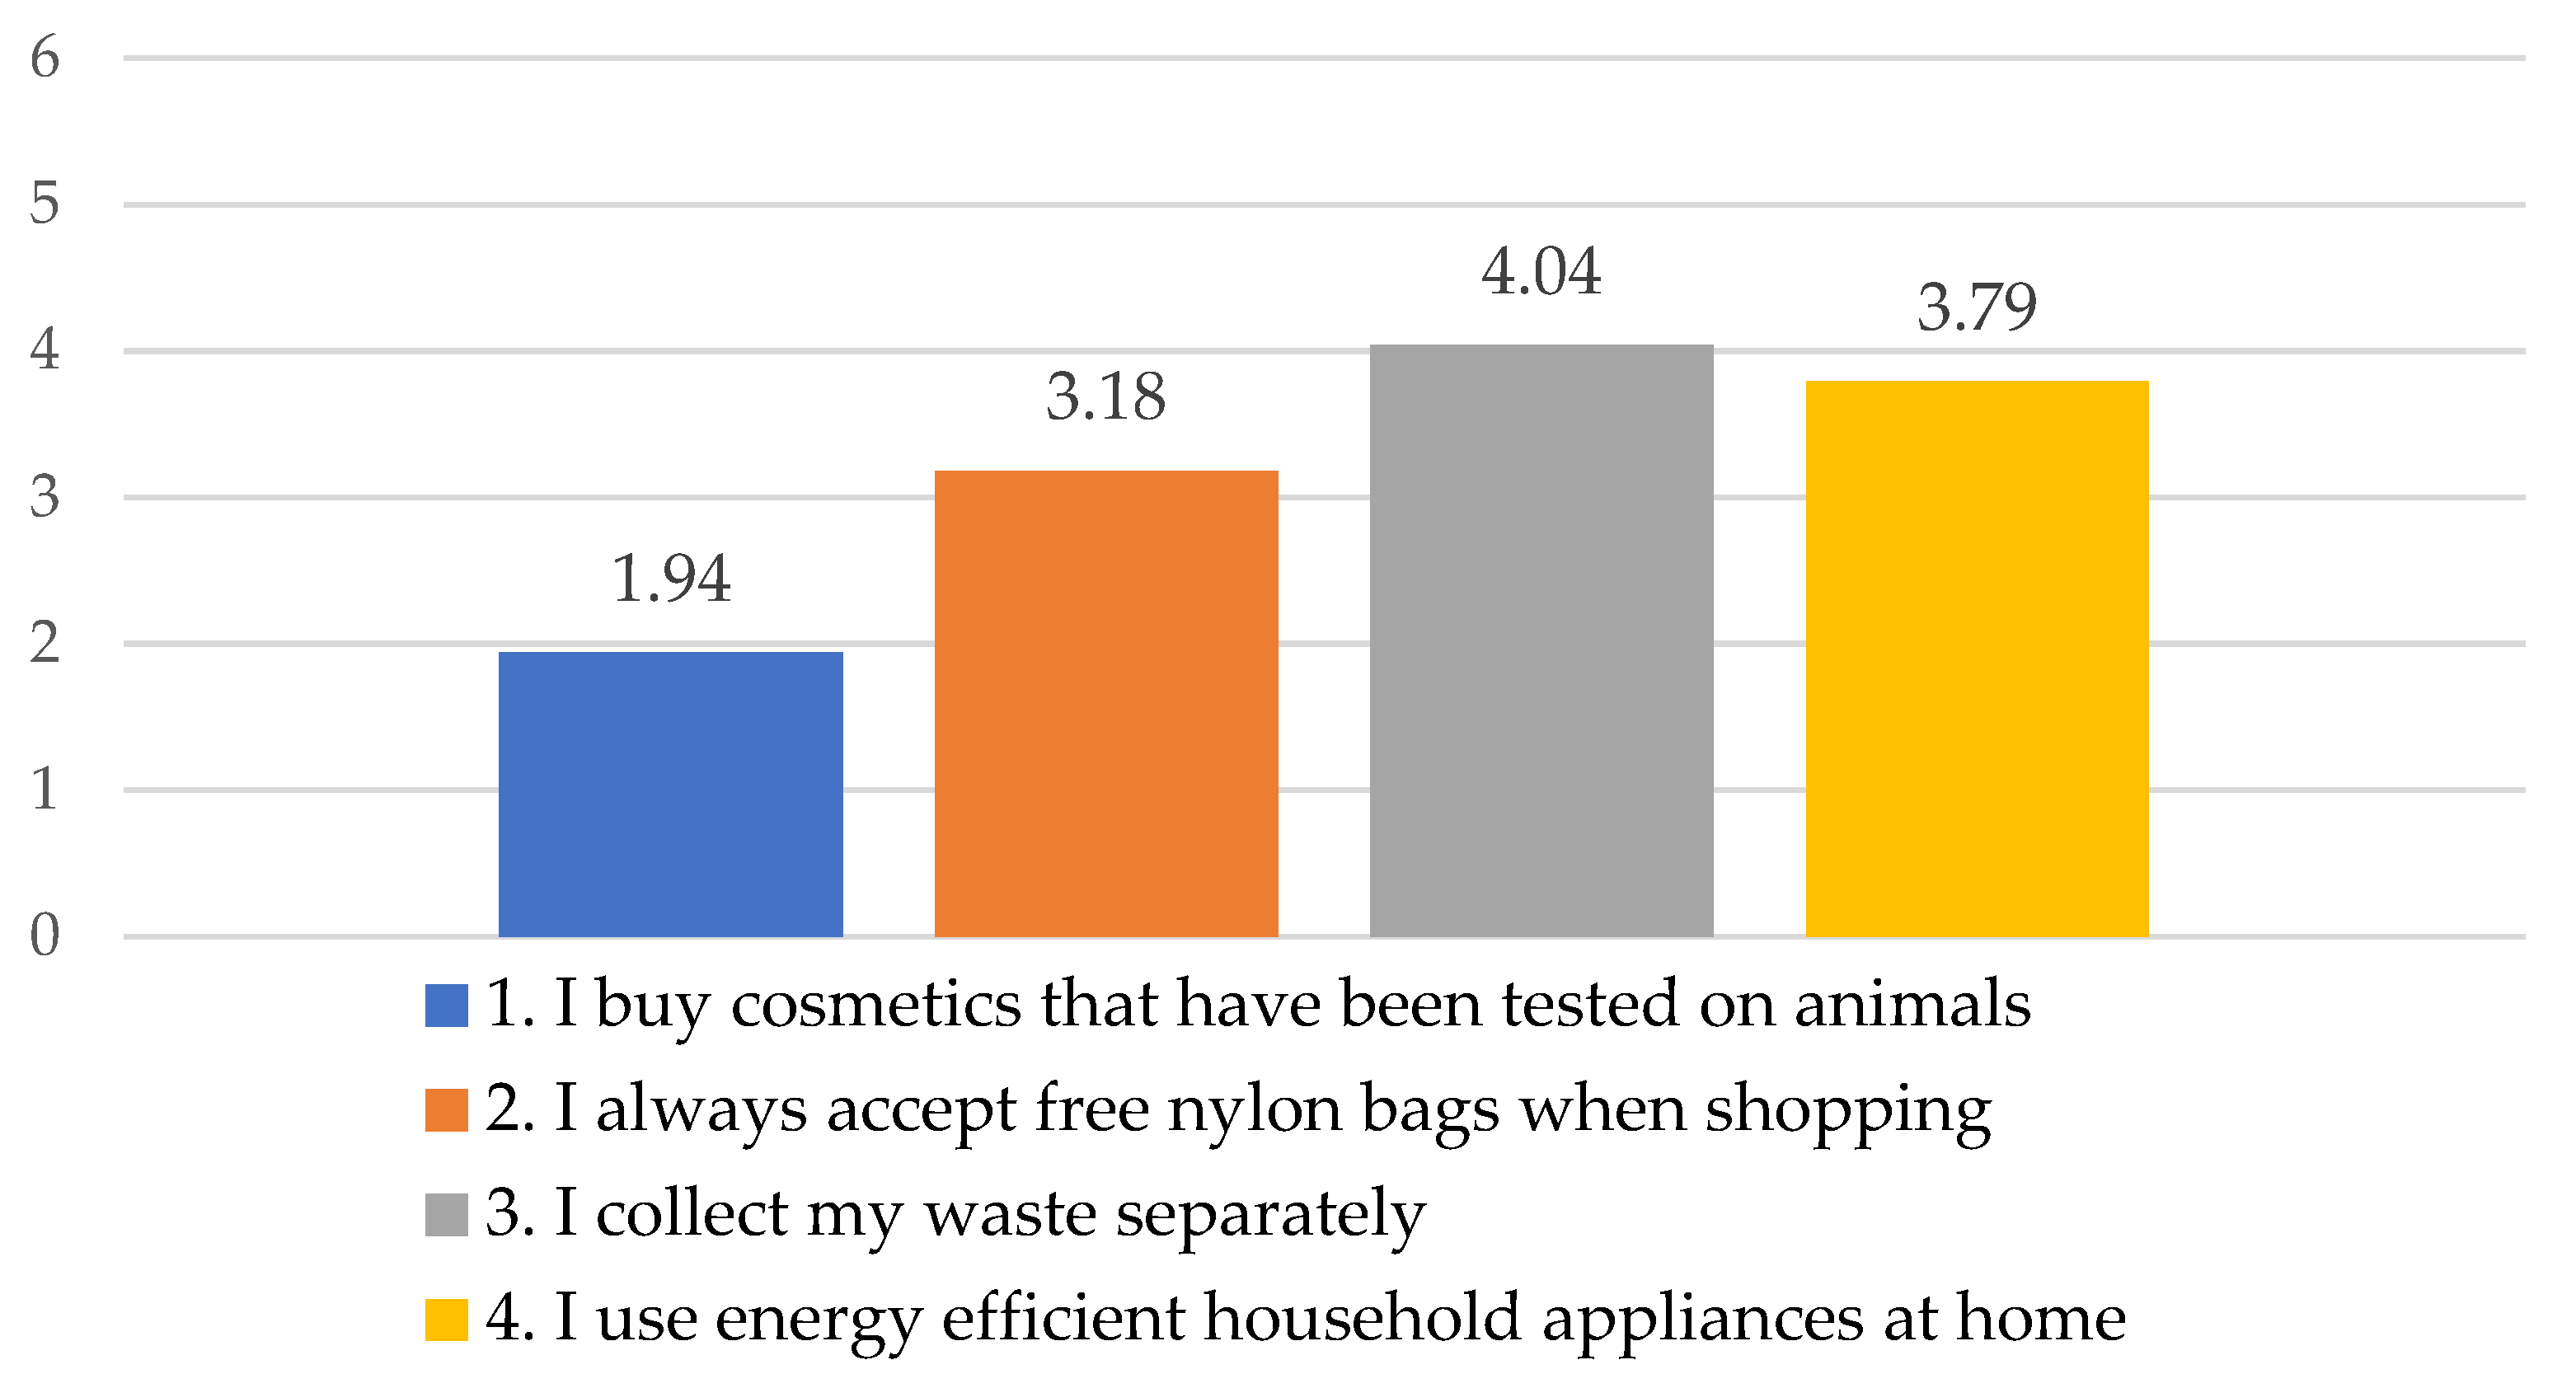
We further investigated students’ environmental awareness, i.e., the extent to which students were aware of certain statements (Figure 8). The investigation was also based on a Likert-scale question, with the difference that for this question, the lower the mean score, the better the result.
The responses show that they were not likely to buy cosmetics tested on animals—if they could be checked at the time of purchase (1.94). Around half of the students typically always accepted free nylon bags when making a purchase (3.18). In this context, there have been many sudden changes in the new programming period from 2020, as one of the EU’s priority plans is to phase out plastic straws, cups, cutlery, plates and nylon bags entirely and replace them with paper alternatives. The average score of 3.79 for energy-saving household appliances shows that most students surveyed used energy-saving appliances, which is not a bad result overall from an environmental point of view, similar to the average score of 4.04 for separate waste collection. This result is not particularly good given the current climate challenges, as there are the EU Member States where this rate reaches 80% at the national level (e.g., Germany).
Regarding environmental awareness, only 3.05% of respondents were members of an environmental organisation. Neither the primary research nor the study went into the reasons for this in detail, nor did we compare this with the adult age group, but it is one of the main objectives for future research.
One of the simplest and most important questions was whether the students surveyed thought environmental education was important, and 82.06% of students said it was necessary, preferably from a very young age, but 17.94% said it was not important because it is possible to contribute to environmental protection independently of targeted environmental education. In this case, it is also worth highlighting the distribution of students who did not think environmental education was important by group, as this allows us to conclude the future attitudes of younger generations, at least in the micro-region under study. The distribution is as follows: 66% of university students, 19.5% of secondary school students and 14.5% of primary school students were among the 17.94% who did not consider environmental education important.
The other theme of the questionnaire consisted of questions related to communication, including online communication.
As for the operating system of the smartphones used by students, 69.6% used Android, 24.8% used Apple’s iOS, 3.5% used some other systems, and 2.1% did not use a smartphone.
As a condition for modern solutions, we looked at students’ IT tools and how often they used them. We found 97.9% of students had a smartphone, and this was the device they used most often. As more than one answer could be marked, it was immediately apparent that a significant proportion of students had more than one device. Within the household, more students simultaneously had a portable notebook, laptop (71.1%) and desktop PC (64.6%). Several reasons for this were given during our interviews, such as the need for laptops to carry out school tasks as they are easily portable devices, but the performance of these machines is, in most cases, only sufficient for office use. The turning point starts with tablets (51.4%), which can be functionally replaced by laptops, for example.
Our research also examined what news topics students read on Facebook, YouTube, Instagram, Snapchat, Pinterest and Twitter and how often they did so. A summary of the results shows that 4.5% of students always read a significant proportion of the news. As there were no significant differences between the groups studied on this question, the results were not analysed separately. Overall, most students (64.9%) preferred to read news on social media platforms, but only news that interested them, while 24.2% rarely read news on social media platforms, and a further 6.4% only read news from credible sources or news portals.
Related to the next question, we were curious that if they are already reading news, what were the main topics they were interested in based on the abovementioned social media platforms. The maximum marking possibility was three to this question, but they could also add additional categories (e.g., Formula 1, economic news, dance, etc., see Figure 9).
An important topic for the study was news about nature and the environment, which interested only 8.4% of students. The results so far show that, on the whole, students considered themselves to be environmentally aware and tried to contribute to environmental protection in several ways (especially primary school students). However, very few of them were aware of this topic on their own, which suggests that most of their knowledge was acquired in educational institutions in the context of lessons. In our opinion, news reading habits may differ according to age, so different sources inform students according to many categories. The environment (and related issues such as sustainability, renewable energy and other changes in attitudes towards the environment, etc.) can be considered among the more complex news topics, especially if looking at whether individual students were exposed to this topic late (in the 11th–12th grades of secondary school or during their university years). Therefore, it was considered necessary to investigate the relationship between the students’ class size and their news reading habits on environmental issues using a statistical method. The result proved to be interesting, as—unexpectedly—there was no statistically significant relationship (Table 8) (n = 2162).
This result means that, regardless of class (and age), all the groups studied had broadly similar news reading habits. The students explained the low interest due to their fundamental interest in green and renewable energy-related articles. However, they perceived that this was not the media’s top priority and that the SEO system (which looks at the user’s search habits based on keywords or phrases and displays news accordingly) made these topics more difficult to access. The most read news items included IT (27.5%), online and console games (33.1%), fashion (44.1%), sports (53.5%) and daily news (38.8%), which are typically categorised by the user on social media platforms, making them more difficult to classify or measure. Not surprisingly, for all three groups studied, the most frequently read category was news about movies and music (63.4%). At the same time, it was more surprising that they were interested in political news at a very young age (21.3%, of which 5% were primary school students and 8.2% were secondary school students), which again could be a reasonable basis for a further study that could be approached from a psychological perspective.
Staying on the news topic, we felt it necessary to ask whether they only read news related to the environment and renewable energy on social networking sites. The results show that 56.6% of the students surveyed (24.2% of primary school students, 19.8% of secondary school students and 12.6% of university students) do not read any news on this topic. Of the other 43.4% (comprising 8.6% of primary school students, 28.1% of secondary school students and 6.7% of university students) who were used to such news, 23.4% read it, 66.8% only read excerpts, while the remaining 9.8% did not consider it important and therefore most did not open the link themselves. An interesting result is that even though 43.4% of students encountered news related to environmental awareness and renewable energy, only 23.4% read these articles thoroughly, indicating that they did not attach enough importance to the articles or the source from which the article came.
We also wanted to know if students had ever encountered an application related to the environment and renewable energy (Figure 10). The results show that 10.4% of students had not only encountered but also used it regularly. A further 27.1% had encountered it in some form—maybe even tried—but did not use it. A significant proportion of students (62.5%) had never encountered an app on this topic, which makes it likely that they were not even interested in such an application at the level of a search. From an economic and service management perspective, there is considerable potential in such an application, provided it is well structured, informative, and can be downloaded on many, if not all, operating systems, which further increases the factors for its success. The key consideration is, therefore, to structure, promote and tailor the application to exploit the potential of 62.5% of the students.
In the last part of the student questionnaire, we asked if they currently used or planned to invest in any type of renewable energy source at home (e.g., solar panels, solar collectors, heat pumps, wind turbines, etc.) and, if so, what type. Roughly 10% used mainly solar panels, with a value range of roughly between HUF 350.000 and HUF 3 million (100 HUF = 0.24 USD). The second group (32.9%) included those who did not currently use it but were planning some related investment in the future, also for installing solar modules—either in the form of a tender or privately. The third group (57.4%) did not currently use renewable energy at home and did not plan to invest in this area. The interviews with the students revealed that there was no category of tenders managed at the state or local government level for their parents or relatives to tender for the installation of renewable energy.

4. Discussion

Global climate change’s increasing impacts are threatening us [50]. Severe deterioration in air quality [51]; exponentially rising disease rates due to CO2 emissions [52,53]; the threat of desertification and erosion caused by forests and natural areas that have been drastically reduced for decades [54]; the maintenance and development of new technologies that consume enormous amounts of energy [55]; the loss of biodiversity and the environmental threats posed by inappropriate rates of fossil fuel use [56] are all issues that need to be addressed. Although the global closures caused by the COVID-19 pandemic led to a brief improvement in air quality and CO2 emissions, the situation has since worsened several times over as restrictions have been lifted.
There have been several major primary studies on climate change and knowledge (including [57,58,59]), which have examined the general attitudes of young people (primary and secondary school), young adults (18–29 years old) and the general population towards climate change, climate disaster, environmental sustainability and environmental protection at the level of several target groups. For example, research by Dijkstra and Goedhart [57] found that female underage students had more negative attitudes towards these issues than male underage students. In contrast, Christensen and Knezek [58] found that adult women were more optimistic about enforcing measures to address environmental problems and more involved in programmes designed to protect the environment than adult men. According to a population-based study by Corner et al. [59], which involved more than 1560 participants, several attitudes can be observed in the population, which are grouped as follows:
  • More than half of the people surveyed (58%) believed that without the necessary changes, climate catastrophe will occur, causing significant destruction to the ecosystem, and were willing to contribute to some form of environmental protection to avoid this. They call for swift action and the swift intervention of legislative and regulatory policies.
  • A quarter of the population (23%) believed that climate catastrophe will occur sooner than the date predicted by scientists but that avoiding it is no longer feasible or only marginally possible. They agreed that significant positive change can only be brought about by drastic legislation or regulation.
  • Nineteen percent of the population surveyed believed that there are other causal relationships between climate catastrophe and environmental sustainability problems and that they cannot be addressed only by reducing pollution or by efforts to reduce fossil energy use. A change in attitude and a change in mindset at the grassroots level are needed to shape the environmental factors that can affect climate and environmental change.
The important conclusion is that to avoid climate catastrophe, it is imperative to identify and implement immediate options to mitigate these destructive processes [60,61]. We believe that the individual thinking and attitude of each person is a relevant factor in environmental sustainability, increased use of renewable energy and climate change, especially as we have serious problems to solve and less and less time to do so [62,63]. We believe that the main problem is not environmental change and the extremes that this entails (as these were present in the past) but that these changes are continuous and multiple over a much shorter period, making it more challenging to adapt to them.
As discussed above, the current generation’s needs can only be met by the level of environmental resources currently available [64]. Our Earth has limits to its carrying capacity, which includes environmental carrying capacity [65]. In a stable environment, the maximum number of individuals of a given species can survive, but one of the factors to consider is that our environment is constantly changing, and humans are not the only living organisms on Earth that use environmental resources [66]. The environmental changes caused by humans are accelerated by technological progress, one consequence of which is, for example, the overuse of fossil fuels, steadily reducing our environment’s carrying capacity [67]. Many have tried to determine the carrying capacity of our planet’s population using various methods, categorised from a low of 1.5 billion to a high of 800 billion people [68,69,70].
In our study, we also briefly touched on the environmental aspects of Hungary, for which there are several opportunities, such as the use of renewable energy sources, mainly biomass and solar energy; significant environmental tax revenues; public environmental investments supported by substantial EU funding; decreasing waste generation and increasing recycling; and increasing the extensive network of protected areas. Future challenges and areas for further development require greater attention, such as heavy dependence on fossil fuels; ageing and rapidly growing vehicle fleets; high health risks associated with air pollution in major cities; a backlog in eco-innovation; and low levels of environmental awareness among the younger generation [71,72,73]. In Hungary, no representative primary research of a similar level has been carried out to investigate the complex environmental attitudes of primary and secondary school students and university students, so our present study is timely and relevant.
Scientists have recently explored the relationship between education and environmental skills. An example is a study by Coertjens et al. [74] in Flemish schools. The results show that gender, immigrant status, socioeconomic status and educational pathway are essential in explaining students’ attitudes and environmental awareness. In addition, it was found that schools, where science is taught practically, are associated with a higher environmental awareness among students. Classes related to environmental science are associated with more environmentally friendly attitudes of students. In our research, knowledge about ecological attitudes was passed on in subjects such as geography and biology. Lee [75] also pointed to geography as an object for communicating environmental and ecological content in Great Britain, the USA and Australia. Lin and Shi [76] conducted studies in the USA and Canada. They found that awareness, knowledge and pro-ecological attitudes among students were related to the results obtained by students. Nurwidodo et al. [77] carried out research in schools in Indonesia. In the study, 275 students took part. Respondents came from four state high schools. It was found that the school’s type and class significantly impacted the level of environmental awareness of students. There were also differences in outcomes between schools that differed in the curriculum. Khoiri et al. [78] used the example of Indonesia as well, conducting research among 131 students of one of the high schools. They found that the lack of environmental awareness and students’ lack of understanding of their regional potential did not contribute to creating a sustainable environment. Our research also shows that environmental awareness is necessary because it shapes young people’s attitudes in everyday life. Mohamoud et al. [79] conducted research in Malaysian schools. They identified success factors in implementing environmental education. They were as follows: the activities of environmental associations, the role of the teacher as an eco-leader, students, and school management. In our research, we found low participation of students in environmental associations and high importance of schools in environmental education. Susongko and Afrizal [80] surveyed high school students in Indonesia. They found that the higher the students’ socioeconomic status, the lower their environmental awareness. Such dependencies may be characteristic of developing countries, which are resource-intensive and environment-intensive for rapid development. Our research concerned Hungary, which is already an economically well-developed country. In addition, the concepts of sustainable development are implemented within the EU while preserving the natural environment. Wang et al. [81] examined the student population in China in terms of knowledge of ecological assumptions. It turned out that the students who had previously learned about the national strategy in this area were more aware. Michel [82] conducted a study among college students in Canada. She drew attention to the low involvement of higher education in environmental education. Such regularities can also explain the results achieved by us. Perhaps universities assume that young people should be taught all models in primary and secondary schools. Interesting results were presented by Salehi and Farrokhian [83] based on research conducted among high school students in Iran. Greater environmental awareness was associated with the earlier interaction of students with the natural environment, such as farmers’ children. In addition, gender and level of education were also important. Albalushi [84] obtained similar results when studying high school students in Oman. A significant relationship was found between school education level and environmental attitudes and behaviours. At the higher level of school education, slightly better ecological behaviour was achieved than at the lower levels of school education. The school’s environmental programmes and mission moderately impacted environmental attitudes and behaviour.
Additionally, knowledge about the environment seems to have a slightly positive impact on ecological attitudes and behaviour. These results largely coincide with those obtained in our research. We found a moderate impact of school education in its current form on students’ environmental awareness. The literature review shows that our research is necessary, and it fills the research gap. So far, small student populations have been studied, often not representative of a given region.
Additionally, the scope of questions was quite limited, usually to a few features and regularities. It must also be said that there have been no studies on different levels of education (primary, secondary and tertiary education). Therefore, the regularities could not be compared.
5. Conclusions and Recommendations

5.1. Conclusions

Renewable energy sources, environmental awareness and protection have become more important aspects of our daily lives in recent years. For this reason, we have considered it essential to examine the main aspects of global environmental trends relevant to the environment and environmental protection. The conducted research allowed for several generalisations:
  • Students associated the concept of green living with the themes of environmental protection, recycling, renewable energy sources, environmental protection and healthy living. Most learned about it in kindergarten or the first years of primary school. There were no differences in the level of environmental awareness between primary and secondary school students and students. Hypothesis 1 was rejected.
  • A significant proportion of students were environmentally aware and would like to contribute to the environment in some way, but when it came to their material and financial factors, it was not at all necessary for them that the products they buy have as little impact on the environment as possible. Students tended to base their purchasing decisions on price rather than on the environmental impact of a product.
  • Among the results, it is also worth highlighting the fact that university students first learnt about the importance of environmental awareness much later (typically in the 10th–12th grades of secondary school, but some of them first encountered it during their university studies), so that this kind of attitude formation was less effective for them than for the primary and secondary school students, who, due to their young age, were much more susceptible to changes in behaviour and attitudes that influence this level of behaviour.
  • Students had a broad knowledge of environmental awareness, environmental protection and renewable energy, but their attitudes towards the topics under study were typically passive. At the same time, we found that the skills, knowledge and attitudes of students enabled them to make intensive use of the communication activities taking place on the web in the online space and that, through the right tools and incentives, it is possible to influence young people’s attitudes towards the environment through online communication. Hypothesis 2 has been positively verified.

5.2. Recommendations

We have been able to identify some suggestions and recommendations for our research, which we present in the following points:
  • It would be worthwhile to shift the focus from environmentally friendly products toward products that not only offer the potential for price differentiation to quality products but also make it more worthwhile to buy products that are less or not at all harmful to the environment. These recommendations should be important to manufacturers and policymakers.
  • Our results on the second hypothesis do not include an analysis of students’ social media use, but the results indeed suggest the need for further research analyses, for example, on the psychological factors that influence social media use. Further research should go in this direction.
  • It was confirmed that the students we studied do not spend enough time reading news about environmental awareness and renewable energy. We suggest that an effective solution to this problem would be to stabilise the online education system, which was not addressed in the study or the questionnaire, but which we consider essential to mention, as it does not only concern higher education institutions but all educational institutions in the world at the same time. In that case, it will be possible to start shaping young people’s attitudes in this direction sooner and to teach the next generation even more effectively about alternatives to environmental problems. These recommendations should be important to policymakers.
  • Using our research results, we have the opportunity to create a specific application, focusing mainly on renewable energy, environmental protection and environmental awareness, which will initially be available free of charge on Android and iOS. The main idea is to create high-quality software with an active information network, which can be continuously updated through a database and integrated into online or face-to-face teaching, thus providing helpful support for teachers, educators and experts. For this to work optimally, it is necessary to update the relevant data regularly and to further extend our research to the county, national or even European Union level, depending on the form in which these results can be incorporated into the curriculum. So these are practical possibilities for using our research.
  • Another direction of research may be to repeat them in another region of Hungary. Of course, other authors may repeat our research in other EU countries. It would be interesting to compare the research results in several or a dozen countries that differ in many areas, such as economic development, development of IT services, and the share of renewable energy in energy consumption. Then the analysis would be extended with additional variables.

Author Contributions

Conceptualization, A.S. and Á.P.-V.; methodology, A.S.; software, A.S.; validation, A.S.; formal analysis, A.S. and Á.P.-V.; investigation, A.S.; resources, A.S.; data curation, A.S.; writing—original draft preparation, A.S., Á.P.-V. and T.R.; writing—review and editing, A.S., Á.P.-V. and T.R.; visualization, A.S. and T.R.; supervision, A.S. and T.R.; project administration, A.S. and T.R.; funding acquisition, A.S. All authors have read and agreed to the published version of the manuscript.

Funding

This research received no external funding.

Data Availability Statement

Not applicable.

Conflicts of Interest

The authors declare no conflict of interest.

References

  1. Rokicki, T.; Bórawski, P.; Gradziuk, B.; Gradziuk, P.; Mrówczynska-Kaminska, A.; Kozak, J.; Guzal-Dec, J.D.; Wojtczuk, K. Differentiation and Changes of Household Electricity Prices in EU Countries. Energies 2021, 14, 6894. [Google Scholar] [CrossRef]
  2. Rosenow, J.; Fawcett, T.; Eyre, N. Energy efficiency and the policy mix. Build. Res. Inf. 2016, 44, 562–574. [Google Scholar] [CrossRef]
  3. Godfrey, B. Renewable Energy: Power for Sustainable Future; University Press: Oxford, MI, USA, 2012; pp. 68–73. [Google Scholar]
  4. Bögeholz, S. Nature experience and its importance for environmental knowledge, values and action: Recent German empirical contributions. Environ. Edu. Res. 2006, 12, 65–84. [Google Scholar] [CrossRef]
  5. Kovács, R. Renewable Energy Handbook; Poppy Seed Kiadó: Budapest, Hungary, 2010; pp. 43–49. [Google Scholar]
  6. MacKay, D.J.C. Sustainable Energy without Bullshit; Typotex Kiadó: Budapest, Hungary, 2011; pp. 112–120. [Google Scholar]
  7. Boros, S.; Takácsné György, K. Biofuel as a renewable energy source in Hungary. Acta Car. Rob. 2011, 1, 33–43. [Google Scholar]
  8. Popp, J.; Kot, S.; Lakner, Z.; Oláh, J. Biofuel use: Peculiarities and implications. J. Secur. Sust. 2018, 7, 477–493. [Google Scholar] [CrossRef]
  9. Sembery, P.; Tóth, L. Conventional and Renewable Energies; Szaktudás Kiadó Kft.: Budapest, Hungary, 2004; pp. 55–60. [Google Scholar]
  10. Kunjlata, L. Green Globalization as Green Technology and Renewable Energy. Res. Appl. 2018, 8, 41–54. [Google Scholar] [CrossRef]
  11. Domán, S.; Fodor, M.; Tamus, A. Changes in public perception of alternative energy sources. Gazdálkodás 2010, 54, 92–97. [Google Scholar] [CrossRef]
  12. Szabó, G.; Fazekas, I.; Patkós, C.; Radics, Z.; Csorba, P.; Tóth, T.; Kovács, R.; Mester, T.; Szabó, L. Investigation of public attitude towards renewable energy sources using word association method in Hungarian settlements. Edu. Sci. 2018, 8, 6–24. [Google Scholar]
  13. Durkó, E. Are solid biofuels a competitive solution? J. Centr. Europ. Green Innov. 2013, 1, 45–51. [Google Scholar]
  14. National Development 2030: National Development and Spatial Development Concept (NDPC). 2014. Available online: http://www.terport.hu/webfm_send/4616 (accessed on 20 August 2022).
  15. Klepacki, B.; Kusto, B.; Bórawski, P.; Bełdycka-Bórawska, A.; Michalski, K.; Perkowska, A.; Rokicki, T. Investments in Renewable Energy Sources in Basic Units of Local Government in Rural Areas. Energies 2021, 14, 3170. [Google Scholar] [CrossRef]
  16. Bakos, I.M.; Khademi-Vidra, A. Empirical experiences of the Hungarian alternative food buying communities. Eur. J. Tour. Reg. Dev. 2019, 11, 55–73. [Google Scholar] [CrossRef]
  17. Garcilazo, E.J. Megatrends and Implications for Rural Development Policy. In Investing in Rural Prosperity; Federal Reserve Bank of St. Louise and the Board of Governors of the Federal Reserve System, 2022; Volume 1, pp. 17–27. Available online: https://www.stlouisfed.org/-/media/project/frbstl/stlouisfed/files/pdfs/community-development/investing-rural/investinginruralprosperity-book.pdf (accessed on 20 August 2022).
  18. Bíró, S.; Rácz, K.; Székely, E. The scope of Hungarian rural development after 2013. Gazdálkodás 2013, 57, 15–23. [Google Scholar]
  19. Káposzta, J.; Ritter, K.; Nagy, H. Local Economic Development in Transition Economies: A Tool for Sustainable Development of Rural Areas. In Foreign Direct Investments: Concepts, Methodologies, Tools, and Applications; Information Resources Management Association, Ed.; IGI Global: Hershey, PA, USA, 2020; pp. 522–539. [Google Scholar] [CrossRef]
  20. Rokicki, T.; Ratajczak, M.; Bórawski, P.; Bełdycka-Bórawska, A.; Gradziuk, B.; Gradziuk, P.; Siedlecka, A. Energy Self-Subsistence of Agriculture in EU Countries. Energies 2021, 14, 3014. [Google Scholar] [CrossRef]
  21. Magda, R. The role and impact of renewable energy sources in the domestic agricultural economy. Farming 2011, 55, 575–588. [Google Scholar]
  22. Kucséber, L. Market perception of sustainability after COVID-19. In Proceedings of the Central Europe in the Global Space, Budapest, Hungary, 1 June 2022. [Google Scholar]
  23. Rokicki, T.; Perkowska, A.; Klepacki, B.; Bórawski, P.; Bełdycka-Bórawska, A.; Michalski, K. Changes in Energy Consumption in Agriculture in the EU Countries. Energies 2021, 14, 1570. [Google Scholar] [CrossRef]
  24. Ritter, K. Socio-economic development and employment crisis in agriculture in Hungary. In Regional Aspects of Social and Economic Restructuring in Eastern Europe: The Hungarian Case; KSH: Budapest, Hungary, 2010; pp. 72–89. [Google Scholar]
  25. Káposzta, J.; Nagy, H. Rural development and environmental industries in endogenous development. J. Cent. Europ. Green Innov. 2013, 1, 71–82. [Google Scholar]
  26. Share of Electricity Generated from Renewable Energy Sources. 2020. Available online: https://www.ksh.hu/stadat_files/ene/hu/ene0012.html (accessed on 20 August 2022).
  27. Molnár, S.; Tajthy, T.; Takács, T. Renewable energy and sustainable development in Hungary. Int. J. Glob. Warm. 2022, 5, 204–223. [Google Scholar] [CrossRef]
  28. Hajdu, T.; Hajdu, G. Temperature, climate change, and birth weight: Evidence from Hungary. Popul. Environ. 2021, 43, 131–148. [Google Scholar] [CrossRef]
  29. Szalmáné Csete, M.; Barna, O. Assessment of regional climate innovation potential in Hungary. Int. J. Glob. Warm. 2021, 25, 378–389. [Google Scholar] [CrossRef]
  30. Zia, S.; Noor, M.H.; Khan, M.K.; Bibi, M.; Godil, D.I.; Quddoos, M.U.; Anser, M.K. Striving towards environmental sustainability: How natural resources, human capital, financial development, and economic growth interact with ecological footprint in China. Environ. Sci. Poll. Res. 2021, 28, 52499–52513. [Google Scholar] [CrossRef]
  31. Schäfferné Dudás, K. Multi-Level Understanding of Environmental Awareness and the Study of Environmentally Conscious Consumer Behaviour. Ph.D. Thesis, University of Pécs, Pécs, Hungary, 2008. [Google Scholar]
  32. Rokicki, T.; Perkowska, A.; Klepacki, B.; Szczepaniuk, H.; Szczepaniuk, E.K.; Bereziński, S.; Ziółkowska, P. The Importance of Higher Education in the EU Countries in Achieving the Objectives of the Circular Economy in the Energy Sector. Energies 2020, 13, 4407. [Google Scholar] [CrossRef]
  33. Banerjee, S.B.; Iyer, S.E.; Kashyap, K.R. Corporate Environmentalism: Antecedents and Influence of Industry of Industry Type. J. Mark. 2003, 67, 106–122. [Google Scholar] [CrossRef]
  34. Takácsné György, K.; Domán, S.; Tamus, A.; Horská, E.; Palková, Z. What do the youth know about alternative energy sources-case study from Hungary and Slovakia. Visegr. J. Bioeconomy Sustain. Dev. 2015, 4, 36–41. [Google Scholar] [CrossRef]
  35. Mallick, R.; Bajpai, S.P. Impact of social media on environmental awareness. In Environmental Awareness and the Role of Social Media; IGI Global: Hershey, PA, USA, 2019; pp. 140–149. [Google Scholar]
  36. Szeberényi, A. Environmentally Conscious Lifestyle Analysis Among High School and University Students in a Hungarian Rural Town of the Heves County. Visegr. J. Bioeconomy Sustain. Dev. 2017, 6, 74–78. [Google Scholar] [CrossRef]
  37. Szeberényi, A.; Lukács, R.; Papp-Váry, Á. Examining environmental awareness of university students. Eng. Rural Dev. 2022, 21, 604–611. [Google Scholar]
  38. Herman, L.E.; Udayana, I.B.N.; Farida, N. Young generation and environmentally friendly awareness: Does it the impact of green advertising? Bus. Theory Pract. 2021, 22, 159–166. [Google Scholar] [CrossRef]
  39. Ata, E. Evaluation of Adult Environmental Awareness Behaviours in Terms of Social Learning Theory According to Perceptions of Primary and Secondary School Students. Int. J. High. Educ. 2018, 7, 54–62. [Google Scholar] [CrossRef]
  40. Bartek-Lesi, M.; Mezősi, A.; Pató, Z.; Szabó, L.; Szajkó, G. Renewable energy use in Hungary-an advantage for latecomers? = Renewable energy use in Hungary-The benefit of latecomers? Vez.-Bp. Manag. Rev. 2019, 50, 46–60. [Google Scholar] [CrossRef]
  41. Begley, E. Living Like Ed: A Guide to the Eco-Friendly Life, 1st ed.; Clarkson Potter: New York, NY, USA, 2008; pp. 42–49. [Google Scholar]
  42. Szamek, G. The EU’s climate ambitions, with a special focus on Europe 2020 and Paris. Cent. Eur. Publ. 2017, 10, 182–195. [Google Scholar]
  43. National Spatial Development and Planning Information System (TEIR). Available online: https://www.teir.hu/helyzet-ter-kep/ (accessed on 22 August 2022).
  44. Kassai, R.; Ritter, K. Local rural development programmes in disadvantaged rural areas. Farming 2011, 55, 337–346. [Google Scholar]
  45. Babbie, E. The Practice of Social Research, 15th ed.; Cengage: Boston, MA, USA, 2020; pp. 187–195. [Google Scholar]
  46. Marques de Sá, J. Applied Statistics Using SPSS, 2nd ed.; Springer: Berlin/Heidelberg, Germany, 2007; pp. 142–148. [Google Scholar]
  47. Ketskeméthy, L.; Izsó, L.; Könyves Tóth, E. Introduction to IBM SPSS Statistics, 1st ed.; Artéria Stúdió Kft.: Budapest, Hungary, 2011; pp. 122–165. [Google Scholar]
  48. Sajtos, L.; Mitev, A. SPSS Research and Data Analysis Manual, 1st ed.; Alinea Kiadó: Budapest, Hungary, 2007; pp. 203–223. [Google Scholar]
  49. Székelyi, M.; Barna, I. Survival Kit for SPSS, 1st ed.; Typotex Kiadó: Budapest, Hungary, 2002; pp. 223–266. [Google Scholar]
  50. Hulme, P.E. Adapting to climate change: Is there scope for ecological management in the face of a global threat? J. Appl. Ecol. 2005, 42, 784–794. [Google Scholar] [CrossRef]
  51. Abouleish, M.Z. Indoor air quality and COVID-19. Public Health 2021, 191, 1. [Google Scholar] [CrossRef] [PubMed]
  52. He, Y.; Song, W. Analysis of the Impact of Carbon Trading Policies on Carbon Emission and Carbon Emission Efficiency. Sustainability 2022, 14, 10216. [Google Scholar] [CrossRef]
  53. Chandio, A.A.; Jiang, Y.; Rauf, A.; Ahmad, F.; Amin, W.; Shehzad, K. Assessment of Formal Credit and Climate Change Impact on Agricultural Production in Pakistan: A Time Series ARDL Modeling Approach. Sustainability 2020, 12, 5241. [Google Scholar] [CrossRef]
  54. Kassai, P.; Tóth, G. Agricultural Soil Phosphorus in Hungary: High Resolution Mapping and Assessment of Socioeconomic and Pedological Factors of Spatiotemporal Variability. Sustainability 2020, 12, 5311. [Google Scholar] [CrossRef]
  55. Farkas, S.; Kucséber, L.Z. The cryptocurrencies’ carbon footprint. In Proceedings of the 12th IEEE International Conference on Cognitive Infocommunications (CogInfoCom 2021), Győr, Hungary, 23–25 September 2021; Anon, A., Ed.; IEEE: Piscataway, NJ, USA, 2021. [Google Scholar]
  56. Kalinka, M.; Geipele, S.; Pudzis, E.; Lazdins, A.; Krutova, U.; Holms, J. Indicators for the Smart Development of Villages and Neighbourhoods in Baltic Sea Coastal Areas. Sustainability 2020, 12, 5293. [Google Scholar] [CrossRef]
  57. Dijkstra, E.M.; Goedhard, M.J. Development and validation of the ACSI: Measuring students’ science attitudes, pro-environmental behaviour, climate change attitudes and knowledge. Environ. Edu. Res. 2012, 18, 733–749. [Google Scholar] [CrossRef]
  58. Christensen, R.; Kneznek, G. The Climate Change Attitude Survey: Measuring middle school student beliefs and intentions to enact positive environmental change. Int. J. Environ. Sci. Edu. 2015, 10, 773–788. [Google Scholar] [CrossRef]
  59. Corner, A.; Whitmarsh, L.; Xenias, D. Uncertainty, scepticism and attitudes towards climate change: Biased assimilation and attitude polarization. Clim. Chang. 2012, 114, 463–478. [Google Scholar] [CrossRef]
  60. Kemp, L.; Xu, C.; Depledge, J.; Ebi, L.K.; Gibbins, G.; Kohler, A.T.; Rockström, J.; Scheffer, M.; Schellnhuber, J.H.; Steffen, W.; et al. Climate Endgame: Exploring catastrophic climate change scenarios. Proc. Natl. Acad. Sci. USA 2022, 119, e2108146119. [Google Scholar] [CrossRef]
  61. Simpson, N.P.; Mach, K.J.; Constable, A.; Hess, J.; Hogarth, R.; Howden, M.; Lawrence, J.; Lempert, R.J.; Muccione, V.; Mackey, B.; et al. A framework for complex climate change risk assessment. One Earth 2021, 4, 489–501. [Google Scholar] [CrossRef]
  62. Nolt, J. Casualties as a moral measure of climate change. Clim. Chang. 2015, 130, 347–358. [Google Scholar] [CrossRef]
  63. Butler, C.D. Climate change, health and existential risks to civilisation: A comprehensive review (1989–2013). Int. J. Environ. Res. Public Health 2018, 15, 2266. [Google Scholar] [CrossRef] [PubMed]
  64. Makhtar, S.Z.; Amirah, A.S.N.; Ab Wahab, M.; Hassan, Z.; Hamid, S. Study of environmental awareness, practices and behaviours among UniMAP students. IOP Conf. Ser. Earth Environ. Sci. 2021, 646, 012061. [Google Scholar] [CrossRef]
  65. Adedoyin, F.F.; Alola, A.A.; Bekun, F.V. An assessment of environmental sustainability corridor: The role of economic expansion and research and development in EU countries. Sci. Total Env. 2020, 713, 136726. [Google Scholar] [CrossRef] [PubMed]
  66. Pimm, S.L.; Jenkins, C.N.; Li, B.V. How to protect half of Earth to ensure it protects sufficient biodiversity. Sci. Adv. 2018, 4, eaat2616. [Google Scholar] [CrossRef]
  67. Neagu, O.; Teodoru, M.C. The relationship between economic complexity, energy consumption structure and greenhouse gas emission: Heterogeneous panel evidence from the EU countries. Sustainability 2019, 11, 497. [Google Scholar] [CrossRef]
  68. Ehrlich, P.R. The Population Bomb, 1st ed.; Ballantine Books: New York, NY, USA, 1968; pp. 32–41. [Google Scholar]
  69. Clark, C. The Economics of Over-Exploitation. Science 1974, 181, 630–634. [Google Scholar] [CrossRef]
  70. Hui, C. Carrying capacity, population equilibrium, and environment’s maximum load. Ecol. Model. 2006, 192, 317–320. [Google Scholar] [CrossRef]
  71. Sustainable Development: Programmes and Initiatives, Environmental Performance and Information Unit (OECD). Available online: https://www.oecd-ilibrary.org/sites/0398df63-hu/index.html?itemId=/content/component/0398df63-hu (accessed on 22 August 2022).
  72. Environmental Performance Reviews 2017, Environmental Performance and Information Unit (OECD). Available online: https://www.oecd.org/environment/country-reviews/OECD_EPR_Hungary_process_HUN.pdf (accessed on 22 August 2022).
  73. Environmental Performance Reviews 2018, Environmental Performance and Information Unit (OECD). Available online: https://www.oecd.org/environment/country-reviews/Magyarorsz%C3%A1g-Kiemelt-ugyek-2018.pdf (accessed on 22 August 2022).
  74. Coertjens, L.; Boeve-de Pauw, J.; de Maeyer, S.; van Petegem, P. Do Schools Make a Difference in Their Students’ Environmental Attitudes and Awareness? Evidence from Pisa 2006. Int. J. Sci. Math. Educ. 2010, 8, 497–522. [Google Scholar] [CrossRef]
  75. Lee, C.K.J. Geographical and environmental education in school curricula. In Oxford Research Encyclopedia of Education; Oxford University Press: Oxford, UK, 2021; Available online: https://oxfordre.com/education/view/10.1093/acrefore/9780190264093.001.0001/acrefore-9780190264093-e-1063 (accessed on 31 August 2022).
  76. Lin, E.; Shi, Q. Exploring individual and school-related factors and environmental literacy: Comparing US and Canada using PISA 2006. Int. J. Sci. Math. Educ. 2014, 12, 73–97. [Google Scholar] [CrossRef]
  77. Nurwidodo, N.; Amin, M.; Ibrohim, I.; Sueb, S. The role of eco-school program (Adiwiyata) towards environmental literacy of high school students. Eur. J. Educ. Res. 2020, 9, 1089–1103. [Google Scholar] [CrossRef]
  78. Khoiri, A.; Sunarno, W.; Sajidan, S.; Sukarmin, S. Analysing students’ environmental awareness profile using strategic environmental assessment. F1000research 2021, 10, 305. [Google Scholar] [CrossRef] [PubMed]
  79. Mohamoud, A.S.; Maon, S.N.; Kassim, E.S. Exploring Critical Success Factors of Education for Sustainable Development (ESD) in Malaysia. J. Int. Bus. Econ. Entrep. 2020, 5, 62–72. [Google Scholar]
  80. Susongko, P.; Afrizal, T. The determinant factors analysis of Indonesian students’ environmental awareness in PISA 2015. J. Pendidik. IPA Indones. 2018, 7, 407–419. [Google Scholar]
  81. Wang, R.; Qi, R.; Cheng, J.; Zhu, Y.; Lu, P. The behavior and cognition of ecological civilisation among Chinese university students. J. Clean. Prod. 2020, 243, 118464. [Google Scholar] [CrossRef]
  82. Michel, J.O. An assessment of teaching and learning about sustainability across the higher education curriculum. Environ. Educ. Res. 2019, 25, 1806–1807. [Google Scholar] [CrossRef]
  83. Salehi, S.S.; Farrokhian, F. Evaluating Environmental Skill, Behavior and Awareness of Primary School Students, (Case Study: Andika City). J. Environ. Sci. Technol. 2020, 22, 126–137. [Google Scholar]
  84. Albalushi, H. Environmental Education in Oman: Exploring the Factors Determining Students’ Self-Reported Environmental Attitudes and Behaviours toward Environmental Issues. Doctoral Dissertation, Northumbria University, Newcastle upon Tyne, UK, 2020. Available online: https://core.ac.uk/download/pdf/326516137.pdf3 (accessed on 31 August 2022).
Figure 1. Share of electricity from renewable energy sources in gross final electricity consumption in Hungary, 2005–2021 (%) [26].
Energies 15 07082 g001
Figure 2. Distribution of students surveyed according to when they first learned about environmental education (%).
Energies 15 07082 g002
Figure 3. Distribution of students surveyed according to the subjects in which they learned about environmental awareness and renewable energy (%).
Energies 15 07082 g003
Figure 4. Distribution of students responding to the survey, according to whether they consider environmental protection important (%).
Energies 15 07082 g004
Figure 5. Distribution of students by frequency of use of public transport (%).
Energies 15 07082 g005
Figure 6. Average student perceptions of the examined environmental statements.
Energies 15 07082 g006
Figure 7. Average student perception of specific product characteristics during the purchase process.
Energies 15 07082 g007
Figure 8. Average perception of students according to how typical each statement is for them.
Energies 15 07082 g008
Figure 9. Distribution of students’ news reading habits on social media platforms (%).
Energies 15 07082 g009
Figure 10. Distribution of students according to whether they had ever encountered an environmental, renewable energy app (%).
Energies 15 07082 g010
Table 1. Share of electricity produced from renewable energy sources in Hungary by energy type, 2010–2020 (%) [26].
YearTotal Share
(Based on Figure 1)
Including:
BiomassBiogasWindWaterSunRenewable Fraction of Municipal WasteGeothermal
20107.167.43.917.76.20.04.8-
20116.456.47.923.18.20.04.4-
20126.150.48.029.18.00.34.2-
20136.651.39.625.87.60.94.9-
20147.354.09.120.99.62.14.3-
20157.351.49.121.57.24.46.4-
20167.345.810.221.07.97.57.5-
20177.647.310.021.86.310.04.60.0
20188.147.78.916.15.916.74.30.3
201910.037.76.815.54.731.92.90.4
202011.930.15.911.84.444.53.00.3
Table 2. The stages of the research process.
Stages of the Research Process
Stage 1. Literature Review
The role and importance of renewable energy sourcesObjectives of the national dev. and spatial dev. concept for HungaryUse of renewable energy sources in HungaryEmphasising a green approach to the younger generation
Stage 2. Establishing the theoretical background and preparation of research assumptions
Representative primary research, preparation the questionnaireFormulating aims, hypotheses and research questions
Stage 3. Research results
Results from the research questionnaireEcological education in schoolsEnvironmental awareness in schoolsThe role of modern information technologies in increasing environmental awareness
Stage 4. Discussion and conclusions
Discussion and comparison of the obtained research results with the results of other studiesConclusions and recommendations for decision makers
Table 3. Distribution of students participating in the survey of primary research.
Target GroupMethodNumber of Participants
Primary school studentsClass 8 (32.8%)In a standardised questionnaire of 39 questions, a large number of students were asked face-to-face, and a small number of students were asked online, supplemented by oral interviews.N = 716 (32.8%)
Secondary school studentsGrade 9 (11.6%), Grade 10 (15.3%), Grade 11 (10.7%), Grade 12 (10.3%)N = 1043 (47.8%)
University studentsBachelor’s and Master’s students (19.3%)N = 421 (19.3%)
Table 4. The statistical relationship values for relation between age of students and environmental education.
Pearson’s Chi-Square Cramer’s VAsymp. Sig. (2-Sided, p)
311.9600.1990.000
Table 5. The statistical relationship values for relation between the number of classes and the perceived importance of environmental protection.
Pearson’s Chi-Square Cramer’s VAsymp. Sig. (2-Sided, p)
93.4440.1090.000
Table 6. The statistical relationship values for relation between the class number and frequency of public transport use.
Pearson’s Chi-Square Cramer’s VAsymp. Sig. (2-Sided, p)
114.9530.1350.000
Table 7. ANOVA test of correlations between the perception of product characteristics and age by class.
CategoryDev. Sum of SquaresDeg. of Freedom (df)Average Dev. Sum of SquaresF QuotientSig.
PriceBetween groups65.291513.0587.1180.000
Within the group2861.91015601.835
Full2927.2011565
BrandBetween groups70.193514.0397.8370.000
Within the group2788.98615571.791
Full2859.1791562
QualityBetween groups13.71152.7423.1300.008
Within the group1372.07515660.876
Full1385.7861571
Environmental friendlinessBetween groups189.503537.90120.0180.000
Within the group2964.91115661.893
Full3154.4141571
Table 8. The statistical relationship values for relation between the students’ class size and their news reading habits on environmental issues.
Pearson’s Chi-Square Cramer’s VAsymp. Sig. (2-Sided, p)
74.3460.0670.216
Publisher’s Note: MDPI stays neutral with regard to jurisdictional claims in published maps and institutional affiliations.