1. Introduction
Wave energy has great potential to be a large contributor to the global energy market. Studies have shown a high energy potential in harvesting energy from ocean waves and set the global theoretical potential as high as 32.000 TWh/year [
1]. Harvesting wave energy can be done in various ways, from taking advantage of the tidal waves close to the shore to placing a stationary platform out on the sea to harvest the wave energy of the ocean [
2]. A thorough review of wave energy technologies is beyond the scope of this paper, but interested readers can consult papers such as [
3].
Wave energy technologies face various challenges where the harsh sea environments put high demands on the construction being able to withstand continuous water exposure, high waves, strong currents, and winds. One of the main challenges is, that wave energy technologies must be able to harvest energy continuously despite waves changing in amplitude and frequency. Varying waves put a high demand on Power Take-Off (PTO) technology because fluctuating weather and waves place a high demand on agile energy harvesting solutions [
4]. Fluid power technologies has largely been found applicable as PTO systems in wave energy converters, see, e.g., [
5] for a review of fluid power PTO systems.
Floating Power Plants (FPP) combine wind and wave energy on a floating platform featuring a wind turbine and four wave absorbers. Each wave absorber drives a hydraulic PTO system. The FPP power take-off system utilises a Discrete Displacement Cylinder (DDC) technology combined with a fixed displacement hydraulic motor driving an electrical generator. This study investigates control algorithms for a hydraulic PTO system. Only a few other wave energy converter technologies have utilised active discrete fluid power PTO systems. In [
6] a discrete fluid power PTO system is investigated and shows promising potential; however, this system enables bi-directional power flow, whereas the FPP system only supports uni-directional power flow. In [
7], advanced control of the DDC system of [
6] is investigated, and it was found that predictive control with proper wave model for cast may improve energy harvesting.
The hydraulic PTO system may be controlled in various ways by opening and closing valves in the DDC part of the system and by varying the counter torque exerted by the generator through a frequency converter. The control algorithms for the PTO system, called wave power extraction algorithms (WPEA), aim to maximise the energy output to the grid.
There are different methods of categorising different approaches to WPEAs, one of which is categorising them based on power flow direction. When the power flow is bidirectional, the PTO system can affect the absorber’s motion by applying a force in the same direction as the wave motion, enhancing the oscillating motion, and maximising the mechanical energy. This type of WPEA is categorised as reactive control.
The second type of control is resistive control. Here, the power flow is unidirectional, and the PTO system can only extract energy from the absorber motion by applying force opposing absorber movement. Compared to reactive control, this strategy will usually cause a lower mechanical energy absorption. However, it does not mean that the final energy production is always higher for reactive control compared to resistive control, when the conversion losses are considered. The PTO system from Floating Power Plant (FPP) is currently designed to operate with resistive control strategies.
In [
4], it is found that using reactive control to increase power absorption, at the time, had questionable feasibility, but proves that reactive control is beneficial for various PTO systems. Furthermore, ref. [
8] states that reactive control is being improved in terms of its reliability, survivability, effectiveness, and ability to harvest energy. In other words, reactive control still has room for improvement in various areas before nearing the point of commercialisation.
The primary purpose of this study is to improve the WPEA for FPP by exploring different control strategies within the subject of resistive control. In addition, it will be investigated whether an increase in generated power is achieved if the system is modified such that a reactive control approach can be realised. This study will, hence, investigate how to design a WPEA for this novel PTO structure, which has not yet been published. The main contribution is the investigation of control algorithms, hence, WPEAs, for this novel fluid power PTO system design.
First, a description of the physical test setup is given, followed by the main equations forming a non-linear model. Then the optimal torque parameters are calculated and shown with the chosen control cases. Lastly, the WPEAs are created, tested, and implemented on both the simulated model and the test rig. The paper concludes by evaluating the tested control strategies.
2. System Description
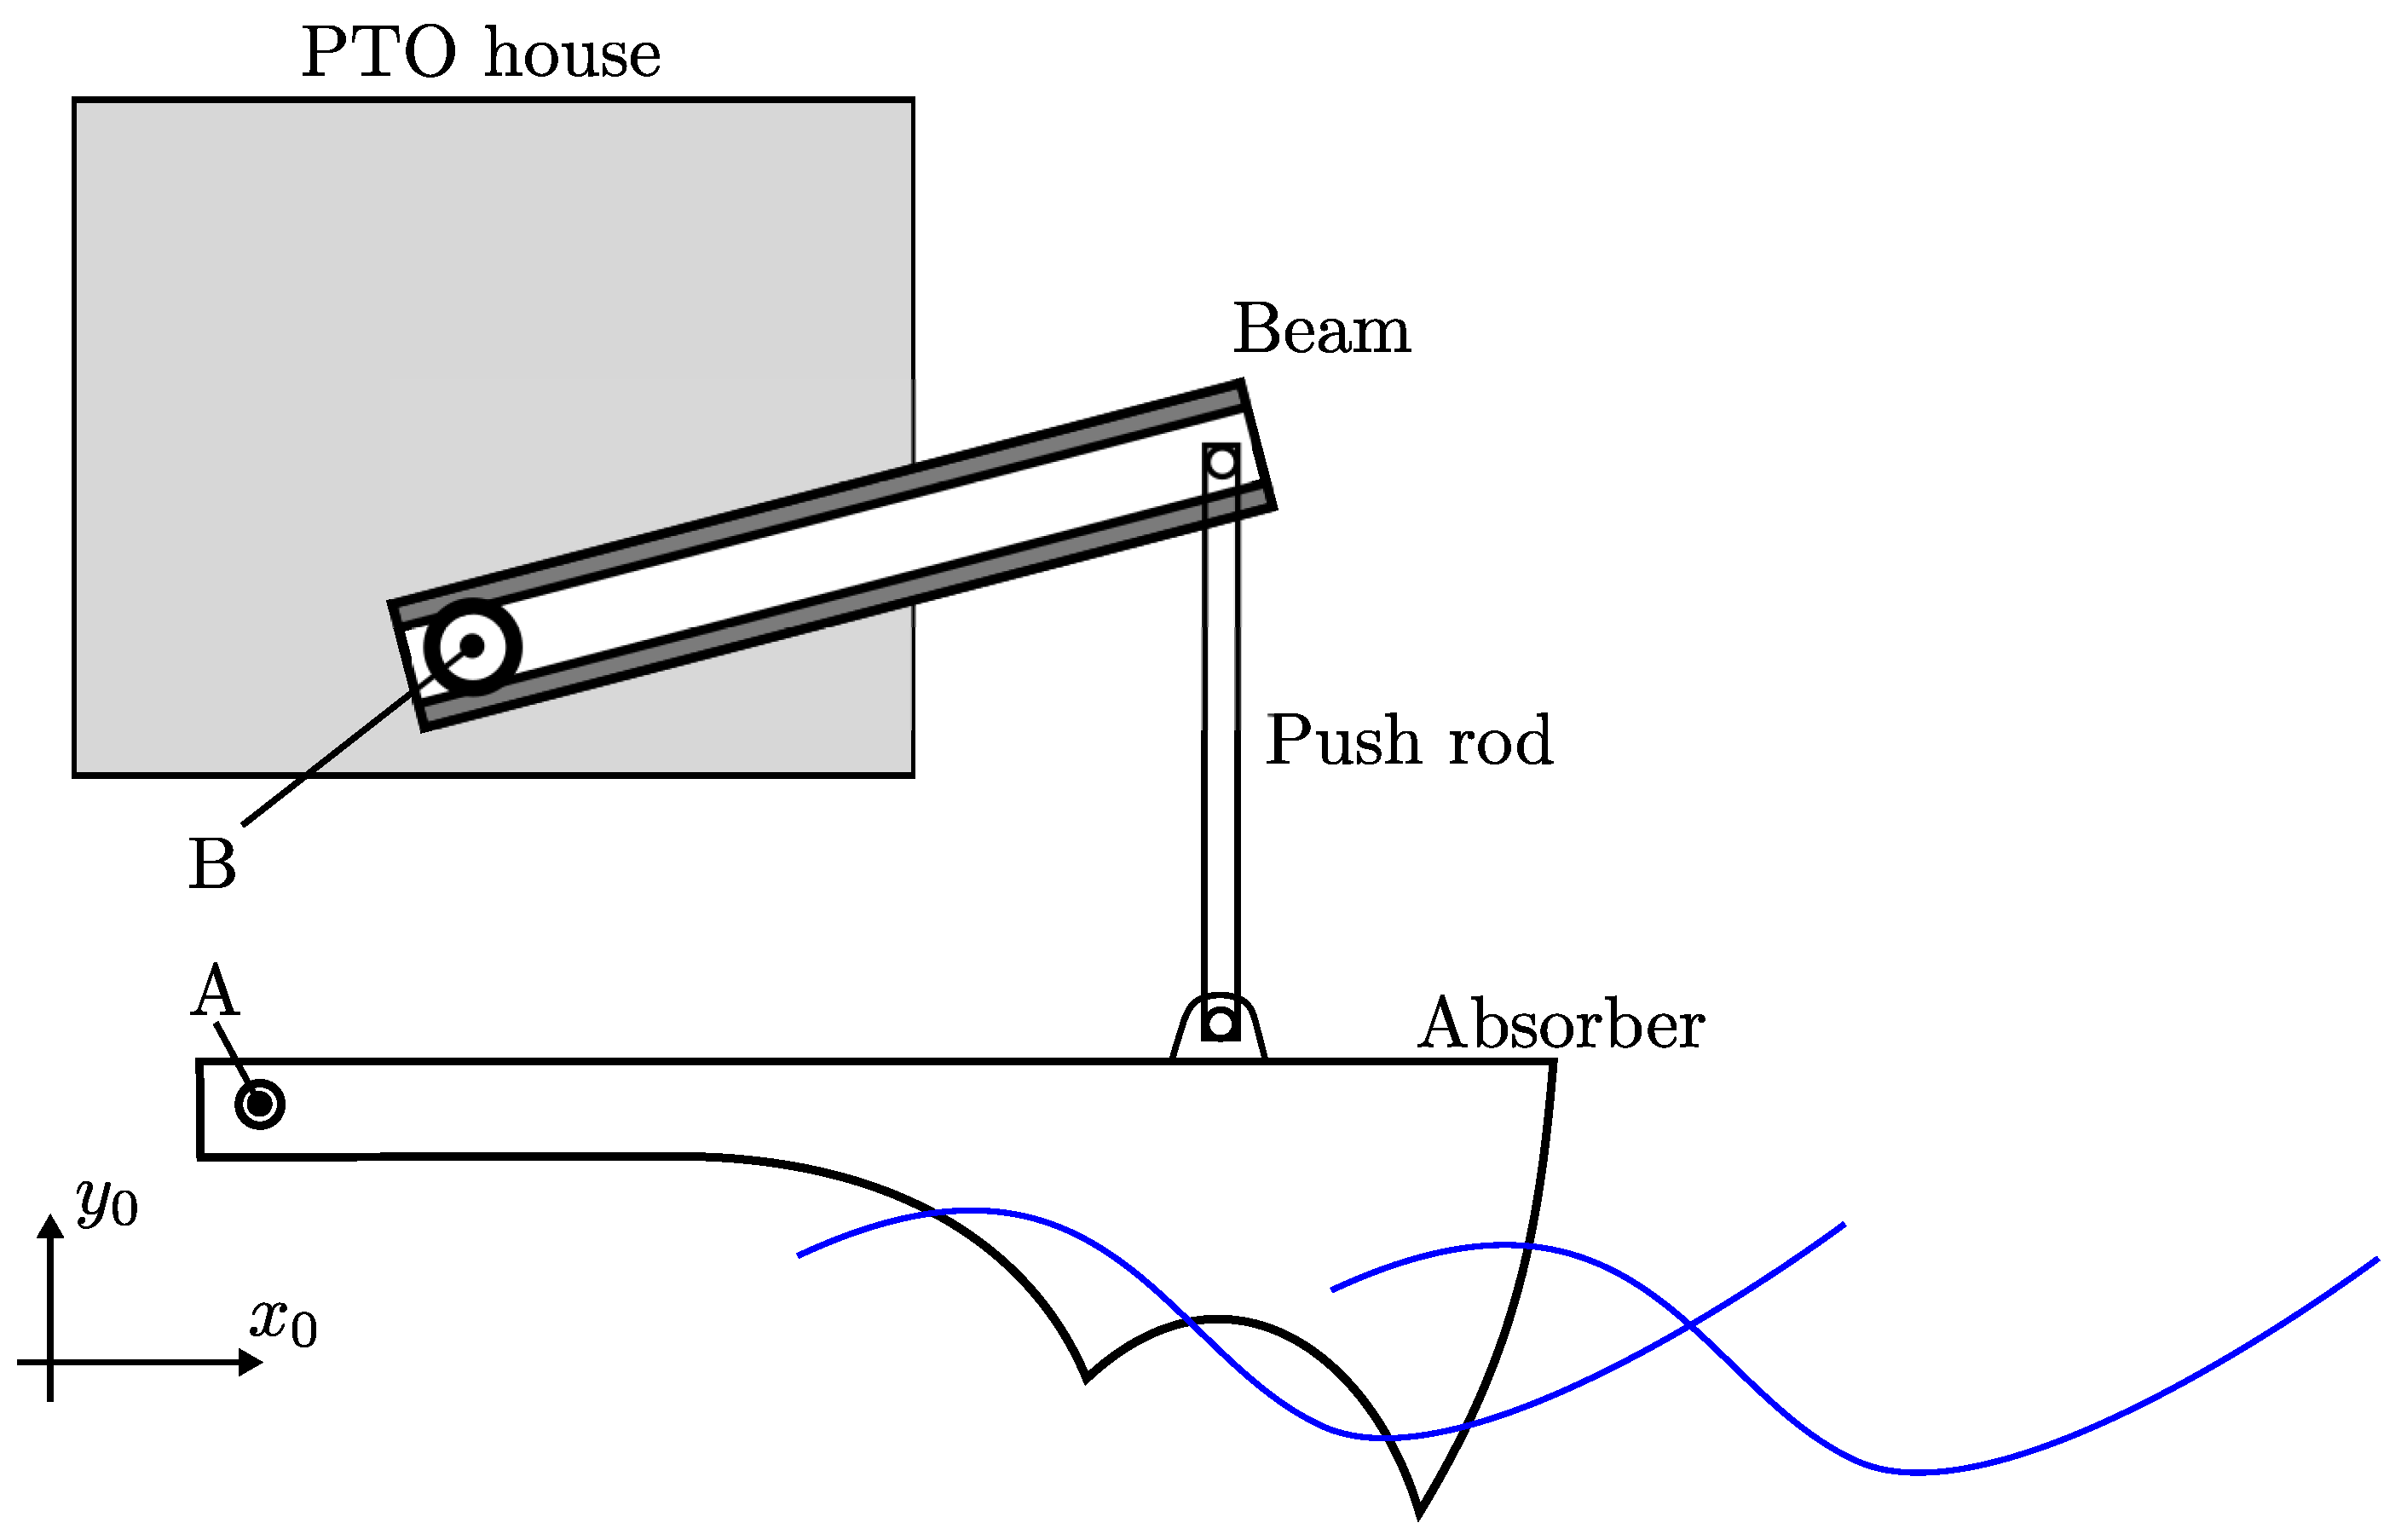
The Floating Power Plants concept consists of a floating platform. This platform carries a wind turbine and four wave energy converters. Each wave energy system consists of a wave absorber hinged to the platform, a push rod, a beam, and a main axle connected to a PTO system located in an indoor area (PTO housing).
Figure 1 illustrates a single-wave energy converter on which the PTO housing and the rotation points A and B are attached and follow the movement of the floating platform. If one imagines a coordinate system 0, which is attached to the floating platform, the points A and B of each wave energy converter is fixed in that coordinate system. Moreover, the four-wave energy converters experience the same
coordinates for their respective A and B point, but their
z coordinate will differ. The four wave energy converters are hence placed equally spaced in the
z direction. The absorber of each wave energy converter rotates around point A, which results in a relative movement between each absorber and the platform. Through the push rod, the beam and the main axle, the absorbers motion is transformed to a bidirectional rotation of the main axle, B. Note that the rotation is non-uniform in amplitude and is in the range of
degrees for the small-scale proof-of-concept wave energy converter.
The hydraulic PTO system, located in the PTO housing seen in
Figure 1, harvests energy from the motion of the main axle, as seen in
Figure 2. The main axle rigidly connects to a yoke connecting two differential cylinders, the PTO cylinders ➀, to the motion of the main axle and, as such, to the absorber. The PTO cylinders function as a piston pump in which the check valves, ➅, connect to the in- and outlet. The outlet, the high pressure or system pressure line, ➁, is equipped with accumulators, ➂, used for smoothing power flow through the hydraulic motor, ➃, driving an electrical generator, ➄. Four on/off valves, ➆, are installed to allow choosing various pumping areas for the cylinders, changing the displacement flow delivered to the system pressure line for each cylinder stroke. However, varying the cylinder areas connected to system pressure also varies the cylinder force and torque applied on the yoke and the absorber. This torque opposing the absorber motions generates power since power equals torque multiplied angular velocity.
2.1. Physical Test Setup
A small-scale test system is provided by Floating Power Plant A/S [
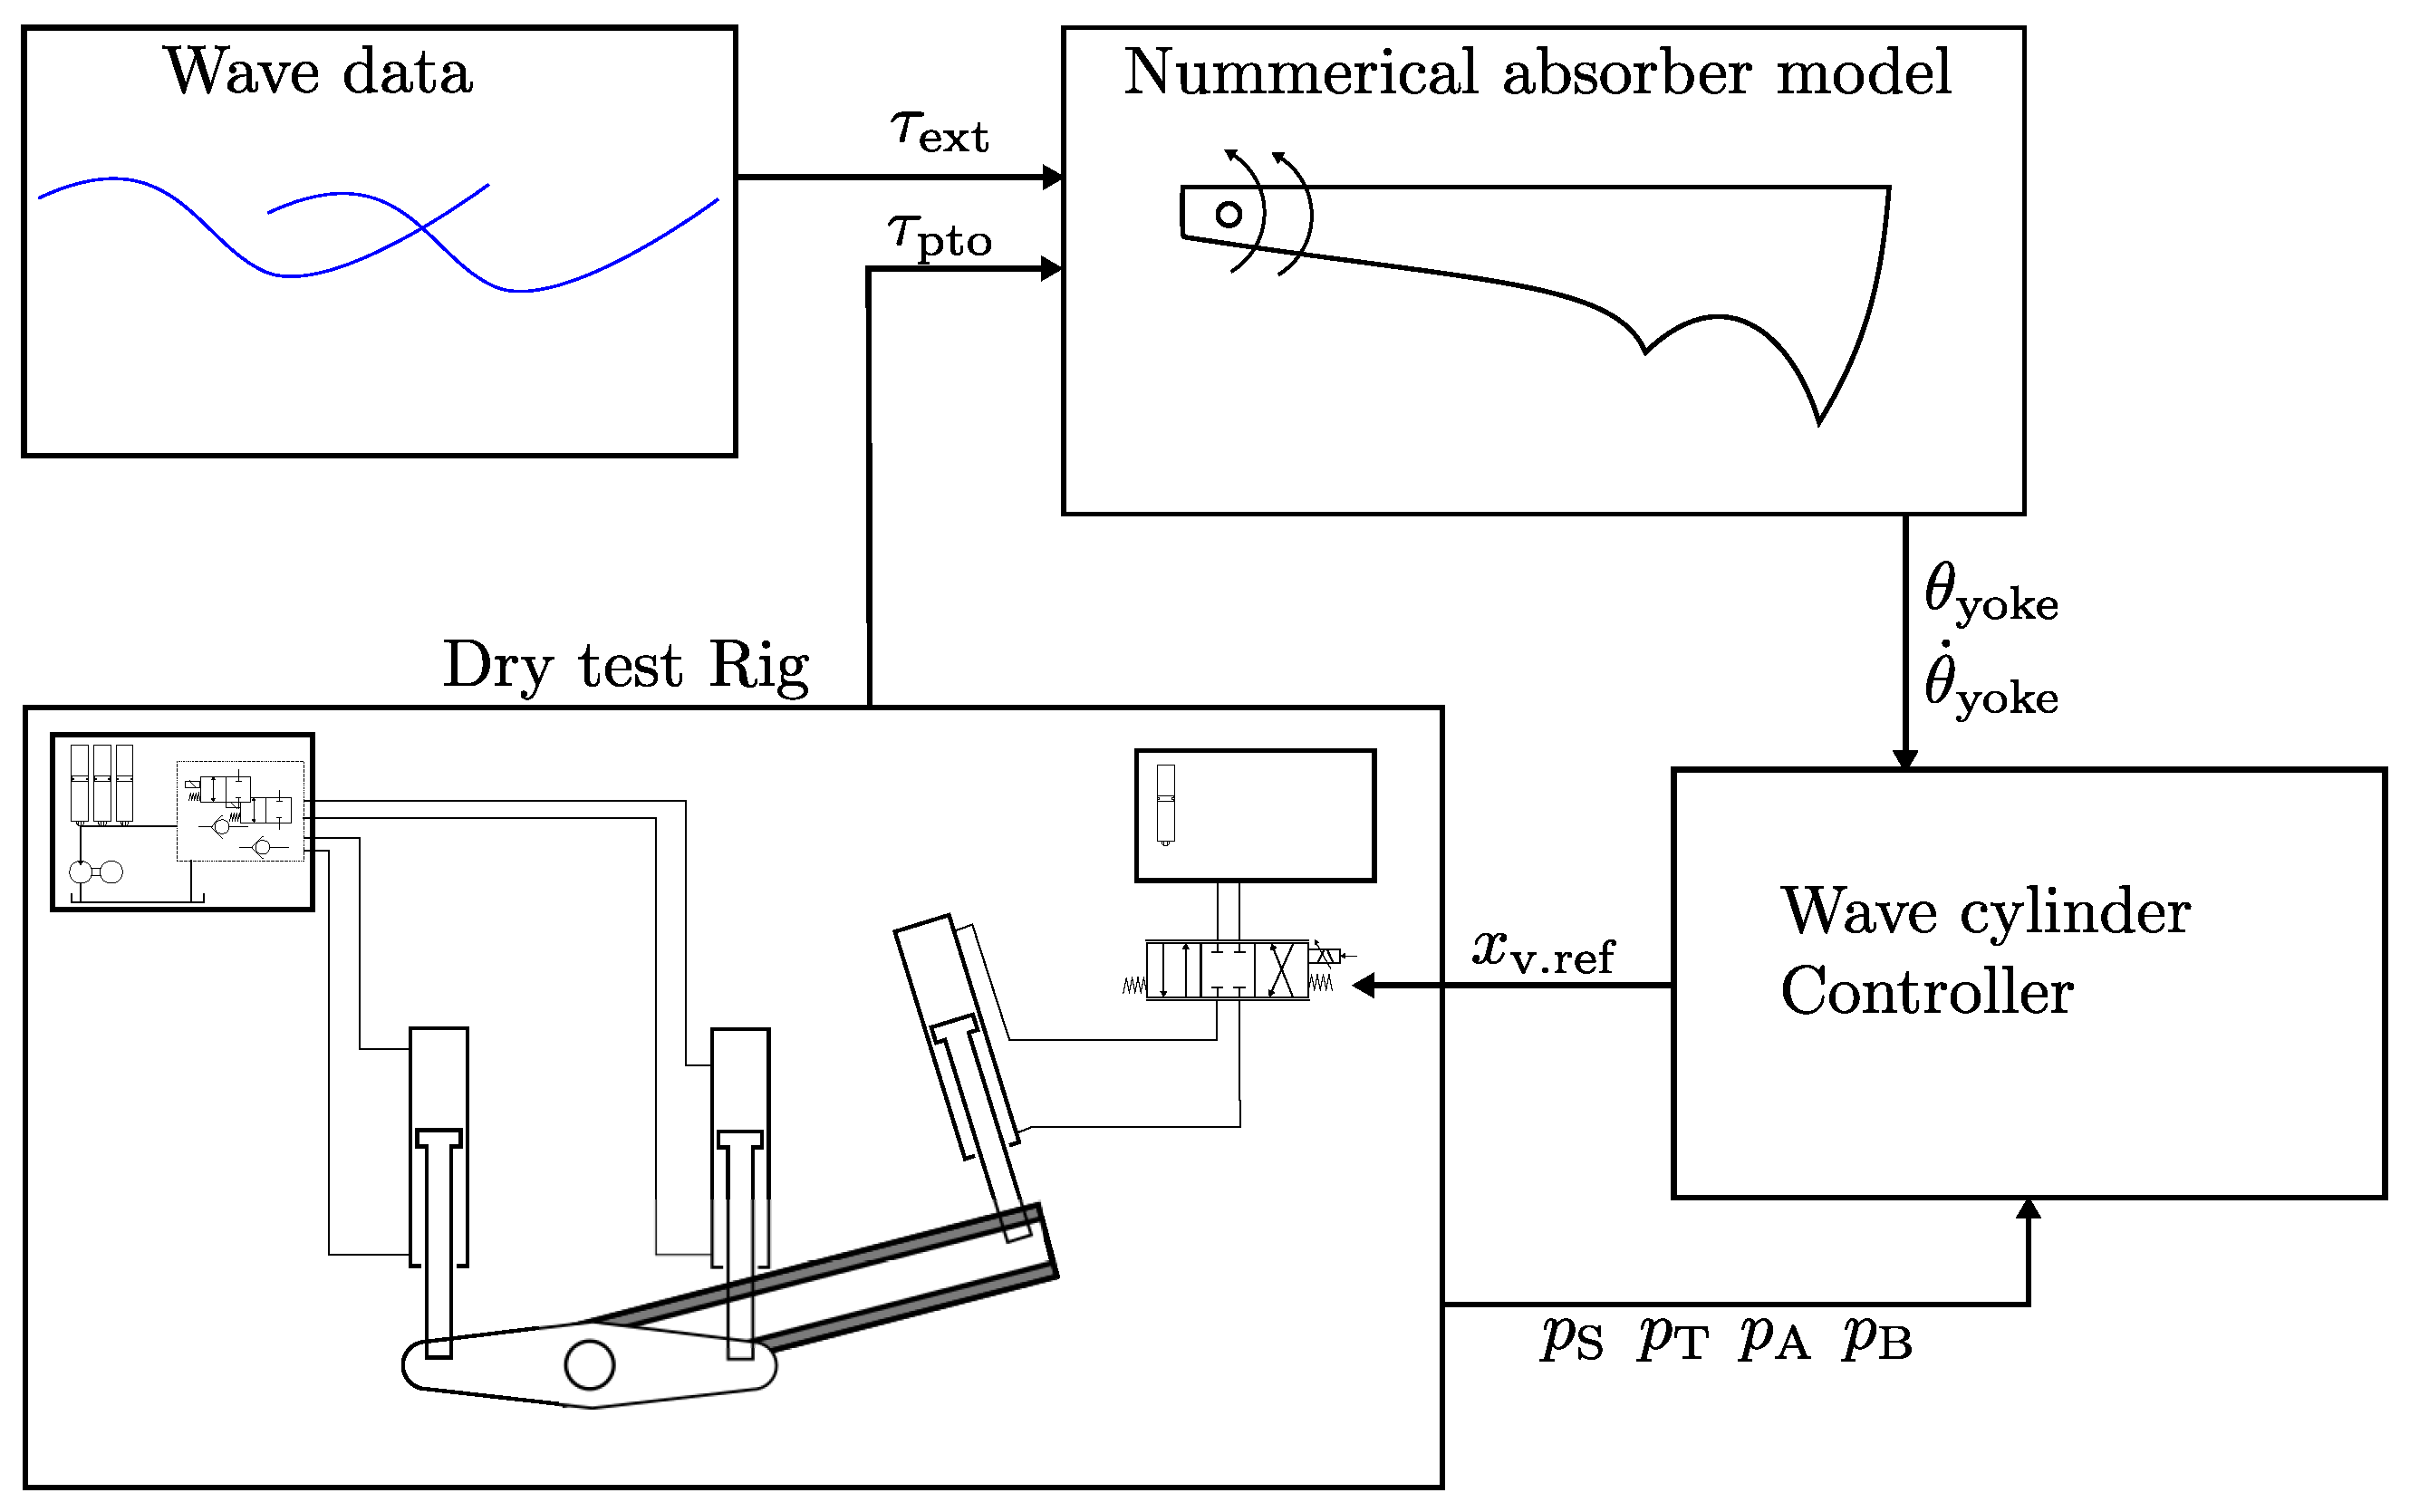
9]. The small scale test system consists of a dry-land absorber emulator system, which drives the scaled PTO system under test. A numerical absorber model, derived in [
10], running in real-time, generates the reference for the emulator. Inputs to the numerical model is a wave time-series torque,
, and the real-time measured PTO torque,
, delivered from the tested PTO system. The control concept for the dry test rig is illustrated in
Figure 3. The numerical absorber model outputs yoke angle,
, and angular rate,
, both of which are used as references in the wave cylinder controller. The wave cylinder controller further uses measurements of the system pressures; supply, tank, chamber A and B,
in the calculation of valve spool reference,
for the 4/3 way valve.
The absorber emulator system consists of a hydraulic differential cylinder, a proportional valve, and a hydraulic power unit (HPU).
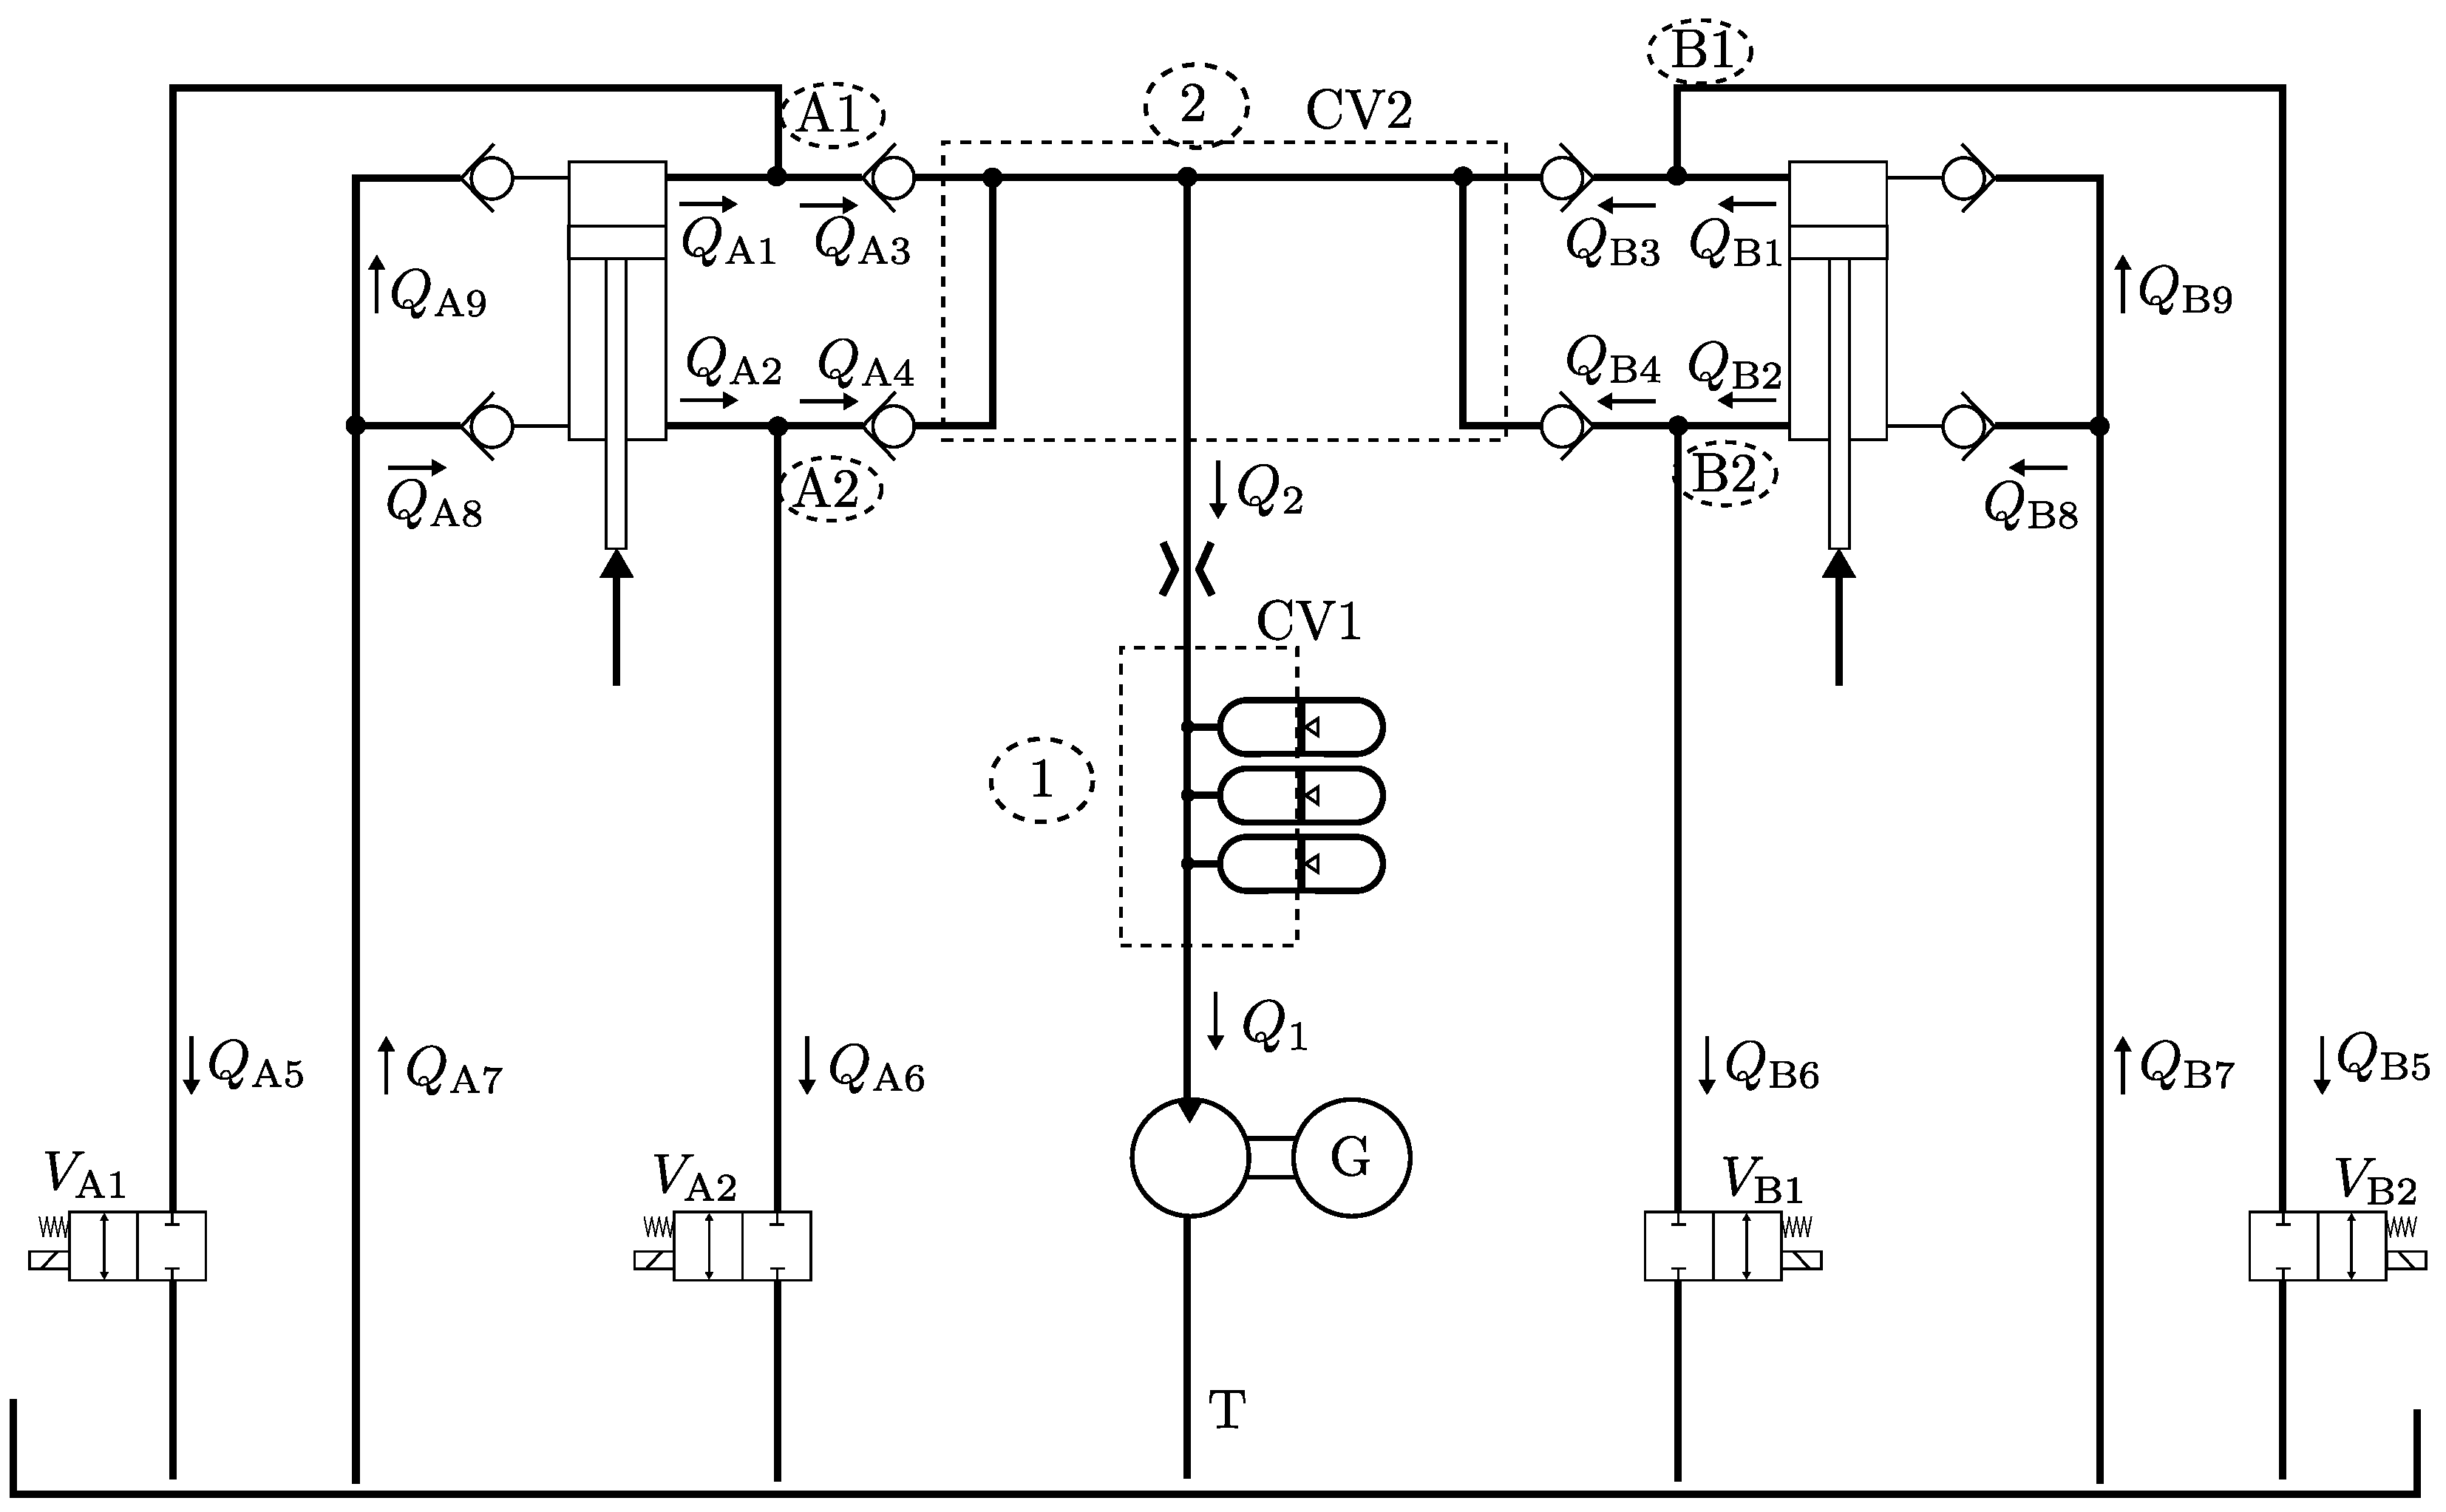
The small-scale PTO system consists of two hydraulic differential cylinders, three piston accumulators, four on/off valves, eight check valves, and a hydraulic motor, as seen in
Figure 4. The PTO system is linked with the float emulator system by a shared axle and a beam. Therefore, when the float emulator system runs, the hydraulic cylinders will be compressed and expanded, respectively, when the float emulator moves in a positive and negative direction.
The combined system has three controllable inputs: the proportional valve of the float emulator system, the torque of the electrical generator, and the setting of the four 2/2 directional valves connected to each side of the two cylinders in the PTO system. The PTO test system was initially developed and used to conceptually test and demonstrate Floating Power Plants wave energy technology on a small scale.
2.2. Non-Linear Model
A non-linear model has been created enabling development and test of different control strategies. The model consists of three parts: the mechanical, the absorber emulator, and the PTO system.
The mechanical model centres around an equation of motion based on Newtons Second Law, where the forces
, and
are created from the pressures of cylinders A, B, and C, respectively. The gravitational force of the float emulator arm,
, viscous and coulomb friction are also modelled with friction coefficients
and
, respectively.
The model for the PTO system, as seen in
Figure 4, consists of an equation of motion for the hydraulic motor, a continuity equations for each of the control volumes 1 and 2 and for each of the four cylinder chambers, flow equations modelling flow through the valves, and an equation of motion for the piston in each of the accumulators. Firstly the motion of the motor is modelled as:
where
is the mass inertia of the motor and generator combined,
is the motor displacement,
is the pressure difference across the motor and
is torque from the electrical generator while
are friction coefficients. Next the continuity equations for all pressure nodes is set up. Here,
i signifies the relevant pressure node as marked on
Figure 4 as dotted circles, and
the net flow into the control volume with volume
.
The flows,
, through check valves and on/off valves as seen on
Figure 4 can be described as Equation (
4). The on/off valves are either open or closed depending on
being 1 or 0, respectively. The check valves are only ever open in one direction, and thus
will be 1 or 0 depending on whether
or
, which are the pressure before and after the valve, are higher.
The valve flow rating is given by the nominal flow and pressure,
and
. Note, that the counter
n and
m are some specific pressure naming relative to the flow
, where, e.g.,
uses
and
, see
Figure 4.
For the three accumulators, three identical equations of motion can be defined as:
where the counter
k reference to each of the three accumulators and
is the mass,
is the piston area in the accumulator,
is the friction on the piston while
is the gas pressure in said accumulator with piston position
.
3. Optimal PTO Torque
The generator torque and the configuration of the on/off valves are controllable inputs in the PTO system. Since adjusting these inputs will change the torque applied on the absorber from the PTO system (
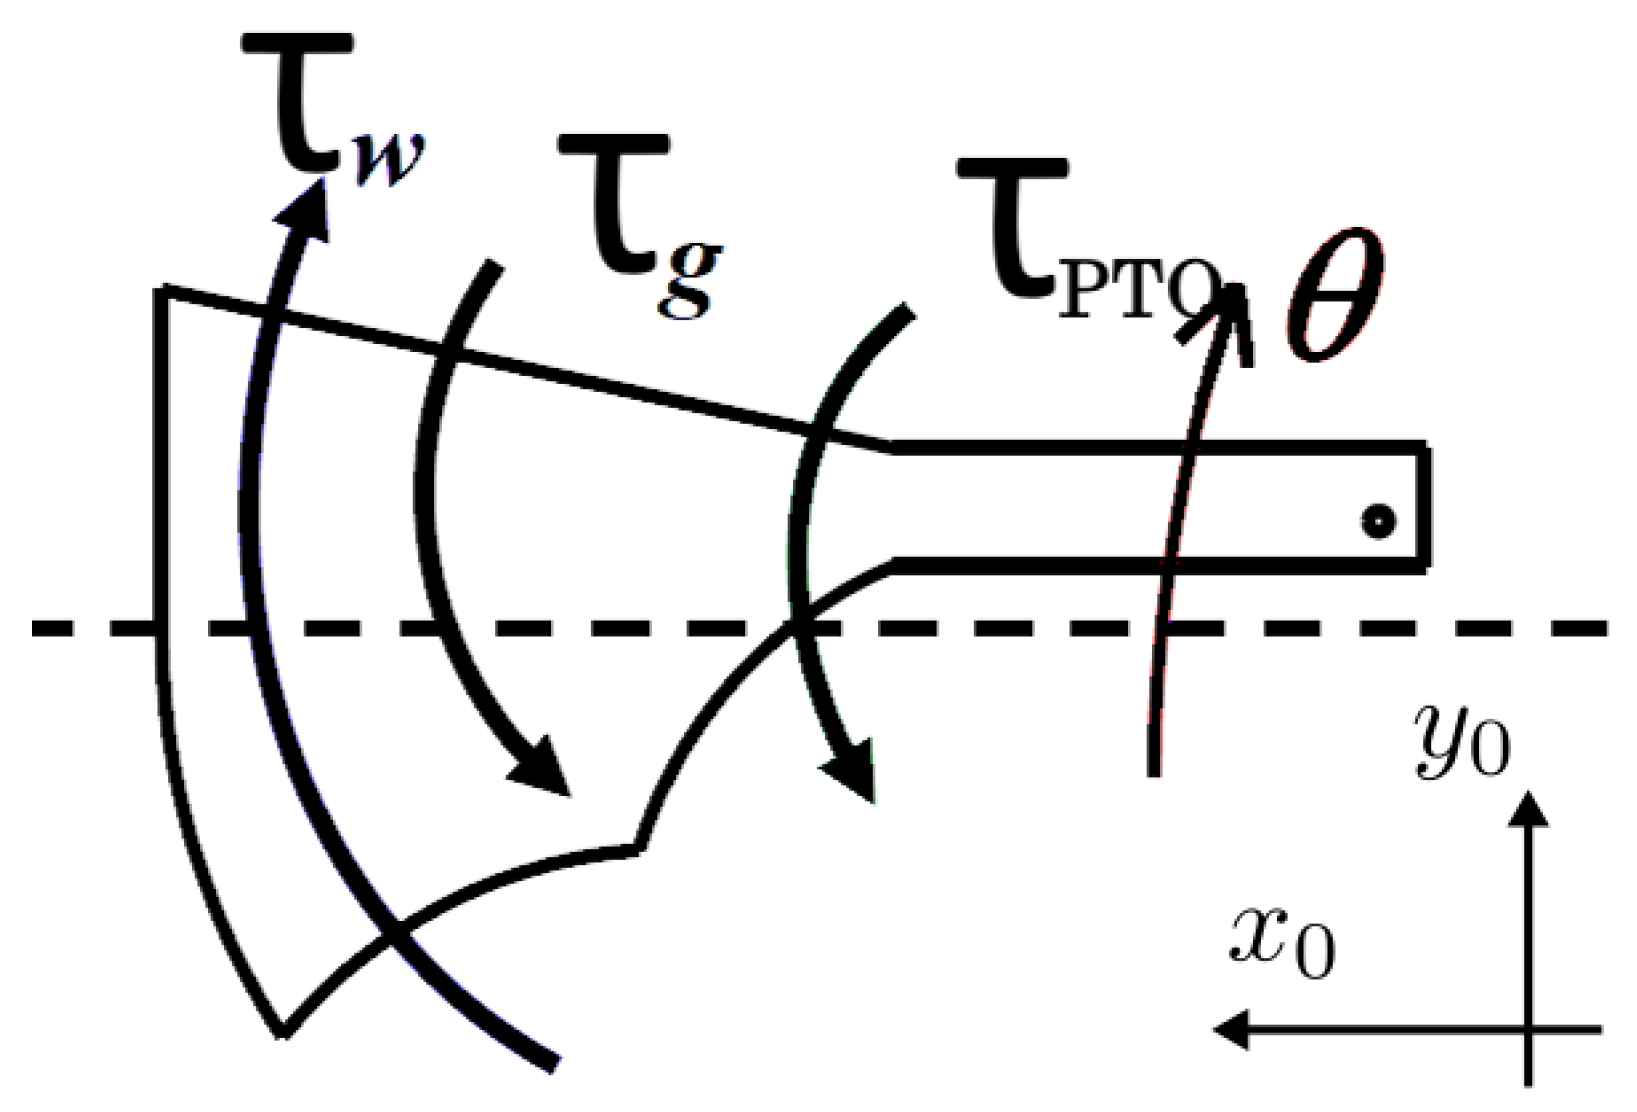
), and thereby the amount of energy harvested, an optimal configuration needs to be determined. The optimal configuration will be the one extracting the most energy from each incoming wave. The absorber emulator simulates the actual absorber of the scaled Floating Power Plant wave energy converter in the ocean that is excited by the incoming wave motion. In
Figure 5, a free body diagram of the FPP’s absorber is given. Note that the hinge point, around which the absorber rotates, is point A in
Figure 1 and this point is fixed in the platform coordinate system 0.
The different torques in form of the incoming wave torque
, the gravitational torque
, the hydraulic PTO torque
together results in the absorber’s angular displacement
. The equation of motion for the absorber can be described by an equivalent mass-damper-spring system as in (
6). Note that the PTO torque is assumed a linear combination of angular position, velocity, and acceleration as given in (
7). With the incoming wave assumed to be a linear wave, the equations become:
The absorber’s equation of motion is given by the amplitude of the wave excitation torque
and the incoming wave frequency
. The acceleration relates to the absorber’s inertia
J, hydrodynamic mass
, and control parameter
. The hydrodynamic damping coefficient
and damping control parameter
relates to the floater’s velocity and the stiffness coefficients
and
relates to the hydrostatic spring constant and control stiffness. It is also relevant to mention that the hydrodynamic coefficients
and
are frequency dependent on the incoming waves [
4,
11].
There are different strategies for extracting energy in waves on the ocean. Resistive and reactive control strategies are investigated throughout this paper, and for each control strategy it is relevant to know how much energy the floater is able to absorb, and how much energy the motor is able to generate, when adjusting the control parameters , , and . Therefore the theoretical control optimum for the current absorber is investigated. This is done by assuming an ideal loss-free PTO system that can apply a continuous PTO torque. In the next sections the resistive control coefficient, , is firstly investigated to find the optimal value in various regular wave conditions for the current wave absorber. Next the resistive and reactive control coefficients, and , are investigated again to find the optimal valves for the absorber in regular wave conditions. The optimal control coefficients for resistive and reactive control are hence given in various regular wave conditions, where optimality is when the most energy is harvested, .
3.1. Resistive Case
The resistive control case is based on only adjusting the control damping coefficient
and setting
and
to zero. This control coefficient is directly related to the instantaneous power that it is possible to harvest through the PTO system and is given by (
8) [
4].
Integrating the instantaneous power for a period of
T and inserting the control parameter
results in an average power expression as in (
9) [
4].
This expression can be solved by remembering the assumption of linear waves which has the general motion solutions of (
10) where only the real part of the solution is of interest [
4].
Through integration and inserting the harmonic velocity solution into (
9) results in the average power expression in (
11) [
4].
The absorber’s amplitude can similarly be found from the general solutions to a regular linear wave and by inserting (
10) into (
6) results in the floater amplitude
in (
12) [
4].
Inserting this expression into the average power of (
11), it is possible to find the optimal analytical torque. Adjusting the value of
for each incoming wave with a different frequency it is possible to find the optimal value of
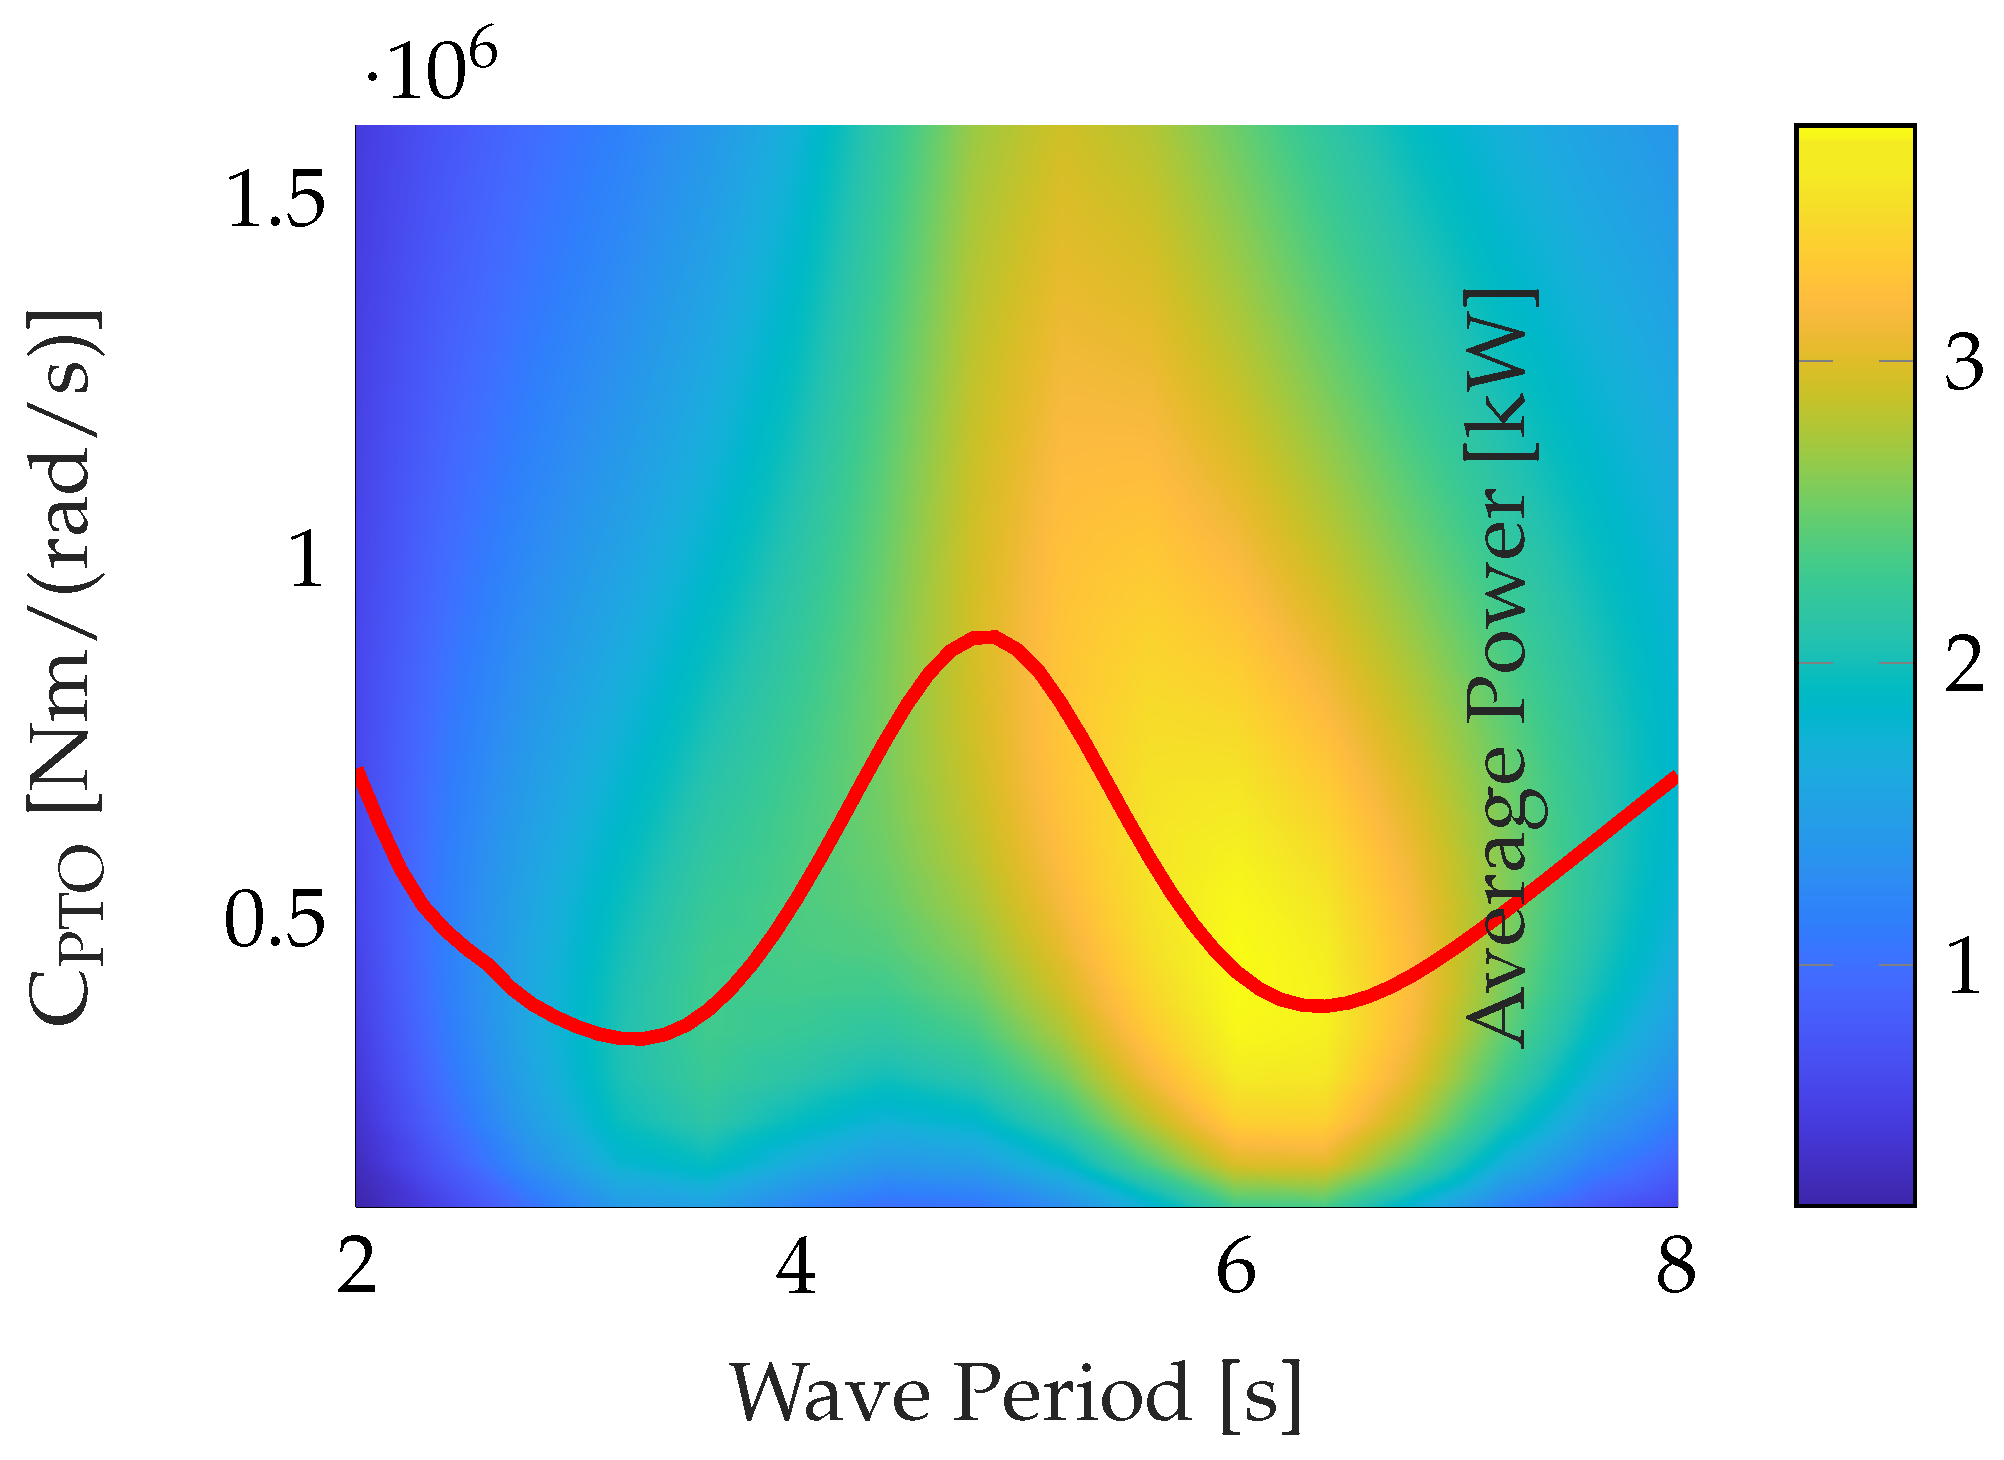
that results in the highest power. In
Figure 6, there is a heat map with the wave period in seconds on the
x-axis and the changing resistive coefficient
on the
y-axis. The changing colours are the average power extracted for each wave period and at a specific value of
. The red curve represents the optimal value of
at a given frequency and thereby the optimal analytical torque for each incoming wave frequency.
The ideal values of will later be used when calculating the optimal torque reference for the resistive control strategy.
3.2. Reactive Case
It is also possible to expand the analysis of the optimal torque by reconsidering the control parameter . Instead of setting to zero, it could be included in the analysis as well, resulting in an optimal reactive torque. The control case being reactive means that the aim is to align the wave excitation torque with the absorber velocity to achieve resonance and thereby maximise absorber amplitude.
Including
and performing the same derivation as in the resistive case results in a floater amplitude expression as in (
13) [
4].
To achieve resonance between the floater and wave the control parameter
can be adjusted such that it cancels the left denominator expression as in (
14) [
4].
Fulfilling (
14) and inserting (
13) into (
9) results in an average reactive power expression as in (
15) [
4].
The optimum absorbed power is then found by letting
be equal to the hydrodynamic damping coefficient
. This results in the optimal absorbed power through reactive control as in (
16) [
4].
Equating the optimal analytical reactive power for a regular wave with constant amplitude and changing wave period and assuming it is possible to adjust the control parameters for any given wave results in the control parameter graphs in
Figure 7. The top and bottom graphs illustrate the control parameters
and
that achieve resonance and thereby analytical optimal torque for a given wave period.
These coefficient values are used when implementing the reactive control strategy in the simulations. It should be noticed that implementing results in the need for external energy. In the project’s PTO system, this could come from the accumulators. In the case of supplying external energy, it may conduct extra valve switches which result in higher switching losses.
The optimal values of
and
in
Figure 6 and
Figure 7 are used to calculate an optimal torque reference when implementing the control cases to the PTO system [
4,
10,
11].
4. Wave Power Extraction Algorithms
In
Section 3 it was found that an optimal torque can be constructed for the float at all times in both a resistive and reactive case, as given by, respectively, (
17) and (
18) [
4].
These optimal torque references are, however, not realisable for the FPP system that can only change the PTO torque to discrete levels by opening and closing the on/off valves as shown in
Figure 4. The WPEA strategies are then given by which valves to open at which times in order to achieve maximum power extraction from the waves to the generator.
4.1. Resistive Case
For resistive implementations multiple methods are presented and investigated:
All valves closed at all times—reference case.
Switching only occurs at position endpoints (no velocity).
Switching can be done continuously throughout the PTO movement.
The PTO torque for the two hydraulic cylinders is described by (
19).
The PTO system can realise three levels of torque in each direction of rotational movement; both cylinders actuated at maximum torque, decoupling the ring chamber for medium torque, and decoupling the bore chamber for low torque. This will effectively change the compressing chamber pressure between high and tank. The possible valve configurations thus become:
Where the subscripts H, M, and L indicate high, medium, and low torque, respectively, and where + or − denotes the direction of velocity. Recall that an open valve, 1, means said chamber is connected to the tank.
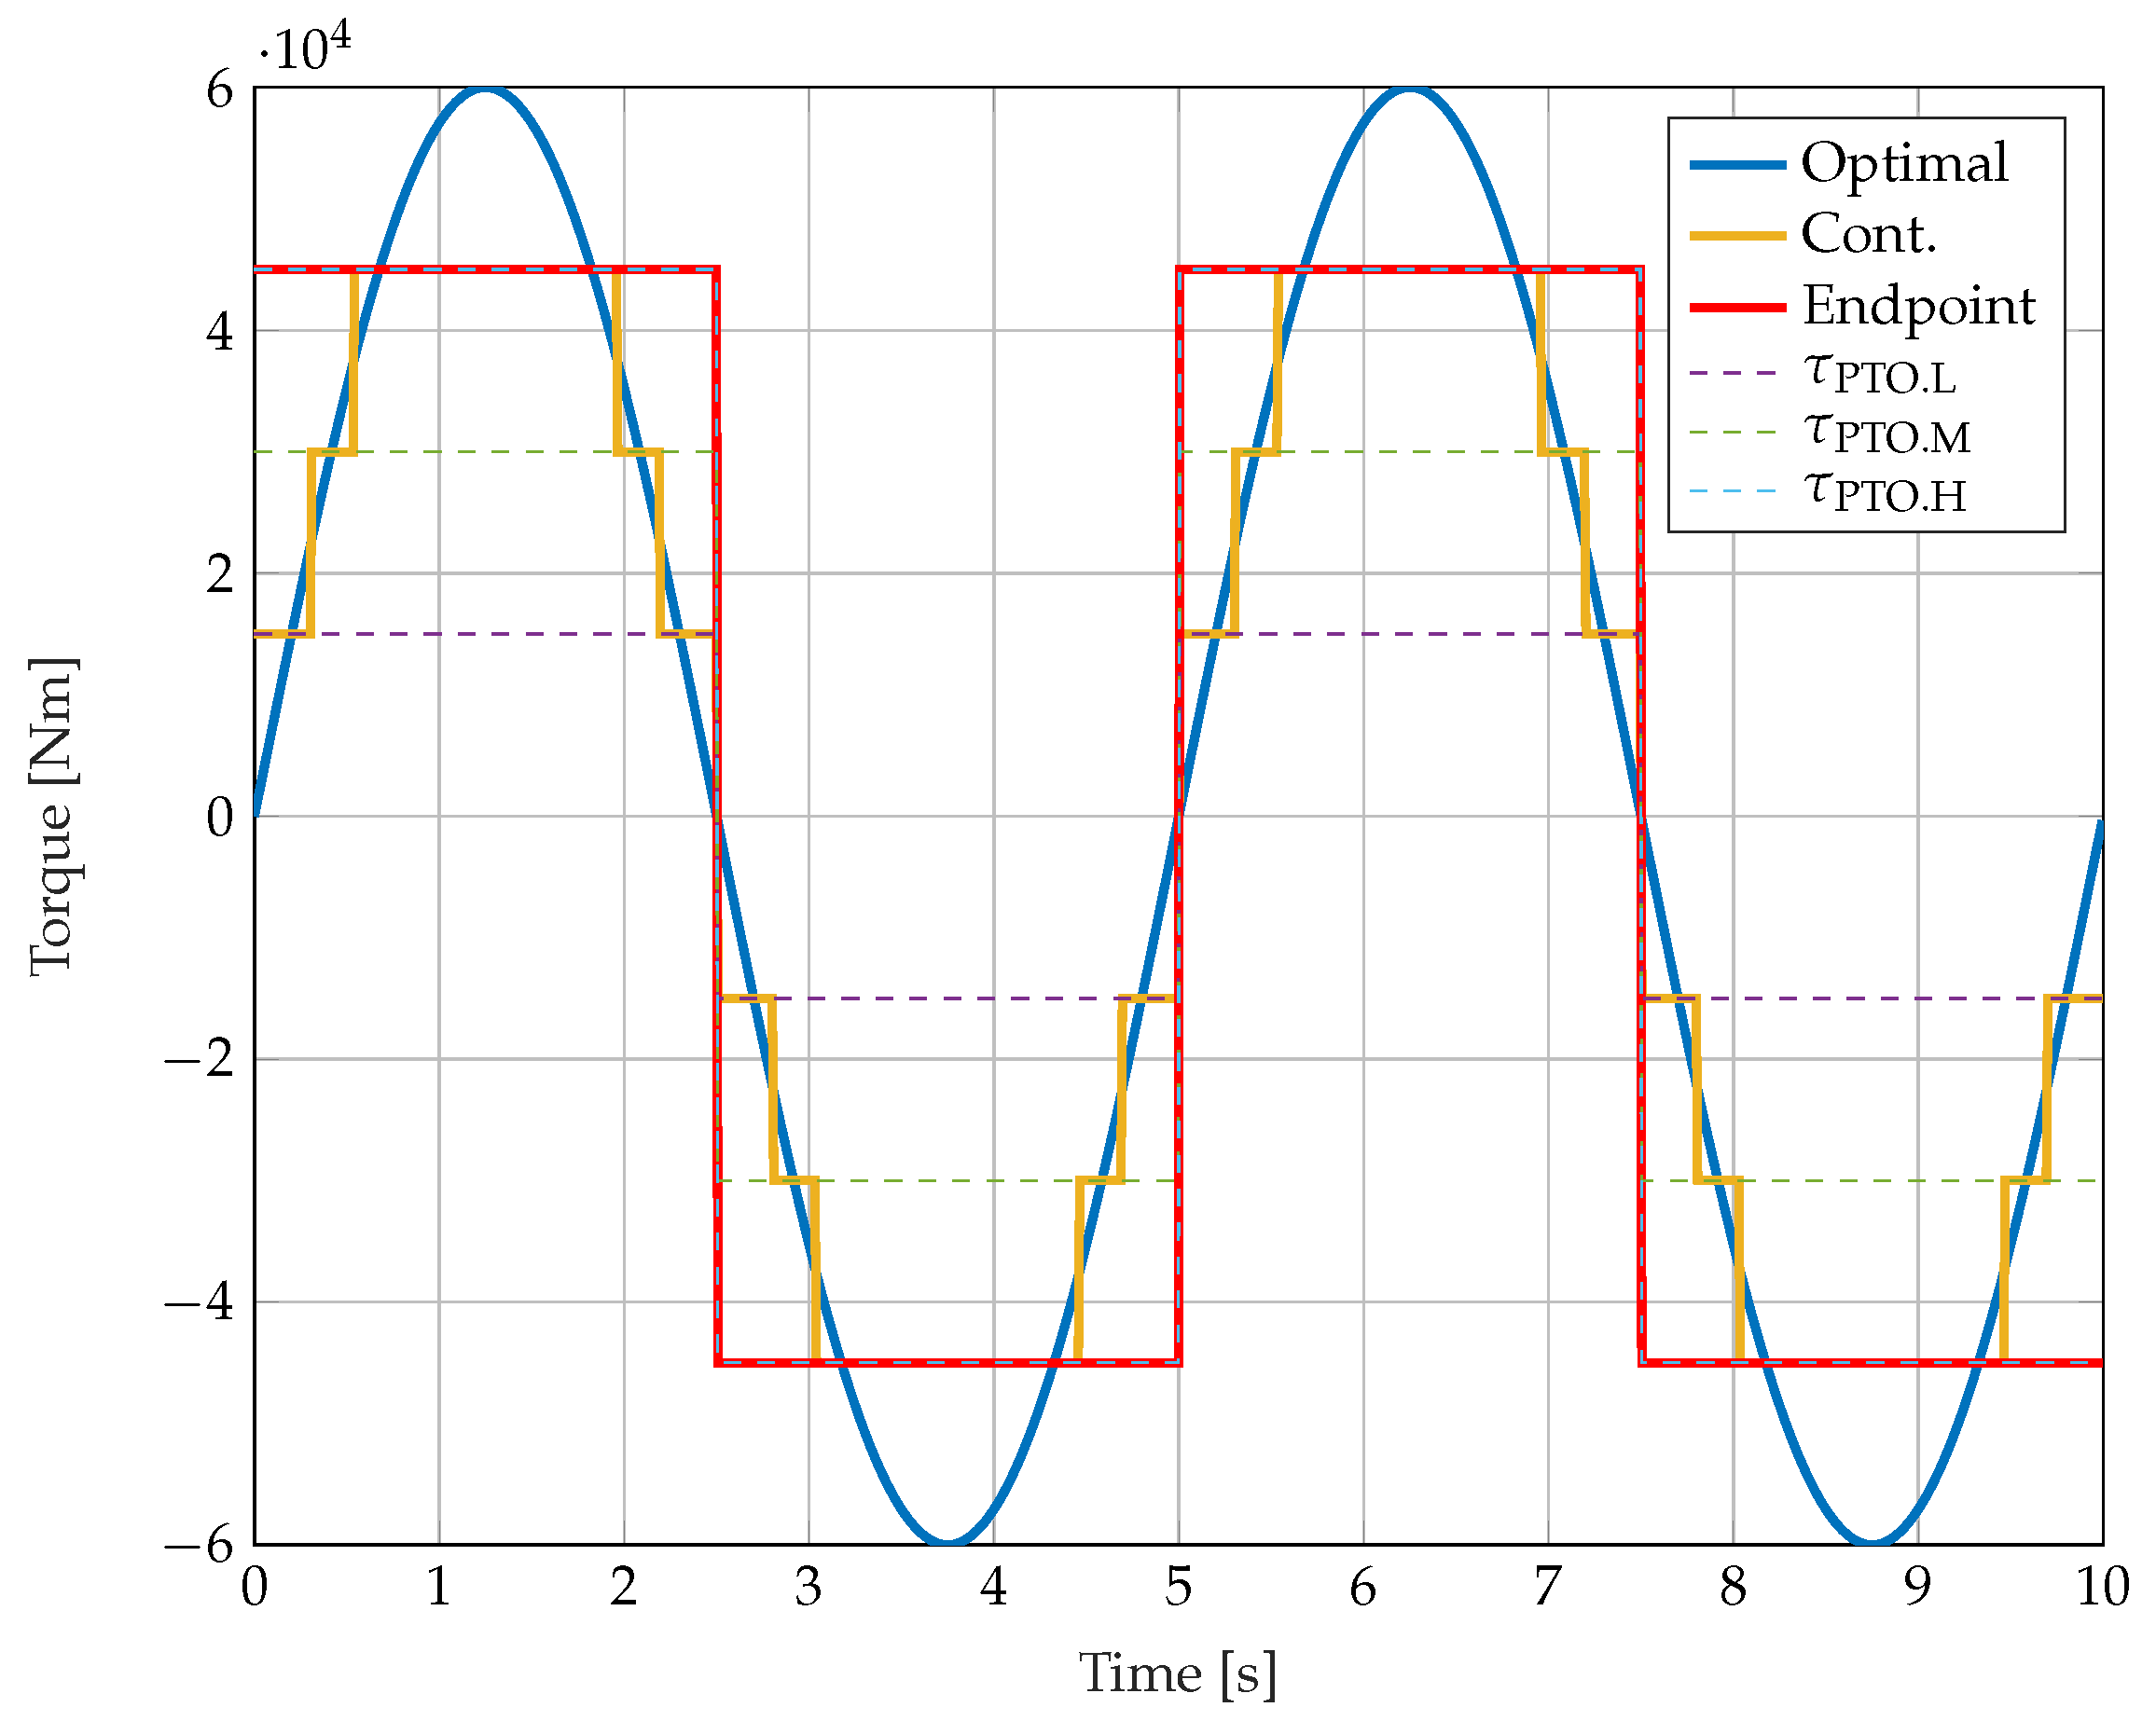
In the “All Valves Closed” WPEA all on/off valves are closed at all times as a baseline WPEA. This will generate maximal power as long as the waves have a torque larger or equal to the maximum available PTO torque. If the waves become too small, this WPEA will have no way of decreasing the PTO torque to a more appropriate level and will thus stop the motion of the absorber.
The “Endpoint” WPEA is able to switch between all configurations but is only allowed to do so when the piston reaches a velocity of zero which occurs at the positional top and bottom of the cylinder movement. As such, this WPEA is able to adapt the PTO torque to the wave conditions and the ideal torque, but can only do so before the incoming wave, and has to run on the same level throughout the wave. Therefore, this solution can be very effective if the incoming wave is known through predictive control or active wave measurements. The current system, however, does not have this and as such this WPEA will run based on the assumption that the next wave will have the same ideal torque level as the previous one. When the piston meets a velocity of zero, the WPEA will then calculate the ideal torque from the previous wave and set the torque for the next wave at this level.
The “Continuous” WPEA is able to switch levels continuously and as such will, in discrete steps, calculate the ideal torque at all times and set the PTO torque at the closest level. This means that during a wave, the continuous WPEA is able to reach all three levels on the way up in velocity and again on the way down. This WPEA is in theory the one that comes closest to the ideally calculated continuous torque. The theoretical torque delivered by the different WPEAs compared to an optimal reference are illustrated in
Figure 8. Note that the optimal is the resistive control with optimal control coefficients and a continuous PTO system.
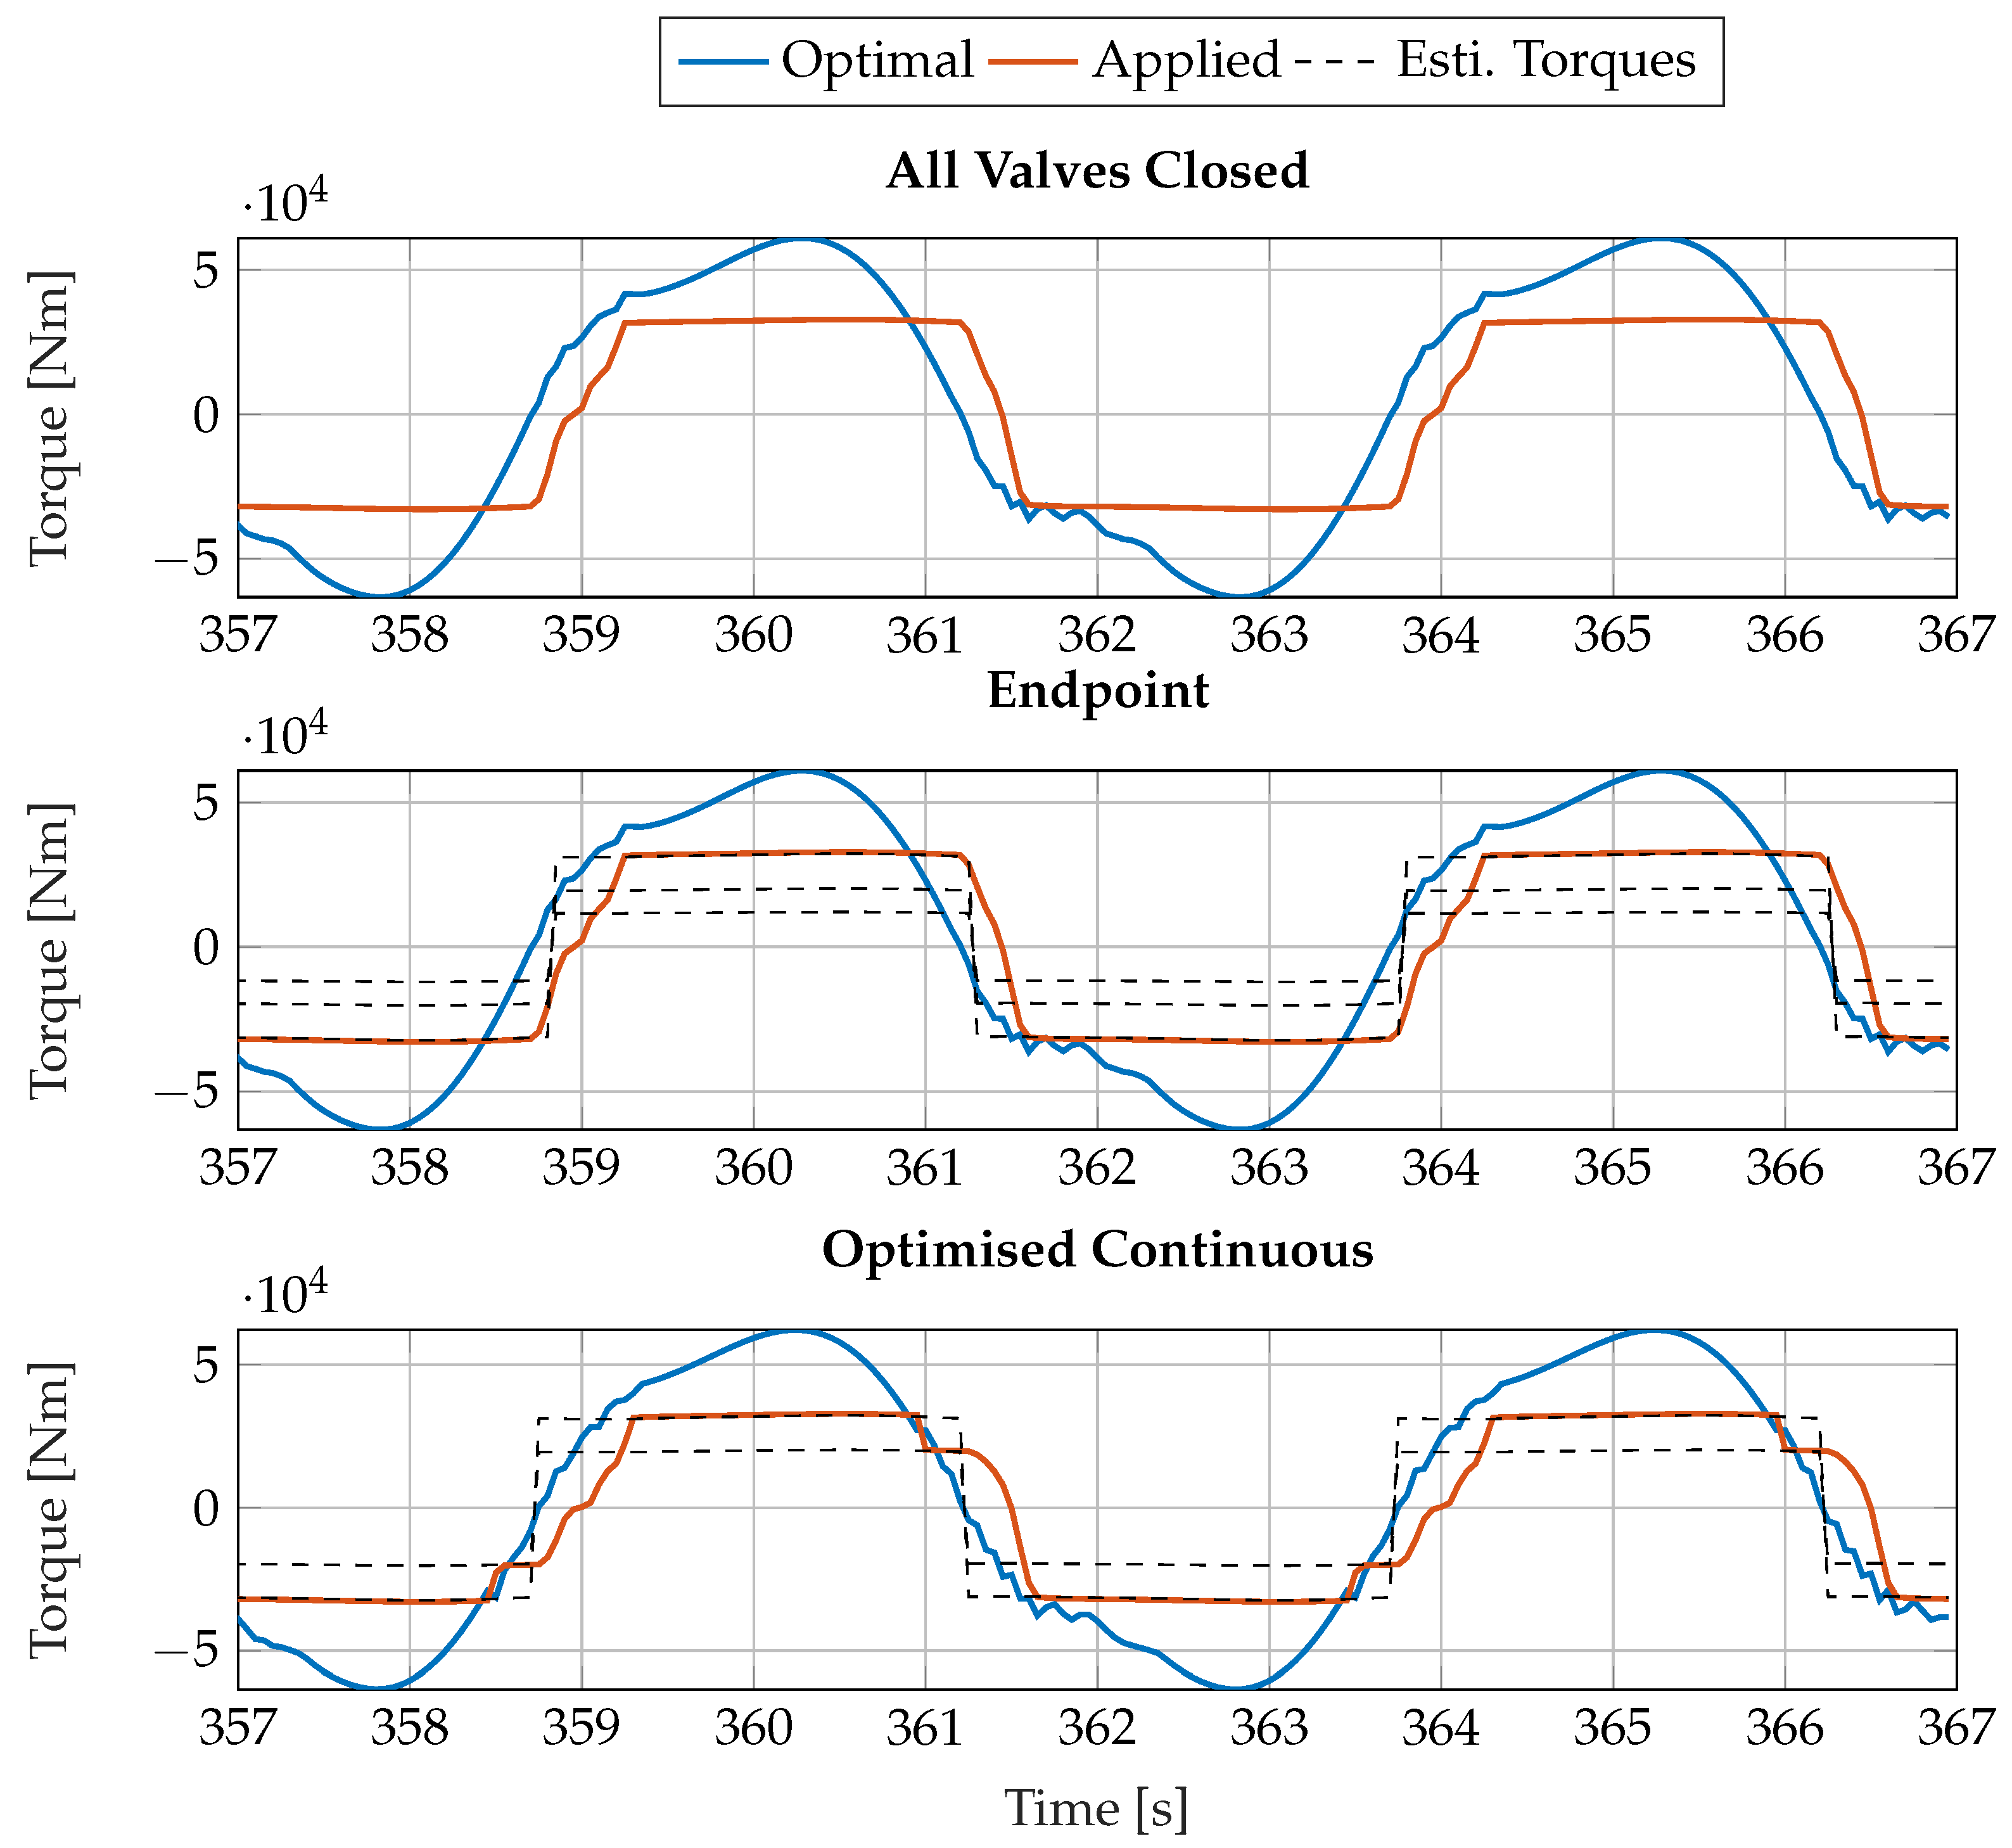
This is an idealised version of the continuous switching, and through the simulation of the mathematical model, it is found that several factors disrupt the tracking of the ideal torque. First, it is found that switching between the medium and low levels in rapid succession is not ideal. When switching from high to medium, the pressure in the ring chamber is dropped to the tank. Then, when switching from the medium to low level, the pressure in the bore chamber is dropped to the tank, and it is desired for the pressure in the ring chamber to become high again. As the ring pressure was just dropped to the tank, there is a moment between medium and low where the pressure in all chambers are equal to tank pressure, at which point the system produces no torque, before the pressure is built up in the ring chamber again. This creates an unwanted torque drop, and as such, to optimise the continuous switching WPEA, the algorithm is modified to never be able to switch directly between medium and low.
Secondly, it is observed that when the all closed and the endpoint WPEAs switch direction there is a remnant pressure from the previous motion built up in the now-expanding chamber. For example, on the A-cylinder in positive direction, the pressure will be built up in the ring chamber. Then when the endpoint is reached and the direction changes this pressure is still present in the ring chamber before the pressure is built up in the bore chamber. This creates an accelerating effect on the cylinder and makes the system able to achieve high pressure in the retracting chamber faster. This accelerating effect is found to increase the power output of the system as the pressure is usually too slow to increase in order to follow the optimal calculated torque. This effect is not present in the continuous case as the pressure is dropped during the deceleration of the chamber as to follow the ideal torque line. This results in the all closed and the endpoint WPEA being faster at building up pressure than the continuous case and, as such, in order to increase the pressure build-up, the continuous case is modified to always hold the largest level for one-fourth of the wave period before being able to switch continuously as to aid the pressure build-up. This WPEA will be called “Optimised Continuous” for the testing, where it cannot switch between medium and low and where the highest torque level is set for one-fourth of the wave period. The simulated switching patterns for a regular wave with a height of 0.35 m and a period of 5 s can be seen in
Figure 9 at steady-state with a 115 bar system pressure.
4.2. Reactive Case
An ideal torque was presented for both a resistive case and a reactive case. In order to realise the reactive control, the system needs to be able to use some of the accumulated energy to assist the movement of the float, to ensure resonance between wave and floater at all frequencies. Therefore, it is proposed to implement a set of high-pressure pathways from the high-pressure common line and back into the chambers of the PTO cylinders. This can be achieved for the Floating Power Plant setup by replacing the check valves, located at nodes A1, A2, B1, and B2 in
Figure 4, with a parallel check valve/on-off valve connection.
This configuration allows the system to operate as usual when all the added on/off valves are closed, but also creates the possibility of routing high pressure back into the expanding chambers that would otherwise have fallen to tank pressure. In combination with this, the on/off valves connected to the tank can be opened on the contracting side to reduce the built up pressure, effectively aiding the motion of PTO in correspondence with the wave. This creates the possibility of creating aiding torque that, instead of extracting power from the waves, aids the motion of the waves. In this way, the motion can be aided at strategic times such that the ideal calculated reactive torque of (
18) can be achieved. This creates a new set of valve configurations with the added possibility of aiding torque:
Where
and
opens high pressure to the bore chambers and
and
opens high pressure to the ring chambers. As in the continuous case, the low level is not utilised because of the brief pressure drop during switching. As the reactive case does not switch at endpoints but instead switches during the movement, unless operating at a resonance frequency, the switching pattern during simulation is illustrated in
Figure 10 for a 6.5 s period operating at 115 bar system pressure.
Here it is seen from the estimated torque levels that the PTO torque for the positive direction, between 362 and 365 s, is working in opposition to the wave torque at most of the stroke length but aids the wave torque in the end, to correct the phase difference. The further from the resonance frequency that the wave torque is, the more of the stroke length the WPEA needs to apply aiding torque. As such, the reactive WPEA performance becomes very sensitive to the wave frequency. The reactive WPEA for an irregular wave also needs to correctly know the frequency of the current wave in order to calculate the correct cancellation and as such would also be expected to have diminished performance on an irregular wave, unless predictive control or active measurements are implemented.
4.3. Generator Torque Strategy
Through simulations, it has been shown that at each frequency there are specific system pressures at which the WPEA generates more energy. If the pressure in the cylinders is too low, the WPEA does not have the possibility of following the ideal torque correctly, but if the generator torque becomes too high, the motor will never start spinning as the leakage pathways become the paths of least resistance. If power over pressure graphs, such as
Figure 11, are observed, it becomes clear that for all wave conditions there are unique optimal generator torques.
To determine an expression of this torque the hydraulic motor equations are observed.
where
denotes the pressure differential over the hydraulic motor (system pressure), and the friction is modelled as having a static coulomb friction part, a motor velocity-dependent part, and a pressure-dependent part.
To obtain optimal energy, the losses must be reduced. The motor friction loss increases with the pressure and the velocity in (
20). The pressure, however, is also included in the torque generated from the displaced liquid and is needed for the PTO to absorb the wave power optimally and thus needs to be kept high in order to produce energy. The velocity, though, can be reduced to decrease friction losses. If the velocity is reduced to zero in (
20), the equation can be rewritten as describing the minimal torque needed for the system to have a velocity of zero if observed at a steady velocity (no acceleration). Any torques above this will stop the motor and thus applying a torque slightly lower than this value becomes the maximum torque at which the motor can still rotate.
Which can be simplified to a generator torque control expression.
This observation indicates that the optimal operation torque-to-velocity ratio for the motor becomes maximal torque with minimum motor velocity. Simulations reveal the same through creating a feedback loop from the velocity to set the torque. With PI control implemented, it is possible to, by controlling the motor torque, follow a motor velocity reference to test the performance at different velocities. This test indeed shows that optimal power is generated at the lower velocities, between 500 and 1000 rpm, depending on wave frequency and height.
Equation (
23) does not, however, take leakage into account. The leakage over the motor, described in (
21), increases with the pressure, meaning that it is desired to increase the torque to reduce the influence of friction but not increase it too much so as to create too much leakage. Larger torques and thus larger pressures also decrease the motion of the float. Therefore the optimal torque for the motor must be found as a compromise between friction and leakage/damping. As the leakage of this system is so low with a motor friction coefficient of
it makes sense that the optimal power would prioritise lowering the velocity to reduce friction. Additionally, increasing the generator torque and thus the system pressure also makes the PTO able to follow the calculated ideal torque better, as it achieves higher available torque levels with the increasing system pressure.
To test this hypothesis, the constant multiplier (
) of (
23) is swept for variations to both sides on the all valves closed WPEA and it is found that the constant needs to be decreased a bit from the calculated version to make the motor spin. The sweep can be seen in
Figure 11 compared to applying a constant motor torque for the all closed WPEA.
Where absorber power is the power applied upon the absorber, while generated power is the mechanical power generated by the hydraulic motor onto the generator.
The absorbed power is a bit lower for this generator torque strategy, but the generated power experiences a significant increase. This most likely comes from the fact that the motor is able to run and generate power at all times, where, with a constant torque, it can only produce power when the waves are large enough to build up the pressure in correspondence with the torque level. With the pressure-dependent torque level, the torque will be determined as a function of the pressure such that the motor always runs at a low velocity. As this optimises the generator power, the optimal value is interpolated from the sweep and used for future simulations.
5. WPEA Performance
Four different WPEA strategies have been presented. To evaluate the optimal strategy, the system is simulated on irregular waves and for a frequency sweep to determine the optimal performance on actual waves and to examine the reactive WPEA performance in regards to the resistive cases at different frequencies.
The average absorbed and generated power for the different WPEAs both using constant and pressure-dependent motor torque can be observed in
Figure 12.
Where the pressure-dependent torque performances have been marked in x’s in the colour corresponding to the applied WPEA. By implementing the pressure-dependent torque control strategy, it is found that the generated power can be increased by approximately 22% for all WPEAs on the irregular wave.
It can be concluded that for the irregular wave, the best-performing WPEA is the optimised continuous strategy producing ~20 W more than all valves closed at optimum, at a system pressure of 58 bar with the motor torque control. As expected, the endpoint WPEA and the reactive WPEA performs suboptimally on the irregular wave where the frequency and wave height have to be estimated based on the previous wave. If the system is instead observed on a regular wave, where the frequency and wave height is known for all waves, the performance of these strategies is increased. This is shown in
Figure 13 where a frequency sweep on regular waves was conducted for periods 2–8.5 s with a wave height of 0.35 m and with generator torque control implemented.
Here, the reactive control WPEA performs significantly better but still falls short for generated power at all periods except for 6.5 s, even though the absorber power has been increased at most periods. This discrepancy between absorber power and generated power comes from the fact that the reactive case needs to use some of the available power to actuate the pistons and the fact that valve and switching losses are increased. So, even though the reactive case amplifies the power of the absorber, not all of this power becomes available at the generator. In this case, the reactive WPEA needs to operate at frequencies where low-power corrections to the phase can significantly increase the extracted power. When operating at the resonance periods, which were found to be located at 3.3 and 5.5 s, there is nothing for the reactive element to correct, and when operating too far from the resonance periods it takes too much energy to correct the phase. For example, at a period of 8 s, it is observed in the simulation that the WPEA expends as much torque to correct the phase at the end of the movement as it loads in the start, resulting in a net power gain of 0.
The resistive cases behave similarly for all frequencies, with the optimised continuous and the endpoint WPEAs being slightly better. As the endpoint WPEA does not work optimally on irregular waves without predictive elements, the optimised continuous WPEA is concluded to be the best-performing WPEA.
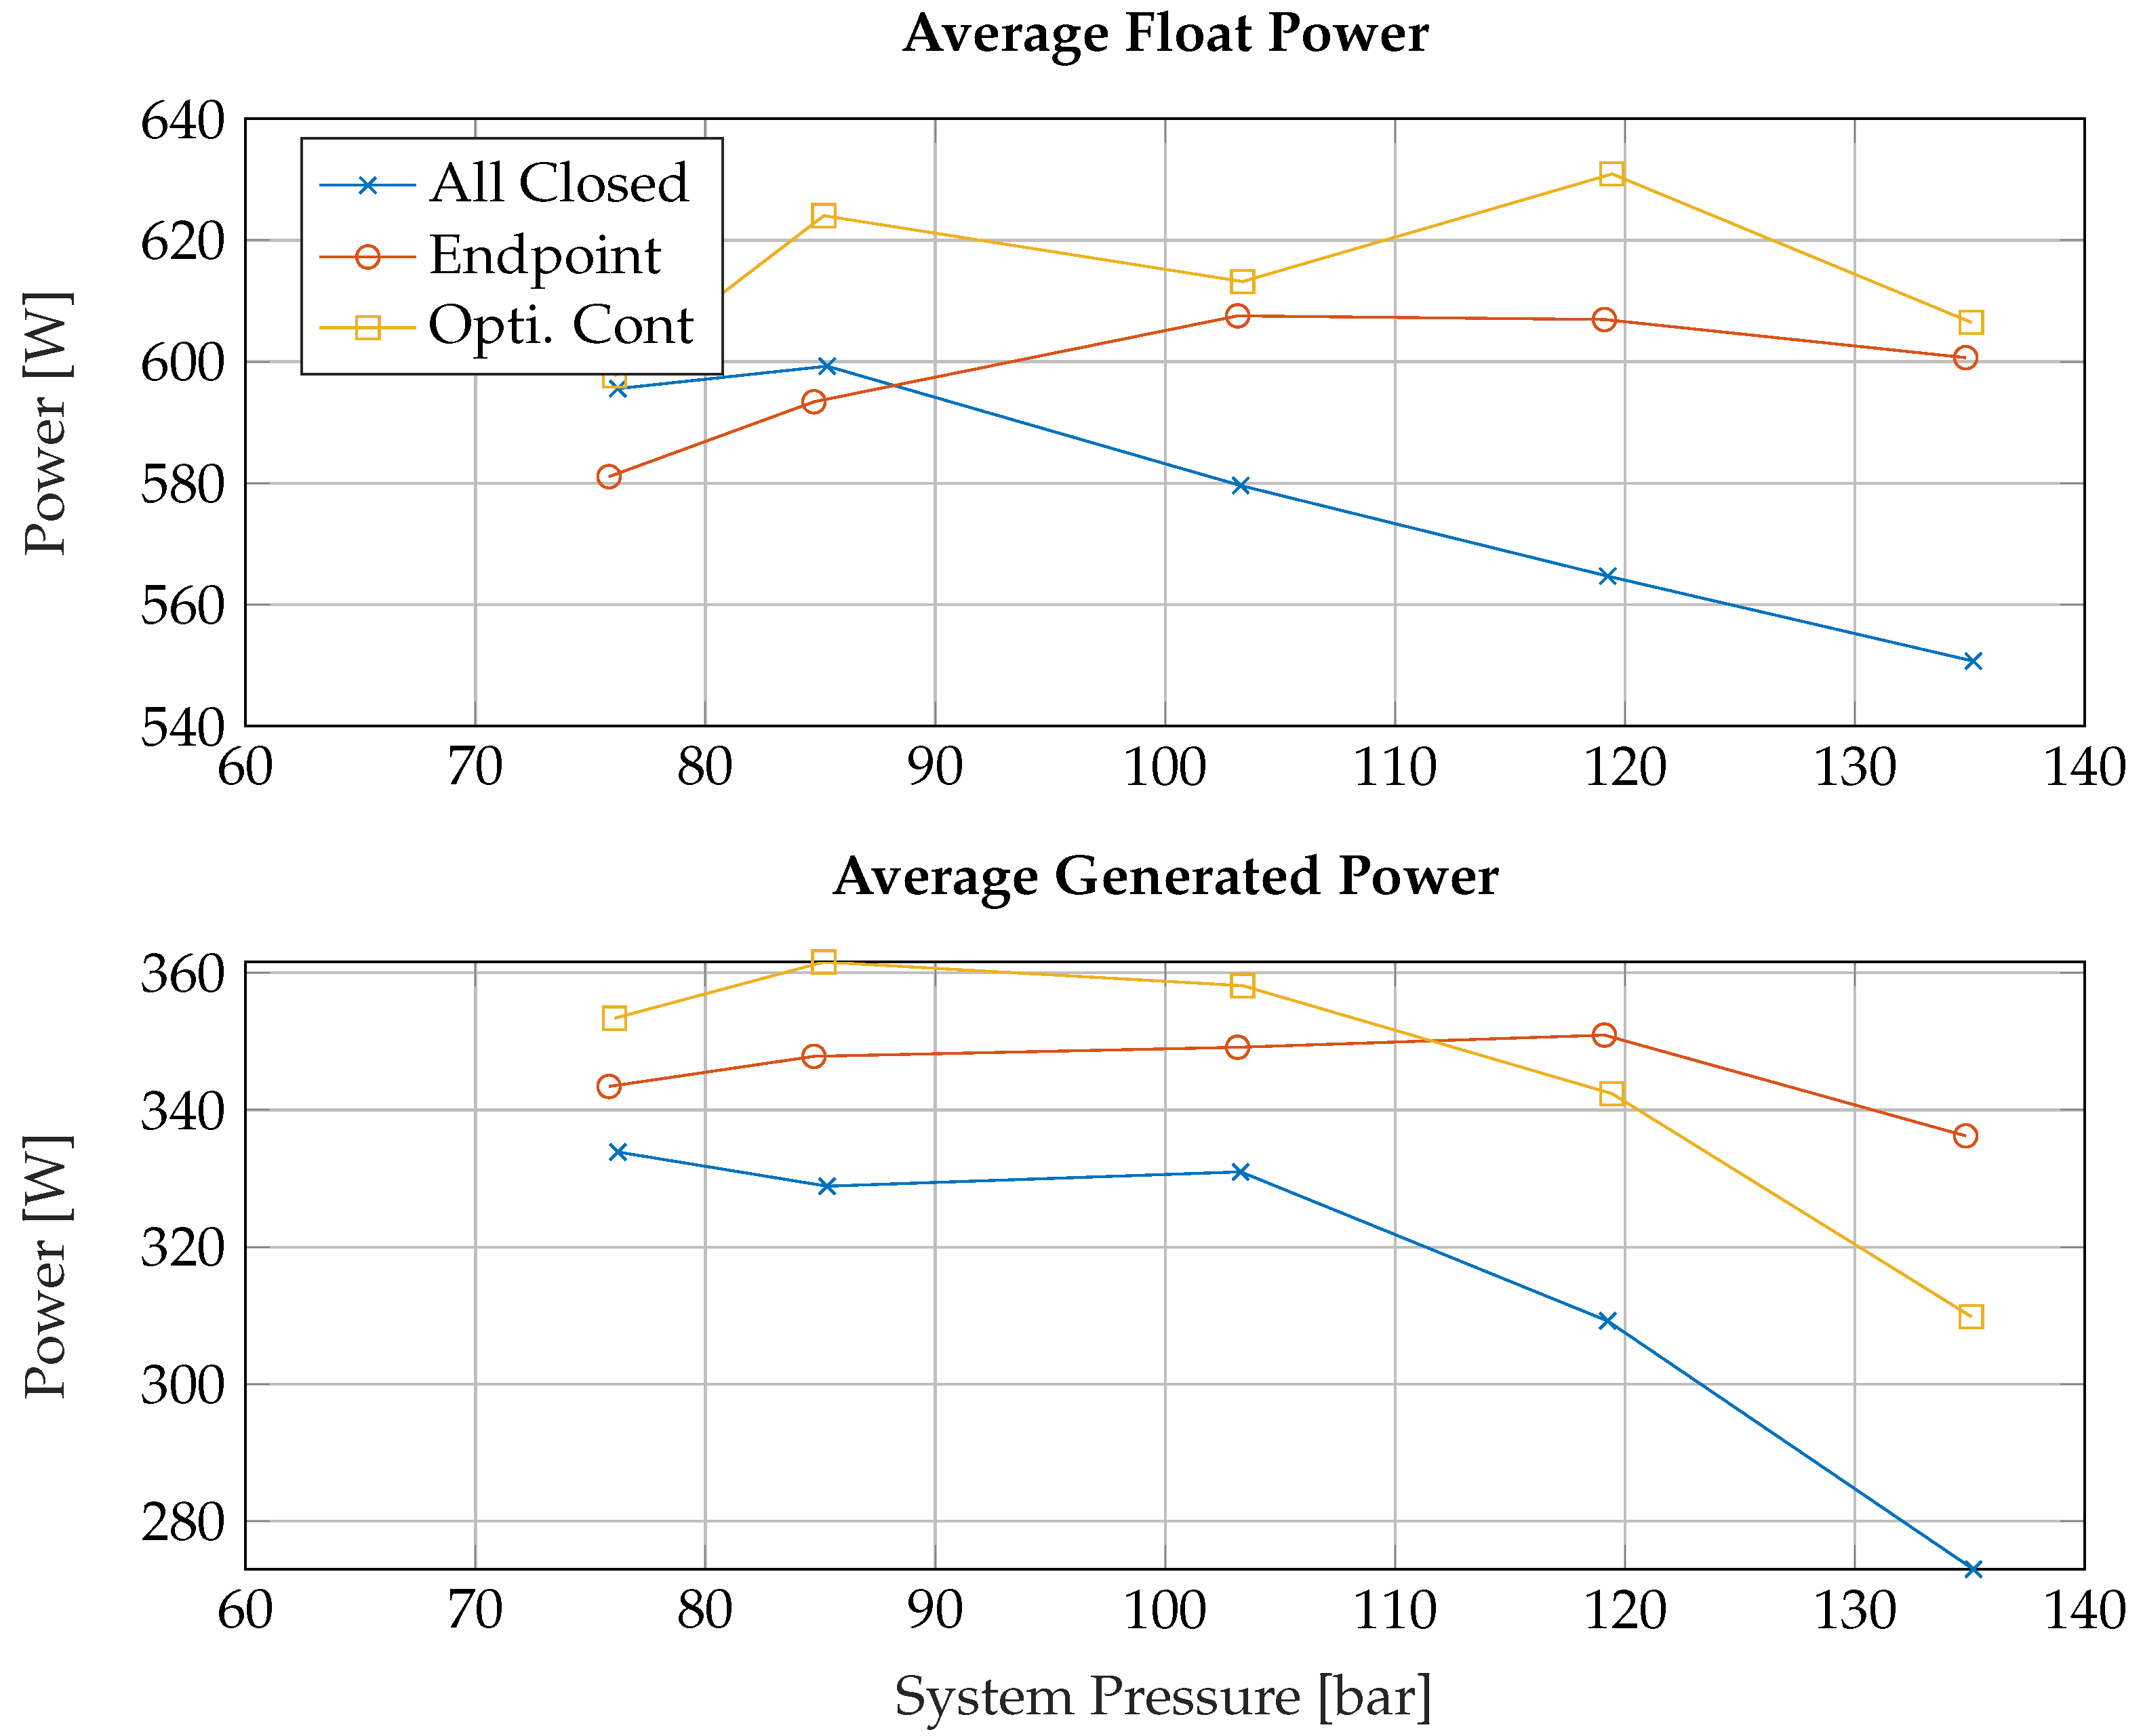
To verify this, the resistive control strategy is implemented on the test rig. As the reactive control strategy requires a physical change, this will not be implemented. The results of the implementation are shown in
Figure 14 for optimised continuous, endpoint, and all valve-closed WPEA on an irregular wave. Due to two limitations of the test rig, a motor speed limit of 4000 rpm, and a pressure limit at the system pressure of 150 bar, only the span 4 Nm to 7.5 Nm are tested.
By comparing the simulated average power,
Figure 12, with the tested average power,
Figure 14, it can be seen that both average absorbed and generated power differ. Part of this deviation is likely due to an inaccuracy between the non-linear model and the test rig where the motor velocity and the system pressure at the motor both deviated. However, the tendency is the same for both simulation and the real test, where maximum absorber power is produced by continuous control and endpoint control becomes better than all closed around 80–90 bar system pressure. A significant difference is that at a system pressure above 120 bar, the endpoint WPEA is now generating more generated power than continuous control. This could perhaps be explained by the model not being accurate enough, so the low torque level which was removed in optimised continuous control now needs to be used regularly.
6. Discussion
Based on the results presented, it is seen that the control of the generator used in the Discrete Displacement Cylinder-based PTO system has great influence on the harvested energy. In prior studies on, e.g., the Wavestar concept, the generator was controlled to hold a constant pressure level. This study shows that it is better to control the generator torque based on a the actual pressure difference, allowing for pressure variation rather than seeking a control pressure. Furthermore the studies did not show improvements when implying reactive control, which however has been the case for other point absorber-type WECs. This may be due to the spacial absorber shape employed by Floating Power Plant and the discrete nature of the applicable PTO torque.
7. Conclusions
In conclusion, of all the wave power extraction algorithms that were tested, a continuously switching resistive algorithm performed the best, evaluated at power output when taking its adaptability to sea conditions into account. Implementing high-pressure pathways to the cylinders and performing reactive control was found not to increase the energy in a bandwidth large enough to become advantageous overall. Both endpoint switching and reactive control can, however, stand to gain increased performance if the incoming wave is known through predictive control or active wave measurements. It would therefore be very interesting to investigate some predictive control algorithms taking wave forecast into account.
Most importantly, one may conclude that a significant power increase is possible by implementing a pressure-dependent motor torque strategy instead of applying constant torque at the hydraulic motor. It is therefore very important to include the generator control in future investigations of PTO control for this type of PTO system.
As these findings are the first published for the current WEC PTO system, they will serve as baseline for future studies on control strategies for the Floating Power Plant technology. Compared to other studies, two interesting finding are seen; firstly, that reactive WPEAs do not improve energy production, which has been the case for other systems moving in a similar manner though with other PTO systems and absorbers; secondly, that the generator for the DDC system should not be controlled to give a constant system pressure level.


 ,
, 