

Petroleum Resource Potential Assessment of Members 1 and 3 of the Paleogene Shahejie Formation, Qikou Sag: Insights from Hydrocarbon Generation and Expulsion Capabilities


Abstract
:1. Introduction
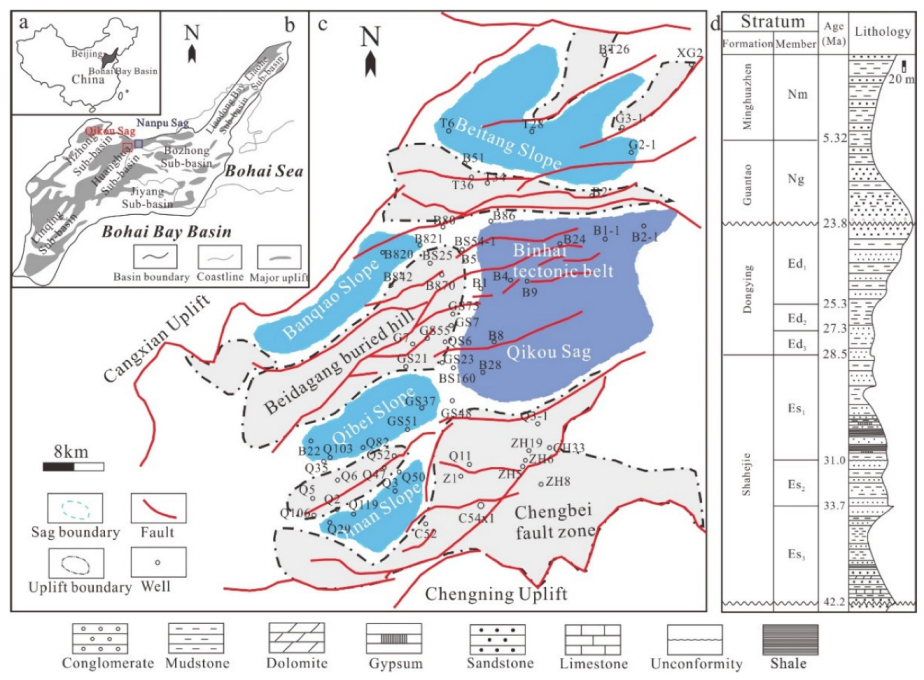
2. Geological Setting
3. Experiments and Methods
4. Results
4.1. Geological and Geochemical Determinations
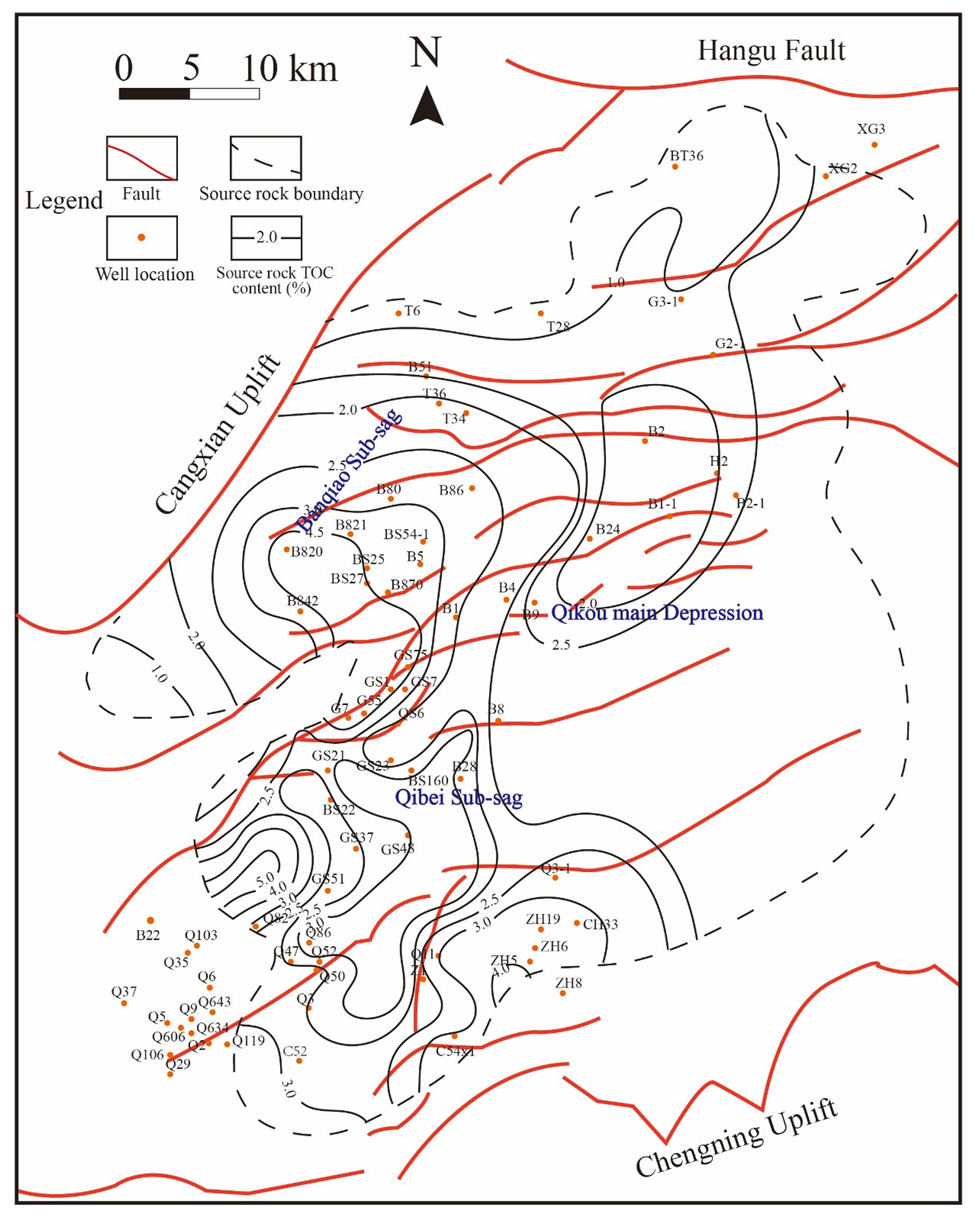
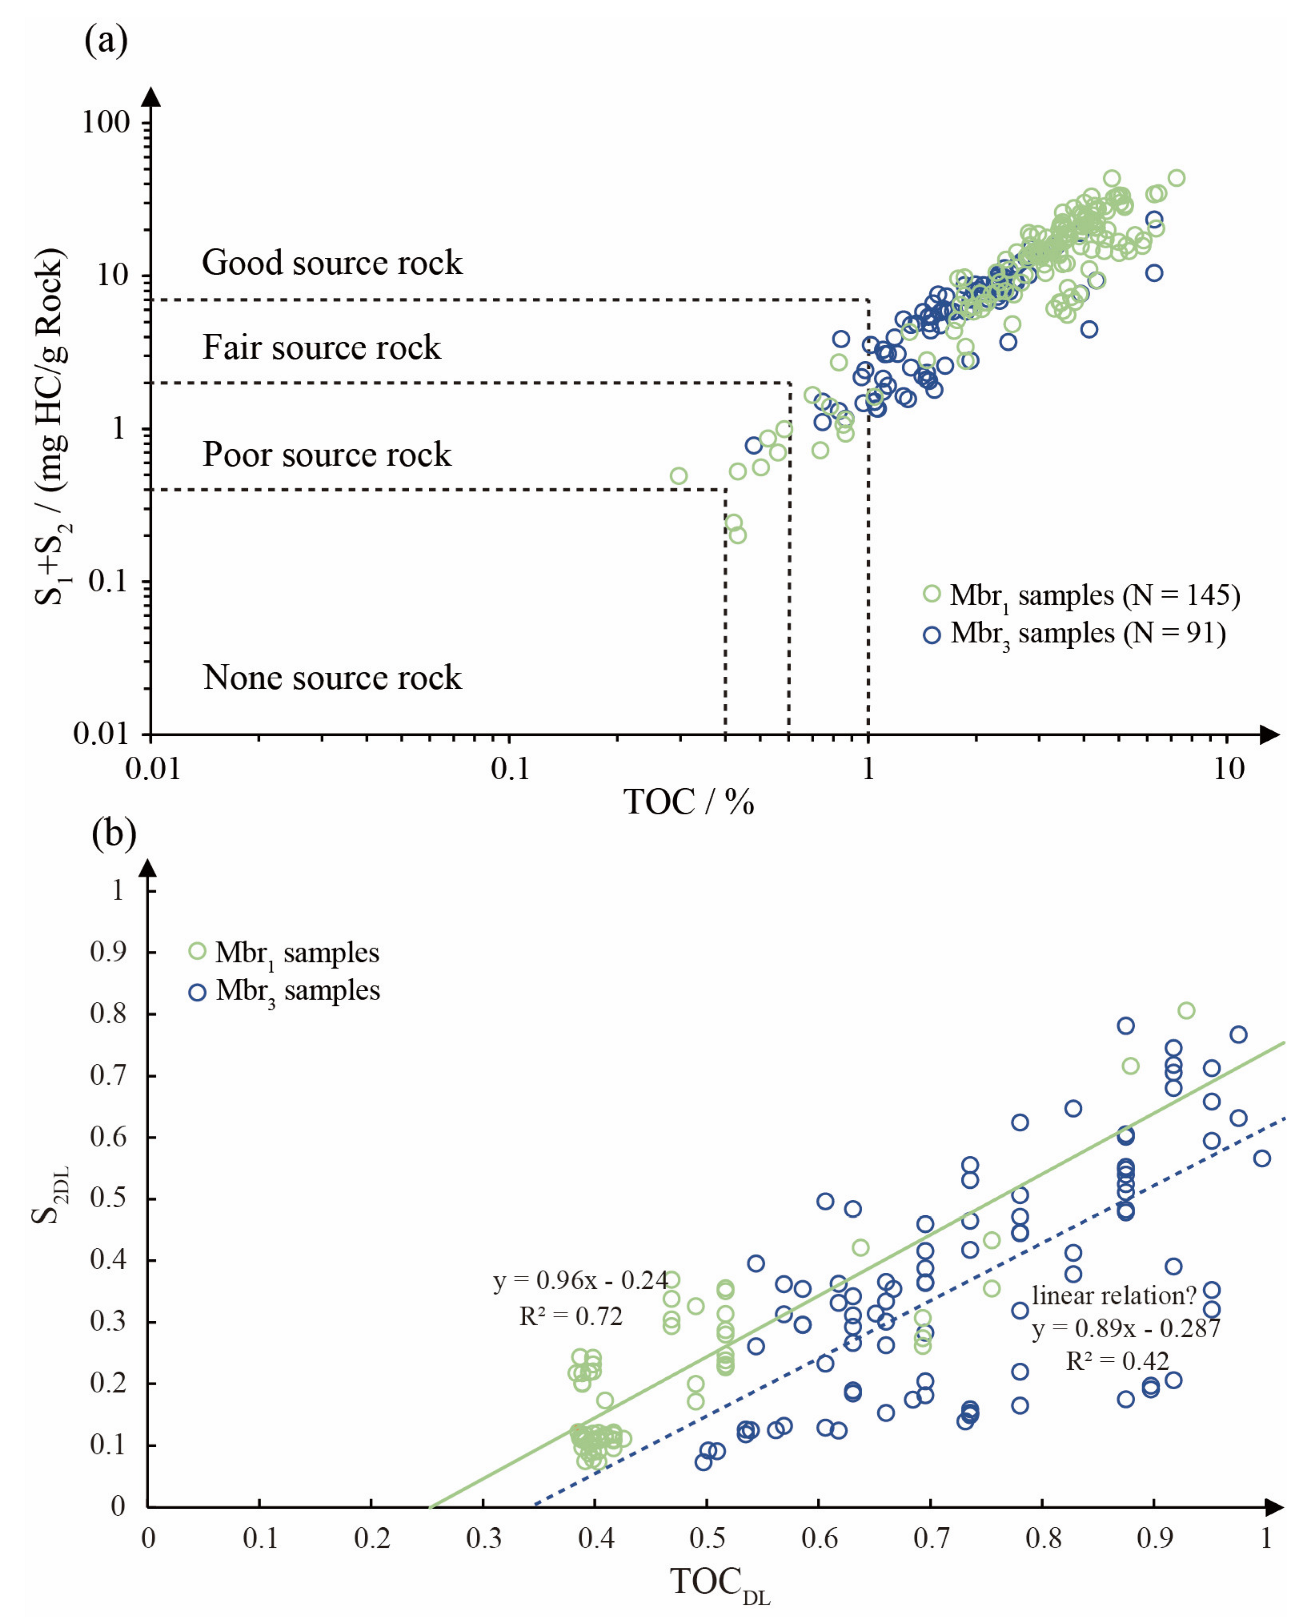
4.1.1. Source Rocks and Organic Content
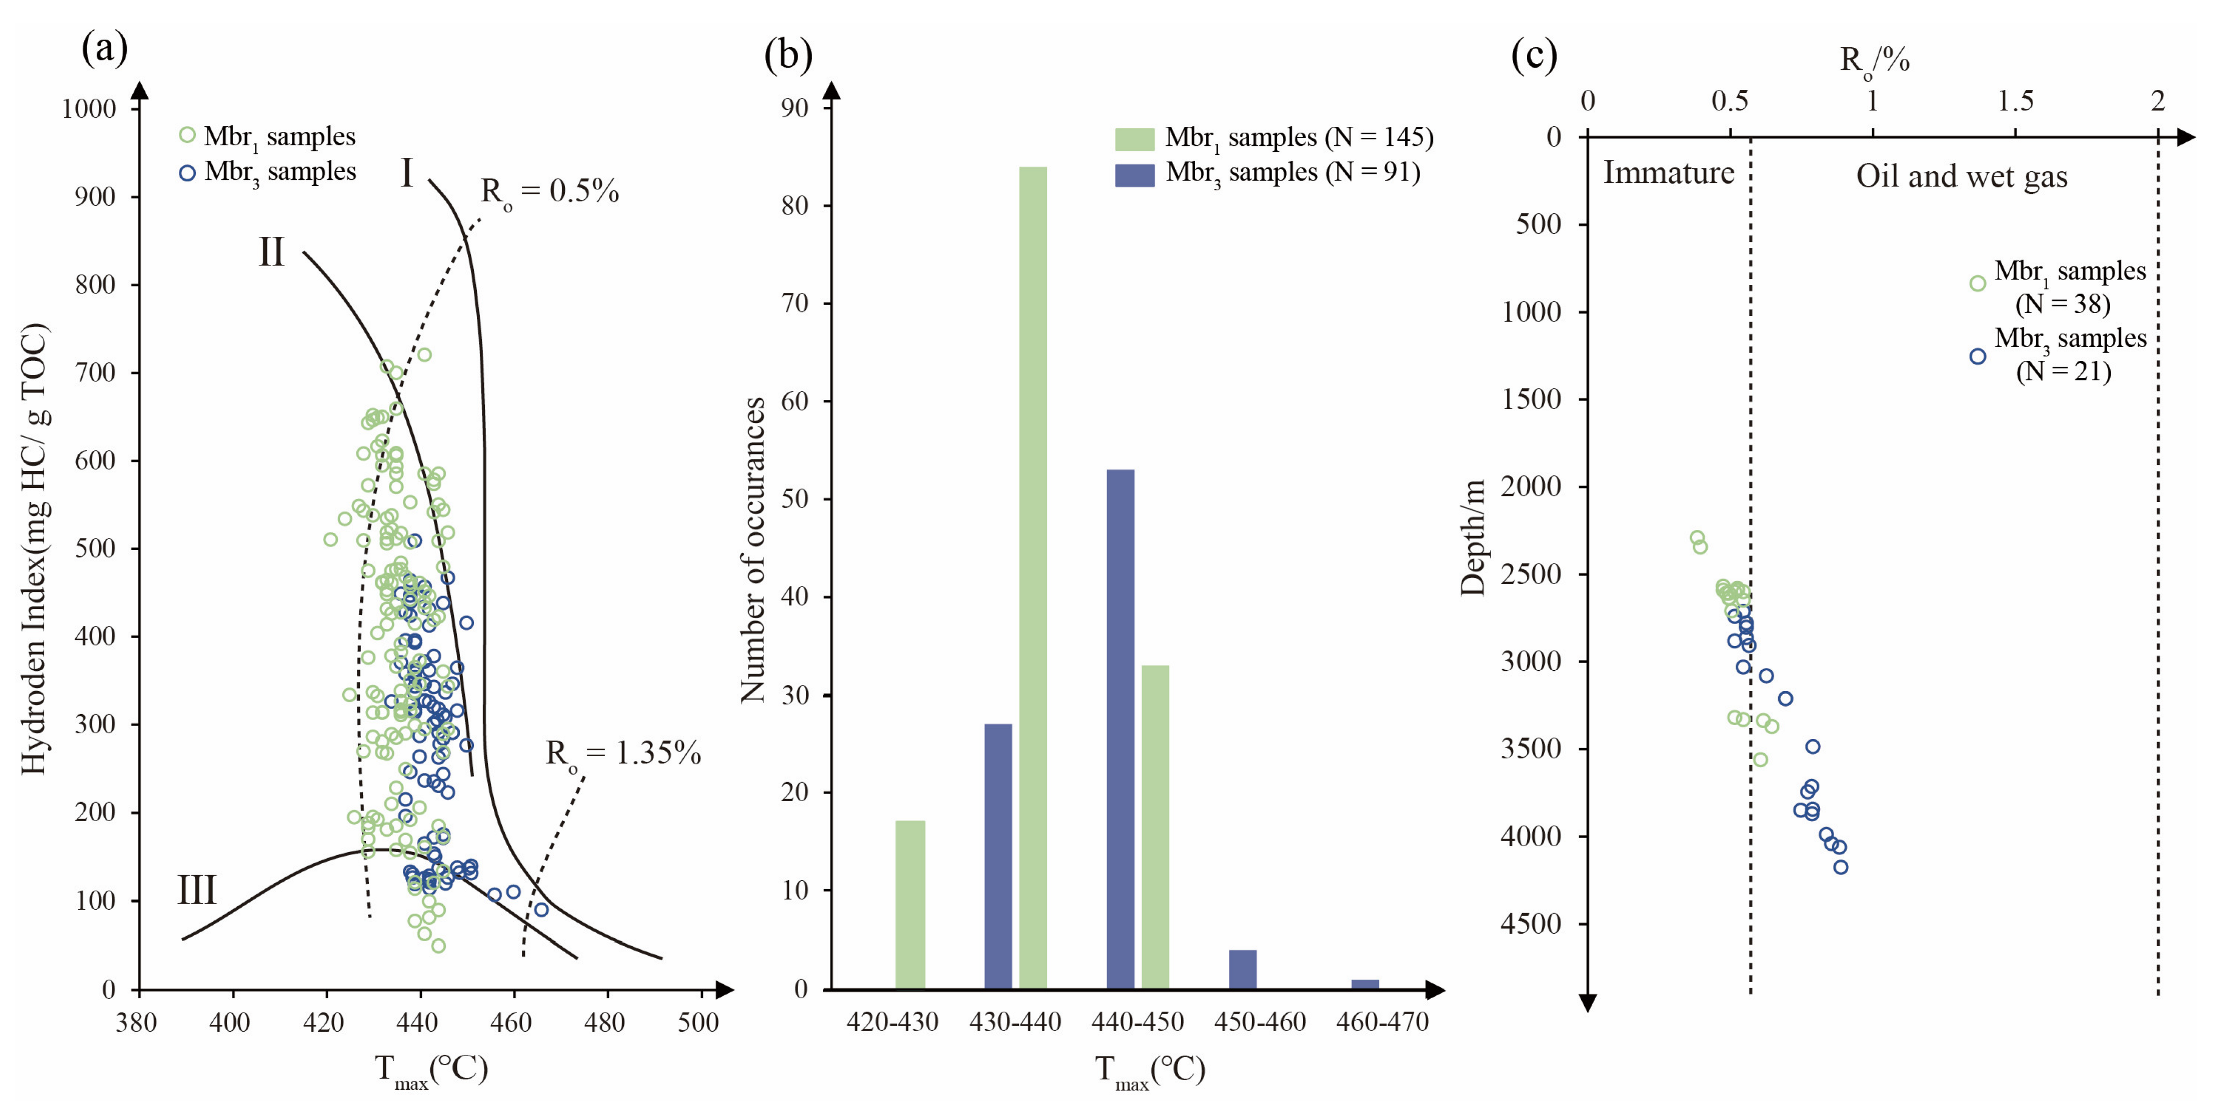
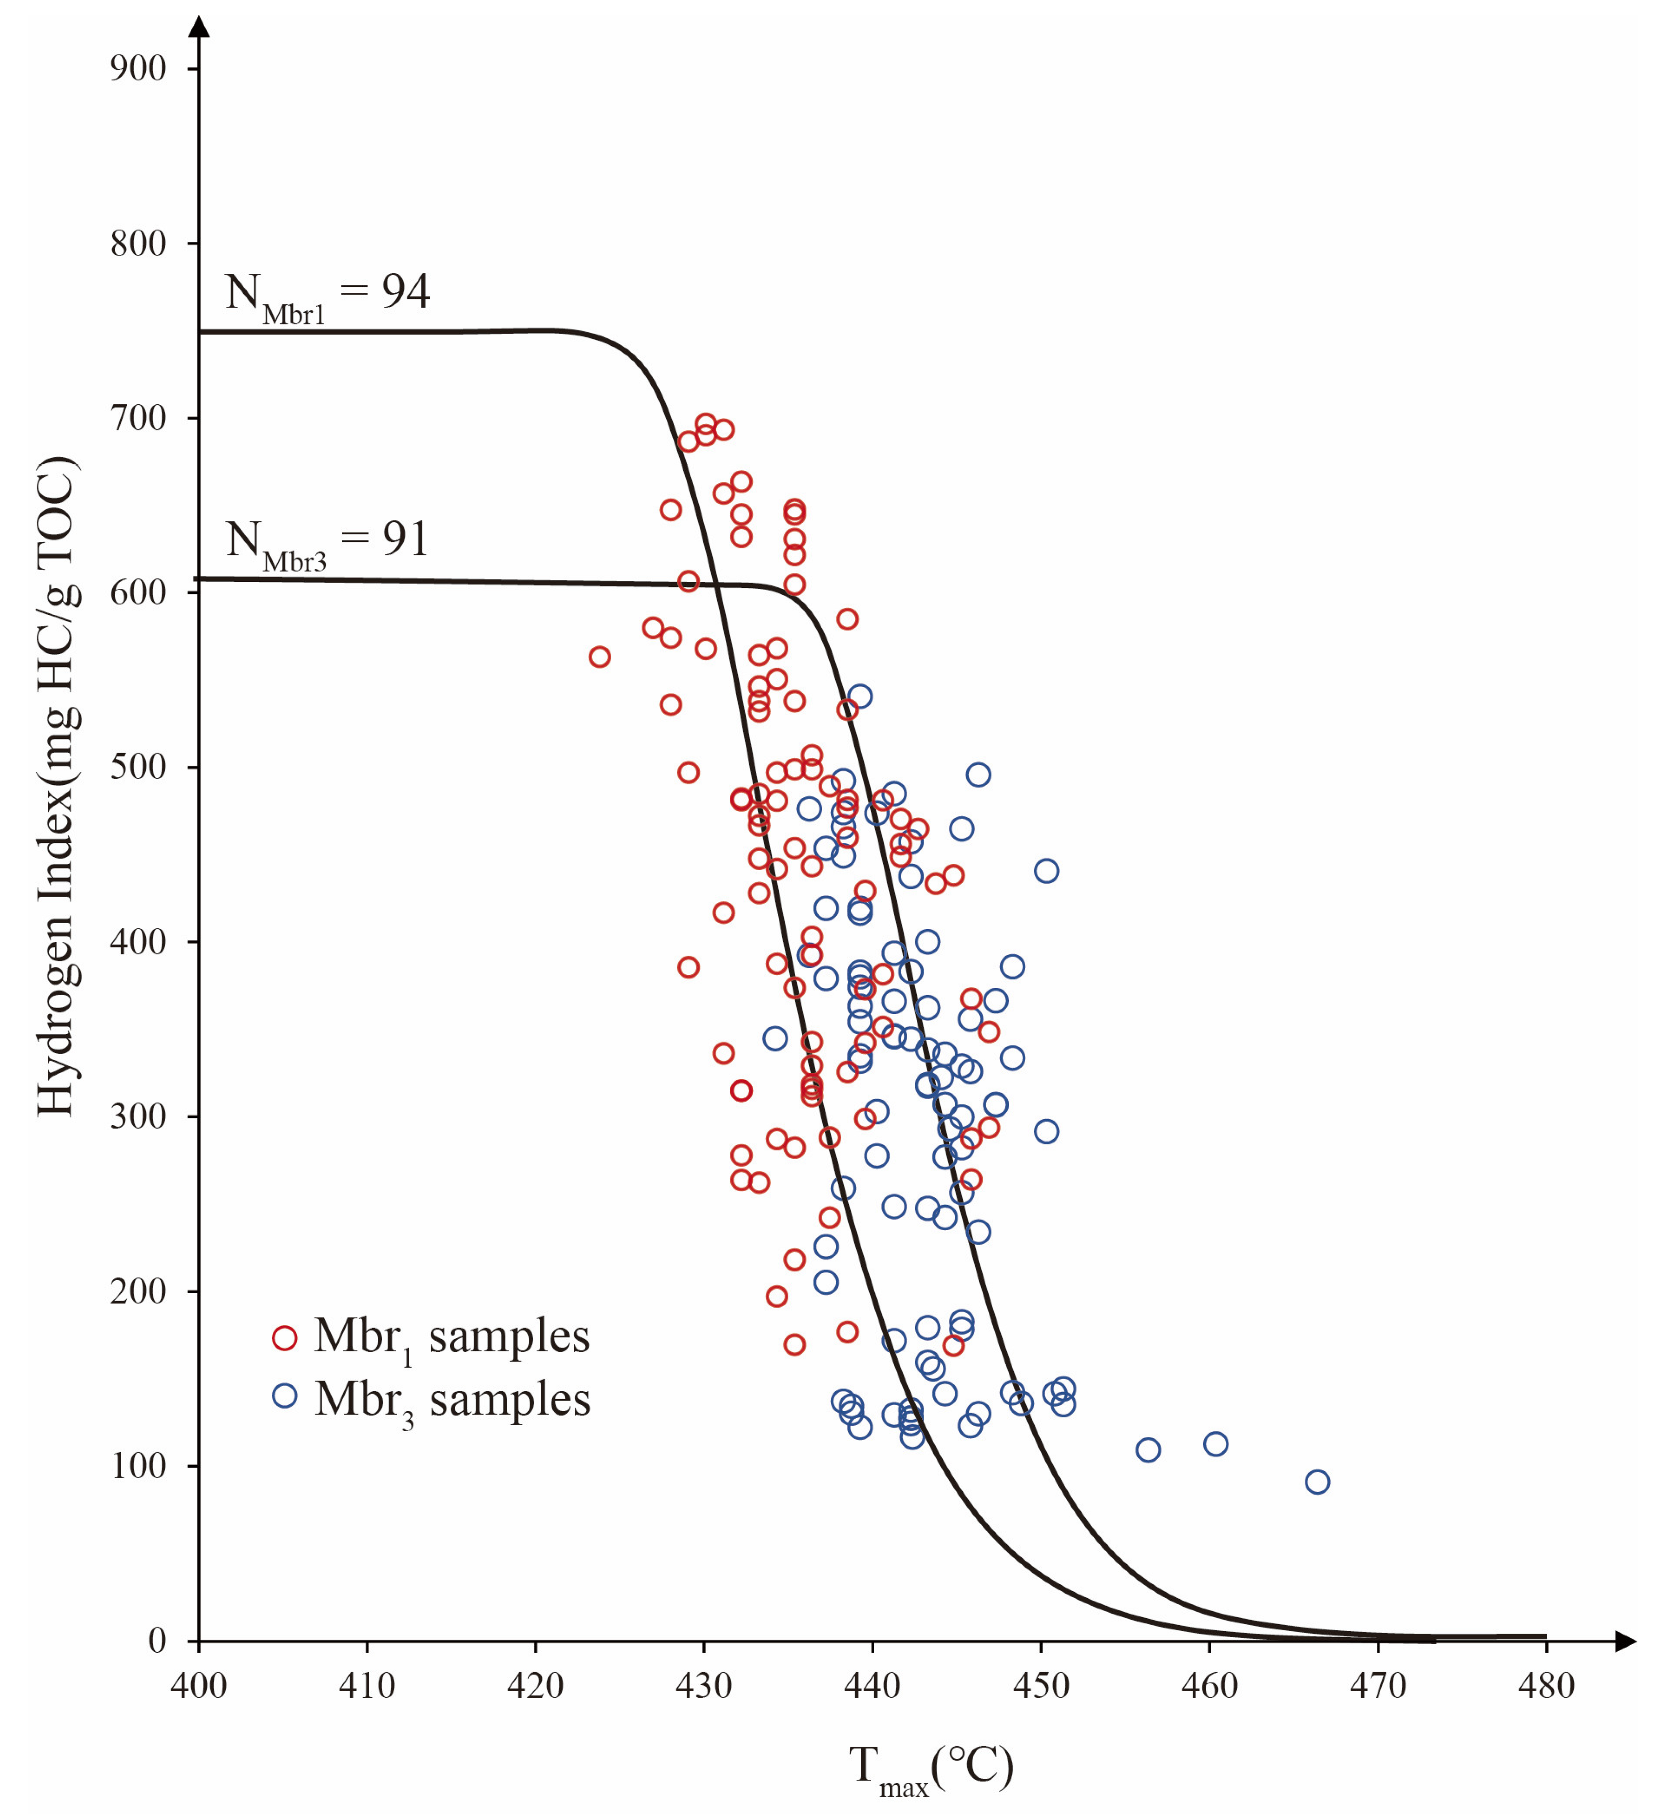
4.1.2. OM Type
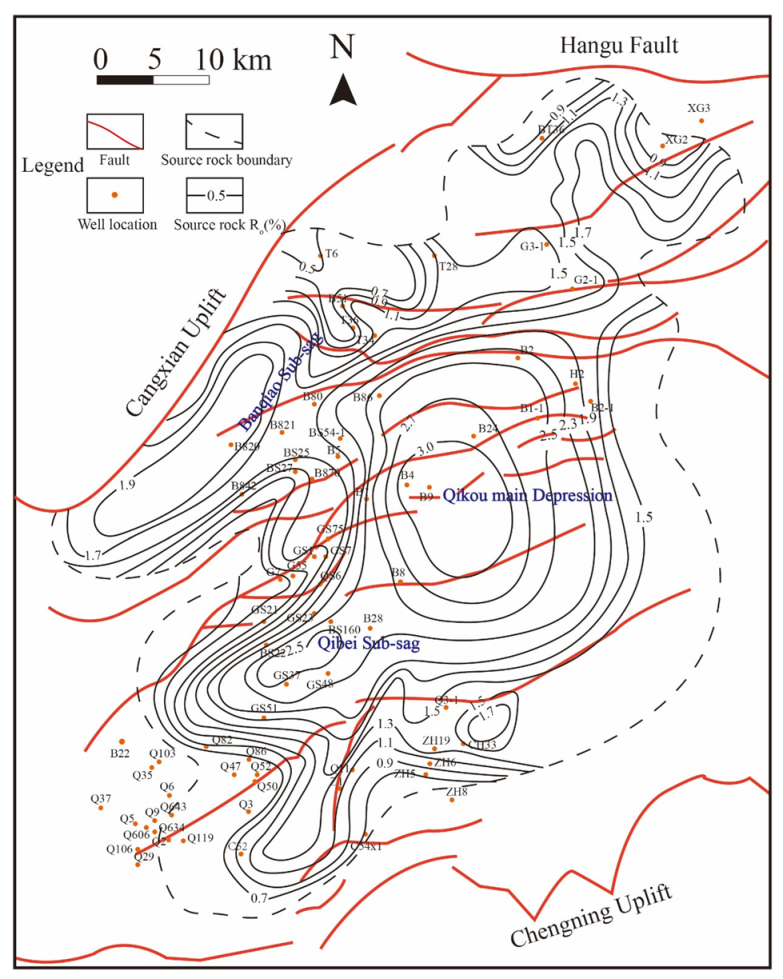
4.1.3. OM Maturity
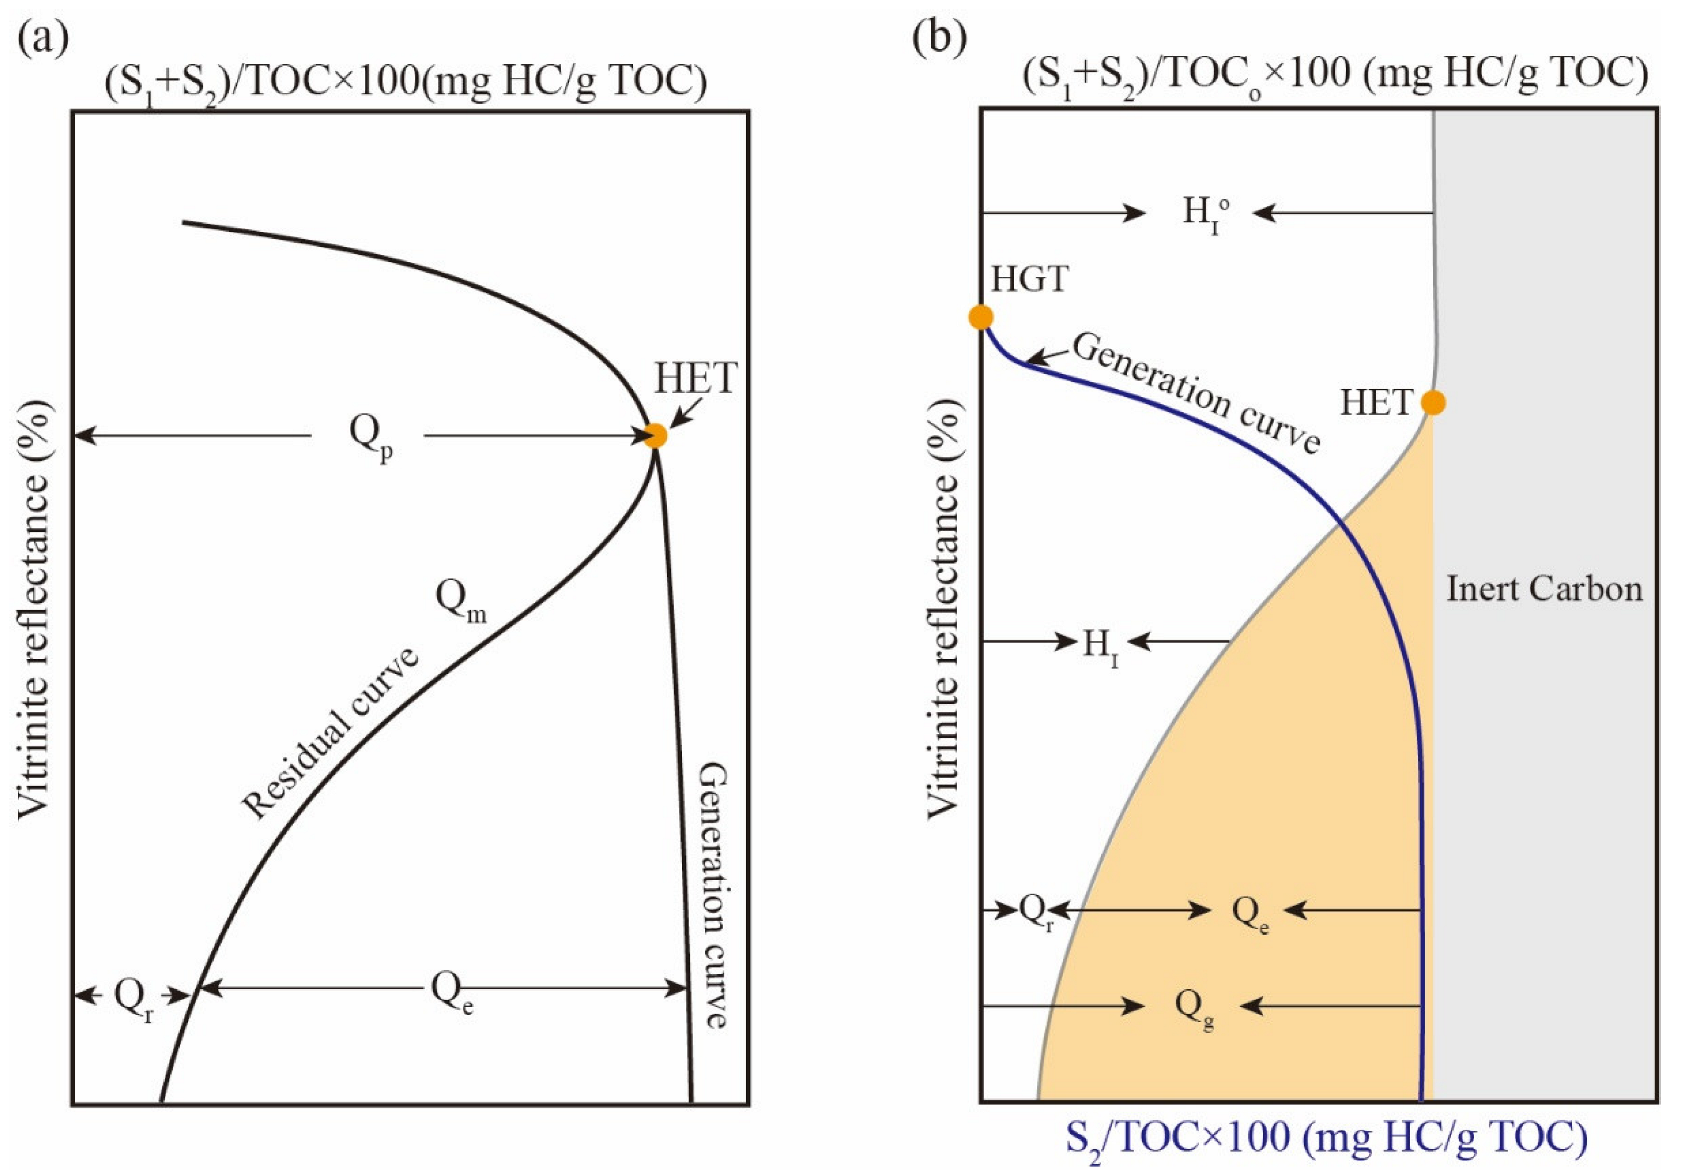
4.2. HC Generation Potential Model (HGPM)
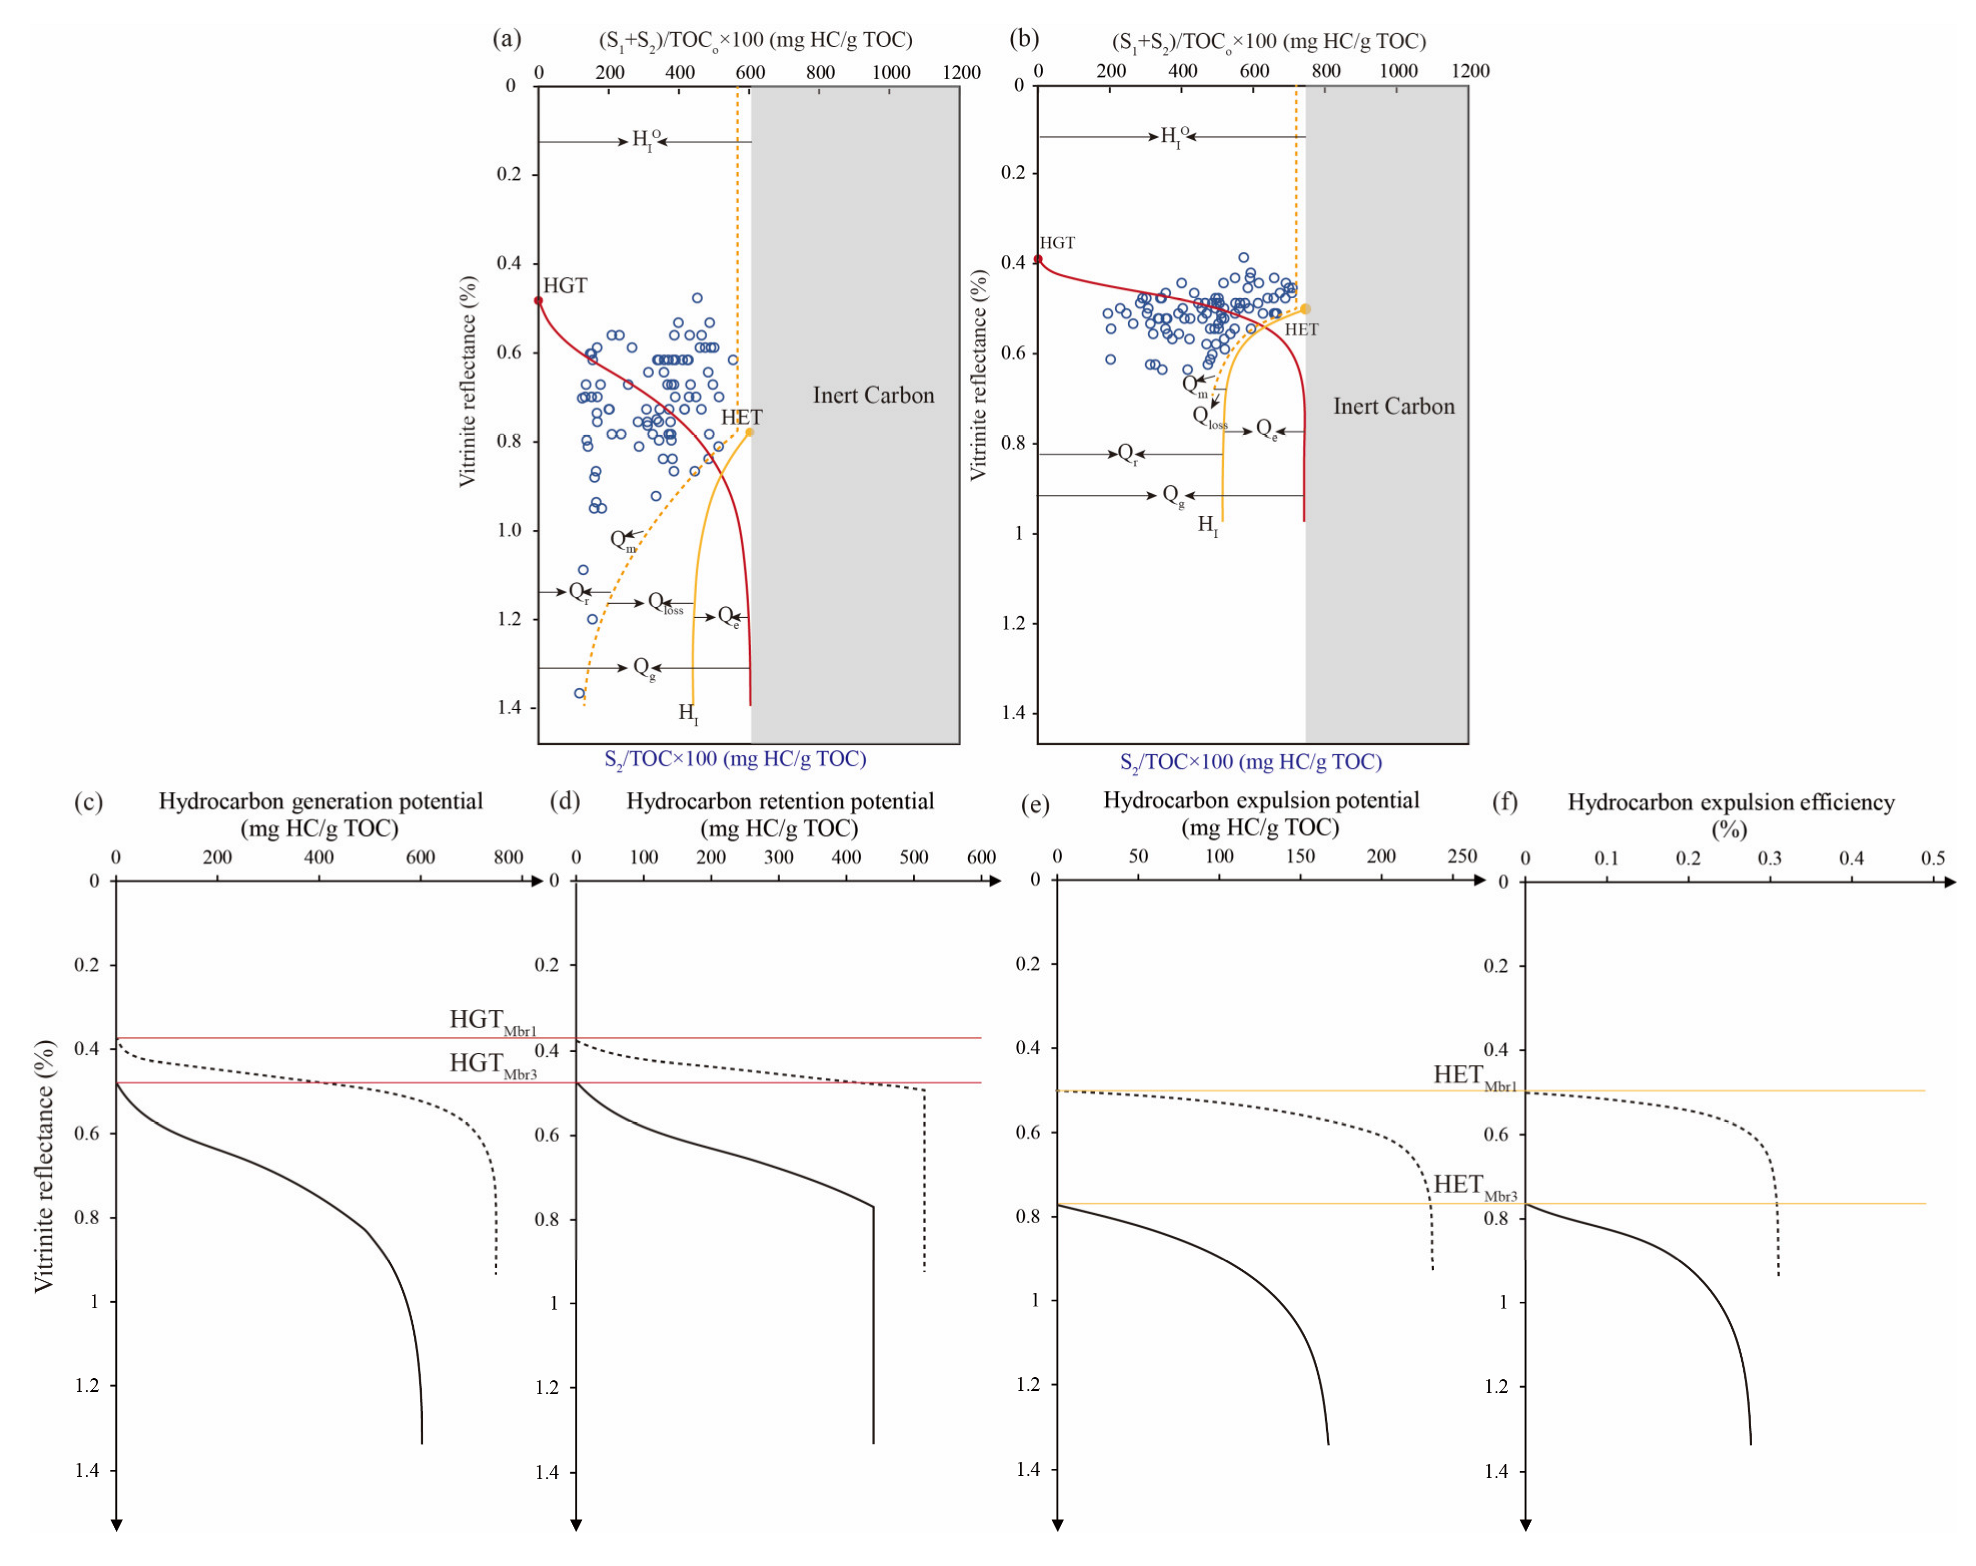
4.2.1. The Established HGPM
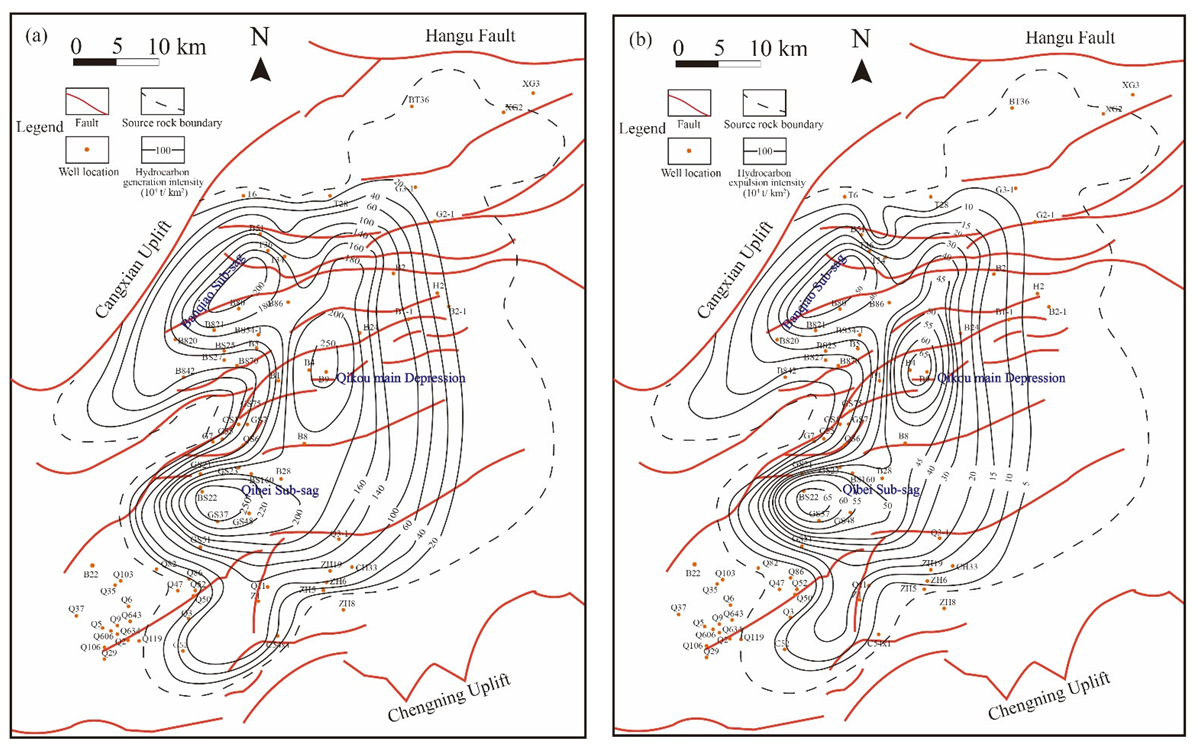
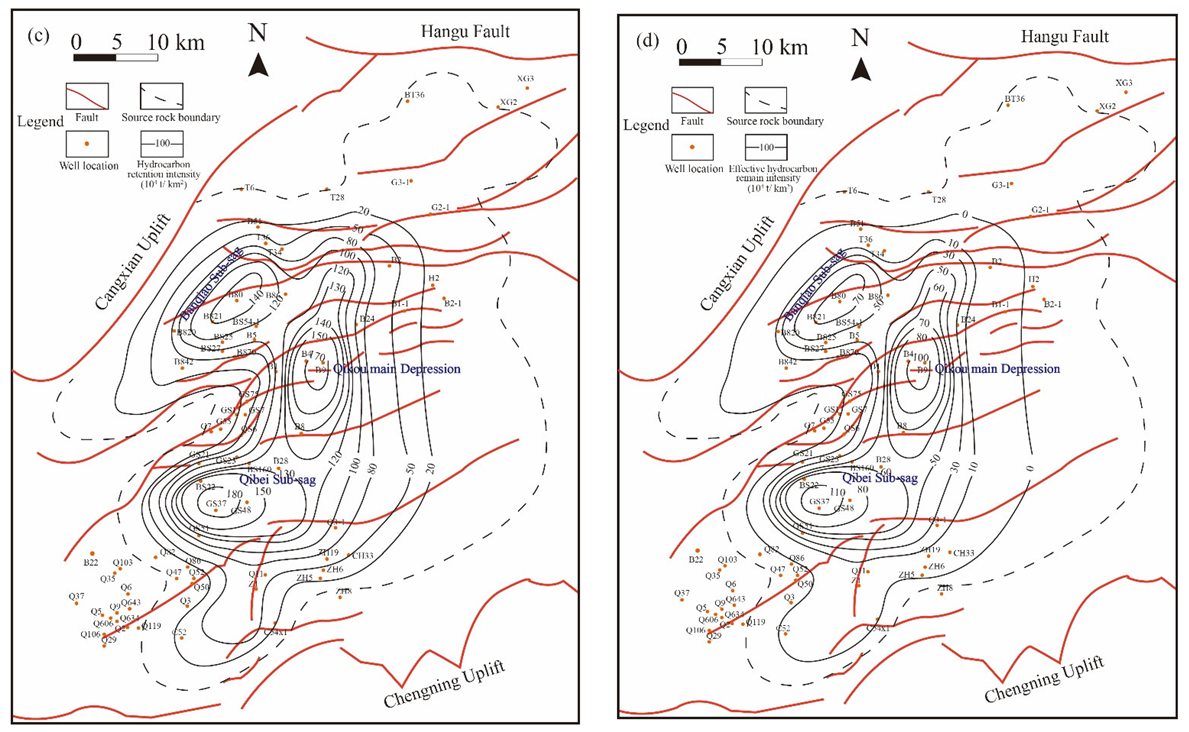
4.2.2. Intensity Features on Generated, Expelled, and Retentive HC
5. Discussion
5.1. Favorable Exploration Target
5.2. Differences between Mbr1 and Mbr3 Based on the HGPMs
5.2.1. Geological and Geochemical Features
5.2.2. Generation and Expulsion Features from the HGPMs
5.3. Possible Controlling Factors and Interpretations of Different HGPMs
6. Conclusions
Author Contributions
Funding
Acknowledgments
Conflicts of Interest
References
- Klett, T.R.; Charpentier, R.R. FORSPAN Model Use Guide U.S. Geological Survey Open—File Report; USGS: Reston, VA, USA, 2003; Volume 3, pp. 1–35. [Google Scholar]
- Jiang, F.; Chen, D.; Chen, J.; Li, Q.; Liu, Y.; Shao, X.; Hu, T.; Dai, J. Fractal analysis of shale pore structure of continental shale gas reservoir in the Ordos Basin, NW China. Energy Fuels 2016, 30, 4676–4689. [Google Scholar] [CrossRef]
- Katz, B.J. Lacustrine basin hydrocarbon exploration—Current thoughts. J. Paleolimnol. 2001, 26, 161–179. [Google Scholar] [CrossRef]
- Dow, W.G. Kerogen studies and geological interpretations. J. Geochem. Explor. 1977, 7, 79–99. [Google Scholar] [CrossRef]
- Hu, T.; Pang, X.; Yu, S.; Wang, X.; Pang, H.; Guo, J.; Jiang, F.; Shen, W.; Wang, Q.; Xu, J. Hydrocarbon generation and expulsion characteristics of lower Permian P1f source rocks in the Fengcheng area, northwest margin, Junggar Basin, NW China: Implications for tight oil accumulation potential assessment. Geol. J. 2016, 51, 880–900. [Google Scholar] [CrossRef]
- Tissot, B.; Durand, B.; Espitalie, J.; Combaz, A. Influence of the nature and diagenesis of organic matter in the formation of petroleum. AAPG Bull. 1974, 58, 499–506. [Google Scholar]
- Hakimi, M.H.; Ahmed, A.; Kahal, A.Y.; Hersi, O.S.; Qaysi, S. Organic geochemistry and basin modeling of late Cretaceous Harshiyat formation in the onshore and offshore basins in Yemen: Implications for effective source rock potential and hydrocarbon generation. Mar. Pet. Geol. 2020, 122, 104701. [Google Scholar] [CrossRef]
- Larue, K.D.; Underwood, M.B. Source rock potential of Franciscan Complex: The galloping gourmet and the hydrocarbon kitchen. AAPG Bull. 1986, 70, 471. [Google Scholar]
- Justwan, H.; Dahl, B. Quantitative hydrocarbon potential mapping and organofacies study in the Greater Balder Area, Norwegian North Sea. Pet. Geol. Conf. Proc. 2005, 6, 1317–1329. [Google Scholar] [CrossRef]
- Jiang, F.; Pang, X.; Li, L.; Wang, Q.; Dong, Y.; Hu, T.; Chen, L.; Chen, J.; Wang, Y. Petroleum resources in the Nanpu Sag, Bohai Bay Basin, Eastern China. AAPG Bull. 2018, 102, 1213–1237. [Google Scholar] [CrossRef]
- Freund, H.; Clouse, J.A.; Otten, G.A. The effect of pressure on the kinetics of kerogen pyrolysis. Energy Fuels 1993, 7, 1088–1094. [Google Scholar] [CrossRef]
- Li, C.R.; Pang, X.Q.; Huo, Z.P.; Wang, E.Z.; Xue, N. A revised method for reconstructing the hydrocarbon generation and expulsion history and evaluating the hydrocarbon resource potential: Example from the first member of the Qingshankou Formation in the Northern Songliao Basin, Northeast China. Mar. Pet. Geol. 2020, 121, 104577. [Google Scholar] [CrossRef]
- Pang, X.Q.; Li, M.W.; Li, S.M.; Jin, Z.J. Geochemistry of petroleum systems in the Niuzhuang south slope of Bohai Bay Basin: Part 3. Estimating petroleum expulsion from the Shahejie formation. Org. Geochem. 2005, 36, 497–510. [Google Scholar] [CrossRef]
- Wang, P.; Chen, X.; Pang, X.; Li, J.; Yang, H.; Jaing, F.; Guo, J.; Guo, F.; Peng, W.; Xu, J.; et al. Gas generation and expulsion characteristic of middle-upper Triassic source rocks, Eastern Kuqa Depression, Tarim Basin, China. Aust. J. Earth Sci. 2014, 61, 1001–1013. [Google Scholar] [CrossRef]
- Bai, H.; Pang, X.; Kuang, L.; Pang, H.; Wang, X.; Jia, X.; Zhou, L.; Hu, T. Hydrocarbon expulsion potential of source rocks and its influence on the distribution of lacustrine tight oil reservoir, Middle Permian Lucaogou Formation, Jimsar Sag, Junggar Basin, Northwest China. J. Pet. Sci. Eng. 2016, 149, 740–755. [Google Scholar] [CrossRef]
- Zheng, D.; Pang, X.; Ma, X.; Li, C.; Zheng, T.; Zhou, L. Hydrocarbon generation and expulsion characteristics of the source rocks in the third member of the upper Triassic Xujiahe formation and its effect on conventional and unconventional hydrocarbon resource potential in the Sichuan Basin. Mar. Pet. Geol. 2019, 109, 175–192. [Google Scholar] [CrossRef]
- Chen, J.; Pang, X.; Pang, H.; Chen, Z.; Jiang, C. Hydrocarbon evaporative loss evaluation of lacustrine shale oil based on mass balance method: Permian Lucaogou Formation in Jimusaer Depression, Junggar Basin. Mar. Pet. Geol. 2018, 91, 422–431. [Google Scholar] [CrossRef]
- Chen, Z.H.; Jiang, C.Q. A revised method for organic porosity estimation in shale reservoirs using rock—Eval data: Example from Duvernay Formation in the Western Canada Sedimentary Basin. AAPG Bull. 2016, 100, 405–422. [Google Scholar] [CrossRef]
- Chen, Z.; Jiang, C.; Lavoie, D.; Reyes, J. Model-assisted rock-eval data interpretation for source rock evaluation: Examples from producing and potential shale gas resource plays. Int. J. Coal. Geol. 2016, 165, 290–302. [Google Scholar] [CrossRef]
- Jiang, F.J.; Pang, X.Q.; Bai, J.; Zhou, X.; Li, J.; Guo, Y. Comprehensive assessment of source rocks in the Bohai Sea area, Eastern China. AAPG Bull. 2016, 100, 969–1002. [Google Scholar]
- Wu, Z.Y.; Zhao, X.Z.; Wang, E.Z.; Pu, X.G.; Lush, G.; Han, W.Z.; Zhang, W.; Feng, Y. Sedimentary environment and organic enrichment mechanisms of lacustrine shale: A case study of the Paleogene Shahejie formation, Qikou Sag, Bohai Bay Basin. Palaeogeogr. Palaeoclim. Palaeoecol. 2021, 573, 110404. [Google Scholar] [CrossRef]
- Pu, X.; Zhou, L.; Xiao, D.; Hua, S.; Chen, C.; Yuan, X.; Han, G.; Zhang, W. Lacustrine carbonates in the southwest margin of the Qikou Sag, Huanghua Depression, Bohai Bay Basin. Petrol. Explor. Dev. 2011, 38, 136–144. [Google Scholar] [CrossRef]
- Gao, F.H.; Zhang, Y.S.; Pu, X.G.; Yang, Y.; Zhang, T.Y. Type of dolomization and formation mechanism: A case study of Palaeogene Es1 in Qikou Sag. J. Jilin Univ. 2017, 47, 355–369. [Google Scholar]
- Zhao, X.Z.; Zhou, L.H.; Pu, X.G.; Shi, Z.N.; Han, G.M.; Wu, J.P.; Wenzhong, H.; Wei, Z.; Huanhuan, G.; Jianying, M.; et al. Geological characteristics and exploration breakthrough of shale oil in member 3 of shahejie formation of Qibei subsag, Qikou Sag. Acta Sedimentol. Sin. 2020, 41, 643–657. [Google Scholar]
- Espitalié, J.; Madec, M.; Tissot, B.; Mennig, J.J.; Leplat, P. Source Rock Characterization Method for Petroleum Exploration (OTC 2935). In Proceedings of the Offshore Technology Conference, Houston, TX, USA, 1–4 May 1977; pp. 439–444. [Google Scholar]
- Wang, E.Z.; Liu, G.Y.; Pang, X.Q.; Li, C.Q.; Zhao, Z.F.; Feng, Y.; Wu, Z.Y. An improved hydrocarbon generation potential method for quantifying hydrocarbon generation and expulsion characteristics with application example of Paleogene Shahejie Formation, Nanpu Sag, Bohai Bay Basin. Mar. Mar. Pet. Geol. 2020, 112, 104106. [Google Scholar] [CrossRef]
- Chen, Z.; Jiang, S. A data driven model for studying kerogen kinetics with application examples from Canadian sedimentary basins. Mar. Pet. Geol. 2015, 67, 795–807. [Google Scholar] [CrossRef]
- Espitalié, J. Use of Tmax as a Maturation Index for Different Types of Organic Matter-Comparison with Vitrinite Reflectance. In Thermal Modeling in Sedimentary Basins; Burrus, J., Ed.; Editions Technip: Paris, France, 1985; pp. 475–496. [Google Scholar]
- Chen, Z.; Li, M.; Jiang, C.; Qian, M. Shale oil resource potential and its mobility assessment: A case study of Upper Devonian Duvernay shale in Western Canada Sedimentary Basin. Oil Gas Geol. 2019, 40, 459–468. [Google Scholar]
- Jarvie, D.M. Shale Resource Systems for Oil and Gas: Part 2—Shale-Oil Resource Systems. In Shale Reservoirs-Giant Resources for the 21st Century; AAPG Memoir; Breyer, J.A., Ed.; AAPG: Tulsa, OK, USA, 2012; Volume 97, pp. 89–119. [Google Scholar]
- Huang, Z.K.; Hao, Y.Q.; Li, S.J.; Wo, Y.J.; Sun, D.S.; Li, M.W.; Chen, J.P. Oil−bearing potential, mobility evaluation and significance of shale oil in Chang 7 shale system in the Ordos Basin: A case study of well H317. Geol. China 2020, 47, 210–219. [Google Scholar]
- Huang, D.F.; Li, J.C. Quantitative Evaluation of Source Rocks. Continental Hydrocarbon Generation in China; Petroleum Industry Press: Beijing, China, 1982; pp. 175–176. [Google Scholar]
- Vandenbroucke, M.; Largeau, C. Kerogen origin, evolution and structure. Org. Geochem. 2007, 38, 719–833. [Google Scholar] [CrossRef]
- Yu, X.M.; He, Y.M.; Jiang, W.Y.; Liu, Q.X.; Liang, B.X.; Zou, L.L. Hydrocarbon generation of Paleogene source rocks in Qikou Sag. Nat. Gas Geosci. 2011, 22, 1001–1008. [Google Scholar]
- Peters, K.E.; Cassa, M.R. Applied source-rock geochemistry. Am. Assoc. Petrol. Geol. Mem. 1994, 60, 93–120. [Google Scholar]
- Wu, Z.Y.; Zhao, X.Z.; Pu, X.G.; Wang, E.Z.; Dong, X.Y.; Li, C.R. Petroleum resource potential evaluation using insights based on hydrocarbon generation, expulsion, and retention capabilities—A case study targeting the Paleogene Es1 formation, Qikou Sag. J. Pet. Sci. Eng. 2022, 208, 109667. [Google Scholar] [CrossRef]
- Chen, Z.Y.; Chen, J.F.; Zhong, N.N.; Fei, W.W.; Dong, Q.W.; Chen, J.; Wang, Y.Y. The geneses of sedimentary organic matter with anomalous 13C-enriched isotopic composition in saline and freshwater lakes: A case study of lacustrine source rocks from Dongpu and Qikou sags, Bohai Bay Basin, Eastern China. Mar. Pet. Geol. 2020, 118, 104434. [Google Scholar] [CrossRef]
- Zhou, L.H.; Han, G.M.; Yang, F.; Ma, L.Y.; Mou, L.G.; Zhou, K.J.; Wang, C.; Meng, L. Geological characteristics and shale oil exploration of Es3(1) in Qikou Sag, Bohai Bay Basin. Oil Gas Geol. 2021, 42, 443–455. [Google Scholar]
- Wang, E.Z.; Liu, G.Y.; Pang, X.Q.; Wu, Z.Y.; Li, C.R.; Bai, H.; Zhang, Z.H. Sedimentology, diagenetic evolution, and sweet spot prediction of tight sandstone reservoirs: A case study of the third member of the Upper Paleogene Shahejie Formation, Nanpu Sag, Bohai Bay Basin, China. J. Pet. Sci. Eng. 2020, 186, 106718. [Google Scholar] [CrossRef]
- Wang, E.Z.; Feng, Y.; Guo, T.L.; Li, M.W. Oil content and resource quality evaluation methods for lacustrine shale: A review and a novel three-dimensional quality evaluation model. Earth–Sci. Rev. 2022, 232, 104134. [Google Scholar] [CrossRef]
- Wang, E.Z.; Li, C.R.; Feng, Y.; Song, Y.C.; Guo, T.L.; Li, M.W.; Chen, Z.H. Novel method for determining the oil moveable threshold and an innovative model for evaluating the oil content in shales. Energy. 2022, 239(A), 121848. [Google Scholar] [CrossRef]
- Huang, S.; Li, J.; Wang, T.; Jiang, Q.; Jiang, H.; Tao, X.; Bai, B.; Feng, Z. Application of Light Hydrocarbons in Natural Gas Geochemistry of Gas Fields in China. Annu. Rev. Earth Pl. SC. 2022, 50, 13–53. [Google Scholar] [CrossRef]
- Chen, Z.; Jiang, C. An integrated mass balance approach for assessing hydrocarbon resources in a liquid-rich shale resource play: An example from Upper Devonian Duvernay Formation, Western Canada Sedimentary Basin. J. Earth. Sci.-China 2020, 31, 1259–1272. [Google Scholar] [CrossRef]
- Zhou, L.H.; Yu, X.M.; Jiang, W.Y.; Hua, S.J.; Zou, L.L.; Yu, C. Overpressure retardation of the thermal evolution of Paleogene source rocks and its significance for petroleum geology in Qikou Sag. Nat. Gas Geosci. 2013, 24, 1118–1124. [Google Scholar]


| Area | Formation | Thickness (m) | Kerogen Type | TOC (%) | Thermal Evolution STAGE | HC Expulsion Threshold | Ro (%) | Qg (mg HC/g TOC) | Qe (mg HC/g TOC) | Qr (mg HC/g TOC) | ΔQe (mg HC/g TOC)/(0.1% Ro) | E (%) |
|---|---|---|---|---|---|---|---|---|---|---|---|---|
| Qikou Sag | Mbr3 | 1200 | Type II, III | 0.43–5.16 (1.66) | Mature | Ro=0.78% | 0.4 | 0 | 0 | 0 | 0 | 0 |
| 0.5 | 10.53 | 0 | 10.53 | 0 | 0 | |||||||
| 0.6 | 121.14 | 0 | 121.14 | 0 | 0 | |||||||
| 0.7 | 319.83 | 0 | 319.83 | 0 | 0 | |||||||
| 0.8 | 462.67 | 26.43 | 436.24 | 26.43 | 5.7 | |||||||
| 0.9 | 537.14 | 100.90 | 436.24 | 74.47 | 18.8 | |||||||
| 1 | 573.05 | 136.81 | 436.24 | 35.91 | 23.9 | |||||||
| 1.1 | 590.15 | 153.91 | 436.24 | 17.10 | 26.1 | |||||||
| 1.2 | 598.30 | 162.06 | 436.24 | 8.16 | 27.1 | |||||||
| 1.3 | 602.21 | 165.97 | 436.24 | 3.91 | 27.6 | |||||||
| 1.4 | 604.10 | 167.86 | 436.24 | 1.88 | 27.8 | |||||||
| 1.5 | 605.01 | 168.77 | 436.24 | 0.91 | 27.9 | |||||||
| Qikou Sag | Mbr1 | 1200 | Type I | 0.27–5.93 (2.72) | Mature | Ro=0.50% | 0.3 | 0 | 0 | 0 | 0 | 0 |
| 0.4 | 11.83 | 0 | 11.83 | 0 | 0 | |||||||
| 0.5 | 515.96 | 0.53 | 515.42 | 0.53 | 0.1 | |||||||
| 0.6 | 711.43 | 196.01 | 515.42 | 195.48 | 27.6 | |||||||
| 0.7 | 741.19 | 225.77 | 515.42 | 29.76 | 30.5 | |||||||
| 0.8 | 746.00 | 230.58 | 515.42 | 4.81 | 30.90 | |||||||
| 0.9 | 746.82 | 231.39 | 515.42 | 0.81 | 30.98 | |||||||
| 1 | 746.96 | 231.53 | 515.42 | 0.14 | 31 | |||||||
| 1.1 | 746.98 | 231.56 | 515.42 | 0.03 | 31 | |||||||
| 1.2 | 746.99 | 231.57 | 515.42 | 0.01 | 31 |
Publisher’s Note: MDPI stays neutral with regard to jurisdictional claims in published maps and institutional affiliations. |
© 2022 by the authors. Licensee MDPI, Basel, Switzerland. This article is an open access article distributed under the terms and conditions of the Creative Commons Attribution (CC BY) license (https://creativecommons.org/licenses/by/4.0/).
Share and Cite
Wu, Z.; Zhao, X. Petroleum Resource Potential Assessment of Members 1 and 3 of the Paleogene Shahejie Formation, Qikou Sag: Insights from Hydrocarbon Generation and Expulsion Capabilities. Energies 2022, 15, 7078. https://doi.org/10.3390/en15197078
Wu Z, Zhao X. Petroleum Resource Potential Assessment of Members 1 and 3 of the Paleogene Shahejie Formation, Qikou Sag: Insights from Hydrocarbon Generation and Expulsion Capabilities. Energies. 2022; 15(19):7078. https://doi.org/10.3390/en15197078
Chicago/Turabian StyleWu, Zhuoya, and Xianzheng Zhao. 2022. "Petroleum Resource Potential Assessment of Members 1 and 3 of the Paleogene Shahejie Formation, Qikou Sag: Insights from Hydrocarbon Generation and Expulsion Capabilities" Energies 15, no. 19: 7078. https://doi.org/10.3390/en15197078
APA StyleWu, Z., & Zhao, X. (2022). Petroleum Resource Potential Assessment of Members 1 and 3 of the Paleogene Shahejie Formation, Qikou Sag: Insights from Hydrocarbon Generation and Expulsion Capabilities. Energies, 15(19), 7078. https://doi.org/10.3390/en15197078