Abstract
The generation and emission characteristics of fine particulates (PM2.5) from three 300 MW power plant circulating fluidized bed boilers were investigated. One boiler had an external bed and used an electrostatic precipitator, the other two used an electrostatic filter precipitator and fabric filter, respectively. The particle size distribution of fine particles was performed by an electrical low-pressure impactor. PM2.5 samplers were used at the same time to collect fine particles for subsequent laboratory analysis. The results show that the number size distributions of fine particles presented one single peak, but there was no peak in mass size distributions. The mass concentrations of three CFB boilers were similar, but the number concentration of the external bed CFB boiler was much higher than that of the general CFB boiler. The minimum removal efficiencies of the precipitator appeared between 0.1~1 μm, but the locations of the minimum point were different. The morphology of fine particles was mostly irregular. The highest content of fine particles was insoluble oxides and the content of S element was also high. Different precipitators have different removal effects on Si, Al, Ca, S and Fe in fine particles, but they all have poor removal effects on Na and K as well as OC and EC.
1. Introduction
With the massive emission of CO2 and fine particles, environmental problems such as the global greenhouse effect and smog are becoming more serious. Fine particles have always been a main environmental atmospheric pollutant and a research hotspot in China. Fine particles whose aerodynamic diameter are less than 2.5 μm are also called PM2.5. Because of their low sedimentation velocity, caused by small aerodynamic diameter, fine particles can be suspended for several months in the air and transmitted thousands of miles away. Studies have shown that between city and suburb, the PM10 concentrations are different, but PM2.5 concentrations are much closer [1]. PM2.5 can enter the alveolus region of the lungs and then enter the blood circulatory system [2,3]. Due to their small volume, the surface area of fine particles is very large, and lots of organic matter (e.g., polycyclic aromatic hydrocarbons), bacteria and other harmful substances in the atmosphere are absorbed on them [4]. Fine particles emitted from stationary combustion sources is often rich in toxic trace elements that are harmful to humans [5].
In the Twentieth Century for 80 years, PM had concerned many foreign scholars. At that time, the classical theory that particles emitted from coal combustion in pulverized coal boilers (PCB) had bimodal distribution [6] has been widely accepted. Markowski and Ensor [7] measured a pulverized coal utility boiler in 1980 and they found a sharp peak of PM number and mass distribution in the submicron region appeared both upstream and the downstream of the dust remover. The mode (fine-mode) and chemical composition of these submicron aerosols were obviously different from a large fly ash aerosol which was formed by char fragmentation and surface ash aggregation. It appeared to result from a gasification–coagulation mechanism. However, in 2000, Linak etc. [8] burned three different coals in a small fire-tube boiler, a laboratory-scale refractory-lined combustor and a pulverized coal combustor. Their experimental results showed that, in addition to the fine mode and coarse mode, coal combustion also generated a central mode which showed a peak at 0.8~2.0 μm (aerodynamic diameter).
In China, emissions from power generation with coal as fuel are a main source of fine particles in the environmental atmosphere [9]. PCBs are the most widely used coal-fired boilers in power plants, and most studies of fine particles have been focused on PCBs, with little research on circulating fluidized bed (CFB) boilers. Recently though, the application of CFB boilers in power generation has become more extensive. This is because CFB boilers have an excellent fuel adaptability, so can burn almost all solid fuel, especially low-grade fuel. Therefore, recently, some researchers had studied mineral transformation and ash deposition during the combustion of brown coal and other fuels at laboratory scale CFB [10,11]. In addition, the SO2 and NOx emissions from CFB boilers are very low, so there are needless desulphurization facilities and denitration facilities.
The gas–solid flow pattern of CFB boilers was between fixed bed (grate-fired boilers, GFB) and pneumatic conveying state (PCBs) and the feed size of coal was usually several millimeters in diameter, which was much larger than pulverized coal. In addition, coal only constituted a few percent in the dense suspension of CFB boilers and its residence time was much longer than that in pulverized coal boilers [12]. When coal was burning in CFB boiler furnaces, the temperature was lower and heat transfer was more efficient. Because of the above reasons, the generation characteristics and physical/chemical properties of fine particles emissions from coal-fired CFB boilers was quite different with PCBs. Some Finnish scholars have conducted research on small-scale CFB boilers with biomass or waste combustion [13,14]. Ruan et al. [15] compared the particulate matter characteristics discharged by an industrial CFB (150 t/h) and an industrial GFB (100 t/h), and found that the PM2.5 generation of CFBs was higher than that of BFBs, but the removal effect of a fabric filter on PM2.5 of CFBs was better. Liu et al. [16] studied the generation and removal of PM2.5 from two 135 MW CFBs, and discussed the effect of adding limestone into the furnace on the generation characteristics of PM2.5. However, studies on fine particles of large coal-fired CFB boilers in power plants are relatively rare to date.
Three 300 MW power plant CFB boilers were studied in this work, which were equipped with an electrostatic filter precipitator (EFP), fabric filter (FF) and electrostatic precipitator (ESP), respectively. We determined fine particle generation and emission characteristics, including particle size distributions, morphology, and chemical constituents as well as removal characteristics of fine particles for three kinds of dust removal device. The experimental data are very helpful to understand the fine particle generation and emission characteristics of CFB power stations in China.
2. Methods
2.1. Boilers and Measuring Points
We conducted studies on three 300 MW CFB boilers in power plants, with dust removal methods including EFP, FF and ESP. The method of desulfurization was feeding limestone as a sorbent into the furnace, and there was no denitration facility. The basic situation of each boiler is shown in Table 1. During the test period, same kind of fuel was fed into the furnace and the boiler operated under stable load. Proximate analyses and ultimate analyses of coal feed into each CFB boiler are in Table 2.

Table 1.
Basic situation of three CFB boilers.
Table 2.
Proximate analyses and ultimate analyses of coal feed in the furnace.
Figure 1 is the schematic of the CFB boiler and the arrangement of measuring points. The measuring point before the dust collector was used for measuring fine particle generation characteristics of the CFB boiler. The measuring point after the dust collector was used for measuring fine particle emission characteristics of the CFB boiler and researching the effects of different dust collectors for fine particulate emissions. Because fine particles have good following characteristics and are approximately evenly distributed in the flue gas, the position of the sampling probe was fixed at every measuring point during the experiment. The compositions and temperatures of fuel gas measured by TH-880f flue gas parallel sampler (Wuhan Tianhong intelligent instrument factory) are shown in Table 3. The measurement error of the flue gas temperature is ±3 °C, the measurement error of O2 concentration is ±2.5%, and the error of other gas concentrations is ±3%.
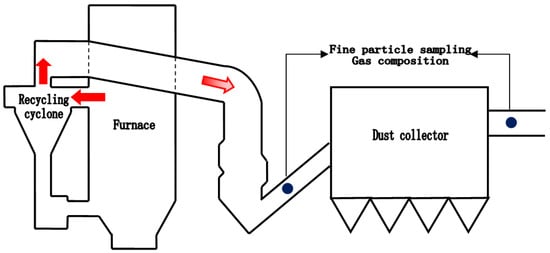
Figure 1.
Schematic of CFB boiler and the measuring points arrangement.
Table 3.
Flue gas analysis results.
2.2. Fine Particle Sampling and Measurement
Figure 2 is the diagram of dilution measurement and sampling system used during this work. The flue gas was successively passed by an isokinetic sampling probe, a cyclone for PM10 and two dilution devices that diluted using filtered air. When the pressure in the filtered air supply system was stable at 0.2 MPa, throughout the sampling process, the dilution ratio (about 9-fold) was stable, so the entire dilution system could keep a stable dilution ratio of about 80 times. The first stage diluter needed to be heated and injected with heated air to avoid water and acid condensation.
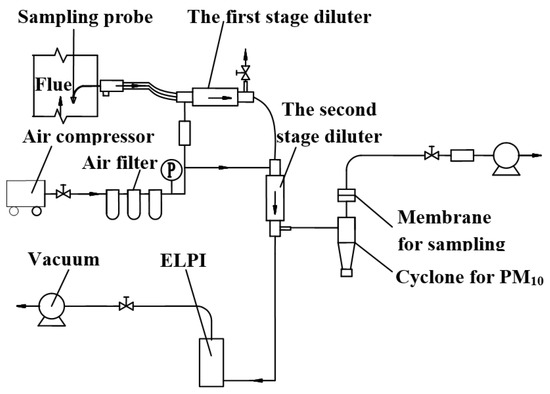
Figure 2.
Schematic of fine particles sampling and measurement.
This work used an electrical low-pressure impactor (ELPI) (Dekati, Finland) to measure fine particle number and mass size distributions. The response time of ELPI was generally less than 5 s, so it could measure instantaneous concentration of particulate matter. The measuring range of ELPI was 0.007~10 μm that was divided into 12 levels by different impactors. For fine particles research, only level 1 to level 10 were needed. Average particle diameters and measurement ranges of all 10 impactors are given in Table 4; the 11th stage impactor has a cutting diameter of 2.48 μm.
Table 4.
Average particle diameters and measurement Ranges of all 10 impactor.
During fine particle sample collection, two dedicated fine particle samplers (Wuhan Tianhong Instruments Co., Ltd., Wuhan, China) were connected to the tail of a primary or secondary diluter. As different analytical methods have certain requirements for the filter, this work selected a Teflon membrane and quartz fiber for analysis of the chemical composition of fine particles, and polycarbonate membranes for micrographs of single fine particles.
2.3. Analytical Methods for Physical and Chemical Properties of Fine Particles
2.3.1. Micrographs
Thermal scanning electron microscopy (SEM) produced by German Zeiss company (Model: EVOMA10) was used to analyze morphology of single fine particles. The sampling time had to be controlled within 5~10 s, to make sure that enough fine particles were collected by the polycarbonate membrane, and particle accumulation did not occur. Because fine particle samples, whose main constituent was aluminosilicate-based non-metallic compounds, have poor electrical and thermal conductivity, the samples were sprayed with about 25 nm Au before testing.
2.3.2. Elemental Analysis
Two kinds of laboratory instruments were used for elemental analysis of fine particles in this testing: EVOMA10 consists of SEM and energy-dispersive X-ray spectroscopy (EDX), which means that it can also analyze the elemental composition of the tested sample. However, due to the lower resolution of EDX results, we also used an X-ray fluorescence (XRF) analyzer to determine fine particle sample on a Teflon membrane. Compared to EDX, XRF gave a more accurate proportional relationship between various elements, but the test result was smaller due to the insufficient thickness of fine particle sample. For this reason, the final result of the elemental analysis was the combination of EDX and XRF analysis.
2.3.3. Organic Carbon and Elemental Carbon
Organic carbon (OC) and elemental carbon (EC) in the study of particulate matter composition are not strictly defined substances, and they represent two kinds of extremely complex substances with common physicochemical properties. OC represents aromatic compounds, aliphatic compounds, organic acids and other organic compounds; EC contains soot and some oxygen-containing functional groups (such as alcohol, phenol, acyl and carboxyl). In this work, a carbon analyzer developed by the Desert Research Institute of the United States, which adopts the method of thermo optical reflection (TOR), was used to test OC and EC in fine particle samples.
3. Results and Discussion
3.1. Concentration and Size Distributions of Fine Particle
In this research, concentrations of fine particles emitted by three CFB boilers were characterized before and after dust removal devices. Table 5 shows the number/mass concentration of fine particles and the ratio of the concentration of different particle size ranges. Fine particle number concentrations of the CFB boiler before dust removal were millions per cubic centimeter, much lower than in earlier PCB testing (millions to more than ten million/cm3); however, the mass concentrations are about 2 g/m3, much larger than PCB (hundreds mg/m3) [17]. The number concentration of boiler 3 was much higher than the other two, but mass concentrations of the three boilers were same. Before the precipitator, the concentration of fine particles mainly depended on particles in the size range of 0.38~2.5 μm (PM0.38~2.5), except for boiler 3. This this means that fine particles generated by the CFB boiler are mostly residual ash. As a result of highly efficient dust removal devices, fine particle concentrations of the CFB boiler decreased significantly after dust removal. After dust removal, the mass concentration of fine particles still depended on PM0.38~2.5, but fine particle number concentration was mainly dependent on PM0.38. This is due to the dust collection efficiency of small particles being lower than for large particles, which causes the ratio of PM0.38/PM2.5 to rise.
Table 5.
Number/mass concentration of fine particle from three CFB boilers and the ratio of the concentration of different particle size ranges.
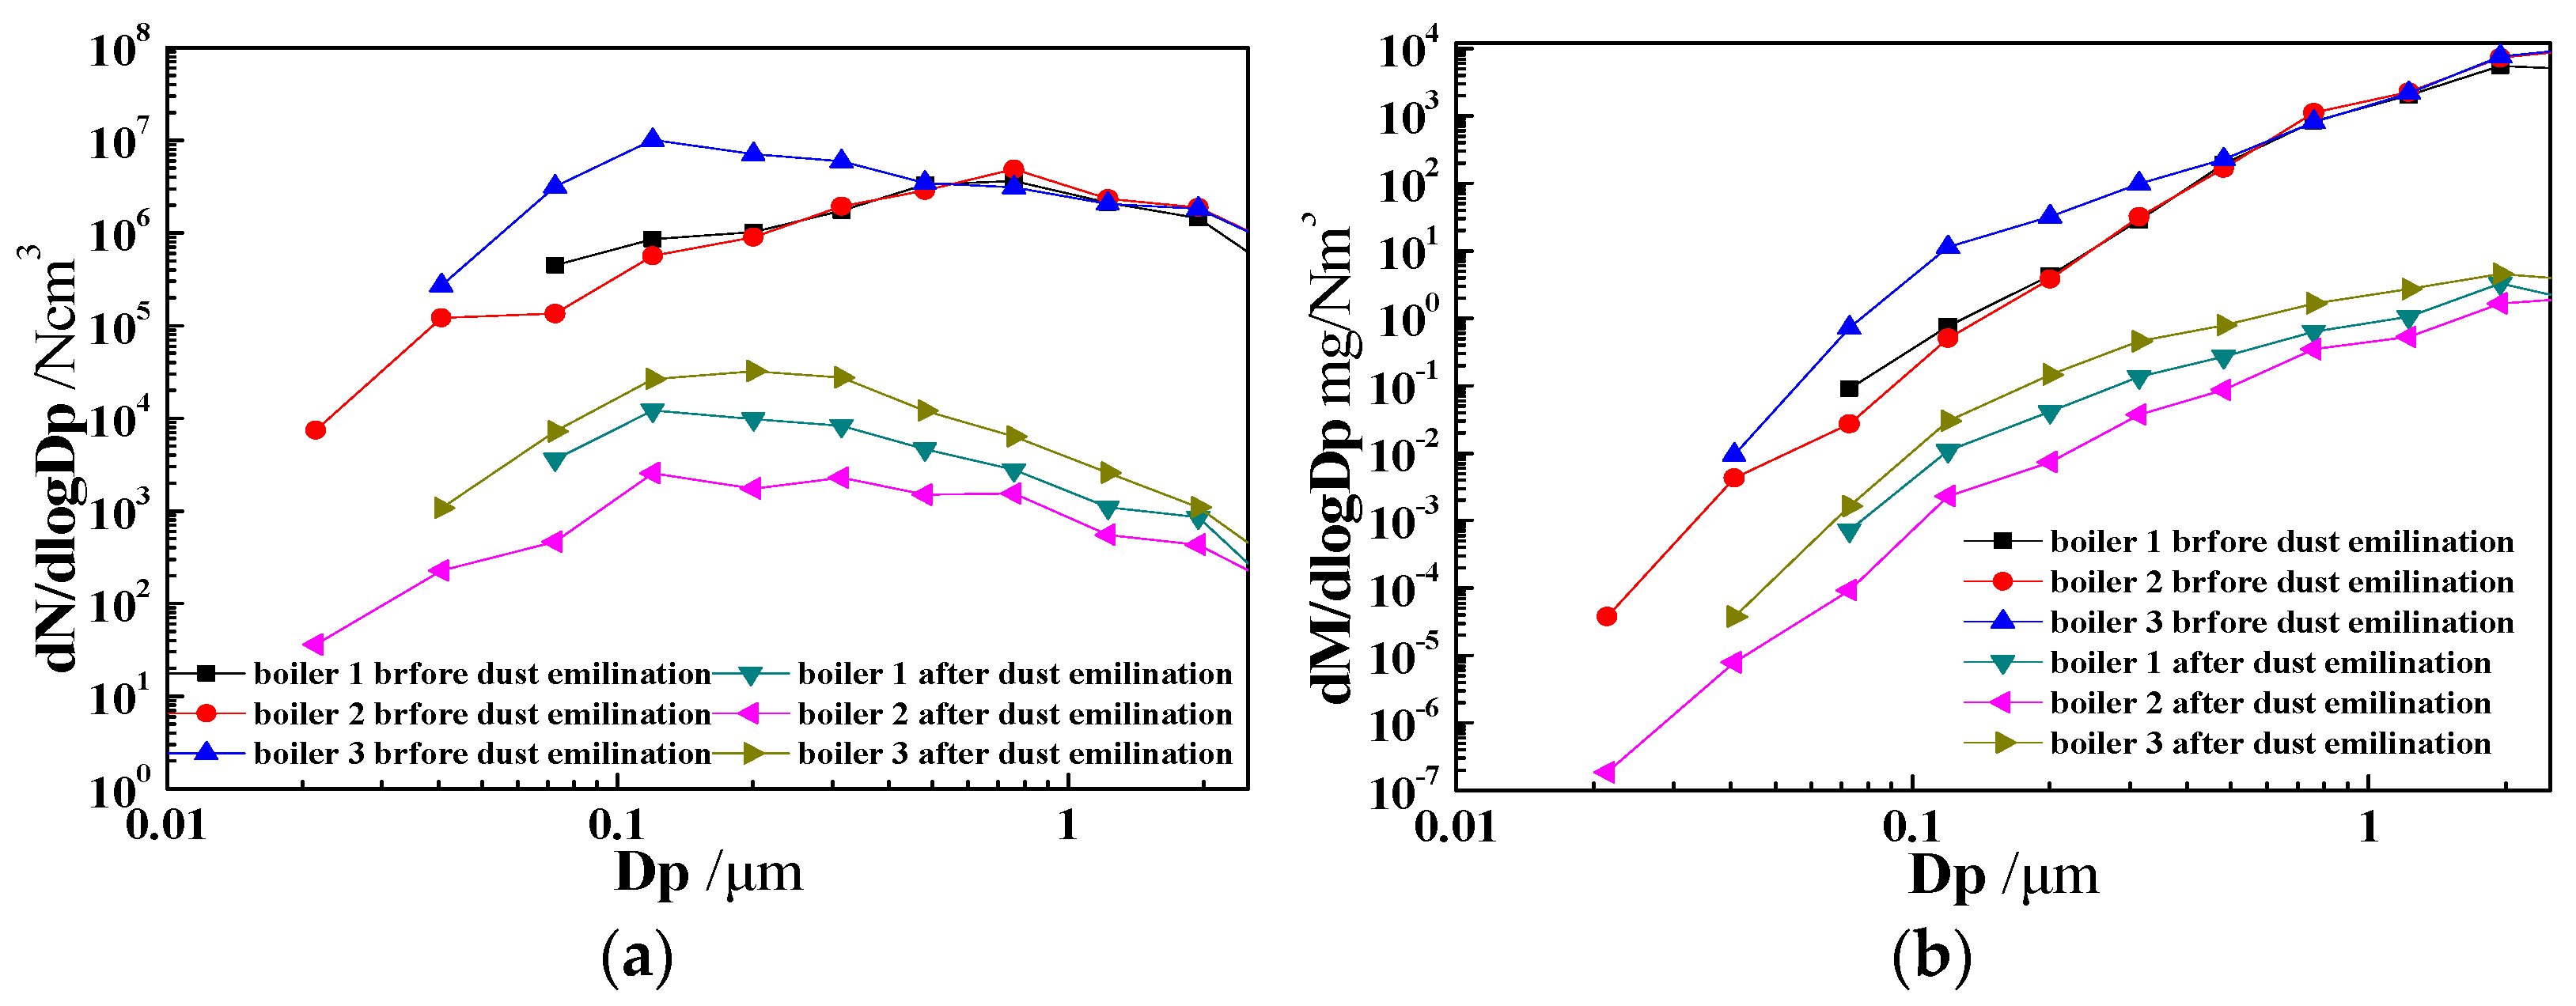
The number/mass concentration distribution of CFB boiler fine particles before and after dust removal is shown in Figure 3. The number size distribution was unimodal distribution that was significantly different with bimodal distribution of PCBs [17]. Before dust removal, the peak of boiler 1 and boiler 2 was at 0.76 μm, which was similar to central modal among three modal distributions [8]. However, for boiler 3, the peak was at 0.12 μm. This peak was more likely to be fine-modal [7]. The possible reason of the number size distribution difference between boiler 3 and the others was that boiler 3 was equipped with a series of external heat changers which were equivalent to a series of bubbling fluidized beds (BFBs) and the concentration of ultrafine particles generated by the BFB boiler was much higher than the CFB boiler [18]. After dust removal, the concentration of each level of ELPI decreased significantly and the peak of number concentration distribution had moved to the direction of small particles. As shown in Figure 3, the mass size distribution of fine particles of the CFB boiler had no peak, and the mass concentration of particles in each level increased with particle diameter increasing.
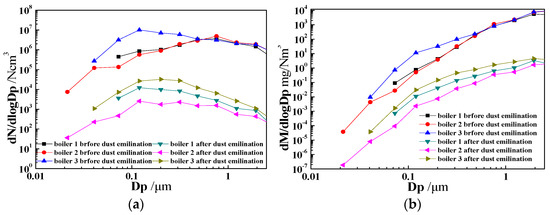
Figure 3.
Concentration size distributions of fine particle at upstream and downstream of CFB boiler dust remover. (a) number concentration; (b) mass concentration.
From the foregoing analysis, fine particles generated by power plant CFB boilers were mainly concentrated in the range of 0.38~2.5 μm, and the broken-coalescence mechanism was their main generation mechanism. Because the ash content of coal burned in the CFB boiler was extremely high and the severe abrasion caused by strong horizontal and vertical mixing promoted coal crushing, residual ash particles in the fuel gas of CFB boilers were much more than in PCBs. Coal crushing in CFBs is mainly mechanical crushing (mechanical abrasion) caused by violent collision between coal particles (0–13 mm) and bed material or heating surface and thermal crushing. Particles generated by mechanical abrasion are smaller than for thermal crushing, and the process of producing ultrafine particles by mechanical abrasion is called ultrafine abrasion. Some some researchers [19] believe that ultrafine abrasion is the main generation mechanism of sub-micron particles in CFB boilers. Since the temperature in CFB boiler furnaces was much lower (850~950 °C) than that of PCBs (1250~1300 °C), the volatilization of minerals in coal was suppressed and ultrafine particles (PM0.38) formed by vaporization–condensation mechanisms were rare. The flue gas discharged from CFB boiler furnaces had to pass through several cyclone separators to collect the unburned coal char particles. These separators had a large cut diameter and their direct capture effect of fine particles was poor. However, they increased the residence time and collision of particles, which increased the trapping of large particles to ultrafine particles and caused further reduction of PM0.38. Some articles claim that adding limestone in the furnace as a desulfurization sorbent can reduce PM1.0 emissions of a CFB boiler: On one hand, CaO generated by limestone when it is heated could adsorb volatile substances steam or react with it [20]; on the other hand, the large surface area of limestone not only made the absorption of minerals steam more efficient but also provided attachment sites for nanoscale particles in flue gas [21]. However, limestone with a high degree of fragmentation was also a source of fly ash of the CFB boiler. Due to the CaCO3/CaO content and particle size distribution of limestone used in power plants every day varying greatly, this paper cannot clarify the effect of adding limestone in the furnace on the generation characteristics of fine particles of CFB boilers.
3.2. The Influence of Dust Removal Device to Fine Particle
The key parameters of the dust collectors of three boilers are shown in Table 6. The total removal efficiency of number/mass of fine particles emitted by three CFB boilers is shown in Table 7. For all three kinds of dust removal device, the mass removal efficiency was higher than the number removal efficiency, and the removal effect of FF on fine particles (boiler 2) was better than that of ESP (boiler 3). Size-classified removal efficiency of fine particles by different dust removal devices was shown in Figure 4. The size-classified removal efficiency of EFP, FF and ESP on fine particles all had a minimum point in 0.1~1.0 μm, but the locations of the minimum points were different. After the minimum point, the removal efficiency of ESP and FF was higher and rose faster than for ESP. The EFP of boiler 1 in Figure 4 did not show the advantages of a composite dust removal device in particulate matter removal, especially for the low efficiency of submicron particle removal, which was caused by the use of needle felt with a poor filtering effect as filter material. Since an electrostatic precipitator was arranged in front of EFP, and fabric filter was arranged at the rear, the classified dust removal efficiency curve of EFP for fine particles is similar to that of FF.
Table 6.
Key parameters of the dust collectors of three boilers.
Table 7.
Total removal efficiency of number/mass of fine particles emitted by CFB boiler.
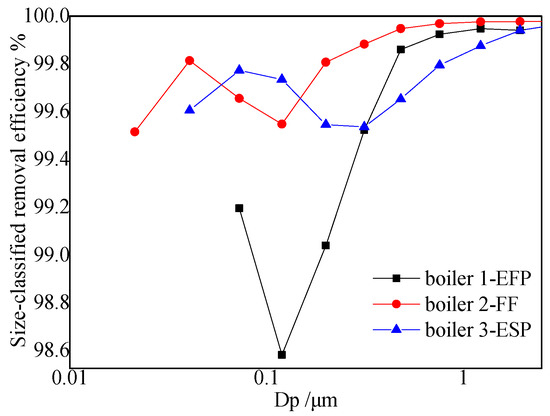
Figure 4.
Size-classified removal efficiency of fine particle emitted by CFB boiler through different dust removal devices.
The removal process of particles through fabric filter was mainly influenced by the interception of a filter layer and ash layer, inertial impaction and diffusion collision. For larger particles, inertial impaction was the main trapping mechanism, which means the particles deviate from the streamline due to inertia and collide with interceptors. However, the capture of ultrafine particles was largely dependent on the diffusion effect. The Brownian motion free path of ultrafine particles was less than the filter layer clearance, so ultrafine particles would collide with the filter layer or ash layer and be adsorbed when it made a random motion [22]. The minimum point (0.12 μm) of size-classified removal efficiency was in the transition zone between these two mechanisms.
There was also a minimum value of size-classified removal efficiency of ESP in 0.1~1 μm [23,24]. Static electricity was the main force that influenced particle removal in ESP. For particles less than 0.1 μm, their charge mainly depended on collision with ionized gas during irregular Brownian motion; and charge of particles larger than 1 μm was mainly dependent on the electric field. However, 0.1~1 μm was the transitional stage of these two charging mechanisms. Charge of particles in this transitional stage was less effective, and thus the collection efficiency was relatively low. Some studies have shown that due to the high resistance of limestone in fly ash, ESP may not be well-suited for CFB boiler dust removal [25,26]. Since the collection efficiency of FF is not affected by fly ash resistivity, it is especially suitable for use in CFB boiler dust removal.
3.3. Morphological Characteristics of Fine Particle Generated by CFB Boiler
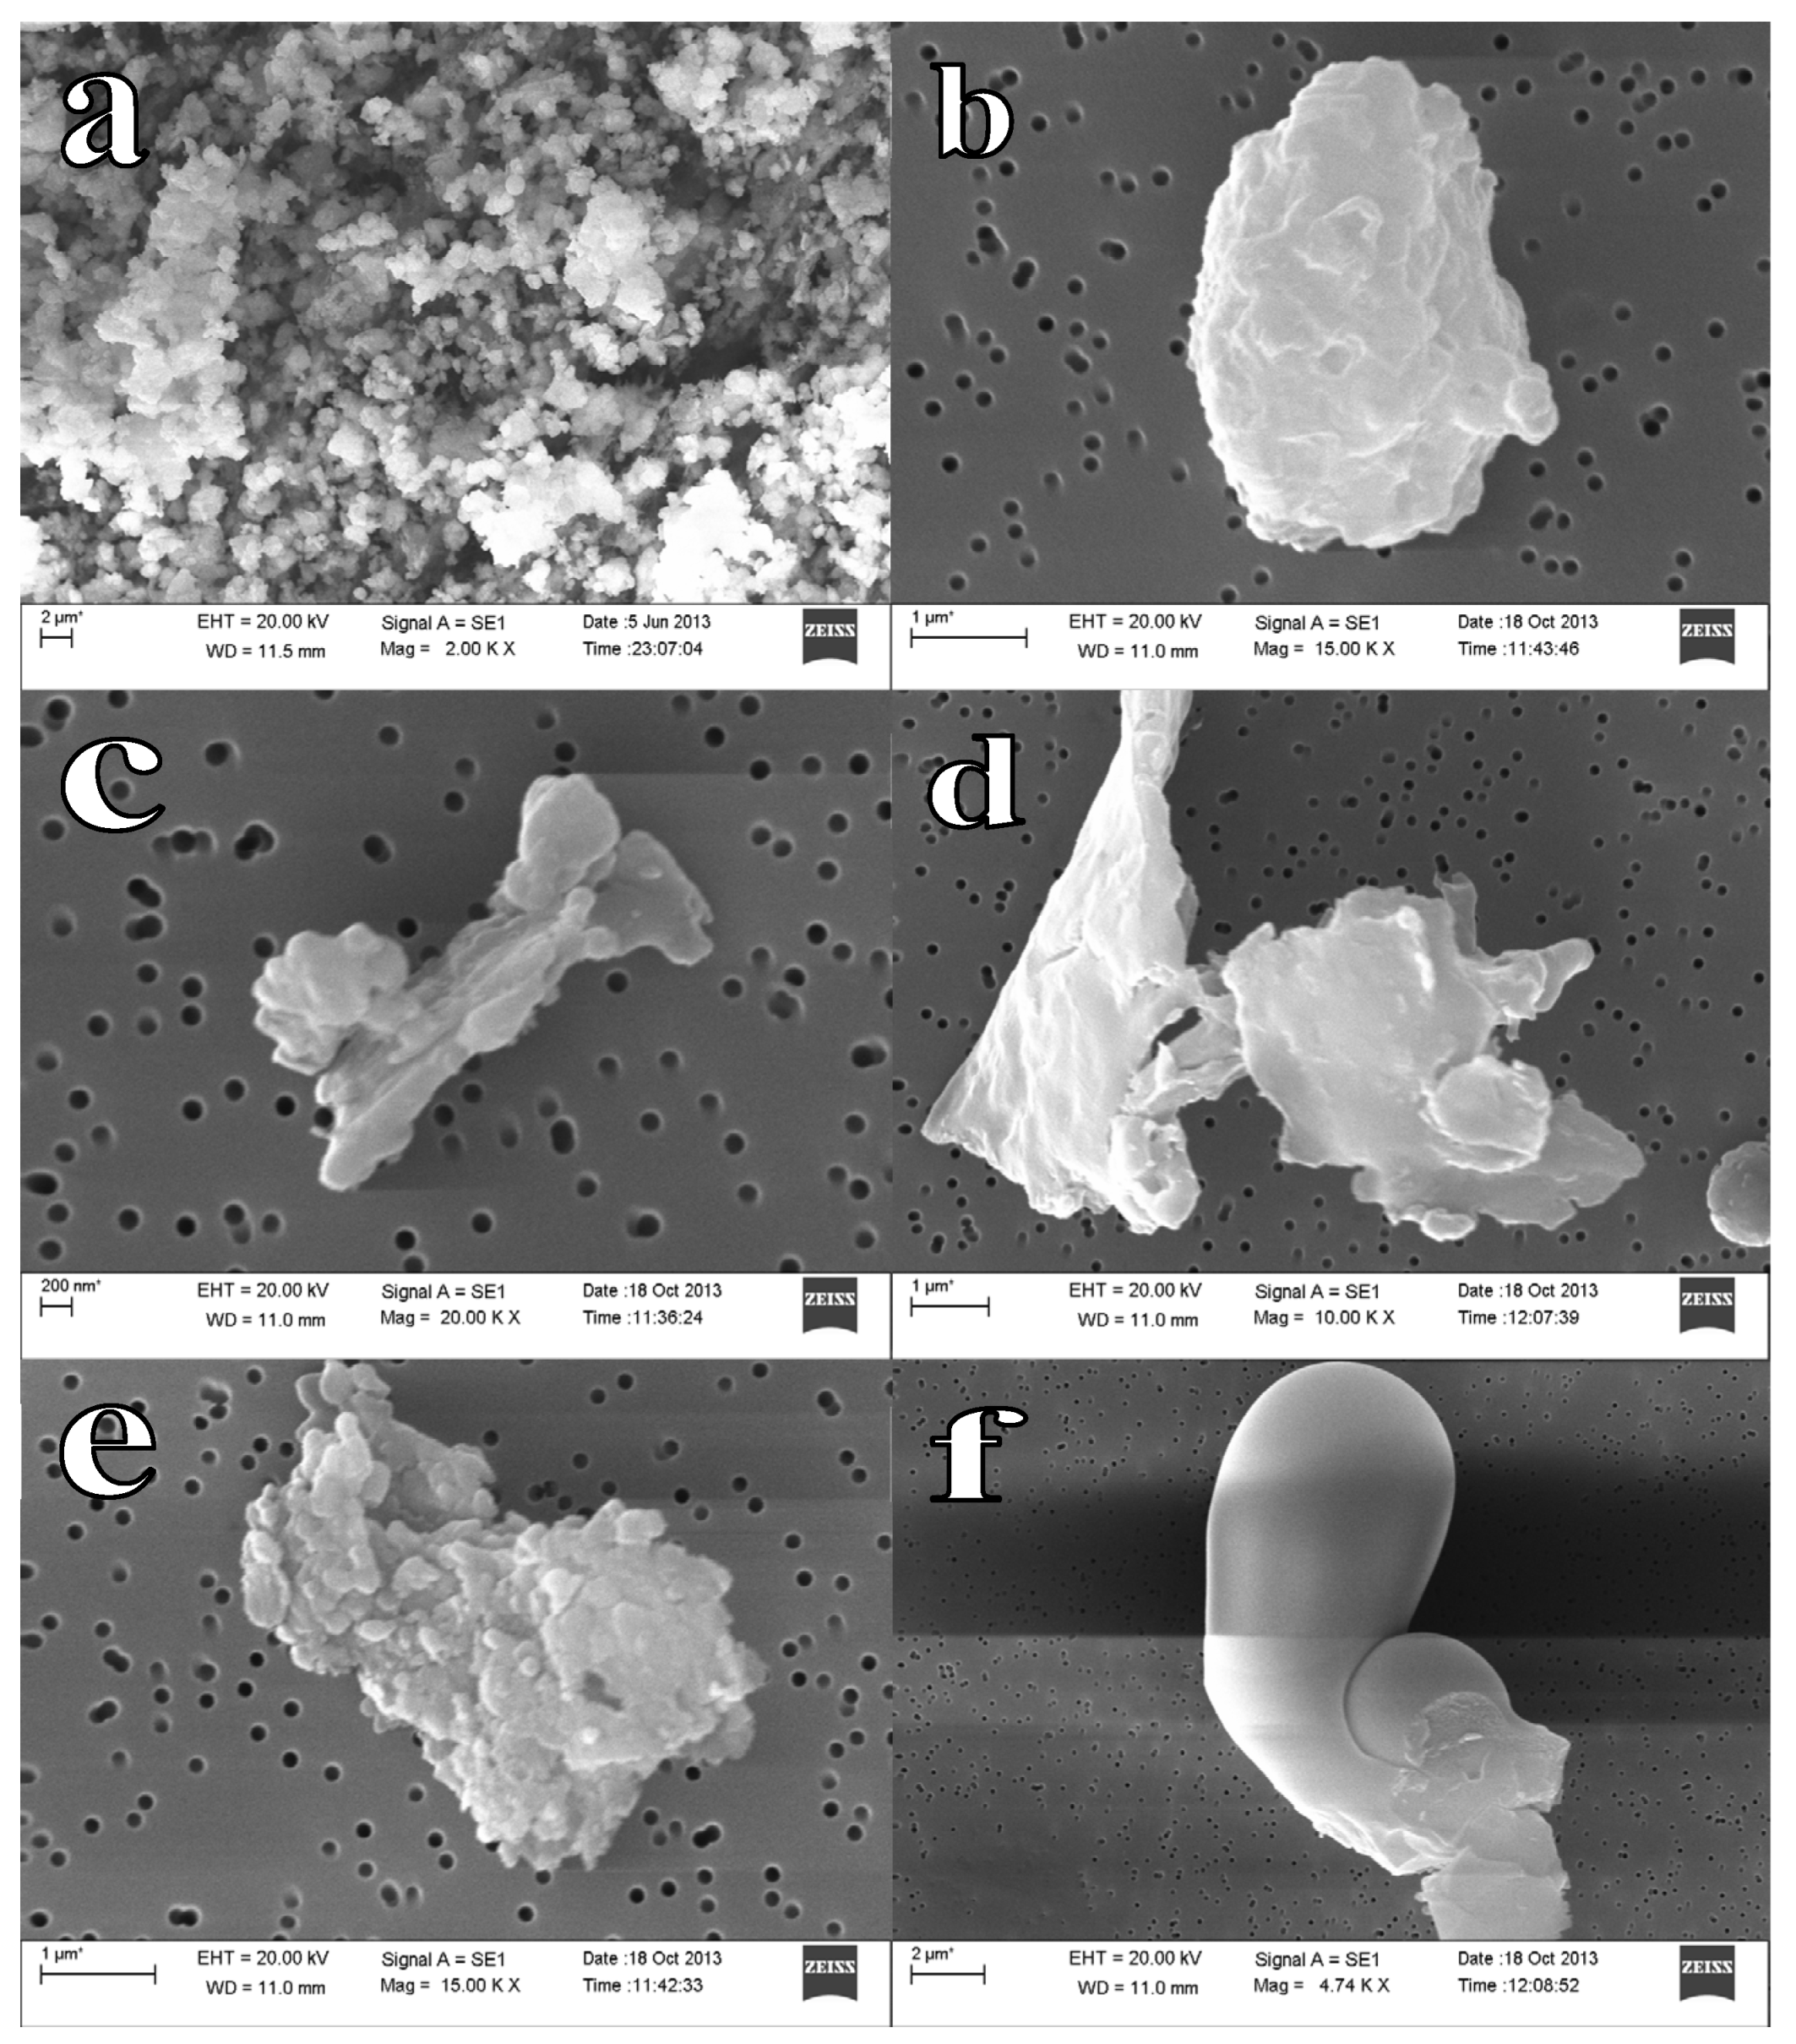
The micrographs of fine particles formed by power plant CFB boiler are shown in Figure 5. Figure 5a is a micrograph of a great quantity of fine particles. It shows that fine particles generated by CFB were mostly irregular in shape, which means their specific surface area was much bigger than fine particles with the same particle diameter but generated by PCB. This was because the temperature in the CFB boiler furnace was low, so the majority of minerals in coal would not completely melt and reduce the gasification amount. Residual ash particles were mostly keeping the original morphology in coal, and ultrafine particles formed via nucleation of vaporized minerals and grown via coagulation and heterogeneous condensation were very small, so irregular particles were the major component of fine particles generated by the CFB boiler. Figure 5b–d are the main morphology of irregular fine particles formed by the CFB boiler. Ultrafine particles formed via nucleation of vaporized minerals were rare, and since most minerals did not melt, the adhesion between particles was smaller than for PCB, so the surface of large particles rarely adhered to ultrafine particles. However, there was occurrence of gasification–condensation and melting in the CFB boiler, the surface of particles in Figure 5e adhered to some circular ultrafine particles, and particles in Figure 5f had partially melted.
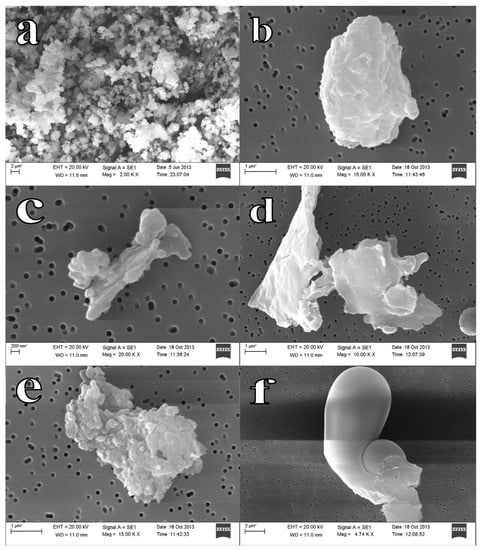
Figure 5.
Micrographs of fine particle formed by power plant CFB boiler. (a) micrograph of a great quantity of fine particles; (b–d) main morphology of irregular fine particles; (e) particles with ultrafine particles adsorbed on the surface; (f). partially melted particles.
3.4. Study of Chemical Constitutes of Fine Particle Emitted by CFB Boiler
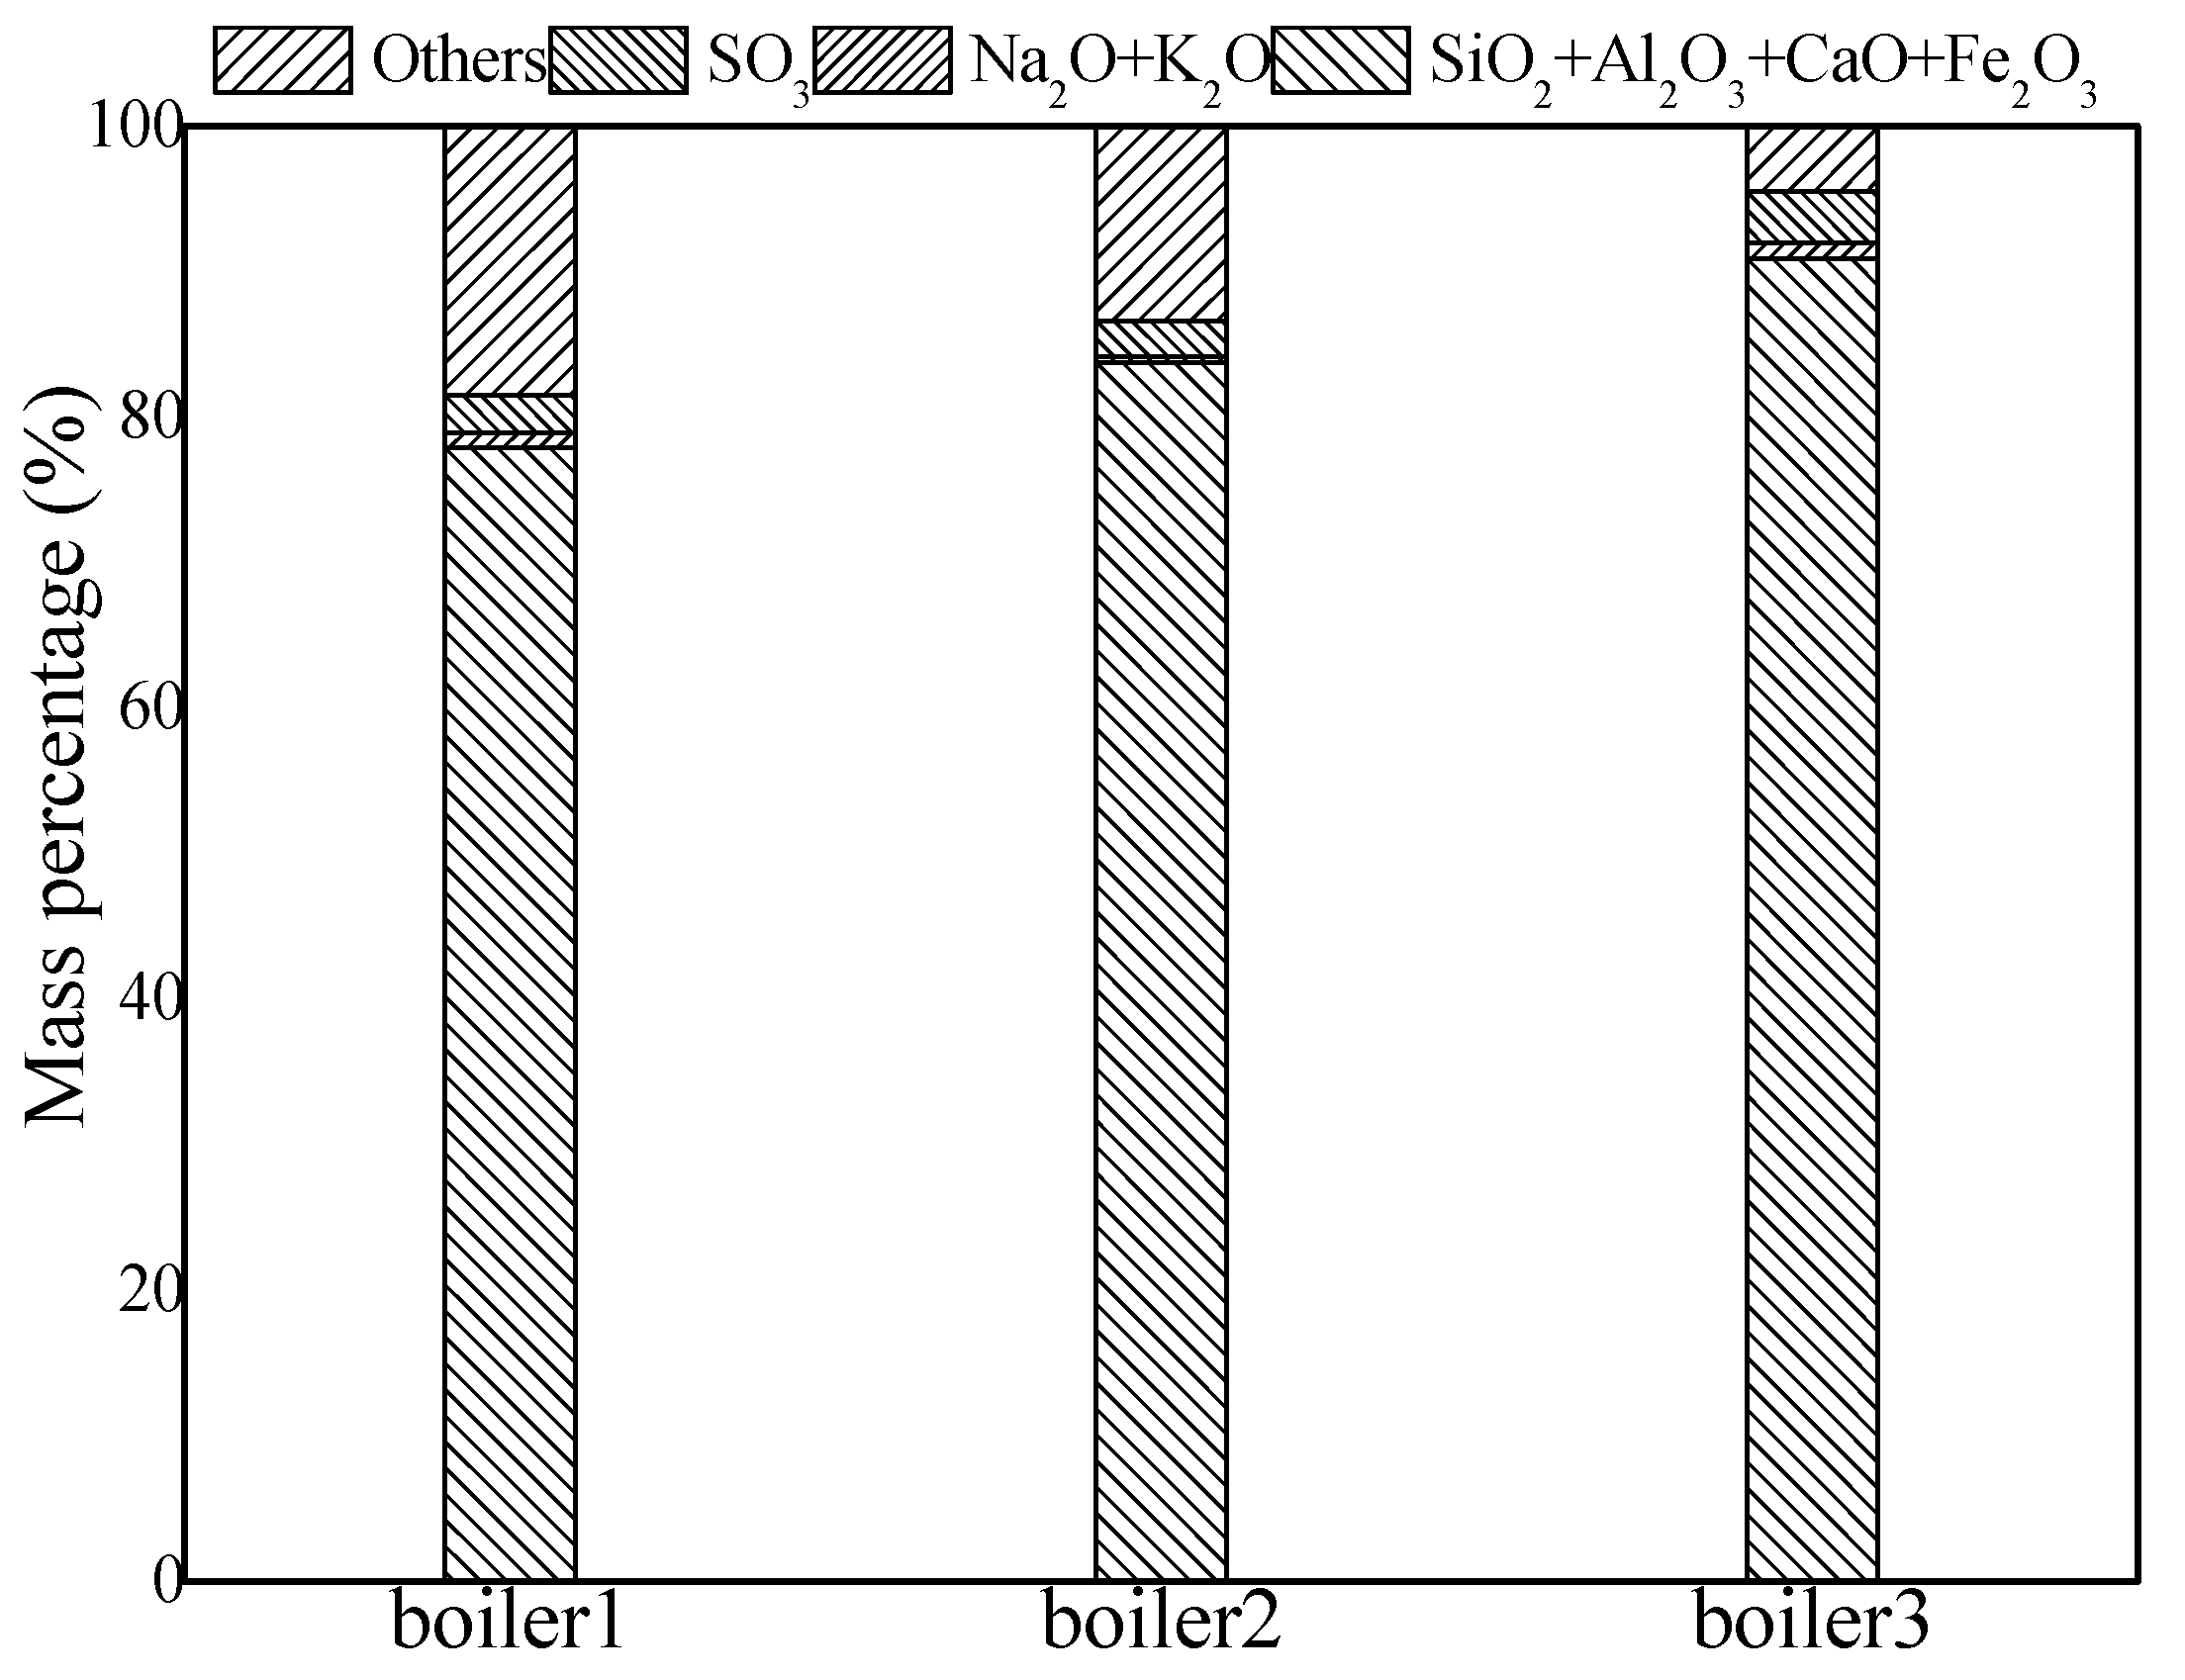
The content of different elements in fine particles varies greatly, wherein Al, Si, S, Ca, Fe, etc. accounts for the vast majority. Therefore, the test results of these elements were credible and representative, and in this section the influence of fluidized bed combustion and dust removal device on fine particle generation and emission were determined by studying the content of these elements. According to fine particle formation mechanisms and research methods of the past researchers [27], the high content or representative elements were broadly divided into four kinds. (These elements are usually present in fine particles as salts or oxides, but in this section they are expressed in terms of oxides.):
- (1)
- Difficult melting oxides, including Al2O3, SiO2, CaO, Fe2O3;
- (2)
- Alkali metal oxides, including Na2O and K2O;
- (3)
- SO3, assuming S exists in the form of sulfur oxides;
- (4)
- Other elements, including MgO, compounds of trace elements, OC and EC, etc.
According to the classification method described above, the percentage of the different components contained in fine particles collected before dust removal were calculated, as shown in Figure 6.

Figure 6.
The percentage of representative elements contained in fine particles collected at the outlet of the furnace of a CFB boiler.
As shown in Figure 6, in fine particles generated by the CFB boiler, the content of difficult melting oxides was the highest and the content of alkali metal oxides was the lowest. Al, Si, Ca, Fe were also the highest mineral elements in coal. Compared with PCB, chemical composition of fine particles generated by the CFB boiler was more akin to the ash composition [28,29]. The content of S in fine particles was also high, which means that there were a lot of adsorbent particles in the CFB boiler fine particles. Terttaliisa Lind et al. [24] detected CFB boiler fly ash using CC-SEM and found that there were a lot of particles with Ca or Ca/S as the main material. Fly ash particles formed by these adsorbents may also be an important source of fine particles from a CFB boiler.
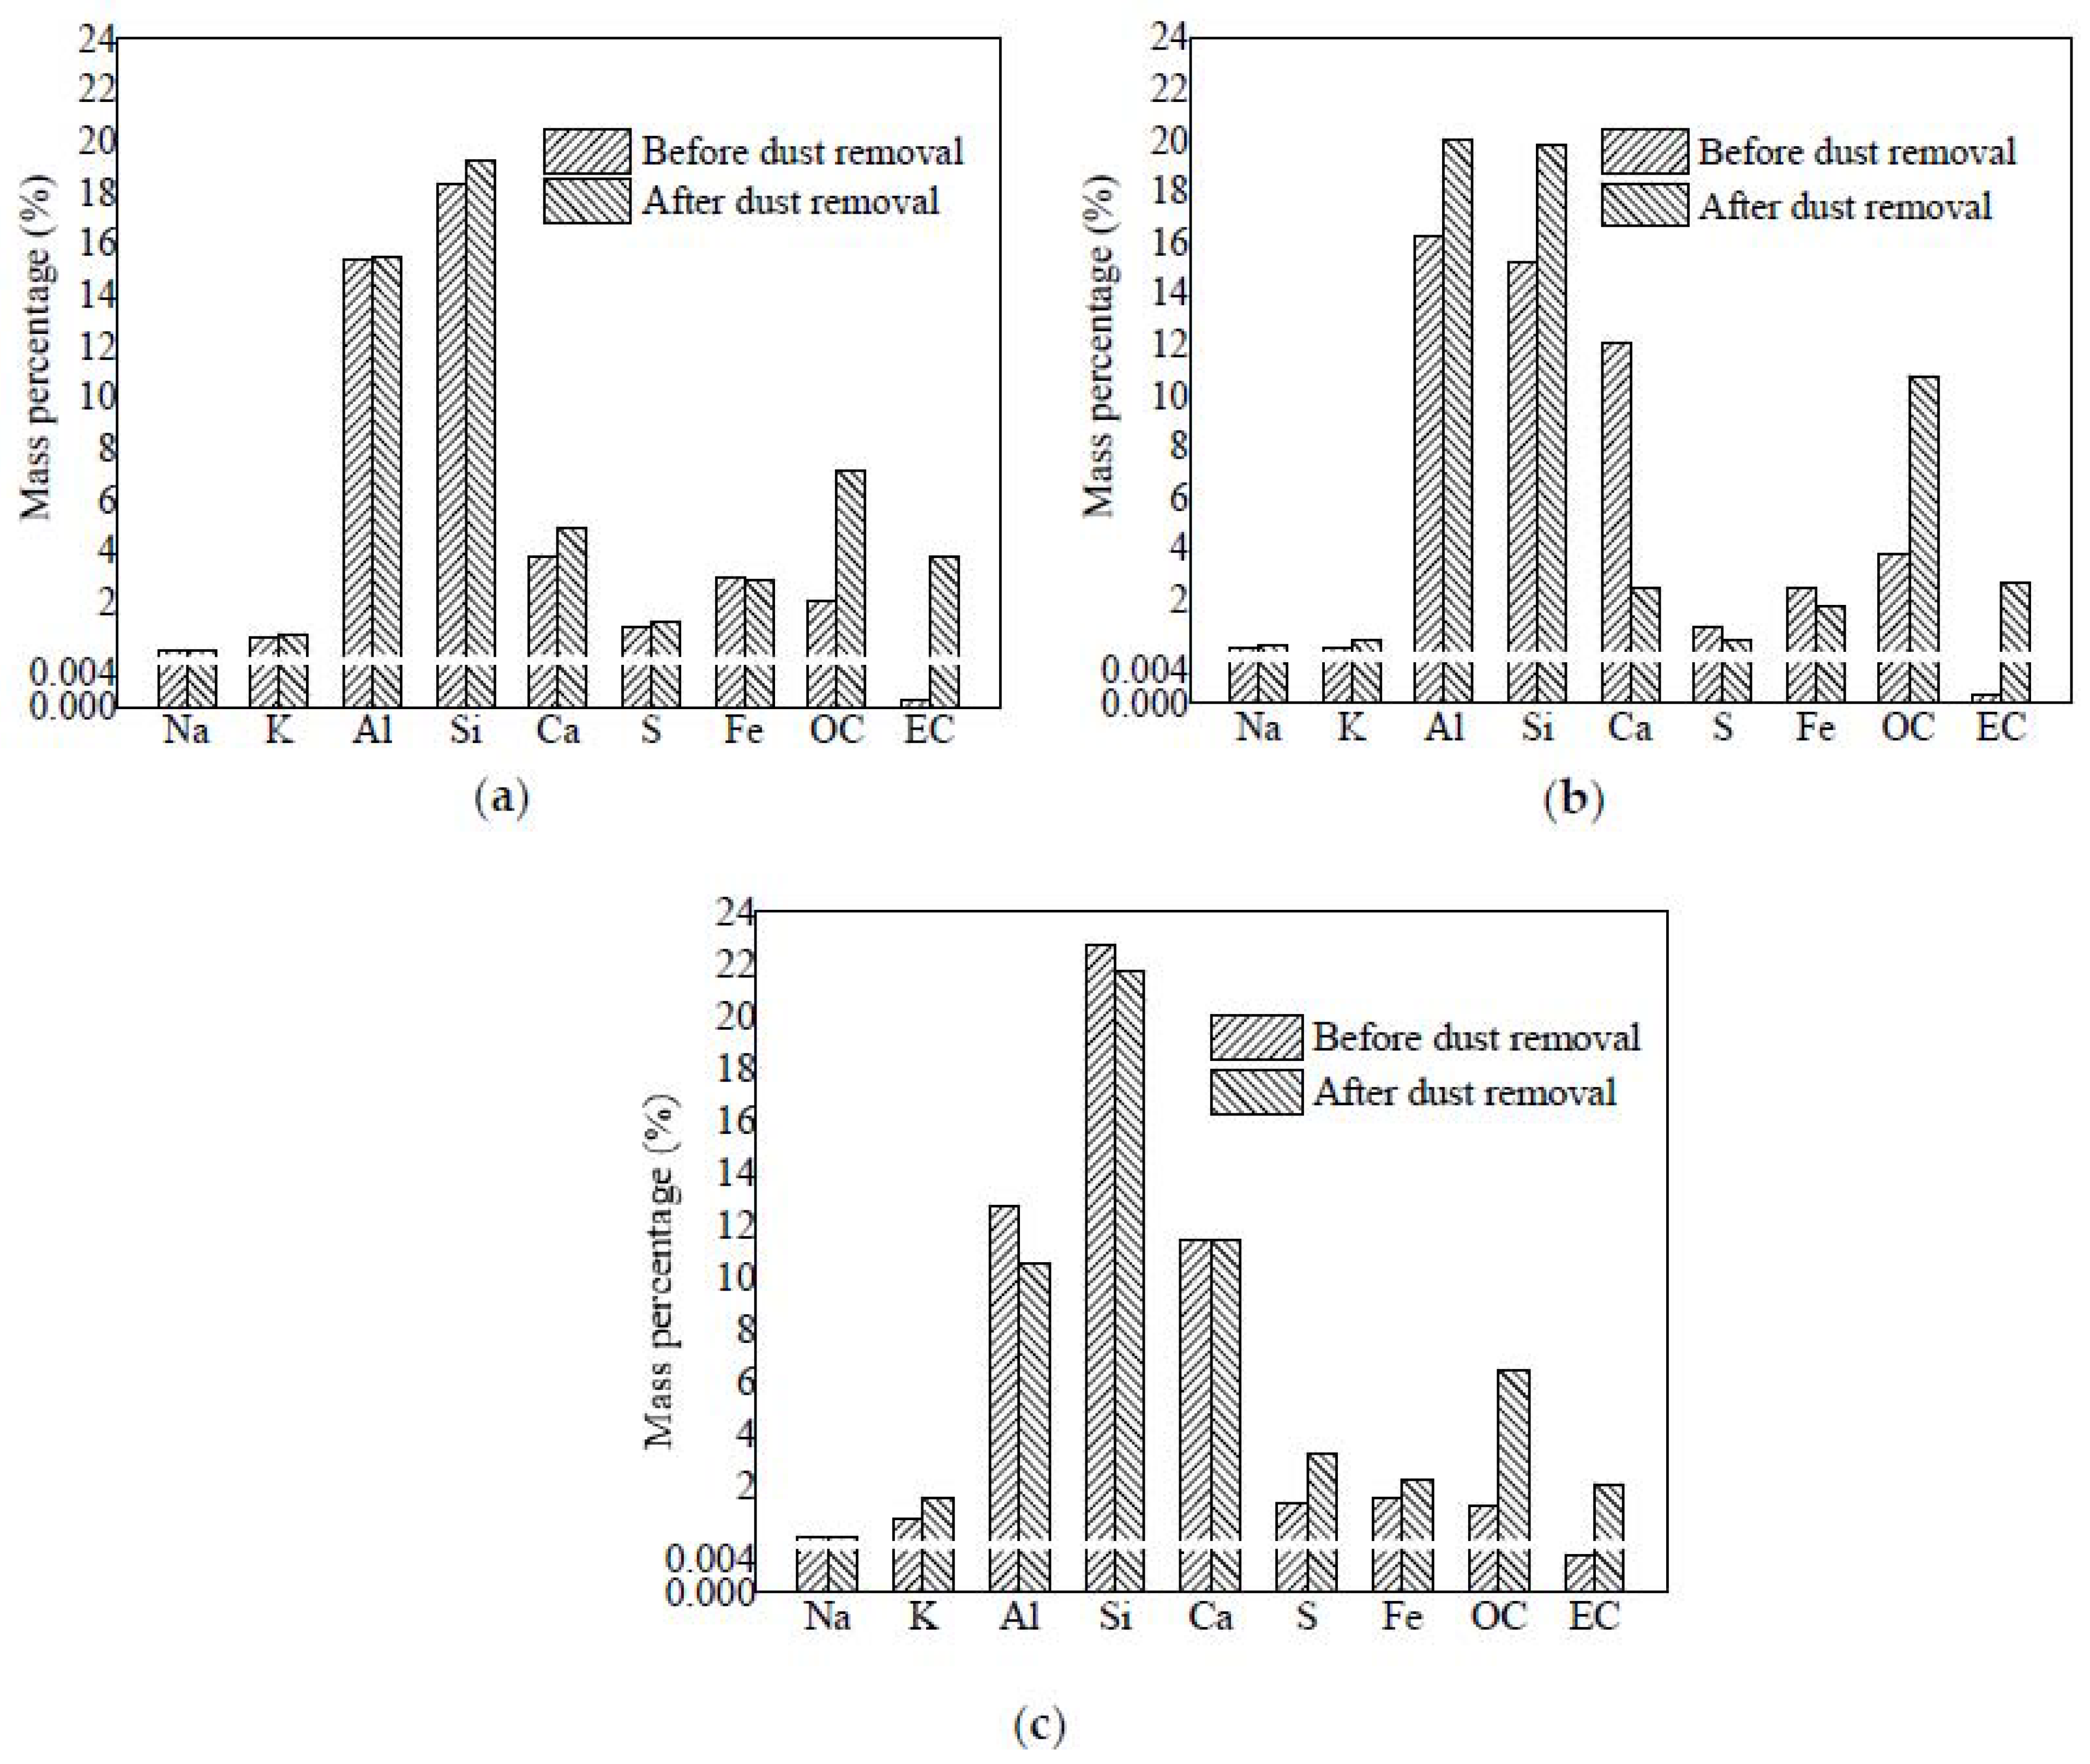
To analyze the effects of different types of precipitator on representative elements contained in fine particles of a CFB boiler, Figure 7 shows the contrast of representative elements content of fine particles before and after dust removal (OC and EC were also given separately in this report).
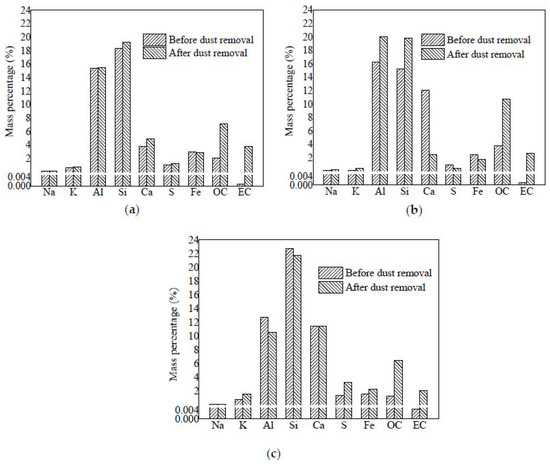
Figure 7.
The contrast before and after dust removal of representative elements content of fine particle of CFB boiler. (a) Boiler 1; (b) Boiler 2; (c) Boiler 3.
As it shown in Figure 7, after dust removal, the content of Na and K increased, because Na and K allow easy gasification and enrichment in PM0.38, and the removal efficiency of each precipitator for PM0.38 is lower than PM0.38~2.5. The removal effect of the dust remover on different elements was different. After FF, the content of Ca, S and Fe decreased significantly but the content of Si and Al increased, which means that the removal effect of FF on fine particles rich in Ca, S and Fe was better than particles rich in Si and Al. This may be due to the different removal efficiency of FF on different-sized particles, which are enriched with different elements. Since Ca can greatly increase the fly ash resistivity [24,25], ESP found it difficult to remove Ca-rich particles, and after the dust removal device, the reducing of flue gas temperature can cause sulfuric acid generation and condensation on fine particle surfaces. Therefore, after ESP (boiler 3), the content of Ca and S increased. ESP was not as effective as FF in the removal of Fe-containing particles. Because the element-removal characteristics were controlled by two types of dust removal device, the changes in the content of elements other than Ca and S in fine particles after EFP are the same as FF. The content of Ca and S increased due to the influence of the electrostatic precipitator in EFP.
After dedusting equipment, the content of OC and EC in fine particles increased. With flue gas temperature decreasing in the dust remover, some gaseous organics were transformed into particulate organics, which increased the OC content in fine particles. Soot particles, the main component of EC, had a great quantity of oxygen-containing functional groups on the surface (which affected the charging of soot particles [30,31]) and had a special chain or cluster structure (which affected the charging and aerodynamic characteristics of soot [32,33]). Obviously, the capture efficiency of soot aggregates by the two dust removal methods was lower than for other particles, which was an important reason for the increase of EC content in fine particles after dust removal.
4. Conclusions
In this work, fine particle characteristics of three 300 MW power plant CFB boilers were determined before and after a dust remover. Generation and emission characteristics were measured in situ with ELPI. Physical and chemical properties of fine particles were performed by SEM, EDX, XRF and TOR. This comprehensive analysis of particle concentration distribution, physical morphology and elemental composition was helpful to understand the formation mechanism of fine particles in the fluidized bed combustion process. It can also be compared with other or follow-up studies on the formation mechanism of fine particles in pulverized coal boilers and layer fired boilers. Conclusions are as follows:
(1) The broken-coalescence mechanism was the fine particle main generation mechanism in the CFB furnace. Ultrafine abrasion was the main generation mechanism of ultrafine particles. The number size distribution of fine particles of the CFB boiler was unimodal, the peak of the general CFB boiler was at 0.76 μm, but for the CFB boiler with external bed, the peak was at 0.12 μm.
(2) The size-classified removal efficiency of fine particles through three kinds of dust remover all had a minimum point in 0.1~1.0 μm, but the locations of minimum points are different. Due to the high resistance of fly ash caused by limestone, ESP may not be well suited for CFB boiler dust removal.
(3) Fine particles generated by CFB were mostly irregular in shape and had a large surface area. Because the temperature in the CFB boiler furnace was low, residual ash particles were mostly keeping original morphology in coal, and ultrafine particles formed via nucleation of vaporized minerals were very low. Therefore, irregular particles without ultrafine particles in the surface was the major component of fine particles generated by CFB.
(4) In fine particles from the CFB boiler, the content of difficult melting oxides was the highest, the content of SO3 followed, and the content of alkali metal oxides was the lowest. After dust removal, the content of Na and K increased. The content of Al and Si increased after EFP and FF, but decreased after ESP. After EFP and ESP, the content of Ca and S increased. However, after FF, the content of these two elements decreased significantly. After three kinds of dust remover, the content of OC and EC in fine particles increased.
Author Contributions
Formal analysis, Y.H.; Investigation, D.F.; Resources, Q.D.; Supervision, J.G.; Validation, Q.S.; Writing—original draft, Y.Z.; Writing—review & editing, H.D. All authors have read and agreed to the published version of the manuscript.
Funding
This work was supported by Heilongjiang Province Postdoctoral Science Foundation “Formation mechanism of high-performance hollow carbon spheres prepared by pyrolysis of sodium salt and coal tar” (Funder: Heilongjiang Provincial Department of Human Resources and Social Security, Funding number: LBH-Z21134).
Conflicts of Interest
The authors declare no conflict of interest.
References
- Wei, F.; Teng, E.; Wu, G.; Hu, W.; Wilson, W.; Chapman, R.; Pau, J.C.; Zhang, J. Ambient concentrations and elemental compositions of PM10 and PM2.5 in four Chinese cities. Environ. Sci. Technol. 1999, 33, 4188–4193. [Google Scholar] [CrossRef]
- Morawska, L.; Zhang, J.J. Combustion sources of particles. 1. Health relevance and source signatures. Chemosphere 2002, 49, 1045–1058. [Google Scholar] [CrossRef]
- Gibbs, A.R.; Pooley, F.D. Analysis and interpretation of inorganic mineral particles in “lung” tissues. Thorax 1996, 51, 327–334. [Google Scholar] [CrossRef]
- Xu, M.; Yu, D.; Yao, H.; Liu, X.; Qiao, Y. Coal combustion-generated aerosols: Formation and properties. Proc. Combust. Inst. 2011, 33, 1681–1697. [Google Scholar] [CrossRef]
- Senior, C.L.; Helble, J.J.; Sarofim, A.F. Emissions of mercury, trace elements, and fine particles from stationary combustion sources. Fuel Process. Technol. 2000, 65, 263–288. [Google Scholar] [CrossRef]
- Flagan, R.; Friedlander, S. Particle formation in pulverized coal combustion—A review. Recent Dev. Aerosol Sci. 1978, 2, 25–59. [Google Scholar]
- Markowski, G.; Ensor, D.; Hooper, R.; Carr, R. A submicron aerosol mode in flue gas from a pulverized coal utility boiler. Environ. Sci. Technol. 1980, 14, 1400–1402. [Google Scholar] [CrossRef]
- Linak, W.P.; Miller, C.A.; Wendt, J.O. Comparison of particle size distributions and elemental partitioning from the combustion of pulverized coal and residual fuel oil. J. Air Waste Manag. Assoc. 2000, 50, 1532–1544. [Google Scholar] [CrossRef]
- Yao, Q.; Li, S.-Q.; Xu, H.-W.; Zhuo, J.-K.; Song, Q. Reprint of: Studies on formation and control of combustion particulate matter in China: A review. Energy 2010, 35, 4480–4493. [Google Scholar] [CrossRef]
- Liu, Z.; Li, J.; Wang, Q.; Lu, X.; Zhang, Y.; Zhu, M.; Zhang, Z.; Zhang, D. An experimental investigation into mineral transformation, particle agglomeration and ash deposition during combustion of Zhundong lignite in a laboratory-scale circulating fluidized bed. Fuel 2019, 243, 458–468. [Google Scholar] [CrossRef]
- Liu, Y.; Cheng, L.; Ji, J.; Zhang, W. Ash deposition behavior in co-combusting high-alkali coal and bituminous coal in a circulating fluidized bed. Appl. Therm. Eng. 2019, 149, 520–527. [Google Scholar] [CrossRef]
- Hernberg, R.; Stenberg, J.; Zethræus, B. Simultaneous in situ measurement of temperature and size of burning char particles in a fluidized bed furnace by means of fiberoptic pyrometry. Combust. Flame 1993, 95, 191–205. [Google Scholar] [CrossRef]
- Valmari, T.; Kauppinen, E.I.; Kurkela, J.; Jokiniemi, J.K.; Sfiris, G.; Revitzer, H. Fly ash formation and deposition during fluidized bed combustion of willow. J. Aerosol Sci. 1998, 29, 445–459. [Google Scholar] [CrossRef]
- Lind, T.; Hokkinen, J.; Jokiniemi, J.K. Fine particle and trace element emissions from waste combustion—Comparison of fluidized bed and grate firing. Fuel Process. Technol. 2007, 88, 737–746. [Google Scholar] [CrossRef]
- Ruan, R.; Xu, X.; Tan, H.; Zhang, S.; Lu, X.; Zhang, P.; Han, R.; Xiong, X. Emission Characteristics of Particulate Matter from Two Ultralow-Emission Coal-Fired Industrial Boilers in Xi’an, China. Energy Fuels 2019, 33, 1944–1954. [Google Scholar] [CrossRef]
- Liu, X.; Xu, Y.; Fan, B.; Lv, C.; Xu, M.; Pan, S.; Zhang, K.; Li, L.; Gao, X. Field measurements on the emission and removal of PM2.5 from coal-fired power stations: 2. Studies on two 135 MW circulating fluidized bed boilers respectively equipped with an electrostatic precipitator and a hybrid electrostatic filter precipitator. Energy Fuels 2016, 30, 5922–5929. [Google Scholar] [CrossRef]
- Du, Q.; Dong, H.; Lv, D.; Su, L.; Gao, J.; Zhao, Z.; Wang, M. Field measurements on the generation and emission characteristics of PM2.5 generated by utility pulverized coal boiler. J. Energy Inst. 2018, 91, 1009–1020. [Google Scholar] [CrossRef]
- Lind, T.; Kauppinen, E.I.; Maenhaut, W.; Shah, A.; Huggins, F. Ash vaporization in circulating fluidized bed coal combustion. Aerosol Sci. Technol. 1996, 24, 135–150. [Google Scholar] [CrossRef]
- Brems, A.; Chan, C.W.; Seville, J.; Parker, D.; Baeyens, J. The transport disengagement height of fine and coarse particles. In Proceedings of the World Congress on Particle Technology (WCPT), Nuremberg, Germany, 26–29 April 2010. [Google Scholar]
- Qu, C.-R.; Xu, B.; Wu, J.; Liu, J.-X.; Wang, X.-T. Effect of limestone addition on PM2.5 formation during fluidized bed coal combustion under O2/CO2 atmosphere. J. Fuel Chem. Technol. 2013, 41, 1020–1024. [Google Scholar]
- Lu, J.Y.; Li, D.K. Experimental Study on PM10, PM2.5, PM1 Emission Features Influenced by Different Conditions in Pulverized Coal Combustion. Proc. Chin. Soc. Electr. Eng. 2006, 26, 103–107. [Google Scholar]
- Wang, S.P.; Chen, P. On comparison of the static precipitator and the bag house. Technol. Innov. Appl. 2013, 23, 54–55. [Google Scholar]
- Strand, M.; Pagels, J.; Szpila, A.; Gudmundsson, A.; Swietlicki, E.; Bohgard, M.; Sanati, M. Fly ash penetration through electrostatic precipitator and flue gas condenser in a 6 MW biomass fired boiler. Energy Fuels 2002, 16, 1499–1506. [Google Scholar] [CrossRef]
- Lind, T. Ash Formation in Circulating Fluidised Bed Combustion of Coal and Solid Biomass; Technical Research Centre of Finland: Espoo, Finland, 1999. [Google Scholar]
- Sotiropoulos, D.; Georgakopoulos, A.; Kolovos, N. Impact of free calcium oxide content of fly ash on dust and sulfur dioxide emissions in a lignite-fired power plant. J. Air Waste Manag. Assoc. 2005, 55, 1042–1049. [Google Scholar] [CrossRef]
- Zhang, W.; Hu, M.; Liu, T.; Liu, Z.; Hu, Z. Effect of desulfurization in CFB on the electrostatic precipitator. Ind. Saf. Dust Control 2001, 4, 12–15. [Google Scholar]
- Buhre, B.; Hinkley, J.; Gupta, R.; Nelson, P.; Wall, T. Fine ash formation during combustion of pulverised coal–coal property impacts. Fuel 2006, 85, 185–193. [Google Scholar] [CrossRef]
- Yang, S.; Song, G.; Na, Y.; Song, W.; Qi, X.; Yang, Z. Transformation characteristics of Na and K in high alkali residual carbon during circulating fluidized bed combustion. J. Energy Inst. 2019, 92, 62–73. [Google Scholar] [CrossRef]
- Yang, S.; Song, G.; Na, Y.; Yang, Z. Alkali metal transformation and ash deposition performance of high alkali content Zhundong coal and its gasification fly ash under circulating fluidized bed combustion. Appl. Therm. Eng. 2018, 141, 29–41. [Google Scholar] [CrossRef]
- Shin, W.G.; Qi, C.; Wang, J.; Fissan, H.; Pui, D.Y. The effect of dielectric constant of materials on unipolar diffusion charging of nanoparticles. J. Aerosol Sci. 2009, 40, 463–468. [Google Scholar] [CrossRef]
- Keller, A.; Fierz, M.; Siegmann, K.; Siegmann, H.; Filippov, A. Surface science with nanosized particles in a carrier gas. J. Vac. Sci. Technol. A Vac. Surf. Films 2001, 19, 1–8. [Google Scholar] [CrossRef]
- Oh, H.; Park, H.; Kim, S. Effects of particle shape on the unipolar diffusion charging of nonspherical particles. Aerosol Sci. Technol. 2004, 38, 1045–1053. [Google Scholar] [CrossRef]
- Rogak, S.N.; Flagan, R.C.; Nguyen, H.V. The mobility and structure of aerosol agglomerates. Aerosol Sci. Technol. 1993, 18, 25–47. [Google Scholar] [CrossRef]


Publisher’s Note: MDPI stays neutral with regard to jurisdictional claims in published maps and institutional affiliations. |
© 2022 by the authors. Licensee MDPI, Basel, Switzerland. This article is an open access article distributed under the terms and conditions of the Creative Commons Attribution (CC BY) license (https://creativecommons.org/licenses/by/4.0/).