Abstract
This manuscript presents performed laboratory studies and the analysis of the impact of current shunt values used in the differential connection on the wideband metrological performance of inductive current transformers. Moreover, a comparison of the accuracy of wideband and 50 Hz-type inductive current transformers in the specified frequency range from 50 Hz to 5 kHz is presented. The main factor which may influence the wideband accuracy of inductive current transformers is the phenomenon of self-generation. This causes rapid changes in the accuracy, and simultaneously causes the most positive and the most negative values of current error and phase displacement. To evaluate the metrological performance in the differential measurement setup for higher harmonics of the distorted current, a digital acquisition board was used. Obtained results show that if proper values of current shunt resistance are chosen, such devices may be used to evaluate the wideband accuracy of inductive current transformers. The results indicate that the typical units designed for the transformation of sinusoidal current with a frequency of 50 Hz can achieve a comparable metrological performance to that of the wideband inductive current transformer.
1. Introduction
In the market, wideband current transformers (CTs) are available [1,2,3,4,5]. High values of primary current required for tests may be obtained using wideband power supplies [6,7,8,9]. In this paper, we present a comparison of the accuracy determined within a specified frequency range for the wideband and 50 Hz-type CTs. The evaluation was performed in the differential measuring system where composite error is directly determined [10,11,12]. However, the accuracy of such a measuring setup may be affected by the resistance of the current shunt used. Therefore, additional analyses were performed to determine the impact of the current shunt value obtained for each higher harmonic values of current error and phase displacement. The differential measuring system is characterized by the low measurement uncertainty in comparison to the utilization of a two-channel digital acquisition board for primary and secondary current measurements [9,13,14,15,16]. Another solution is based upon using the ampere turns method, whereby the additional primary winding is made [17,18]. Therefore, it is applicable only to the window type of CT. The number of turns of the primary winding has to be equal to its rated current ratio. The main problem which should be considered for CTs with magnetic cores concerns their low-order harmonics self-generation phenomenon [10]. This problem results from the nonlinear magnetization curve of the magnetic core which causes a rise in the low-order higher harmonics in the secondary current [11,19,20]. This phenomenon is observed in the transformation of the sinusoidal and distorted current. In the measurement of the distorted reactive and active power and the monitoring of power quality, the most important consideration is the proper metrological performance of the low-order higher harmonics transformation [21,22,23,24,25]. In the paper [21], the influence of grid-connected renewable power sources on power quality is analysed. Moreover, the effectiveness of the applied methods in the mitigation of this problem is discussed. The paper [23] presents a novel software-based methodology to analyse power quality with consideration of the collaboration networks characteristics among researchers in this field. However, inductive and electronic CTs may cause self-distortion of the secondary current and also malfunction of the connected protection apparatus or measuring system [11,26,27,28,29,30,31]. To ensure the proper reproduction of the primary current, the wideband frequency response should be evaluated. It should ensure a linear dependence of transformation error with frequency [32]. In the case of wideband units, it should be required that for the low-order higher harmonics of transformed distorted current, negligible values of current error and phase displacement are ensured. Moreover, the shape of the magnetic core may influence the metrological performance of the inductive CT [33,34].
In this paper, the metrological performance frequency characteristics of two tested inductive CTs are presented. Tests were performed for two values of distorted primary current with consideration of the influence of the secondary windings rated load. Moreover, the self-generation phenomenon is also considered, and its impact on their accuracy is analysed. The utilization of the differential measuring circuit may affect the determined values of current error and phase displacement of the tested CT. Therefore, the influence of three current shunts, with resistance values equal to 1 Ω, 10 Ω, 100 Ω, respectively, are analysed. In the measurement setup, differential current is measured simultaneously by two devices: a digital acquisition board equipped with only voltage inputs and which requires the use of an external current shunt, and a digital power analyser equipped with current input. The obtained accuracy characteristic of the digital acquisition board is compared with the differential current measured directly by the digital power meter using a 0.1 Ω internal current shunt only. The results of the transformation accuracy obtained for the low-order harmonics and the wideband CT show that in the tested frequency range, the wideband CT is affected by the self-generation phenomenon, as for the 50 Hz-type CT. Therefore, there are devices in the customer market that only by name are wideband, and do not ensure better metrological properties than a typical inductive CT designed for the transformation of 50 Hz sinusoidal currents only. To summarize the novelty of this paper, the main achievements are listed below:
- A comparison of the accuracy of both wideband and 50 Hz-type inductive CTs in the specified frequency range from 50 Hz to 5 kHz.
- The determination of the influence of a current shunt on the determined frequency characteristic of current error and phase displacement in the differential measurement setup.
- The utilization of a digital acquisition board to determine composite error, current error and phase displacement in the differential measurement setup.
- Analysis of the self-generation phenomenon in the wideband CT.
- An explanation for the influence of current shunt values on secondary voltages of the inductive CT.
- The analysis of the frequency characteristic of secondary voltages to justify the change in current error and phase displacement values.
2. The Object under Study and the Measuring Circuit
Laboratory studies were performed for two different inductive CTs. The first one was the standard type of unit manufactured for the transformation of sinusoidal current. The second one is sold as a wideband unit. Both tested CTs are characterized by a current ratio equal to 5 A\5 A. Therefore, their accuracy tests did not require a reference CT. The manufacturer of each of the considered CTs provided the rated apparent power of the secondary winding equal to 10 VA. In our studies, to exclude the increase in the secondary voltage and the associated rise of magnetic flux density with the frequency of transformed harmonics, we utilized only resistive loads. In the measuring circuit, as presented in the IEC 61869-2 standard, the additional connections between primary and secondary windings are made to obtain the differential current [35]. To detect the influence of the current shunt RD resistance on the values of current error and phase displacement of the tested CTs, a digital power meter (DPM) with FFT (Fast Fourier Transform) and digital acquisition board (AB) were used to determine the particular higher harmonics. Differential current was measured in order to directly determine the values of composite error for each harmonic. The current input of the DPM was utilized, while in the case of the AB, it was measured via current shunts. The current shunt RS enabled the measurement of the primary current using the DPM and AB voltage inputs.
A programmable voltage source was used to supply the measuring circuit presented in Figure 1. To ensure proper grounding, an insulated transformer was required. This solution was able to provide the distorted primary current required for the testing of harmonic transformation by the inductive CTs.
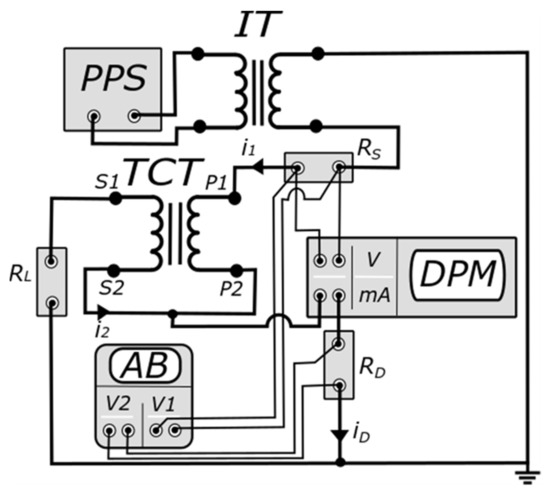
Figure 1.
Measuring circuit for the determination of current and phase errors of higher harmonics transformation. In Figure 1, the following abbreviations are used: AB—digital acquisition board, DPM—digital power meter, i1—instantaneous primary current, i2—instantaneous secondary current, iD—instantaneous differential current, IT—insulation transformer, P1/P2—primary winding terminals, PPS—programmable power source, RD—current shunt for the alternative measurement of differential current, RL— resistance load of the secondary windings, RS—current shunt used to measure the primary current, S1/S2—secondary winding terminals, TCT—tested CT, V/mA—inputs of the DPM, V1/V2—inputs of the AB.
The values of the primary current harmonic may be calculated from equation:
where:
- U1hk—RMS value of the specified voltage hk harmonic from the RS current shunt,
- I1hk—RMS value of the specified primary current hk harmonic,
- RS—current shunt with a resistance value equal to 0.1 Ω and an inductance value below 10 µH.
Using the AB, the value of the differential current harmonic measured by the current shunt RD is determined from the equation:
where:
- URDhk_AB—RMS value of the specified voltage hk harmonic of the current shunt RD (1 Ω, 10 Ω, 100 Ω).
The value of the composite error harmonic expressed as a percentage using the AB are determined from the equation:
where:
- IDhk_AB—RMS value of the specified differential current hk harmonic measured by the AB.
The RMS values of secondary current harmonics when using the AB are determined from the relationship:
where:
- φhk_AB—phase angle between the specified voltage hk harmonic of resistor RS and the specified voltage hk harmonic of current shunt RD,
- I2hk_AB—RMS value of the specified secondary current hk harmonic measured by the AB.
The value of the current error harmonic expressed as a percentage using the AB, is determined from the equation:
Calculating specific composite and current error hk harmonics enables the specific phase displacement of the hk harmonic for the transformation of the distorted current for the tested CT to be determined using the AB, as follows:
Using the DPM, the value of the specific differential current hk harmonics are measured directly by the current input. The specified values of the composite error hk harmonics for the transformation of the distorted current are then determined from equation:
where:
- IDhk_DPM—RMS value of the specific differential current hk harmonic measured by the DPM.
The RMS values of the specific secondary current hk harmonics of the DPM are determined from the relationship:
where:
- φhk_DPM—phase angle between the specified voltage hk harmonic of resistor RS and the specific differential current hk harmonic IDhk_DPM,
- I2hk_DPM—RMS value of the specific secondary current hk harmonic measured by the DPM.
The value of the current error harmonic, expressed as a percentage using the DPM, is determined from the equation:
Calculating the specific composite and current error hk harmonics enables the specified phase displacement of the hk harmonic for the transformation of the distorted current using the DPM to be determined, as follows:
In accordance with the results presented in paper [10], the combined type B uncertainties specified for the calculated values of current error and the phase displacement hk higher harmonic of the distorted current from the developed measuring system from Figure 1 are equal to ±0.025% and ±0.013°, respectively. The probability distribution of the standard uncertainties was taken as rectangular. The measurement uncertainty was calculated for the values of the composite error harmonics equal to 0.1% and 1%, and four values of distorted current equal to 0.005 A, 0.1 A, 0.5 A and 0.6 A. Moreover, to properly perform the analysis, the phase angle between the specified voltage hk harmonic from resistor RS and the specified differential current hk harmonic was analysed in the range from 0° to 360°. The standard uncertainty type A was considered negligible because it did not exceed 0.1 of the standard uncertainty type B (the results were averaged from 256 measured samples).
The research objective of this paper was to analyse the influence of RD current shunt resistances equal to 1 Ω, 10 Ω, 100 Ω, used to measure composite error as an alternative to using the DPM in the measuring circuit Figure 1, on determined values of current error and phase displacement of distorted current harmonics transformation. This problem, as explained in Figure 2, results from the decrease or the increase in the value of secondary voltage u2, caused by the additional voltage drop on this resistor.
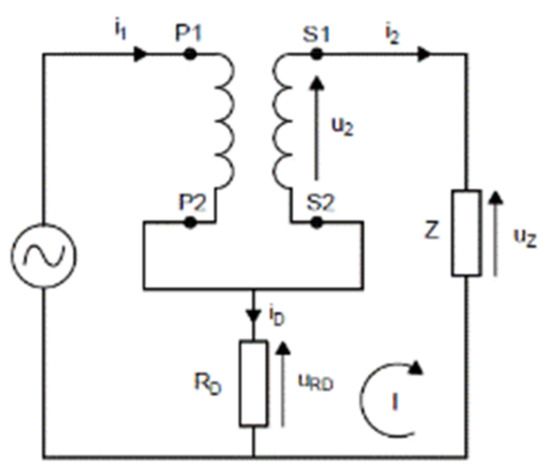
Figure 2.
Simplified equivalent diagram of the measuring circuit.
Equations resulting from 2nd Kirchhoff’s law (I loop):
where:
- u2—instantaneous value of the voltage from the secondary winding of the tested CT,
- uZ—instantaneous value of the voltage on load impedance of the CT’s secondary winding,
- i1\2—instantaneous values of primary and secondary currents of the CT
- Z—load impedance (mainly used as resistance) of the secondary winding,
- iD—instantaneous value of the differential current.
According to the equations given above, the secondary winding voltage is decreased by the voltage on resistor RD. When the direction of differential current iD is changed, u2 is increased by this voltage. Due to the nonlinearity of the magnetization characteristic of the inductive CT’s magnetic core, the change in the secondary voltage u2 causes a change in the differential current iD. Therefore, as determined in the measurement setup from Figure 1, values of current error and phase displacement are additionally decreased or increased depending on the direction of the differential current iD.
3. Additional Load of Secondary Winding Caused by the Measuring System
The values of tested CTs current error and phase displacement, as presented in Figure 3, were evaluated for the transformation of distorted current with a single higher harmonic of frequency from 100 Hz to 5 kHz, with the main component frequency of 50 Hz. Obtained maximum positive (labeled +) and maximum negative (labeled −) values resulted from the impact of higher harmonics with frequencies from 100 Hz to 650 Hz generated by the wideband-type CT. The tests were performed for rated primary current and the load of its secondary winding.
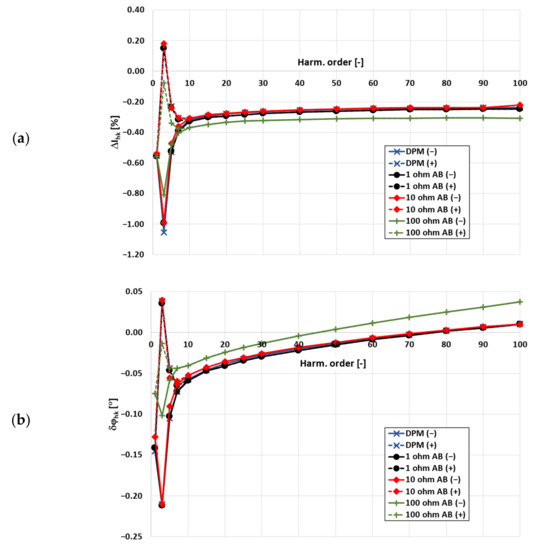
Figure 3.
The influence of the self-generated low-order higher harmonics of the tested wideband CT and current shunt resistance on current error (a) and phase displacement (b) for rated primary current and load resistance. In Figure 3, the following abbreviations are used: DPM (+)\(−)—maximum positive (dashed line)/maximum negative (solid line) values of current error and phase displacement determined by the digital power meter (DPM), 1\10\100 ohm AB (+)\(−)—maximum positive (dashed line)/maximum negative (solid line) values of current error and phase displacement determined by the digital acquisition board (AB) using a current shunt of 1 Ω\10 Ω\100 Ω.
To obtain the (+)\(−) values of current error and phase displacement, the phase angle of the higher harmonic in the distorted primary current in relation to its main component is adjusted in the 10° steps from 0° to 360°. Moreover, maximum positive and negative values of current error and phase displacement are also presented when the RD current shunt resistances, equal to 1 Ω, 10 Ω, 100 Ω, were used to measure composite error as an alternative to the DPM in the measurement circuit from Figure 1.
The results presented in Figure 3 were analysed to determine the consequences of applying the current shunt to measure the composite error in the differential circuit from Figure 1. Significant differences in the obtained values of current error and phase displacement of harmonics transformation in the tested inductive CT were detected for the 100 Ω current shunt. If this very high resistance current shunt is used, the differences between reference values from the DPM occur even for low values of the transformation error in the whole tested frequency range of harmonics. This is due to the fact that in both cases, the voltage drop on the current shunt is increased, and therefore, as results from Equation (11), a decrease in the secondary winding voltage, as presented in Figure 4, is most significant. Other values of current shunt resistances did not affect the results of the measurement in relation to that obtained by the DPM. However, the impact of the current shunts used is a result of the inferential current values.
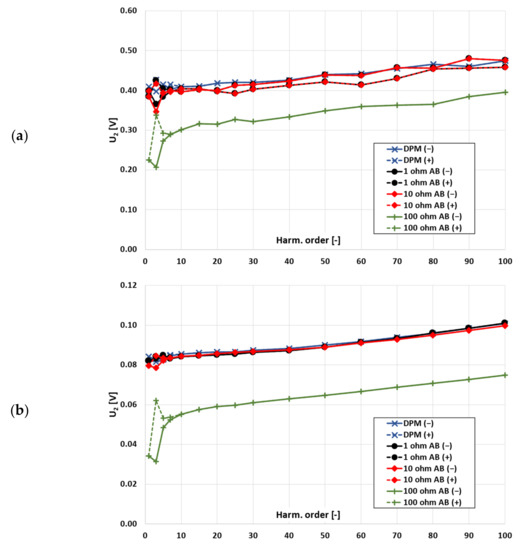
Figure 4.
The dependence of secondary voltage of the tested CT from the voltage drop on the current shunt for different values of its resistance (used notations are as in Figure 3) for two values of the primary current (a) 100%, (b) 20%.
When the 100 Ω current shunt was used, the decrease in the secondary voltage was significant, therefore, the decrease in current error and phase displacement of the harmonic transformation is also significant. This behaviour was also detected for low transformation error values across the whole tested frequency range of harmonics. This was due to the fact that the CT operating point, placed high on its magnetization characteristic, has been moved lower. Therefore, different values of self-generation are obtained. The current shunt with resistances of 1 Ω and 10 Ω did not significantly change the errors. Moreover, increased values of secondary voltage with frequency are caused by the presence of the inductance of the wires used for the measurement setup connections on the secondary side of the tested CT.
Figure 5 presents the results confirming the influence of the self-generated higher harmonics from the wideband CT and the current shunt resistance on the values of current error and phase displacement, also for 20% of the rated primary current with the rated load of the secondary winding.
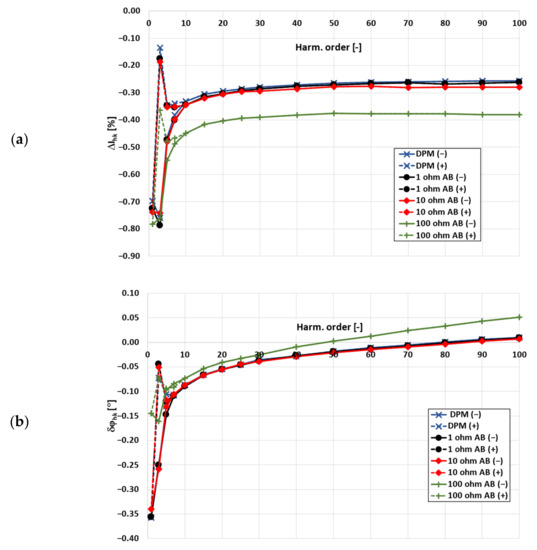
Figure 5.
The influence of the self-generated low-order higher harmonics from the wideband-type CT and the current shunt resistance on current error (a), phase displacement (b), for 20% of the rated primary current and rated resistance load (used notations are as in Figure 3).
The maximum positive and negative values of phase displacement and current error determined for the transformation of harmonics by the wideband-type CT, as presented in Figure 5, have lower values than are presented in Figure 3 for 100% of the rated primary current and the same load. This is caused by the lower self-distortion of the secondary current associated with the nonlinearity of the magnetic core. The limited value of the primary current is a result of its operating point in the magnetization characteristic being further away from the knee region.
In Figure 6, for the comparison between different types of tested CTs, the influence of current shunt resistance on the values of current error and phase displacement for 100% of the RMS value of primary current and rated load of 50 Hz-type CTs, is presented. Moreover, as in the previous case, the maximum positive (dashed line) and maximum negative (solid line) values of current error and phase displacement, as obtained for a specified phase angle of transformed higher harmonic related to the main component of the distorted primary current, are presented.
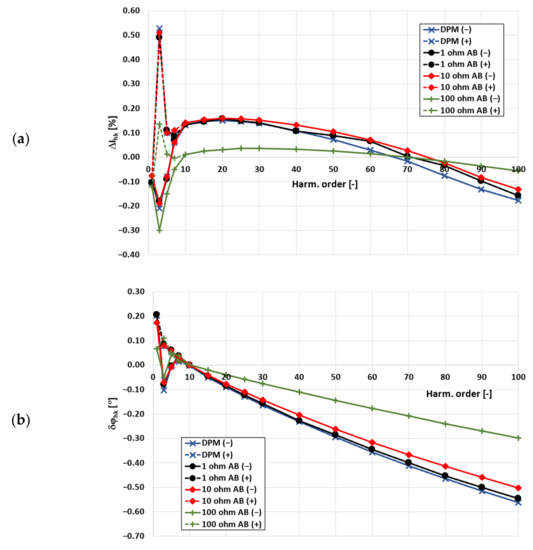
Figure 6.
The influence of the self-generated low-order higher harmonics by the 50 Hz-type CT and current shunt resistance on current error (a), phase displacement (b) for rated primary current and load resistance (used notations are as in Figure 3).
In this case, the current shunt is also characterized by a 100 Ω resistance which influences the obtained values of current error and phase displacement. The 50 Hz-type CT is characterized by a worse accuracy performance in the tested frequency range than the wideband CT. However, in both cases, the self-generation phenomenon conditions the wideband performance. Obtained errors for the tested 50 Hz-type inductive CT were slightly higher than for the wideband CT. This was associated with the higher value of inductance leakage in the secondary windings. Therefore, with the increasing frequency of the transformed higher harmonic, the magnetizing voltage also increases. Therefore, the CT’s operating point in the magnetization characteristic moves higher towards the knee point. Consequently, in relation to the tested wideband CT, higher values of current error and phase displacement, with the increase in the frequency of the transformed harmonic, are obtained.
In Figure 7, the influence of the current shunt resistance on current error and phase displacement for 20% of the rated primary current and load for the 50 Hz-type CT is presented.
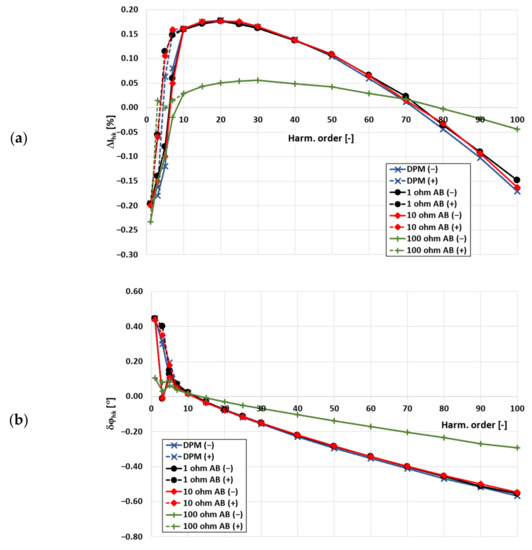
Figure 7.
The influence of the self-generated low-order higher harmonics in the 50 Hz-type CT and current shunt resistance on current error (a), phase displacement (b) for 20% of rated primary current and rated load resistance (used notations are as in Figure 3).
The same behaviour of the 50 Hz unit at 100% of the rated primary current was observed when RMS values of the transformed current were equal to 20% of its rated value. The 100 Ω resistor used as current shunt strongly influenced the obtained values of current error and phase displacement of the transformation harmonic of the distorted current. The positive values of current errors indicated that the turns ratio correction was applied. Therefore, the quotient of the numbers of turns of primary and secondary windings is not the same as the rated current ratio [36].
4. Conclusions
The comparison of the transformation accuracy of the distorted current harmonics evaluated for specified frequencies from 50 Hz to 5 kHz for the wideband and 50 Hz inductive CTs indicates that the typical units can achieve comparable metrological performance. Therefore, to determine the current error and phase displacement of the CTs, the digital acquisition board equipped only with voltage inputs can be adopted, but it is necessary to properly choose the current shunt resistance values. High values of current shunts increase the measurement uncertainty of current error and phase displacement. Moreover, it may cause a change in the secondary voltage of the tested CT. Therefore, the accuracy tests would not be performed within appropriate tested CT operating conditions. To evaluate the influence of the current shunt resistance, analysis of the frequency characteristic of the secondary voltage was performed. This provides the justification for the change in the transformation accuracy of the tested CT. Moreover, to properly determine the frequency characteristic of current error and phase displacement, the self-generation phenomenon should be considered. Depending on the phase angle of the transformed higher harmonic related to the self-generated one, the values of current error and phase displacement may change rapidly and achieve the maximum positive and the maximum negative values. The contribution of this paper to the field under study is pointed out in the following:
- Typical CTs designed for the transformation of sinusoidal current can achieve a comparable metrological performance to wideband units.
- A digital acquisition board, equipped only with voltage inputs, can be adopted to evaluate the wideband performance of CTs.
- The influence of a current shunt on the determined frequency characteristic of current error and phase displacement in the differential measurement setup is explained.
- The analyses performed provide justification for the change in current error and phase displacement values caused by the current shunt used in the differential connection.
- The self-generation phenomenon of the wideband CT is presented.
Author Contributions
Conceptualization, M.K. and E.S.; methodology, M.K. and E.S.; validation, M.K. and E.S.; formal analysis, M.K., P.K. and E.S.; investigation, M.K., P.K. and E.S.; resources, M.K. and E.S.; data curation, M.K., E.S. and P.K.; writing—original draft preparation, M.K. and E.S.; writing—review and editing, M.K. and E.S.; visualization, E.S.; supervision, M.K. All authors have read and agreed to the published version of the manuscript.
Funding
This research received no external funding.
Data Availability Statement
Not applicable.
Conflicts of Interest
The authors declare no conflict of interest.
References
- Current Transformer for Harmonics Measurement up to 20 kHz. Available online: https://mbs-ag.com/en/product-range/current-transformer-for-harmonics-measurement-up-to-20-khz/ (accessed on 15 August 2022).
- Mingotti, A.; Peretto, L.; Bartolomei, L.; Cavaliere, D.; Tinarelli, R. Are inductive current transformers performance really affected by actual distorted network conditions? An experimental case study. Sensors 2020, 20, 927. [Google Scholar] [CrossRef]
- Current Transformers for Higher Frequencies. Available online: https://www.polcontact-warszawa.pl/oferta/przekladniki-pradowe/na-wyzsze-czestotliwosci/przekladniki-pradowe-na-wyzsze-czestotliwosci,p1462892586 (accessed on 15 August 2022).
- Kondrath, N.; Kazimierczuk, M.K. Bandwidth of current transformers. IEEE Trans. Instrum. Meas. 2009, 58, 2008–2016. [Google Scholar] [CrossRef]
- Mingotti, A.; Bartolomei, L.; Peretto, L.; Tinarelli, R. On the long-period accuracy behavior of inductive and low-power instrument transformers. Sensors 2020, 20, 5810. [Google Scholar] [CrossRef] [PubMed]
- Kaczmarek, M.; Kaczmarek, P. Comparison of the wideband power sources used to supply step-up current transformers for generation of distorted currents. Energies 2020, 13, 1849. [Google Scholar] [CrossRef]
- Kaczmarek, M.L.; Stano, E. Application of the inductive high current testing transformer for supplying of the measuring circuit with distorted current. IET Electr. Power Appl. 2019, 13, 1310–1317. [Google Scholar] [CrossRef]
- Industrial Amplifier for High Current/Low Impedance Operation. Available online: https://aetechron.com/IND-RESEARCH-7794.shtml (accessed on 15 August 2022).
- Cristaldi, L.; Faifer, M.; Laurano, C.; Ottoboni, R.; Toscani, S.; Zanoni, M. A Low-Cost Generator for Testing and Calibrating Current Transformers. IEEE Trans. Instrum. Meas. 2019, 68, 2792–2799. [Google Scholar] [CrossRef]
- Kaczmarek, M.; Stano, E. The Influence of the 3rd Harmonic of the Distorted Primary Current on the Self-Generation of the Inductive Current Transformers. IEEE Access 2022, 10, 55876–55887. [Google Scholar] [CrossRef]
- Kaczmarek, M.; Szczęsny, A.; Stano, E. Operation of the Electronic Current Transformer for Transformation of Distorted Current Higher Harmonics. Energies 2022, 15, 4368. [Google Scholar] [CrossRef]
- Kaczmarek, M.; Kaczmarek, P.; Stano, E. The Effect of the Load Power Factor of the Inductive CT’s Secondary Winding on Its Distorted Current’s Harmonics Transformation Accuracy. Energies 2022, 15, 6258. [Google Scholar] [CrossRef]
- Brandolini, A.; Faifer, M.; Ottoboni, R. A simple method for the calibration of traditional and electronic measurement current and voltage transformers. IEEE Trans. Instrum. Meas. 2009, 58, 1345–1353. [Google Scholar] [CrossRef]
- Cataliotti, A.; Di Cara, D.; Emanuel, A.E.; Nuccio, S. A novel approach to current transformer characterization in the presence of harmonic distortion. IEEE Trans. Instrum. Meas. 2009, 58, 1446–1453. [Google Scholar] [CrossRef]
- Vukovic, D.N.; Skundric, S.; Zigic, A. Three chanels device for current transformer accuracy testing. In Proceedings of the 19th International Symposium on Power Electronics (Ee), Novi Sad, Serbia, 19–21 October 2017; pp. 1–4. [Google Scholar]
- Siegenthaler, S.; Mester, C. A computer-controlled calibrator for instrument transformer test sets. IEEE Trans. Instrum. Meas. 2017, 66, 1184–1190. [Google Scholar] [CrossRef]
- Takahashi, K.; Yamawaki, M.; Tadokoro, T. Current ratio transfer standard and improved equivalent ampere turn method. IEEE Trans. Instrum. Meas. 2013, 62, 1716–1722. [Google Scholar] [CrossRef]
- Stano, E.; Kaczmarek, P.; Kaczmarek, M. Understanding the Frequency Characteristics of Current Error and Phase Displacement of the Corrected Inductive Current Transformer. Energies 2022, 15, 5436. [Google Scholar] [CrossRef]
- Gustavsen, B. Wideband Transformer Modeling Including Core Nonlinear Effects. IEEE Trans. Power Deliv. 2016, 31, 219–227. [Google Scholar] [CrossRef]
- Slomovitz, D.; Santos, A.; Sandler, R.; Barreto, G. High-Precision Self-Calibrating Current Transformer with Stray Capacitances Control. IEEE Trans. Instrum. Meas. 2021, 70, 1–9. [Google Scholar] [CrossRef]
- Hossain, E.; Tur, M.R.; Padmanaban, S.; Ay, S.; Khan, I. Analysis and Mitigation of Power Quality Issues in Distributed Generation Systems Using Custom Power Devices. IEEE Access 2018, 6, 16816–16833. [Google Scholar] [CrossRef]
- Liang, X. Emerging Power Quality Challenges Due to Integration of Renewable Energy Sources. IEEE Trans. Ind. Appl. 2017, 53, 855–866. [Google Scholar] [CrossRef]
- Montoya, F.G.; Baños, R.; Alcayde, A.; Montoya, M.G.; Manzano-Agugliaro, F. Power quality: Scientific collaboration networks and research trends. Energies 2018, 11, 2067. [Google Scholar] [CrossRef]
- Dirik, H.; Duran, I.U.; Gezegin, C. A Computation and Metering Method for Harmonic Emissions of Individual Consumers. IEEE Trans. Instrum. Meas. 2019, 68, 412–420. [Google Scholar] [CrossRef]
- Stano, E.; Kaczmarek, P.; Kaczmarek, M. Why Should We Test the Wideband Transformation Accuracy of Inductive Current Transformers? Energies 2022, 15, 5737. [Google Scholar] [CrossRef]
- McNeill, N.; Dymond, H.; Mellor, P.H. High-fidelity low-cost electronic current sensor for utility power metering. IEEE Trans. Power Deliv. 2011, 26, 2309–2317. [Google Scholar] [CrossRef]
- Mingotti, A.; Peretto, L.; Tinarelli, R.; Angioni, A.; Monti, A.; Ponci, F. A simple calibration procedure for an LPIT plus PMU system under off-nominal conditions. Energies 2019, 12, 4645. [Google Scholar] [CrossRef]
- Xiao, X.; Song, H.; Li, H. A High Accuracy AC+DC Current Transducer for Calibration. Sensors 2022, 22, 2214. [Google Scholar] [CrossRef] [PubMed]
- Pan, F.; Chen, R.; Xiao, Y.; Sun, W. Electronic voltage and current transformers testing device. Sensors 2012, 12, 1042–1051. [Google Scholar] [CrossRef]
- Mingotti, A.; Peretto, L.; Tinarelli, R. Smart characterization of rogowski coils by using a synthetized signal. Sensors 2020, 20, 3359. [Google Scholar] [CrossRef]
- Mohns, E.; Roeissle, G.; Fricke, S.; Pauling, F. An AC current transformer standard measuring system for power frequencies. IEEE Trans. Instrum. Meas. 2017, 66, 1433–1440. [Google Scholar] [CrossRef]
- Fritsch, M.; Wolter, M. High-Frequency Current Transformer Design and Construction Guide. IEEE Trans. Instrum. Meas. 2022, 71, 1–9. [Google Scholar] [CrossRef]
- Lesniewska, E. Influence of the selection of the core shape and winding arrangement on the accuracy of current transformers with through-going primary cable. Energies 2021, 14, 1932. [Google Scholar] [CrossRef]
- Platero, C.A.; Sánchez-Fernández, J.Á.; Gyftakis, K.N.; Blázquez, F.; Granizo, R. Performance problems of non-toroidal shaped current transformers. Sensors 2020, 20, 3025. [Google Scholar] [CrossRef]
- IEC. Inst. Transf.—The Use of Instrument Transformers for Power Quality Measurement; IEC 61869-103; IEC: Geneva, Switzerland, 2010. [Google Scholar]
- Stano, E. The Method to Determine the Turns Ratio Correction of the Inductive Current Transformer. Energies 2021, 14, 8602. [Google Scholar] [CrossRef]
Publisher’s Note: MDPI stays neutral with regard to jurisdictional claims in published maps and institutional affiliations. |
© 2022 by the authors. Licensee MDPI, Basel, Switzerland. This article is an open access article distributed under the terms and conditions of the Creative Commons Attribution (CC BY) license (https://creativecommons.org/licenses/by/4.0/).