
Laser Modified Glass for High-Performance Photovoltaic Module

 , , , ,
  ,
, 
Abstract

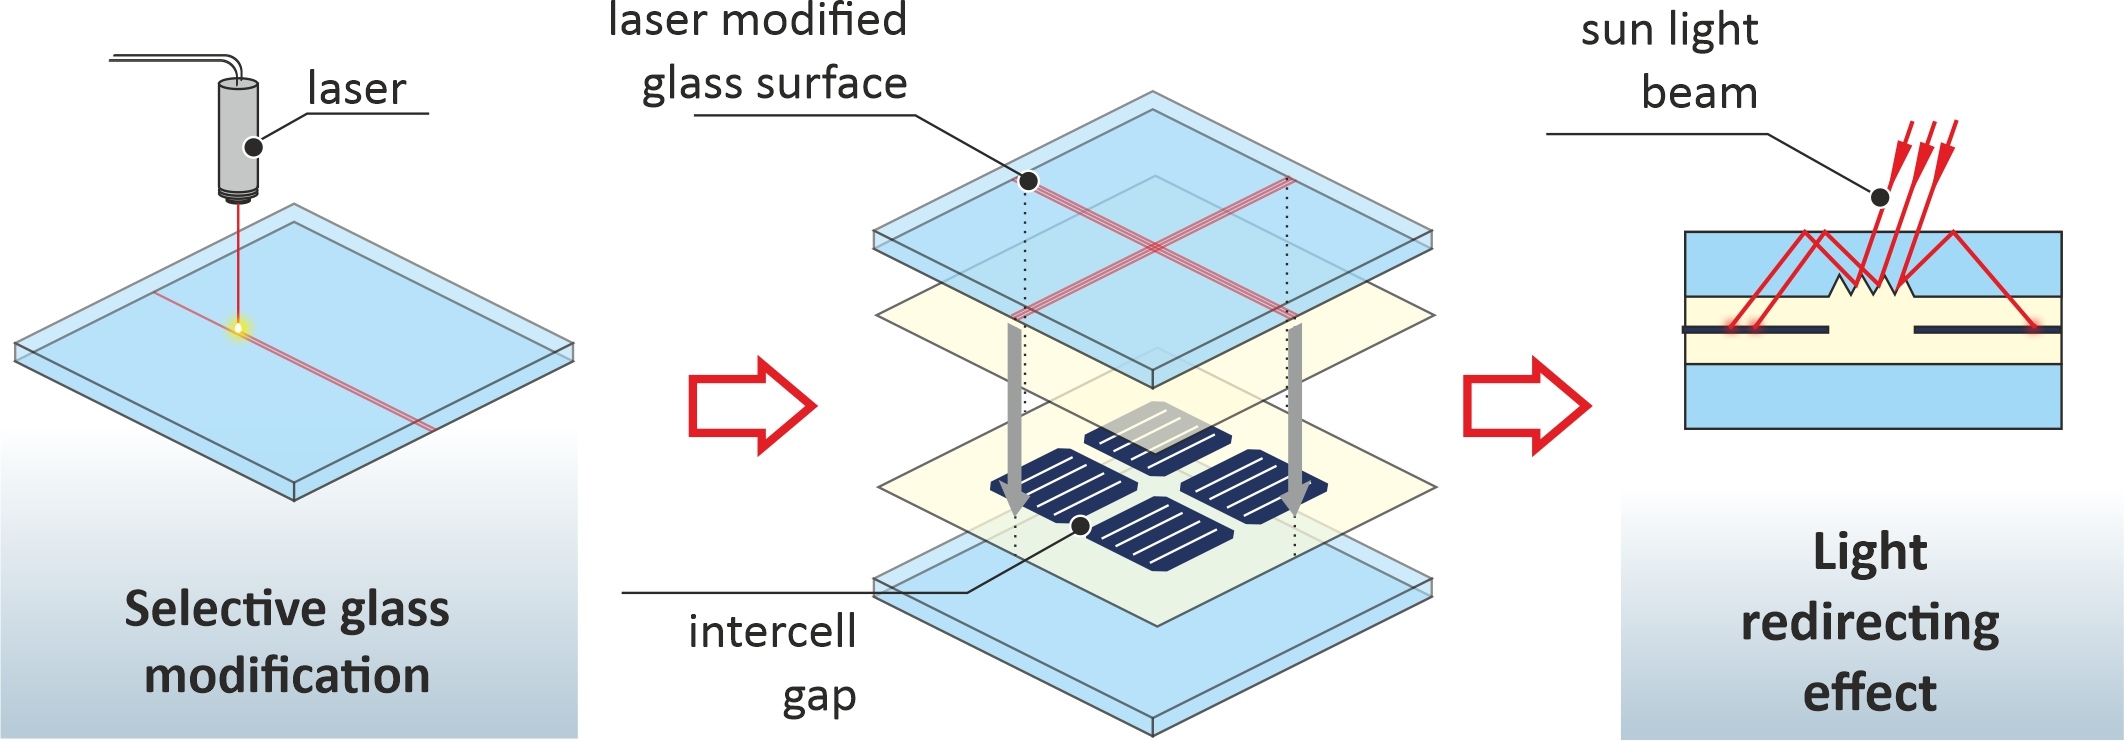
1. Introduction
2. Materials and Methods
3. Results and Discussion
4. Conclusions
Author Contributions
Funding
Institutional Review Board Statement
Informed Consent Statement
Data Availability Statement
Conflicts of Interest
References
- Ajayan, J.; Nirmal, D.; Mohankumar, P.; Saravanan, M.; Jagadesh, M.; Arivazhagan, L. A review of photovoltaic performance of organic/inorganic solar cells for future renewable and sustainable energy technologies. Superlattices Microstruct. 2020, 143, 106549. [Google Scholar] [CrossRef]
- International Technology Roadmap for Photovoltaic (ITRPV) 13th Edition, Published by the German Mechanical Engineering Industry Association (VDMA). March 2022. Available online: https://www.vdma.org/international-technology-roadmap-photovoltaic (accessed on 12 August 2022).
- Su, W.-S.; Chen, Y.-C.; Liao, W.H.; Huang, C.-H.; Liu, D.-C.; Huang, M.-Y.; Wu, Z.-C.; Ho, S.-J. Optimization of the output power by effect of backsheet reflectance and spacing between cell strings. In Proceedings of the 37th IEEE Photovoltaic Specialists Conference, Seattle, WA, USA, 19–24 June 2011; pp. 3218–3220. [Google Scholar] [CrossRef]
- Lim, H.; Cho, S.H.; Moon, J.; Jun, D.Y.; Kim, S.H. Effects of Reflectance of Backsheets and Spacing between Cells on Photovoltaic Modules. Appl. Sci. 2022, 12, 443. [Google Scholar] [CrossRef]
- McIntosh, K.R.; Jung, J.; Abbott, M.D.; Sudbury, B.A. Determination and evaluation of a backsheet’s intrinsic reflectance. In Proceedings of the AIP Conference Proceedings, Lausanne, Switzerland, 19–21 March 2018; AIP Publishing LLC: Melville, NY, USA, 2018; Volume 1999, p. 020018. [Google Scholar] [CrossRef]
- Mittag, M.; Grünzweig, A.; Wiese, M.; Mahmoud, N.; Schmid, A.; Heinrich, M. Analysis of backsheet and rear cover reflection gains for bifacial solar cells. In Proceedings of the 33rd European PV Solar Energy Conference and Exhibition (Vol. 2017), Amsterdam, The Netherlands, 25–29 September 2017. [Google Scholar]
- Sarniak, M.T. Modeling the Functioning of the Half-Cells Photovoltaic Module under Partial Shading in the Matlab Package. Appl. Sci. 2020, 10, 2575. [Google Scholar] [CrossRef]
- Jang, J.; Pfreundt, A.; Mittag, M.; Lee, K. Performance Analysis of Bifacial PV Modules with Transparent Mesh Backsheet. Energies 2021, 14, 1399. [Google Scholar] [CrossRef]
- Hanifi, H.; Dassler, D.; Schneider, J.; Turek, M.; Schindler, S.; Bagdahn, J. Optimized tab width in half-cell modules. Energy Procedia 2016, 92, 52–59. [Google Scholar] [CrossRef]
- Bae, J.; Jee, H.; Park, Y.; Lee, J. Simulation-Based Shading Loss Analysis of a Shingled String for High-Density Photovoltaic Modules. Appl. Sci. 2021, 11, 11257. [Google Scholar] [CrossRef]
- Shin, G.; Jeon, J.G.; Kim, J.H.; Lee, J.H.; Kim, H.J.; Lee, J.; Kang, K.M.; Kang, T.J. Thermocells for Hybrid Photovoltaic/Thermal Systems. Molecules 2020, 25, 1928. [Google Scholar] [CrossRef]
- Haedrich, I.; Eitner, U.; Wiese, M.; Wirth, H. Unified methodology for determining CTM ratios: Systematic prediction of module power. Sol. Energy Mater. Sol. Cells 2014, 131, 14–23. [Google Scholar] [CrossRef]
- Yousuf, H.; Zahid, M.A.; Khokhar, M.Q.; Park, J.; Ju, M.; Lim, D.; Kim, Y.; Cho, E.-C.; Yi, J. Cell-to-Module Simulation Analysis for Optimizing the Efficiency and Power of the Photovoltaic Module. Energies 2022, 15, 1176. [Google Scholar] [CrossRef]
- Haedrich, I.; Surve, S.; Thomson, A. Cell to module (CTM) ratios for varying industrial cell types. In Proceedings of the 2015 Asia Pacific Solar Research Conference, Melbourne, Australia, 8–10 December 2015; pp. 1–6. [Google Scholar]
- Mariano, J.R.L.; Lin, Y.-C.; Liao, M.; Ay, H. Analysis of Power Generation for Solar Photovoltaic Module with Various Internal Cell Spacing. Sustainability 2021, 13, 6364. [Google Scholar] [CrossRef]
- Sharma, A.; Dasgotra, A.; Tiwari, S.K.; Sharma, A.; Jately, V.; Azzopardi, B. Parameter Extraction of Photovoltaic Module Using Tunicate Swarm Algorithm. Electronics 2021, 10, 878. [Google Scholar] [CrossRef]
- Sanchez-Illescasa, P.J.; Carpena, P.; Bernaola-Galva, P.; Sidrach-de-Cardona, M.; Coronado, A.V.; Alvarez, J.L. An analysis of geometrical shapes for PV module glass encapsulation. Sol. Energy Mater. Sol. Cells 2008, 92, 323–331. [Google Scholar] [CrossRef]
- Blieske, U.; Doege, T.; Gayout, P.; Neander, M.; Neumann, D.; Prat, A. Light-trapping in solar modules using extra-white textured glass. In Proceedings of the 3rd World Conference on Photovoltaic Energy Conversion, Osaka, Japan, 11–18 May 2003; Volume 1, pp. 188–191. Available online: https://ieeexplore.ieee.org/abstract/document/1305253 (accessed on 12 August 2022).
- McIntosh, K.R.; Swanson, R.M.; Cotter, J.E. A simple ray tracer to compute the optical concentration of photovoltaic modules. Prog. Photovolt. Res. Appl. 2006, 14, 167–177. [Google Scholar] [CrossRef]
- Yang, G.; van Swaaij, R.A.; Isabella, O.; Zeman, M. A novel way of texturing glass for microcrystalline silicon thin film solar cells application. Prog. Photovolt. Res. Appl. 2015, 23, 1283–1290. [Google Scholar] [CrossRef]
- Hussain, S.Q.; Le, A.H.T.; Mallem, K.; Park, H.; Ju, M.; Cho, J.; Park, J.; Cho, E.; Cho, Y.H.; Kim, Y.; et al. Advanced Light scattering through various textured glass surface morphologies in thin film silicon solar cells. In Proceedings of the 2018 IEEE 7th World Conference on Photovoltaic Energy Conversion (WCPEC) (A Joint Conference of 45th IEEE PVSC, 28th PVSEC & 34th EU PVSEC), Waikoloa, HI, USA, 10–15 June 2018; pp. 3090–3096. [Google Scholar] [CrossRef]
- Das, S.; Kundu, A.; Banerjee, C.; Dey, P.; Datta, S.K.; Saha, H. Front Surface Glass Texturization for Improved Performance of Amorphous Silicon Solar Cell; Springer: Cham, Switzerland, 2014; pp. 375–378. [Google Scholar] [CrossRef]
- Kim, M.S.; Lee, J.H.; Kwak, M.K. Surface texturing methods for solar cell efficiency enhancement. Int. J. Precis. Eng. Manuf. 2020, 21, 1389–1398. [Google Scholar] [CrossRef]
- Peters, M.; Bielawny, A.; Bläsi, B.; Carius, R.; Glunz, S.W.; Goldschmidt, J.C.; Hauser, H.; Hermle, M.; Kirchartz, T.; Löper, P.; et al. Photonic concepts for solar cell. In Physics of Nanostructured Solar Cells; Badescu, V., Paulescu, M., Eds.; Nova Science Publishers: Hauppauge, NY, USA, 2010; pp. 1–41. ISBN 978-1-60876-110-4. [Google Scholar]
- Alqurashi, T.; Alhosani, A.; Dauleh, M.; Yetisen, A.; Butt, H. Laser inscription of pseudorandom structures for microphotonic diffuser applications. Nanoscale 2018, 10, 7095–7107. [Google Scholar] [CrossRef]
- Homma, H.; Kagotani, A.; Moronaga, K.; Murillo-Mora, L.M. Solar Battery Module. US Patent Publication US2011/0186114 A1, 4 August 2011. Available online: https://worldwide.espacenet.com/patent/search?q=pn%3DUS2011186114A1 (accessed on 7 July 2022).
- O’Neill, M.; Ma, J.; Votava, M. Light Redirecting Film Useful with Solar Modules. International Application Published under Patent Cooperation Treaty (PCT) WO2016168164A1, 20 October 2016. Available online: https://worldwide.espacenet.com/patent/search?q=pn%3DWO2016168164A1 (accessed on 7 July 2022).
- Kang, S.; Shin, J. Experimental investigation on the CO2 laser cutting of soda-lime glass. J. Mech. Sci. Technol. 2020, 34, 3345–3351. [Google Scholar] [CrossRef]
- Brusberg, L.; Queisser, M.; Gentsch, C.; Schröder, H.; Lang, K.D. Advances in CO2-Laser Drilling of Glass Substrates. Phys. Procedia 2012, 39, 548–555. [Google Scholar] [CrossRef]
- Zhimalov, A.B.; Solinov, V.F.; Kondratenko, V.S.; Kaplina, T.V. Laser cutting of float glass during production. Glass Ceram. 2006, 63, 9–10. [Google Scholar] [CrossRef]
- Sindhu, I.; Rahman, R.A. Formation of microgrooves on glass and PMMA using low power CO2 laser. J. Optoelectron. Adv. Mater. 2012, 14, 877–884. [Google Scholar]
- Allcock, A.; Dyer, P.E.; Elliner, G.; Snelling, H.V. Experimental observations and analysis of CO2 laser-induced microcracking of glass. J. Appl. Phys. 1995, 78, 7295–7303. [Google Scholar] [CrossRef]
- Lax, M. Temperature rise induced by a laser beam. J. Appl. Phys. 1977, 48, 3919. [Google Scholar] [CrossRef]


| Measured Element | Isc [mA] | Voc [mV] | Im [mA] | Vm [mV] | Pm [mW] | FF [-] | Eff [%] | |
|---|---|---|---|---|---|---|---|---|
| Pair#1 | Reference module #1 | 5.668 | 1.3639 | 5.465 | 1.1594 | 6.336 | 0.82 | 15.84 |
| Modified module #1 | 5.735 | 1.3641 | 5.511 | 1.1592 | 6.388 | 0.817 | 15.97 | |
| Pair#2 | Reference module #2 | 5.797 | 1.3661 | 5.561 | 1.1616 | 6.459 | 0.816 | 16.15 |
| Modified module #2 | 5.885 | 1.3665 | 5.653 | 1.1606 | 6.561 | 0.816 | 16.4 | |
| Pair #1 CTM gain | 0.0670 | 0.0002 | 0.0460 | −0.0002 | 0.0520 | −0.0030 | 0.1300 | |
| Pair #2 CTM gain | 0.088 | 0.000 | 0.092 | −0.001 | 0.102 | 0.000 | 0.250 | |
| Pair #1 CTM relative gain | 1.18% | 0.01% | 0.84% | −0.02% | 0.82% | −0.37% | 0.82% | |
| Pair #2 CTM relative gain | 1.52% | 0.03% | 1.65% | −0.09% | 1.58% | 0.00% | 1.55% | |
Publisher’s Note: MDPI stays neutral with regard to jurisdictional claims in published maps and institutional affiliations. |
© 2022 by the authors. Licensee MDPI, Basel, Switzerland. This article is an open access article distributed under the terms and conditions of the Creative Commons Attribution (CC BY) license (https://creativecommons.org/licenses/by/4.0/).
Share and Cite
Jeremiasz, O.; Nowak, P.; Szendera, F.; Sobik, P.; Kulesza-Matlak, G.; Karasiński, P.; Filipowski, W.; Drabczyk, K. Laser Modified Glass for High-Performance Photovoltaic Module. Energies 2022, 15, 6742. https://doi.org/10.3390/en15186742
Jeremiasz O, Nowak P, Szendera F, Sobik P, Kulesza-Matlak G, Karasiński P, Filipowski W, Drabczyk K. Laser Modified Glass for High-Performance Photovoltaic Module. Energies. 2022; 15(18):6742. https://doi.org/10.3390/en15186742
Chicago/Turabian StyleJeremiasz, Olgierd, Paweł Nowak, Franciszek Szendera, Piotr Sobik, Grażyna Kulesza-Matlak, Paweł Karasiński, Wojciech Filipowski, and Kazimierz Drabczyk. 2022. "Laser Modified Glass for High-Performance Photovoltaic Module" Energies 15, no. 18: 6742. https://doi.org/10.3390/en15186742
APA StyleJeremiasz, O., Nowak, P., Szendera, F., Sobik, P., Kulesza-Matlak, G., Karasiński, P., Filipowski, W., & Drabczyk, K. (2022). Laser Modified Glass for High-Performance Photovoltaic Module. Energies, 15(18), 6742. https://doi.org/10.3390/en15186742