Article

Reliability Evaluation of Smart Substation Based on Time-Varying Probabilistic Hybrid Attack Graph

1
School of Automation, Central South University, Changsha 410083, China
2
Hunan Zhongda Design Institute Co., Ltd., Changsha 410205, China
*
Author to whom correspondence should be addressed.
Energies 2022, 15(18), 6724; https://doi.org/10.3390/en15186724
Submission received: 11 August 2022 / Revised: 3 September 2022 / Accepted: 8 September 2022 / Published: 14 September 2022

Abstract

:
A substation is the portion of a power grid that forms a link between the cyber system and the physical system. Reliability evaluation of smart substations based on a time-varying probabilistic hybrid attack graph (TVPHAG) is studied in this paper. First, the topology network of the smart substation is established, whose attributes are represented by probability. Then, in order to solve the problem of asynchrony in the cyber-physical system and the hybrid caused by heterogeneity, time-varying state equation in topology and cuts in algebra are introduced to TVPHAG. Based on TVPHAG, the evaluation of the reliability of cyber-physical systems with multiple equipment and multiple timescales is established. On this basis, the influences of physical conditions, cyberattacks, physical attacks, and cyber-physical attacks on substations are analyzed, respectively. Finally, the simulation shows that the method is effective in evaluating the reliability of smart substations, providing a new method for the evaluation of reliability.

1. Introduction

The modern power grid is developing toward the cyber-physical power system (CPPS), which coordinates the cyber system and the physical power system [1]. A substation is the portion of a power grid that forms a link between the cyber system and the physical system. The cyber system monitors the state of the physical system and then sends real-time control information to the physical system [2,3]. The process is time-varying because of the asynchrony on the control system and interdependence between the cyber-physical system [4,5]. The cascading failure of the power grid has caused several incidents around the world, such as the large-scale blackout in Ukraine caused by a deliberate cyberattack in 2015 [6], the blackout in Israel in 2016 [7], and the blackout in Venezuela in 2019. The cyberattack may destroy the transient stability of the power grid through cross-space spreading, thus breaking the physical system, causing large-scale power outages [8,9], and even inducing power grid splitting [10]. Therefore, the reliability assessment of smart substations is of great importance.
Attack graph is a technology of security assessment. The possibility of attack paths can be calculated through the causality among attack steps [11]. Attack graphs can be used to identify network vulnerabilities and evaluate the safety of the system [12,13]. The reliability of substations is affected by physical equipment [14], and attack graphs are also used to identify hazards of physical conditions [15], such as risk assessment of power distribution equipment [16] and assessment of the status of the power grid attacked [17], etc.
To avoid the spread of risks between the cyber system and the physical system, one approach is to establish a model of interdependence using complex network theory to abstract the power grid and cyber grid into a stochastic network [18,19].
However, those papers ignore the complex coupling between them. In order to obtain quantitative results, the attack tree theory was used for vulnerability analyses and security assessments of SCADA (supervisory control and data acquisition system) [20,21,22].
Then, a quantifiable method combined with CVSS (Common Vulnerability Scoring System) was proposed. With the help of the Bayesian network, the method solved the problems of lacking quantification, lacking confidence, and lacking readability in the attack graph [23]. The Bayesian network was proposed to study the probability of cascading failures and their consequences of cyberattacks [24,25,26] and to trace the complete path of attacks [27].
The above papers have put forward probabilistic methods for the reliability evaluation of smart substations. However, being limited to static characteristics, they have difficulty capturing the time-varying and dynamic relationships of components and systems. Then a hierarchical Bayesian model was proposed, which achieved dynamic reliability evaluation by integrating historical data and real-time data [28], but it was not suitable for cyber-physical systems. In [29,30], the Bayesian network was used to track the complete path of attacks, which caused a cascading failure in the order of vulnerability on the network, host authority, and executor sequence. Taking probability and coupling into consideration, the model was used to study the relevance between the transition of system state and attack interval. Petri net was also used in the modeling of cyber-physical systems to figure out vulnerability cascade propagation [31,32]. Being used as a substation fault diagnosis method, it incorporates time sequence and probabilistic features and obtains the diagnosis results with the help of failure information [33]. However, the above methods were essentially used to study the time-invariant dynamic response under attack, ignoring the asynchrony and reconstruction of the network in a cascading failure process. The discrete-time state-space model provides another method for solving problems in the time domain [34]. However, so far, the research has usually established a linear time-invariant model of system state. Although it is applicable for physical conditions [35], cyberattacks [36], and Gaussian noise [37], it still fails to solve time-varying problems.
In addition, current research often ignored the complex time-varying coupling inside the substation. Some papers tried to study interdependence by using correlation matrices, but they only considered the one-to-one correspondence between the two layers to establish a 0–1 logical matrix [38]. The Petri net has the ability to analyze internal situations of substations, while it is a post-mortem diagnosis method, which requires the alarm information at the time of failure as a basis [39]. Some scholars have tried to use the artificial neural network (ANN) to evaluate its reliability. However, due to difficulties in obtaining fault samples and the lack of confidence [40], it is necessary to analyze the coupling between equipment inside the substation.
Aiming to solve the problem of poor practicability on reliability evaluation, this paper proposes a time-varying probabilistic hybrid attack graph and its generation algorithm. The method takes the cyber-physical conditions and the hybrid coupling of the substation into consideration, and it abstracts the equipment as a vertex to establish the attack graph based on the structure of the smart substation. Considering the timeliness of transmission in the network, the established model reflects asynchrony and reconstruction of the network and then infers the dynamic changes in the reliability of each piece of equipment and the substation. The simulations of TVPHAG illustrate the characteristics of physical conditions, cyberattacks, physical attacks, and cyber-physical attacks, which provides guidance for ensuring the safety of substations.

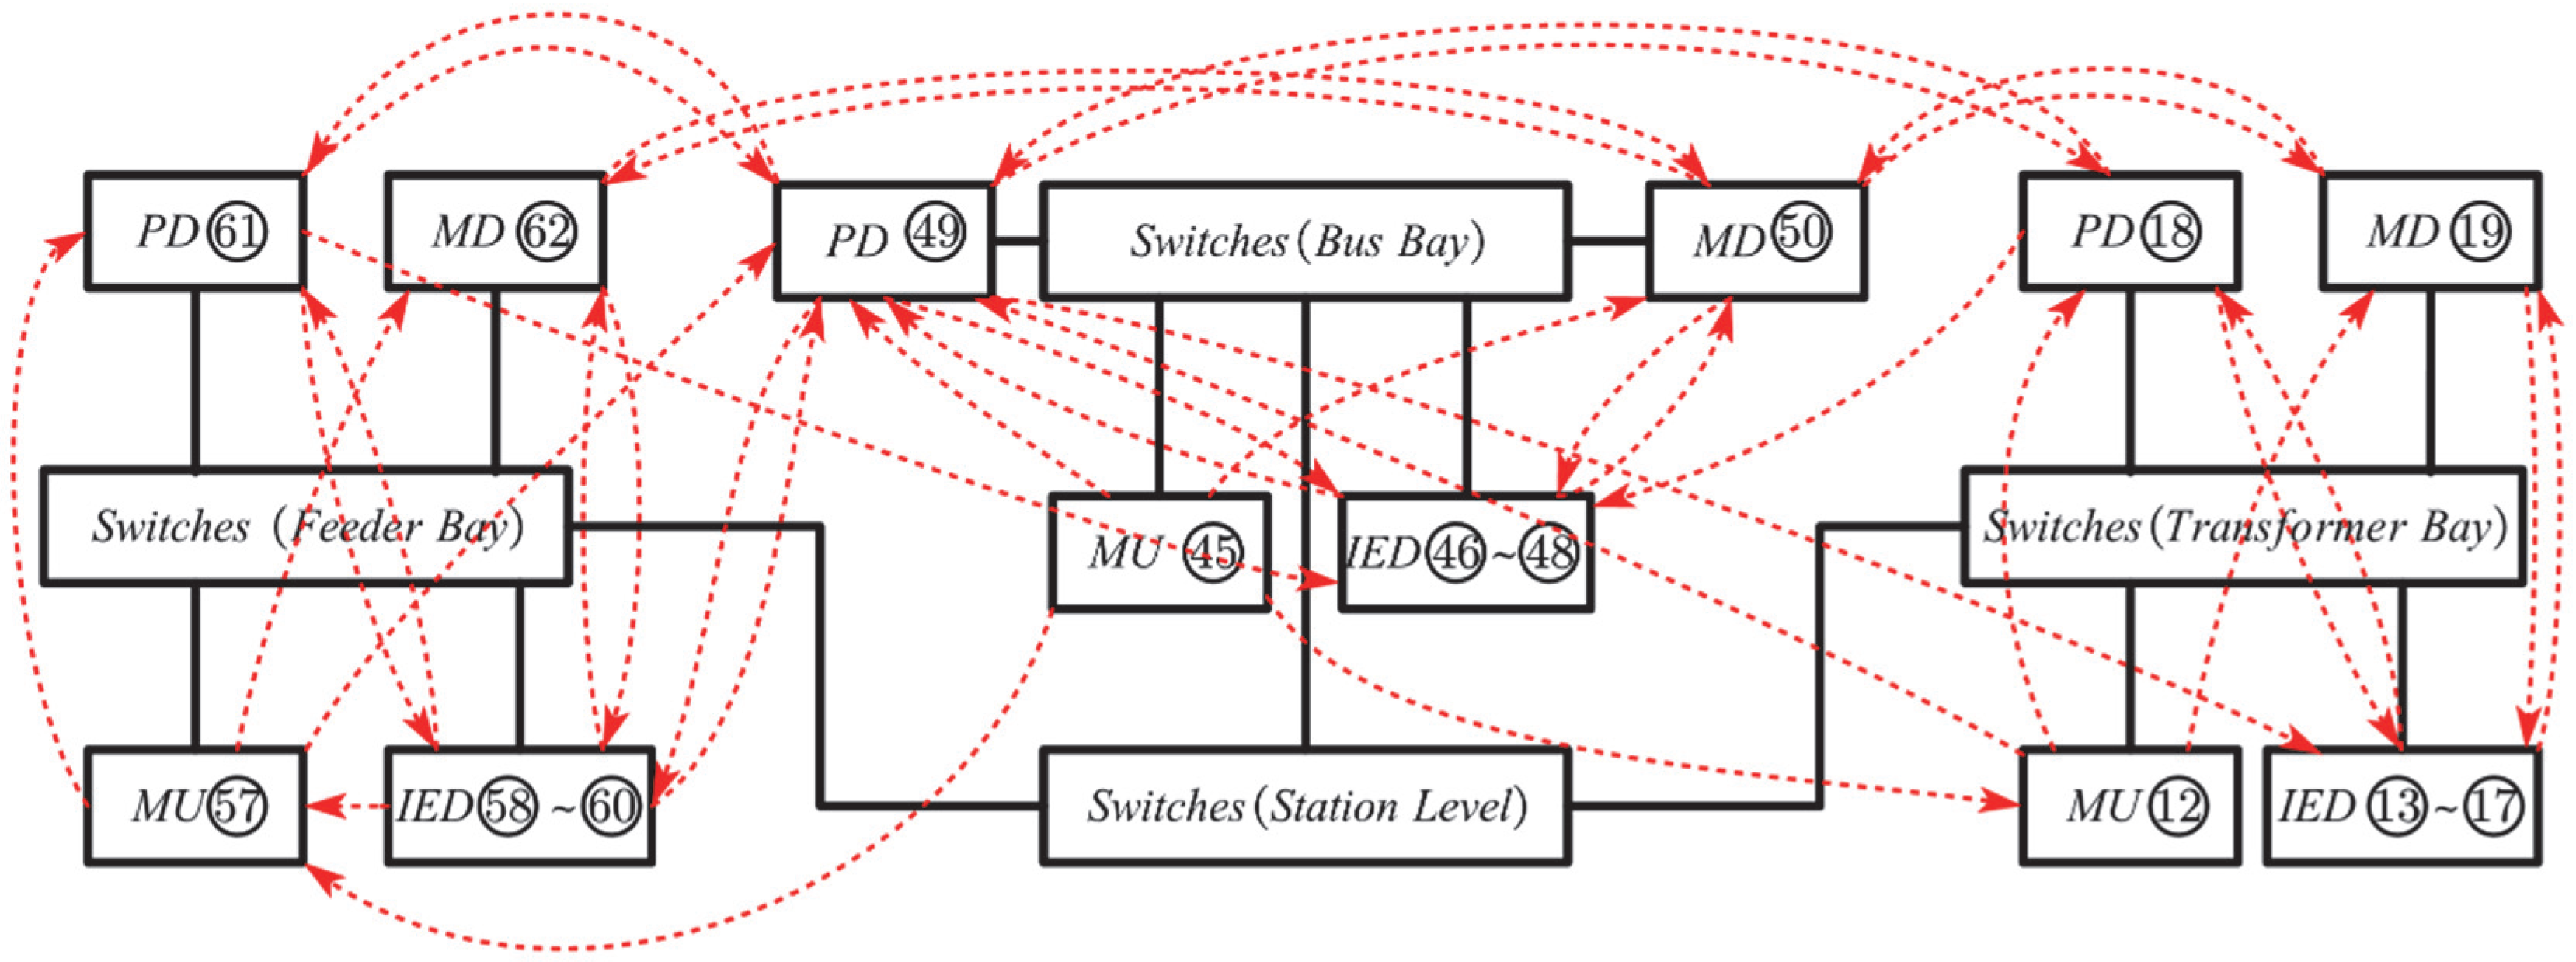
2. Definition and Description of TVPHAG

This paper proposes the time-varying probabilistic hybrid attack graph (TVPHAG), whose vertices and edges will be explained by probability weighing. The model is suitable for smart substations with heterogeneous components, dynamics, and asynchronous behaviors. Moreover, the evaluation for each vertex in the grid is proposed. The definition and algorithm of TVPHAG G ( V , E , α , T ) are given as follows:

2.1. Establishment of Network

TVPHAG is a directed graph whose topology is determined by V , E .
The set of vertices is defined as:
{ V = V e V C V e = { v 1 e , v 2 e v i e v M e } V C = { v 1 c , v 2 c v j c v N c }
In Equation (1), V represents the set of all vertices in TVPHAG, where V e represents the set of vertices of equipment, and V c represents the set of vertices of consequence. v i e represents equipment, with a total of M . v j c represents the consequences of cascading failures, with a total of N .
The set of edges is defined as:
{ E = E A E B E A = { e i , j A | v i e V e , v j e V e } E B = { e k , r B | v k e V e , v r c V c }  
In Equation (2), e k , r represents a directed edge v k , v r . E is the set of directed edges with coupling between vertices, i.e., the set of paths of spread.
The geometric topology of TVPHAG is established through the following rules: (1) The messages and instructions on the secondary side are directed from the previous level to the next level; (2) The secondary equipment points to the primary equipment controlled by it; (3) The primary equipment points to the measuring equipment, (4) Other couplings between the equipment; (5) The primary equipment with abnormality points to the corresponding consequences.

2.2. Establishment of Parameter

The parameter of TVPHAG includes α , T , where:
The vector of the device’s attribute is defended as:
α = [ α 1 , α 2 α i α M ] T   , α i [ 0 , 1 ]
f : V e { α i }   , f ( v i e ) = α i  
In Equation (3), α i represents the self-triggering probability of the vertex of equipment v i in TVPHAG, i.e., the probability of equipment spontaneously failing, which is affected by operating conditions, working years, and other factors.
In Equation (4), → represents the mapping from the left set to the right set, f represents the mapping function. The mapping of V e { α i } is a one-to-one correspondence, i.e., a bijection.
The matrix of the directed edge is defined as:
  T = [ A   B ]   ,   A = [ 0 β 2 , 1 A β M , 1 A β 1 , 2 A 0 β M , 2 A β i , j A β 1 , M A β 2 , M A 0 ]   ,   B = [ β 1 , 1 B β 2 , 1 B β M , N B β 1 , 2 B β 2 , 2 B β M , 2 B β k , r B β 1 , N B β 2 , N B β M , N B ] , β k , r [ 0 , 1 ]
g : E { β k , r }   , g ( e i , j A ) = β i , j A   , g ( e k , r B ) = β k , r B
In Equation (5), β k , r is defined as the triggering probability. A is defined as the matrix of probability that faults are triggered by other vertices, whose element β i , j A represents the probability that v i e causes v j e a malfunction ( v i e V e ,   v j e V e ). The element β k , r B in the matrix B represents the probability of v k e causing v r c a malfunction ( v k e V e ,     v r c V e ).
In Equation (6), g is the mapping relationship between the sets formed by elements in T and sets E A and E B , which is a bijection.
In this paper, the MTTF (Mean Time To Failure) λ of equipment is used as the self-triggering probability α . However, the conditions of the substation and equipment are different. The influence of temperature, operating years, precipitation, loading rate, etc., should be considered. The above factors are set as independent variables of Ω = [ ω 1 ( )   ω 2 ( y )   ω 3 ( m m )   ω 4 ( % ) ] , and the relative failure probability is recorded as F ( Ω ) = F ( f 1 ( ω 1 ) , f 2 ( ω 2 ) , f 3 ( ω 3 ) , f 4 ( ω 4 ) ) . According to the big data on equipment failure, the following relationship is obtained [41]:
{ f 1 ( ω 1 ) = 6.7463 × 10 5 ω 1 2 0.0011 ω 1 + 0.0192 f 2 ( ω 2 ) = 0.02576 × ( 1.1861 ) ω 2 f 3 ( ω 3 ) = 0.1306 ω 3 + 0.0148 f 4 ( ω 4 ) = { 0.0066   ( 0 < ω 4 36 ) 0.46 ω 4 0.159   ( 36 < ω 4 150 )
Those factors, viz. temperature, operating years, precipitation, and loading rate, should be calculated respectively for reliability because of different weights. According to technical standards and actual operating conditions of power equipment, such information is collected for the preparation of calculation. The correction coefficient F of λ is calculated by Equation (8):
F ( Ω ) = i = 1 4 f i ( ω i ) f i ( ω i * )
where ω i * ( i = 1 , 2 , 3 , 4 ) are the reference, contributing to vector Ω * = [ ω 1 *   ω 2 *   ω 3 *   ω 4 * ] = [ 15   6   10   50 ] , which is selected according to the statistical data. The MTTF is replaced by λ j = F ( Ω j ) × λ j . Finally, the self-triggering probability can be described as α e = F · α e , F = [ F ( Ω 1 ) , F ( Ω 2 ) F ( Ω ) ] T .

2.3. Analysis of the Spread of Faults

Abnormal data or actions are accompanied by abnormal states of the equipment. In TVPHAG, the probability of failure changes as the abnormal state spreads through the equipment. The spread of state is asynchronous due to the delay of physical equipment’s action, information transmission, data sampling, etc. The process is analyzed as follows:
According to the standard of IEC61850, all messages of smart substation are divided into seven categories according to the time range of transmission. The main information flow of the process layer is GOOSE, SV, and synchronization messages. The transmission time of the secondary message [42] and the response time of the primary device [43] are given below and shown in Table 1 and Table 2:
The transfer of the device’s state has a delay caused by the period of sampling, transmission, and processing of messages and the action of the equipment. In TVPHAG, it is manifested as the delay of the failure cascading. Therefore, TVPHAG is a dynamic directed graph with asynchrony. Figure 1 shows a simple TVPHAG, which can be divided into multiple subgraphs according to the period of delay. In this paper, the transmission mechanism of failure probability is represented by matrices A and B . Through the above analyses, matrices A and B are time-varying.
Through the above methods, the reliability of equipment and bays can be calculated and expressed as a probability, and then the loss-of-load probability (LOLP) of the substation can be calculated according to the connection relationship and operation mode of each bay. LOLP is defined as expected losses of load per unit.

2.4. Algorithm of TVPHAG

The failure probability of equipment x n is influenced by the following factors: the equipment spontaneously transfers to an abnormal state with the probability α n ; the equipment state is affected by other equipment with the probability m R ( n ) x m × β m , n . Where m R ( n ) , R ( n ) represents the set of the entering edge of v n . x m represents the failure probability of v m .
Therefore, the failure probability of v n is obtained as Equation (9):
x n = α n + m R ( n ) x m × β m , n
A discrete-time system is established by discretizing time. x i ( k ) represents the failure probability of v i at time k . Equation (9) is extended to all vertices in sets V e and V c and expressed in matrix forms in Equations (10) and (13):
[ x 1 ( k + 1 ) x 2 ( k + 1 ) x M ( k + 1 ) ] = [ α 1 α 2 α M ] + [ 0 β 2 , 1 A β M , 1 A β 1 , 2 A 0 β M , 2 A β 1 , M A β 2 , M A 0 ] [ x 1 ( k ) x 2 ( k ) x M ( k ) ]
[ y 1 ( k ) y 2 ( k ) y N ( k ) ] = [ β 1 , 1 B β 2 , 1 B β M , N B β 1 , 2 B β 2 , 2 B β M , 2 B β 1 , N B β 2 , N B β M , N B ] [ x 1 ( k ) x 2 ( k ) x M ( k ) ]
According to Equations (10) and (11), the smart substation is modeled as a multi-variable discrete-time linear time-invariant system.
x ( k + 1 ) = α + A x ( k )
y ( k ) = B x ( k )
The vector x is iteratively updated in the process of calculation, which means the equipment turns to a new state after physical equipment actions, information transmission, and data sampling. Each iteration is the update cycle of device status, which is related to sampling action time and path length. The TVPHAG proposed in this paper considers the heterogeneity of various equipment and the asynchrony of action response, so the dynamic matrix of state update is time-varying, and its establishment method is introduced in Section 2.3. Analysis of the spread of faults. Based on the original model, it is further modeled as a multi-variable discrete-time linear time-varying system:
x ( k + 1 ) = α + A ( k ) x ( k )
y ( k ) = B ( k ) x ( k )
With the iterative calculation, vector x is continuously updated until it is of convergence. This paper gives the condition of convergence without proof [44]: the spectral radius ρ ( A ( k ) ) = m a x { | λ i | } < 1 , where λ i is the eigenvalue of the matrix A ( k ) .
In terms of physical attacks or cyberattacks on the substation, which cause an abnormal state of the equipment, the elements of the attack vector u ( k ) = [ u 1 ( k )   u 2 ( k ) u m ( k ) ] are formed with the attack strength, where u i ( k ) [ 0 , 1 ] represents the probability of the attack causing an abnormal state of the equipment at time k . For the physical attack, the energy intensity applied or caused by attacks is used to evaluate the failure probability. Considering the voltage level of the equipment, the current determines the hazard levels. The current caused by the direct lightning strike can reach 40 kA, and the current caused by short-circuit of the line can reach 1 kA. It is believed that the direct lightning will cause a failure, then u i ( k ) = 1 / 40   at the situation of short-circuit. Cyberattacks are divided into three categories according to the purpose, i.e., destroying availability, integrity, and confidentiality of information. The value of u i ( k ) is determined by the type and intensity of the cyberattack. In particular, u i ( k ) = 1 represents that the attack will definitely cause an abnormal state of the equipment v i e , while u i ( k ) = 0 represents no attack.
The matrix C ( k ) is established by the wiring of the substation, the load of the incoming and outgoing lines, and the operation mode. Finally, the multi-variable discrete-time linear time-invariant model of the smart substation is established in Figure 2 and Equation (16).
{ x ( k + 1 ) = A ( k ) x ( k ) + α + u ( k ) y ( k ) = B ( k ) x ( k ) z ( k ) = C ( k ) y ( k )
where x ( k ) m represents the vector of failure probability; y ( k ) n represents the vector of consequences of bays; z ( k ) represents the reliability of substations, i.e., LOLP; u ( k ) m represents the cyber-physical attack on the substation, and matrices A , B , C are dynamic matrices.

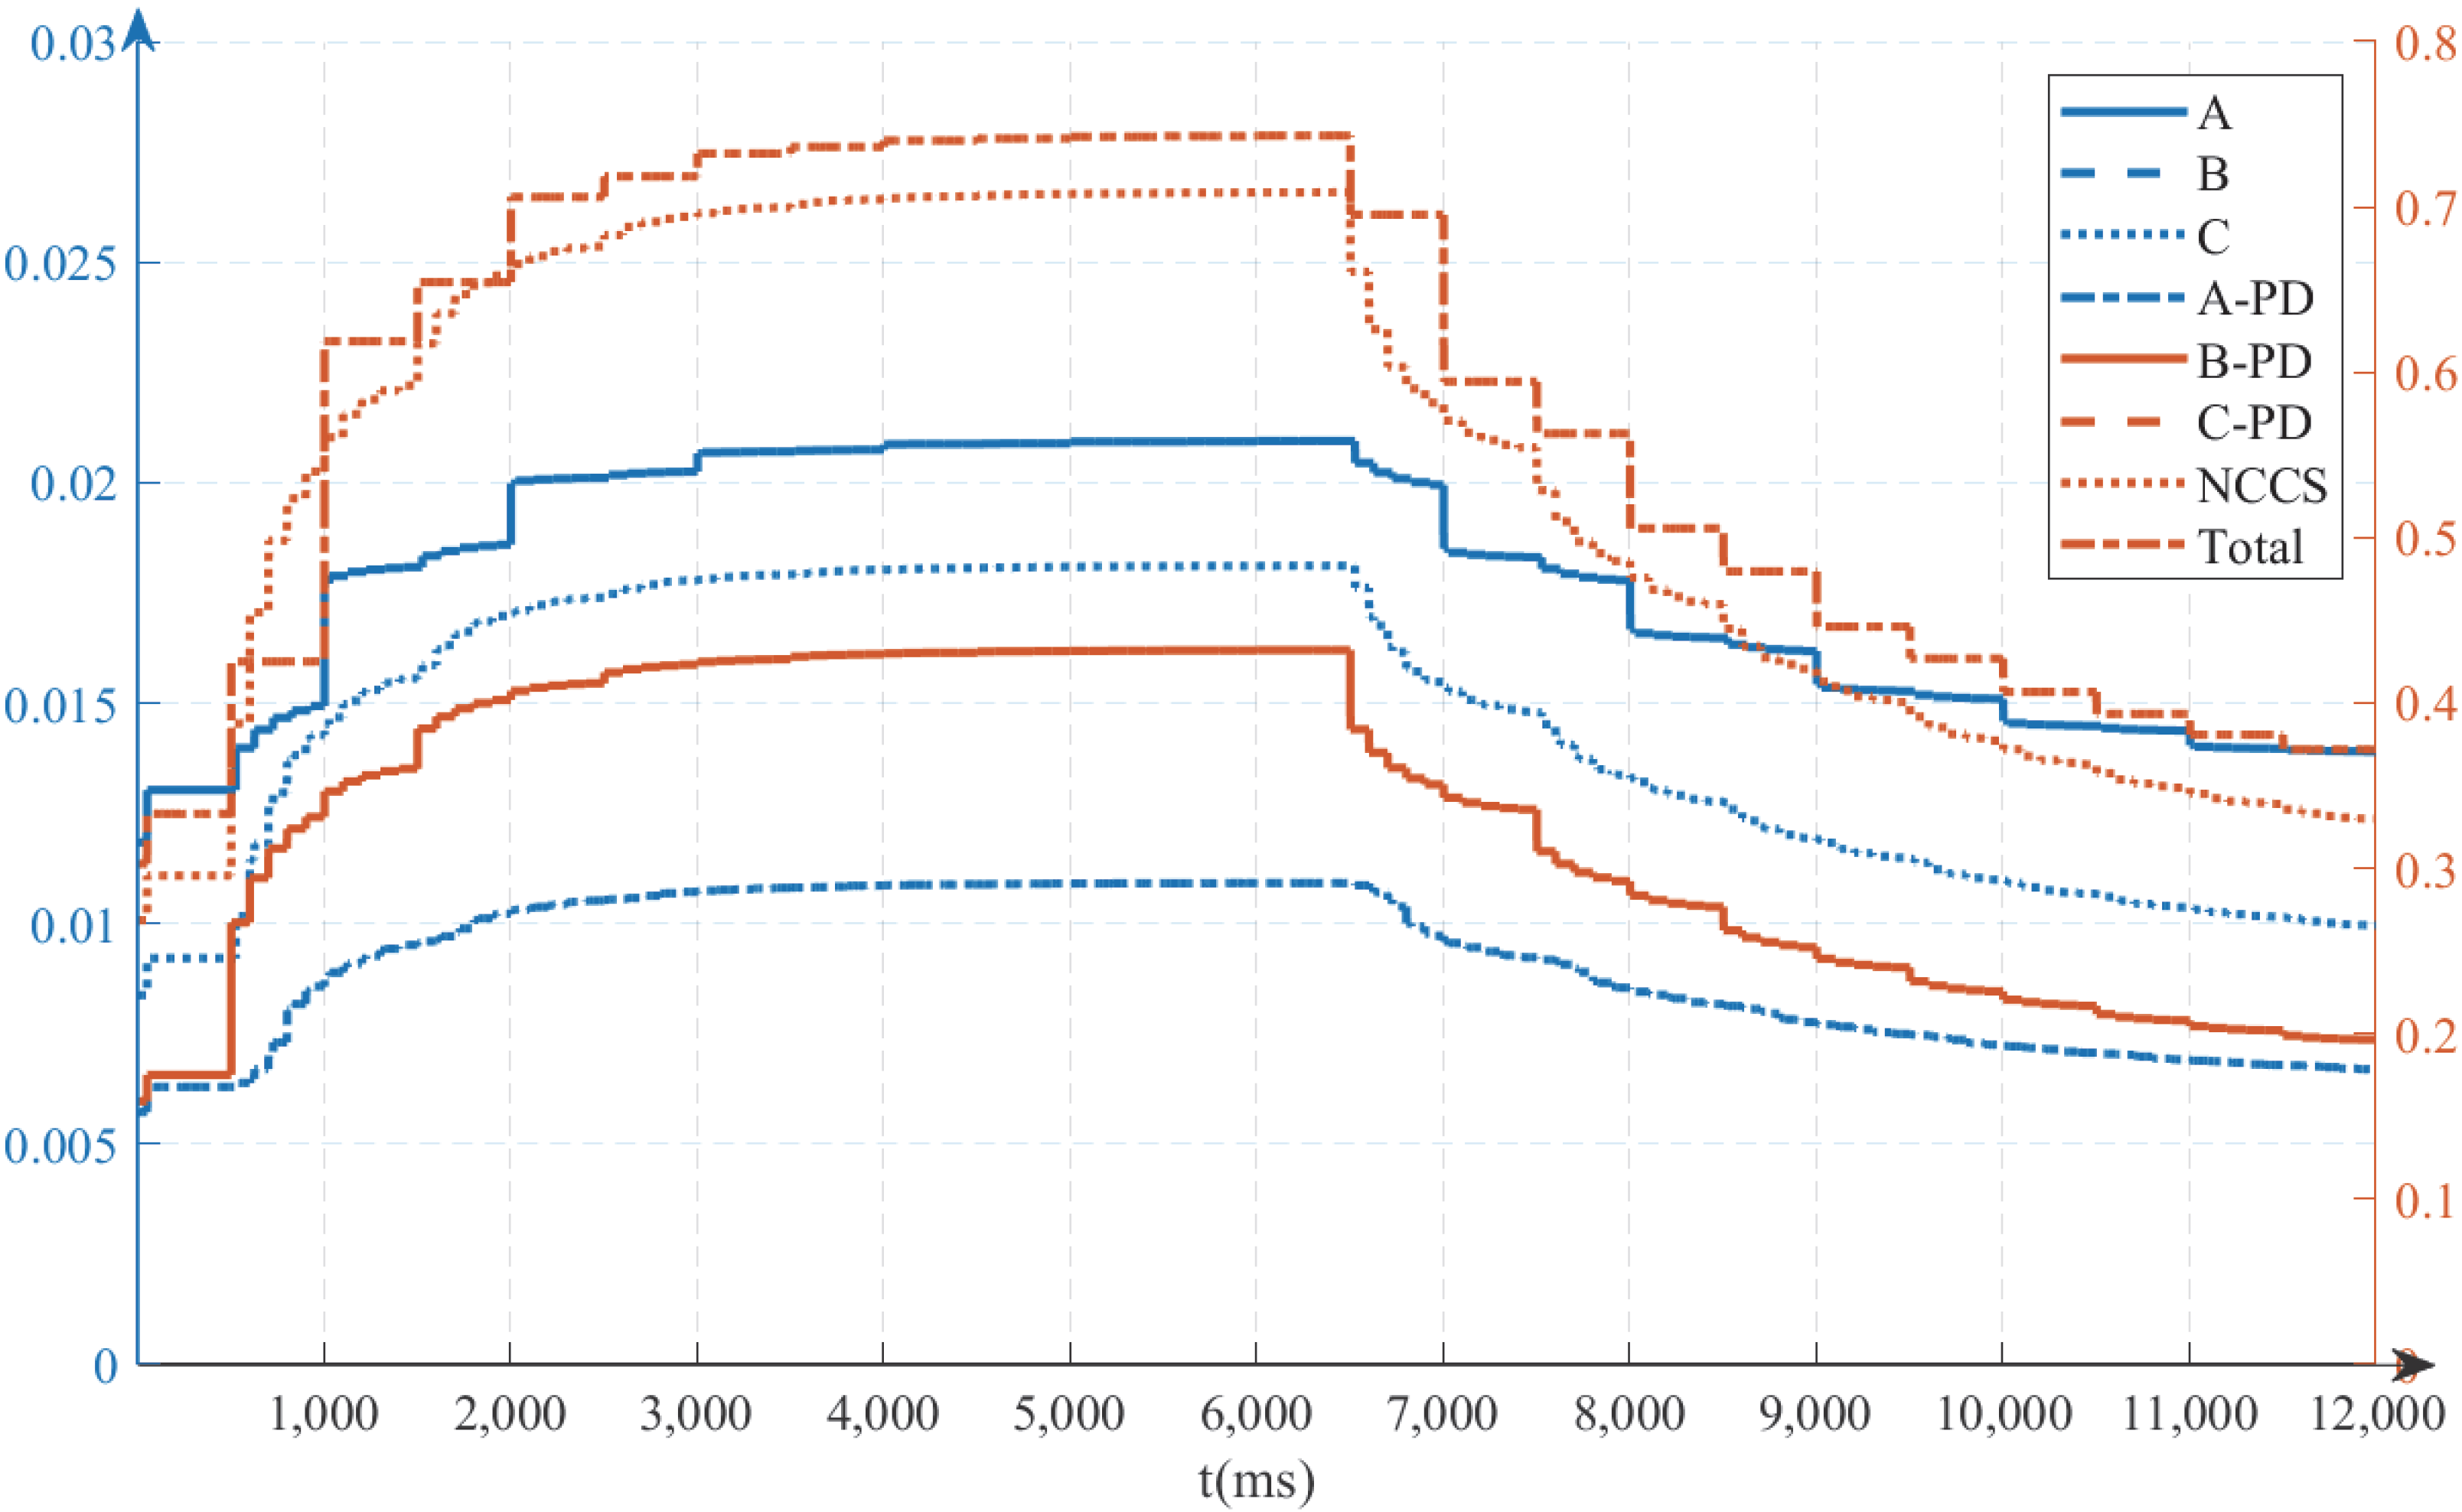
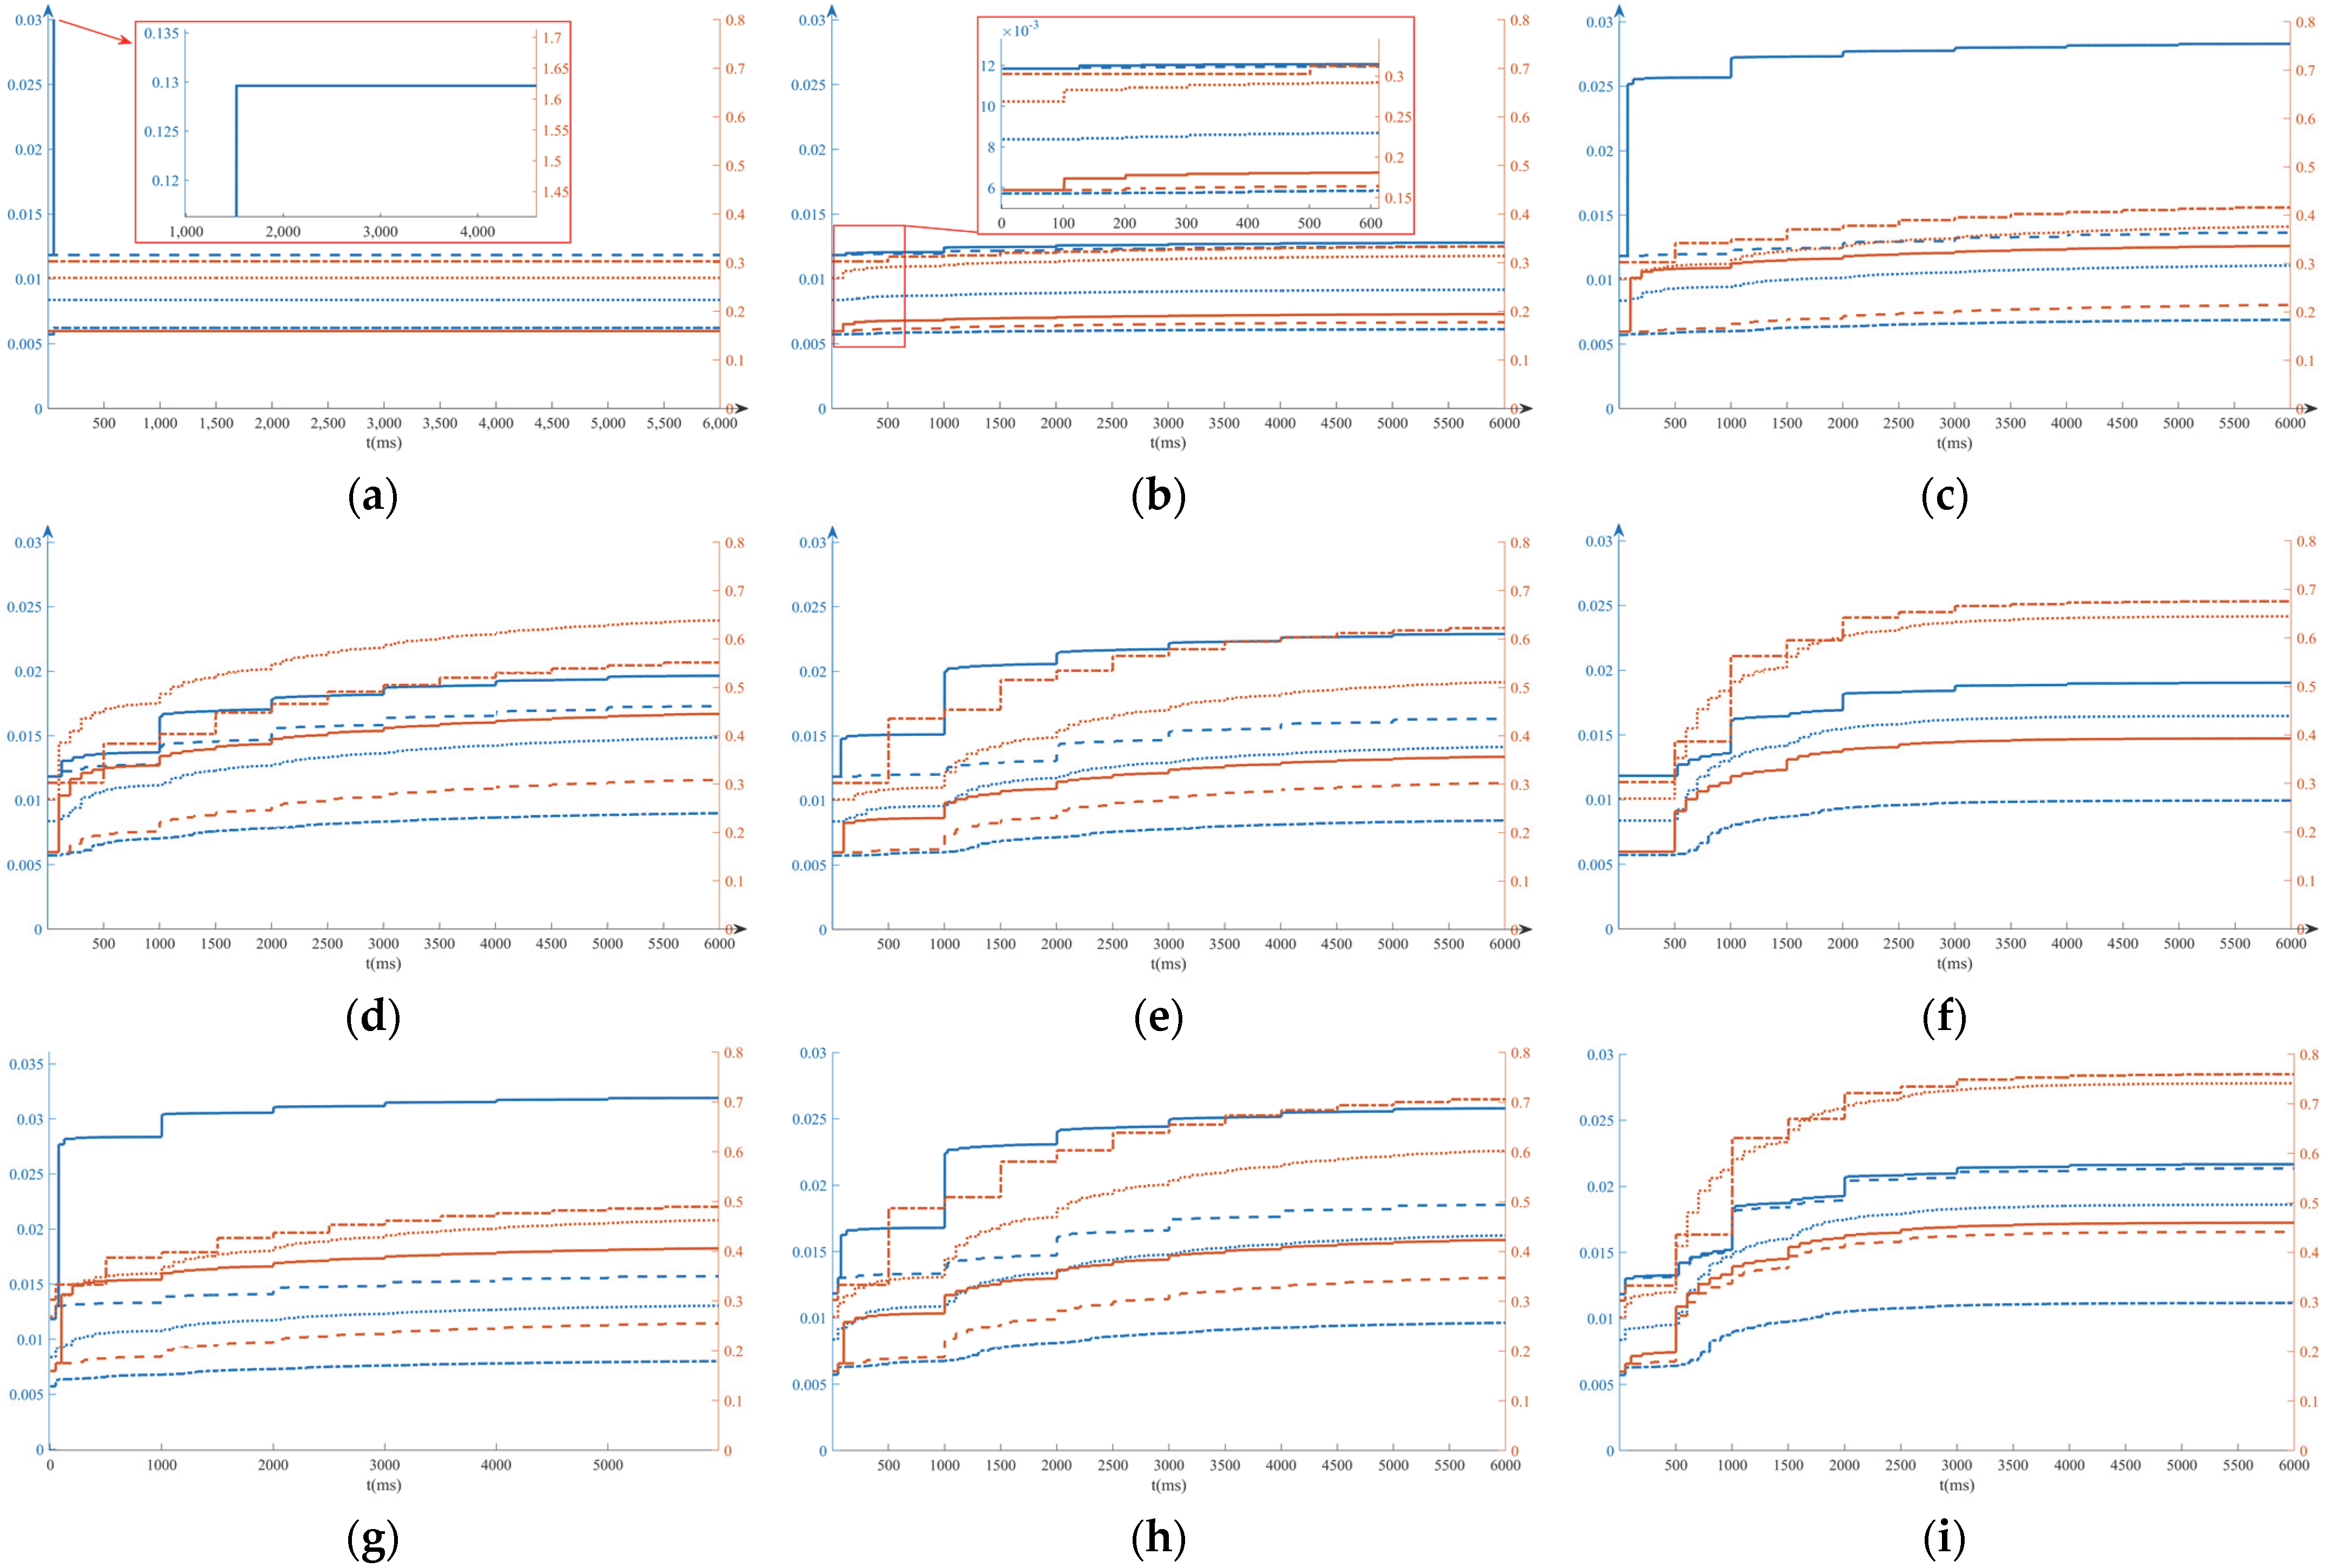
3. Results and Case Study of TVPHAG

The D2-1 smart substations in IEC 61,850 presently have been built more, including transformer bays, bus bays, and feeder bays. The primary equipment includes primary power equipment such as buses, transformers, circuit breakers (CB), disconnect switches (DS), and electronic voltage current transformers (VCTs). The secondary equipment includes the merging unit (MU), the intelligent electronic device (IED), the protection device (PD) and the measurement and control device (MD), switches, Network Control Center Server (NCCS), and other equipment [45]. The secondary system can be divided into three levels, viz., station level, bay level, and process level. This paper takes the D2-1 110 kV smart substation as an example. It has 2 SSZ10—40,000/110 main transformers with a total capacity of 2 × 40 MVA, with 110 kV sectionalized configuration, 2 incoming and outgoing lines, etc. Its topology is shown in Figure 3, where A and B are transformer bays, C is a bus bay, D and E are feeder bays, and the same type of bays has the same structures and configurations.
TVPHAG is established according to the above analyses of the primary and secondary equipment of the smart substation. Figure 3 and Figure 4 show the corresponding equipment of some vertices, and the other equipment can be expanded by their consistency. The vertices of the equipment and consequences of TVPHAG are distinguished by circles and squares in Figure 5. The description of vertices in Figure 5 is shown in Table 3.
The self-triggering probability α i is defined as MTTF λ , and shown in Table 4 [46,47]:
This paper firstly discusses the influence of β . According to the spectral radius of the matrix A ( k ) , the convergence condition of the established model is calculated, that is, β < 0.135 . Moreover, the result is shown in Figure 6.
According to the coupling and wiring of each bay of the substation, the formula of LOLP is shown as:
P L o s s = i { A , B } y i × y C × 0.5 × 1 ( p . u . ) + i { C , D } y i × 0.5 ( p . u . )
In Equation (17), the function y A × y C × 0.5 × 1 represents that the bay of A and bay of bus get failures, and the probability of working on any one of the buses is equal. In this case, all loads are lost, which can be changed in accordance with the actual operations of the substation. The function y C × 0.5 represent the bay of C that gets failures, and the load of any one of the feeder bays is equal.
The probability of failure increases with the increase in β . The simulation is shown in Figure 6. Two cases are simulated in this paper. One case is that β is a constant value, and the other is that β is evenly distributed around the constant value. The failure probability of the system increases exponentially and rapidly when β > 0.12 . Therefore, the situation that β > 0.12   should be avoided. In practical engineering, β is related to the degree of connection relationships between equipment. In this study, β = 0.12 is selected for the particularity.
  • Static features:
To get a clearer picture of the impact of physical conditions, it is assumed that the primary equipment on bays E and D with a loading rate of 80%, and the other conditions are reference values. According to Equations (9) and (10), the correction coefficient F = 2.9437 , that is, the MTTF of vertex v 20 ~ v 29 . v 63 ~ v 68 is λ = 2.9437 × λ .
According to Table 2 and Table 3, in the case of this paper, the delay of processes includes 1 ms, 3 ms, 10 ms, 20 ms, 25 ms, 100 ms, 500 ms, and 1000 ms. According to the delay of switching on states, eight attack graphs are established on the same time scale. These graphs are all subgraphs of the TVPHAG established above.
Comparing the two situations where the loading is at a reference and over 80% of it, the result of primary equipment in bay E and bay D is shown in Figure 7. The darker bar represents the situation of reference. In contrast, the lighter bar represents the situation where the loading exceeds reference.
The comparison is shown in Figure 7. Under the high load of primary equipment with only interval E and interval D, the failure probability of the bay whose equipment is in a harsh condition increases a lot, and other bays also see relatively small increases. The cause is that the anomalous data obtained by sampling is injected into other bays, which may lead to anomalies. The improvement in the E bay is much smaller than that of the B bay because the B bay has more primary equipment and is connected in series. From the above results in Figure 7, operating conditions of physical equipment have a greater impact on this bay. The impact on other bays is relatively limited.
The LOLP under different physical conditions is recorded in Table 5. Considering that the physical conditions of substations do not change drastically, the factors are set to deviate from the reference value by 10% and 20%. The impact of precipitation is relatively small; the high temperature promotes a more rapid increase in hazards. LOLP increases proportionally with the increase in loading rates and operating years. The result verifies the correctness of the model.
  • Dynamic features
The vertex 75 of TVPHAG is attacked from t = 50 ms to t = 6000 ms by simulation. The results of bay A, bay B, bay C, PD, MD, and NCCS are shown in Figure 8. The failure probability increases rapidly within 2s after the attacks’ arrival. The response of each device has a delay after the attack is applied or removed because the transition between the normal state and the abnormal state requires time to transfer and process.
The failure probability reaches more than 80% of the increased value within 2 s after the vertex is attacked, while it takes 4 s to drop to 20% of the increased value after the attack is removed. The simulation is in line with the phenomenon that is easy to damage while hard to recover.
During the followed simulation of TVPHAG, continuous physical attacks, cyberattacks, and cyber-physical attacks are respectively applied and analyzed. The main equipment and bays viz., bay A, bay B, bay C, PD, MD, and NCCS, are observed and analyzed.
Figure 9 shows the failure probability of the simulation that attacks arrive at t = 50 ms. Various delays such as sampling and transmission of processing, actions of equipment, etc.
Several main indexes are selected in this paper as indicators, including the failure probability of the bay where the attack is located, the mean failure probability of other bays, and LOLP. The critical time is selected to indicate corollary, that is, 50 ms (initial state), 500 ms, 1000 ms (rise rapidly), and 6000 ms (stable). The result is shown in Table 6.
As for the physical attacks, the attack on the measuring equipment, such as a C/VT, has the characteristics of small influence range, fast action, and little hazard. The attack on important primary equipment such as CB will cause direct failures of this bay and greatly increase LOLP while having little impact on other bays.
Compared with physical attacks, the transmission of cyberattacks on substations is more complicated, causing larger hazards both on range and time. The failure probability of the secondary equipment is significantly improved, which can also spread across bays. At the same time, it has the possibility of affecting the servers in the station and spreading to other power stations. Compared with the attack on the bay layer, the attack on the access layer mainly affects the primary and secondary equipment of the bay while threatening the cyber system of the whole station less. Compared with attacks on the station layer, the attack on the bay layer is more harmful to this bay and less threatening to other bays, so abnormal states often appear on this line.
The cyber-physical attack has the characteristics of both physical attacks and cyberattacks. Due to the complex transmission of the TVPHAG, the abnormality of one device may cause an abnormality in other equipment. Therefore, under cyber-physical attack, the failure probability is mutually coupled and superimposed. The TVPHAG can reveal the relationship between system risks and attacks and its dynamic trends.

4. Discussion

This paper proposes the TVPHAG, which discretizes the state of the system. The model constructs a one-to-one mapping between the availability of the equipment/bay and nodes of TVPHAG. Based on the internal correlation of the system, the subgraphs of TVPHAG are established by the time scale of equipment transmission. The model solves the problem of asynchrony in the cyber-physical system and the phenomenon of confounding caused by heterogeneity and dynamically evaluates the reliability of the system.
The contribution of this paper exists in the following aspects: on the one hand, a smart substation is a complex network with cyber and physical equipment, including complex data flows and connection of the equipment, facing threats of cyber-physical attacks. By expressing uncertainty in probabilities, TVPHAG adapts to this complex network and simulates the cascade propagation process. On the other hand, due to the delay of state transfer, time-varying state equations in topology and cuts in algebra are introduced to TVPHAG. Combined with graph theory and algebra, it overcomes the insufficiency caused by only analyzing static networks in current research and helps to analyze the state of complex systems over time. In addition, being different from diagnosis, TVPHAG does not require information after the occurrence of faults, while it can evaluate the reliability of the system by using the basic information of the system’s equipment and professional data in the field. On this basis, the research’s conclusions on substation reliability can provide a reference for future substation construction and upgrade planning and designing.
There are several aspects worth studying in the future. (1) The method deals with systems as linear dynamics. Many device processes are linear or can be linearized, while some cannot be handled by linearization. Designing nonlinearity is a direction for future work. (2) The method deals with the association relationship based on messages. In actual production, the message has more characteristics due to different objects and types. Establishing more specific characteristics for more types of equipment and messages is one direction to improve reliability. (3) The failure transmission probability data needs to be supported by many experiments or big data, and this aspect is still thin at present.

Author Contributions

Conceptualization, W.W. and Z.L.; methodology, W.W. and Z.L.; software, W.W.; validation, W.X.; formal analysis, W.W.; investigation, R.D.; resources, Z.L.; data curation, R.D.; writing—original draft preparation, W.W.; writing—review and editing, W.W.; visualization, R.D. and W.X.; supervision, Z.L.; project administration, W.W.; funding acquisition, Z.L. All authors have read and agreed to the published version of the manuscript.

Funding

This research was funded by the Fundamental Research Funds for the Central Universities of Central South University.

Data Availability Statement

The data presented in this study are available on request from the corresponding author.

Acknowledgments

Thanks are due to Sijie Shao, of Central South University, for the help in testing.

Conflicts of Interest

The authors declare no conflict of interest.

References

  1. Adamiak, M.; Baigent, D.; Mackiewicz, R. IEC 61850 Communication Networks and Systems in Substations: An Overview for Users; University of Illinois at Urbana: Champaign, IL, USA, 2009. [Google Scholar]
  2. Ahmad, T.; Senroy, N. An Information Theoretic Approach to Power-Substation Level Dynamic State Estimation with Non-Gaussian Noise. IEEE Trans. Power Syst. 2020, 35, 1642–1645. [Google Scholar] [CrossRef]
  3. Bagen, B.; Huang, D.G.; Fattal, K. Enhanced probabilistic approach for substation reliability assessment. IET Gener. Transm. Distrib. 2019, 13, 2488–2495. [Google Scholar] [CrossRef]
  4. Buldyrev, S.V.; Parshani, R.; Paul, G.; Stanley, H.E.; Havlin, S. Catastrophic cascade of failures in interdependent networks. Nature 2010, 464, 1025–1028. [Google Scholar] [CrossRef] [PubMed]
  5. Cai, B.P.; Kong, X.D.; Liu, Y.H.; Lin, J.; Yuan, X.B.; Xu, H.Q.; Ji, R.J. Application of Bayesian Networks in Reliability Evaluation. IEEE Trans. Ind. Inform. 2019, 15, 2146–2157. [Google Scholar] [CrossRef]
  6. Dai, Q.S.; Shi, L.B.; Ni, Y.X. Risk Assessment for Cyberattack in Active Distribution Systems Considering the Role of Feeder Automation. IEEE Trans. Power Syst. 2019, 34, 3230–3240. [Google Scholar] [CrossRef]
  7. Duan, D.; Wu, X.; Deng, H. Reliability Evaluation in Substations Considering Operating Conditions and Failure Modes. IEEE Trans. Power Deliv. 2012, 27, 309–316. [Google Scholar] [CrossRef]
  8. Falodiya, K.; Das, M.L. Security Vulnerability Analysis using Ontology-based Attack Graphs. In Proceedings of the 2017 14th IEEE India Council International Conference (INDICON), Roorkee, India, 15–17 December 2017; pp. 1–5. [Google Scholar] [CrossRef]
  9. Al Ghazo, A.T.; Ibrahim, M.; Ren, H.; Kumar, R. A2G2V: Automatic Attack Graph Generation and Visualization and Its Applications to Computer and SCADA Networks. IEEE Trans. Syst. Man Cybern. Syst. 2020, 50, 3488–3498. [Google Scholar] [CrossRef]
  10. Hawrylak, P.J.; Haney, M.; Papa, M.; Hale, J. Using hybrid attack graphs to model cyber-physical attacks in the Smart Grid. In Proceedings of the 2012 5th International Symposium on Resilient Control Systems, Salt Lake City, UT, USA, 14–16 August 2012; pp. 161–164. [Google Scholar] [CrossRef]
  11. Holm, H.; Ekstedt, M.; Andersson, D. Empirical Analysis of System-Level Vulnerability Metrics through Actual Attacks. IEEE Trans. Dependable Secur. Comput. 2012, 9, 825–837. [Google Scholar] [CrossRef]
  12. Huang, K.; Zhou, C.; Qin, Y.; Tu, W. A Game-Theoretic Approach to Cross-Layer Security Decision-Making in Industrial Cyber-Physical Systems. IEEE Trans. Ind. Electron. 2020, 67, 2371–2379. [Google Scholar] [CrossRef]
  13. Huang, K.; Zhou, C.; Tian, Y.C.; Yang, S.; Qin, Y. Assessing the Physical Impact of Cyberattacks on Industrial Cyber-Physical Systems. IEEE Trans. Ind. Electron. 2018, 65, 8153–8162. [Google Scholar] [CrossRef]
  14. James, K.R. Convergence of matrix iterations subject to diagonal dominance. SIAM J. Numer. Anal. 1986, 10, 117–132. [Google Scholar] [CrossRef]
  15. Kirrmann, H.; Dzung, D. Selecting a Standard Redundancy Method for Highly Available Industrial Networks. In Proceedings of the IEEE International Workshop on Factory Communication Systems, Turin, Italy, 28–30 June 2006; pp. 386–390. [Google Scholar] [CrossRef]
  16. Lanotte, R.; Merro, M.; Munteanu, A.; Vigano, L. A Formal Approach to Physics-based Attacks in Cyber-physical Systems. ACM Trans. Priv. Secur. 2020, 23, 1–41. [Google Scholar] [CrossRef]
  17. Law, Y.W.; Alpcan, T.; Palaniswami, M. Security Games for Risk Minimization in Automatic Generation Control. IEEE Trans. Power Syst. 2015, 30, 223–232. [Google Scholar] [CrossRef]
  18. Lei, H.; Singh, C.; Sprintson, A. Reliability Modeling and Analysis of IEC 61850 Based Substation Protection Systems. IEEE Trans. Smart Grid 2014, 5, 2194–2202. [Google Scholar] [CrossRef]
  19. Li, C.; Qing, G.; Li, P.; Yin, T. Operational Risk Assessment of Distribution Network Equipment Based on Rough Set and D-S Evidence Theory. J. Appl. Math. 2013, 2013, 263905. [Google Scholar] [CrossRef]
  20. Mabunda, N.; Bokoro, P.; Nicolae, D. Statistical analysis of operating times of high voltage SF6 circuit breakers. In Proceedings of the 2016 IEEE 16th International Conference on Environment & Electrical Engineering, Florence, Italy, 7–10 June 2016. [Google Scholar] [CrossRef]
  21. Meyur, R. A Bayesian Attack Tree Based Approach to Assess Cyber-Physical Security of Power System. In Proceedings of the 2020 IEEE Texas Power and Energy Conference (TPEC), College Station, TX, USA, 6–7 February 2020; pp. 1–6. [Google Scholar] [CrossRef]
  22. Obychaiko, D.S.; Shikhin, V.A.; Chrysostomou, G. Reliability Analysis of Cyber-Physical Systems. In Proceedings of the 2018 International Conference on Industrial Engineering, Applications and Manufacturing (ICIEAM), Moscow, Russia, 15–18 May 2018; pp. 1–6. [Google Scholar] [CrossRef]
  23. Oyewole, P.A.; Jayaweera, D. Power System Security with Cyber-Physical Power System Operation. IEEE Access 2020, 8, 179970–179982. [Google Scholar] [CrossRef]
  24. Peng, R. Reliability of Interdependent Networks with Cascading Failures. Eksploat. Niezawodn. Maint. Reliab. 2018, 20, 273–277. [Google Scholar] [CrossRef]
  25. Sahu, A.; Davis, K. Structural Learning Techniques for Bayesian Attack Graphs in Cyber Physical Power Systems. In Proceedings of the 2021 IEEE Texas Power and Energy Conference (TPEC), College Station, TX, USA, 2–5 February 2021; pp. 1–6. [Google Scholar] [CrossRef]
  26. Shi, X.; Li, Y.; Cao, Y.; Tan, Y. Cyber-physical electrical energy systems: Challenges and issues. CSEE J. Power Energy Syst. 2015, 1, 36–42. [Google Scholar] [CrossRef]
  27. Da Silva, A.M.L.; Violin, A.; Ferreira, C.; Machado, Z.S. Probabilistic Evaluation of Substation Criticality Based on Static and Dynamic System Performances. IEEE Trans. Power Syst. 2014, 29, 1410–1418. [Google Scholar] [CrossRef]
  28. Soltan, S.; Mittal, P.; Poor, H.V. Line Failure Detection After a Cyber-Physical Attack on the Grid Using Bayesian Regression. IEEE Trans. Power Syst. 2019, 34, 3758–3768. [Google Scholar] [CrossRef]
  29. Soltan, S.; Yannakakis, M.; Zussman, G. React to Cyber Attacks on Power Grids. IEEE Trans. Netw. Sci. Eng. 2019, 6, 459–473. [Google Scholar] [CrossRef]
  30. Sundararajan, A.; Khan, T.; Moghadasi, A.; Sarwat, A.I. Survey on synchrophasor data quality and cybersecurity challenges, and evaluation of their interdependencies. J. Mod. Power Syst. Clean Energy 2019, 7, 449–467. [Google Scholar] [CrossRef]
  31. Wisniewski, R. Design of Petri Net-Based Cyber-Physical Systems Oriented on the Implementation in Field Programmable Gate Arrays. Energies 2021, 14, 7054. [Google Scholar] [CrossRef]
  32. Yin, X.; Li, L.; Liu, Q. A Study on the Vulnerability Cascade Propagation of Integrated Energy Systems in the Transportation Industry Based on the Petri Network. Energies 2022, 15, 4320. [Google Scholar] [CrossRef]
  33. Gong, L.; Ma, R.; Yang, H.J.; He, Y. The substation fault diagnosis method based on the time constraint probability Petri net. In Proceedings of the 2015 5th International Conference on Electric Utility Deregulation and Restructuring and Power Technologies (DRPT), Changsha, China, 26–29 November 2015; pp. 1142–1146. [Google Scholar] [CrossRef]
  34. Vellaithurai, C.; Srivastava, A.; Zonouz, S.; Berthier, R. CPIndex: Cyber-Physical Vulnerability Assessment for Power-Grid Infrastructures. IEEE Trans. Smart Grid 2015, 6, 566–575. [Google Scholar] [CrossRef]
  35. Wang, H.; Chen, Z.; Zhao, J.; Di, X.; Liu, D. A Vulnerability Assessment Method in Industrial Internet of Things Based on Attack Graph and Maximum Flow. IEEE Access 2018, 6, 8599–8609. [Google Scholar] [CrossRef]
  36. Wang, L.; Qu, Z.; Li, Y.; Hu, K.; Sun, J.; Xue, K.; Cui, M. Method for Extracting Patterns of Coordinated Network Attacks on Electric Power CPS Based on Temporal–Topological Correlation. IEEE Access 2020, 8, 57260–57272. [Google Scholar] [CrossRef]
  37. Xiang, Y.; Wang, L.; Liu, N. Coordinated attacks on electric power systems in a cyber-physical environment. Electr. Power Syst. Res. 2017, 149, 156–168. [Google Scholar] [CrossRef]
  38. Yang, J.; Guo, Y.; Guo, C.; Chen, Z.; Wang, S. Cross-Space Risk Assessment of Cyber-Physical Distribution System Under Integrated Attack. IEEE Access 2021, 9, 149859–149869. [Google Scholar] [CrossRef]
  39. Zhao, D.; Wang, Y.; Song, Y. Petri Net Based Intelligent Substation Fault Diagnosis. In Proceedings of the 2019 IEEE 3rd Conference on Energy Internet and Energy System Integration (EI2), Changsha, China, 8–10 November 2019; pp. 794–799. [Google Scholar] [CrossRef]
  40. Zeng, Z.G.; Zio, E. Dynamic Risk Assessment Based on Statistical Failure Data and Condition-Monitoring Degradation Data. IEEE Trans. Reliab. 2018, 67, 609–622. [Google Scholar] [CrossRef]
  41. Hao, S.; Zhang, J.; Liu, S.; Wang, D.; Huang, C. Power equipment reliability evaluation based on data mining. In Proceedings of the 2015 5th International Conference on Electric Utility Deregulation and Restructuring and Power Technologies (DRPT), Changsha, China, 26–29 November 2015; pp. 699–703. [Google Scholar] [CrossRef]
  42. Zhang, Y.; Wang, L.; Sun, W. Trust System Design Optimization in Smart Grid Network Infrastructure. IEEE Trans. Smart Grid 2013, 4, 184–195. [Google Scholar] [CrossRef]
  43. Zhao-Yang, Q.; Ya-Ying, L.; Peng, L. A network security situation evaluation method based on D-S evidence theory. In Proceedings of the 2010 The 2nd Conference on Environmental Science and Information Application Technology, Wuhan, China, 17–18 July 2010; pp. 496–499. [Google Scholar] [CrossRef]
  44. Zhao, Y.; Huang, L.; Smidts, C.; Zhu, Q. Finite-horizon semi-Markov game for time-sensitive attack response and probabilistic risk assessment in nuclear power plants. Reliab. Eng. Syst. Saf. 2020, 201, 106878. [Google Scholar] [CrossRef]
  45. Zhou, X.; Yang, Z.; Ni, M.; Lin, H.; Li, M.; Tang, Y. Analysis of the Impact of Combined Information-Physical-Failure on Distribution Network CPS. IEEE Access 2020, 8, 44140–44152. [Google Scholar] [CrossRef]
  46. Lee, J.C.; McCormick, N.J. Appendix C: Some Failure Rate Data. In Risk and Safety Analysis of Nuclear Systems; John Wiley & Sons: Hoboken, NJ, USA, 2011. [Google Scholar] [CrossRef]
  47. Hajian-Hoseinabadi, H. Reliability and component importance analysis of substation automation systems. Int. J. Electr. Power Energy Syst. 2013, 49, 455–463. [Google Scholar] [CrossRef]
Figure 1. A simple example of TVPHAG.
Energies 15 06724 g001
Figure 2. Multi-variable discrete-time linear time-invariant model of smart substation.
Energies 15 06724 g002
Figure 3. The message flow of smart substation.
Energies 15 06724 g003
Figure 4. Topology of D2-1 smart substation.
Energies 15 06724 g004
Figure 5. TVPHAG of D2-1 smart substation.
Energies 15 06724 g005
Figure 6. The failure probability as the increase in β .
Energies 15 06724 g006
Figure 7. Failure probability under high and low loading rates.
Energies 15 06724 g007
Figure 8. Dynamic change of failure probability after the attack.
Energies 15 06724 g008
Figure 9. Dynamic diagram of failure probability of multi-type attack. (a) CB (bay A) is attacked, (b) transformer (bay A) is attacked, (c) CB-IED (bay A) is attacked, (d) MU (bay A) is attacked, (e) MD (bay A) is attacked, (f) NCCS is attacked, (g) transformer (bay A) and CB-IED (bay A) are attacked, (h) transformer (bay A) and MD (bay A) are attacked, (i) transformer (bay A) and NCCS are attacked.
Energies 15 06724 g009
Table 1. Typical response delay of the primary equipment.
CategoryNameRequirements of Delay Time
1aFast message—trip P 1   1 :   10   ms ,   P 2   2 : 3 ms
1bFast message—otherP1: 100 ms, P2: 20 ms
2Medium-speed message100 ms
3Low-speed message500 ms
4Raw data/
5File transfer1000 ms
6Synchronization message10 ms
7Command messageCat 7 = Cat 3, downloading = Cat 1
1  P1: Feeder bay; 2  P2: General bay or no specific requirements.
Table 2. Response delay of the primary equipment.
CategoryDelay Time
Circuit breakerOpen25 ms
Closing100 ms
Disconnect switch1000 ms
Current/voltage transfer(C/VT)1 ms
Table 3. The description of vertices in Figure 5.
CategoryLabelCorrespondence
Vertices of
Consequence
A, BTransformer bay
CBus bay
D, EFeeder bay
Vertices of
Equipment
1–4,20–23,39–41,51–53,63–65C/VT
5,24,Bus
6,25,Transformer
7–9,26–28,43,44,54,55,66,67DS
10,11,29,30,42,56,68CB
12,31,45,57,69MU
13–17,32–36,46–48,58–60,70–72IED
18,37,49PD
19,38,50MD
75Telecontrol NCCS
76Communication NCCS
Table 4. Reliability data of equipment.
Equipment λ ( y e a r 1 )
PD0.0067
MD0.0067
IED0.0050
MU0.0200
NCCS0.0699
Transformer300 kVA–10 MVA0.0059
> 10 MVA0.0153
CB0–600 V0.0042
> 600 V0.0096
Bus0.0012
DS0.0061
C/VT0.0049
Table 5. LOLP on different physical conditions.
DeviationTemperatureAgePrecipitationLoad
−20%0.562%0.524%0.551%0.520%
−10%0.570%0.548%0.568%0.547%
00.575%
10%0.585%0.605%0.582%0.603%
20%0.627%0.638%0.590%0.630%
Table 6. Record table of critical time probability of multi-type attacks (unit: %).
Time(ms)The Bay AttackedAverage of Other BaysLOLP
Case 505001000600050500100060005050010006000
A1.18412.9612.9612.960.7880.7880.7880.7880.5720.6220.6220.622
B1.2051.2071.280.8020.8070.8440.5820.5880.612
C2.5662.5672.8290.8170.8280.9530.5850.60.689
D1.3581.371.9650.9030.9431.2440.6550.7020.898
E1.5081.512.2890.8210.8331.1740.5820.5980.844
F---0.8671.1091.4790.5720.7790.992
G2.8342.8363.1910.9140.9321.1080.6560.6780.800
H1.6741.6792.5780.9170.9361.3380.6510.6740.963
I1.3261.5182.1670.8821.1731.5470.6400.8751.118
Publisher’s Note: MDPI stays neutral with regard to jurisdictional claims in published maps and institutional affiliations.

