Abstract
Capacity loss over time is a critical issue for lithium-ion batteries powering battery electric vehicles (BEVs) because it affects vehicle range and performance. Driving cycles have a major impact on the ageing of these devices because they are subjected to high stresses in certain uses that cause degradation phenomena directly related to vehicle use. Calendar capacity also impacts the battery pack for most of its lifetime with a capacity degradation. The manuscript describes experimental tests on a lithium-ion battery for electric vehicles with up to 10% capacity loss in the WLTP CLASS 3B driving cycle. The lithium-ion battery considered consists of an LMO-NMC cathode and a graphite anode with a capacity of 63 Ah for automotive applications. An internal impedance variation was observed compared to the typical full charge/discharge profile. Incremental capacitance (IC) and differential voltage (DV) analysis were performed in different states of cell health. A lifetime model is described to compute the total capacity loss for cycling and calendar ageing exploiting real data under some different scenarios of vehicle usage.
1. Introduction
Global demand for batteries is expected to increase 14 times by 2030, and the EU could account for 17% of that demand; this is mainly driven by the rise of the digital economy, renewable energy and low carbon mobility. The increase in electric vehicles using batteries will make this market a strategic one at the global level. At least 30 million zero-emission electric vehicles are forecasted to be on EU roads by 2030. While electric cars are expected to significantly decrease greenhouse gas emissions, their batteries are harmful to the environment [1]. However, since today the dependence on oil and gas imports is still very high, just remember the increase in prices due to the conflict in Ukraine [2], the transition to a zero-emission economy will need to be combined with other energy vectors like hydrogen.
Due to the increasing popularity of electric and hybrid vehicles, there has been great interest in the use of lithium-ion batteries. Certainly, excellent characteristics such as high-power density, high energy efficiency, excellent durability, and the ability to work efficiently for partial states of charge (SoC) without the need for continuous full charging have made them particularly attractive. Nevertheless, the energy storage system is the main critical system in an electric powertrain; indeed, the battery pack design still represents an important challenge for Electric Vehicles (EVs) in terms of safety, reliability and system integration. For instance, overloading of the Lithium-ion battery during adverse driving conditions can cause thermal runaway leading to serious fire hazards [3,4]. Thus, thermal management of the Lithium-ion battery pack is crucial [5]. Moreover, the battery is subjected to ageing as the effect of continuous charging and discharging cycles during its use. Similarly, the driver’s driving style can age battery packs differently such us a ranged driving style with a higher frequency of power peaks than a cautious driving style [6].
This will inevitably trigger an ageing process with the result of a loss of power and capacity that will progressively decrease over time.
In recent years, several studies have been carried out to evaluate the ageing of lithium-ion batteries. The two main degradation processes are SEI thickening at the anode during the battery cycling [7,8] and deformation (volume change) and fracture/crack of electrode materials caused by diffusion-induced stresses during cycling, which can result in short circuits that render electrode active materials incapable of storing Lithium-ion [9,10,11].
In [12], an important analysis of main ageing mechanisms occurring at anode, cathode, electrolyte and their interfaces is done with particular attention to carbonaceous anodes and some metal oxides cathodes, such as lithium manganese and lithium nickel-cobalt oxides. The paper describes the correlation of the causes (C-rate, temperature, DoD etc.) with various physical and chemical phenomena, which are the reasons for performance degradation (capacity reduction, power fade, impedance variation). In particular, is underlined the importance of temperature, both at a high and low value, as an accelerating factor of ageing.
An interesting and cited graphical synthesis, which summarize all the ageing mechanism inside a lithium battery, can be found in [13]. Therein, all the various degradation phenomena are clustered into three macro effects called degradation modes, which are respectively Loss of Lithium Inventory (LLI), Loss of Active Material of the Negative Electrode (LAMNE), and Loss of Active Material of Positive Electrode (LAMPE).
In the case of LLI, some lithium ions become no longer available for charge/discharge processes due to parasitic reactions (i.e., Solid Electrolyte Interphase (SEI) growth, decomposition, lithium plating). The effect is a capacity fade but also, in the case of film growth, a power fade. In LAMNE and LAMPE, active masses, useful for lithium ion insertion respectively in charge and discharge processes, become not useful due to particle cracking, loss of electrical contact, blocking of active sites, and structural disordering; these processes happen in both the anode and cathode leading to capacity fade and power fade.
In [14], after an introduction of the main ageing mechanism affecting anode and cathode materials, two main types of ageing mechanisms were identified; calendar ageing, regarding the periods in which the battery is unused, and cycle ageing, related to the application of the battery in real cases.
In [15], a calendar and cycle ageing analysis are presented in terms of capacity fade and resistance increase for Lithium-ion cells from different manufacturers. The cells were subjected to both calendar and cycle ageing, varying SoC and temperature in the former case and C-rate, DoD and temperature in the latter case; it is found that the temperature is the main parameter that affects the capacity fade and resistance increases for both calendar and cycle ageing [16]. However, identifying the ageing of an electrochemical cell is particularly difficult to understand due to its non-linear dependence on charge rate, state-of-charge and temperature [17]. In this regard, an interesting representation of the link between causes and effects in terms of ageing (evaluated with two main macro effects: capacity fade and power fade) has been presented [13]. Here the main ageing factors are identified in time, temperature, SoC level, current, stoichiometry and mechanical stress. All the causes bring different physical and chemical phenomena, with various contributions, going from SEI growth and decomposition (time, high T and SoC, current), electrolyte decomposition (high T and SoC), lithium plating and dendrite formation (low T and SoC, stoichiometry), until loss of electric contact (mechanical stress and low SoC) and corrosion of current collector (low SoC). The relations between causes and effect extracted are represented in Table 1.
Table 1.
Lithium-ion batteries ageing mechanisms.
The degradation of lithium-ion batteries is identified by two main factors, capacity loss and peak power reduction; these phenomena are connected to physical and chemical processes contributing to lithium-ion battery ageing. The most important are chemical and thermal processes.
Chemical failure mechanisms include SEI formation, electrolyte decomposition and reduction, binder decomposition, active material dissolution, and loss of lithium inventor; these mechanisms depend on several factors, such as cell and components manufacture, cell layout inside the battery pack, and so on. Thermal problems are mainly related to the use of cells outside the characteristics identified by the manufacturer, lack of monitoring controls, poor cell construction, and lack of a control system [14,18,19].
Most of the above-discussed literature is focused on the investigation of degradation mechanisms under calendar or ideal cycle ageing involving standard full charge-discharge profiles. On the other hand, there is a lack of studies on the ageing mechanism induced by a real scenario, such as automotive application.
The investigation conducted with driving cycles that simulate the real application can provide valuable information for the evaluation of ageing phenomena, providing guidance in selecting the best performing battery for the desired application. The work focuses on studying the degradation mechanisms of a commercial battery used for automotive applications, by incremental capacity (IC) and differential voltage (DV) analysis. The Lithium-ion battery considered in this paper consists of an LMO-NMC cathode and a graphite anode because it offers good performance compared with other chemistries, such as LiFePO4, mainly used in stationary applications [20,21].
Since using a driving cycle of a real vehicle would have given information limited to that type of vehicle and the driver’s driving style, it was chosen to use the WLTP CLASS 3B driving cycle; this cycle is mainly used to determine the pollutant levels, CO2 emissions and fuel consumption of conventional and hybrid cars, as well as the range of all-electric light-duty vehicles. The driving cycle imposed on the electrochemical cells under test was not accelerated from the point of view of temperature or current; however, the cell was subjected to continuous driving cycles without adhering to the calendar ageing times; this allowed the test times to be reduced from 8 years to only 18 months, including the time needed to perform parametric checks; this strategy, as agreed with the authors, drastically reduced the necessary ageing time of the cell under test with the consideration that calendar ageing can be estimated from real calendar tests for the same type of electrochemical cell found in the literature (commercial graphite/LMO-NMC lithium-ion cells) at different temperatures and SOC. The test time, excluding calendar ageing, was called test years. In this paper is presented a study devoted to the investigation of the degradation mechanism induced by a standard driving cycle, and to the definition of a mathematical model able to estimate the overall capacity loss as an effect of combined cycle and calendar ageing.
The methods used are summarized below:
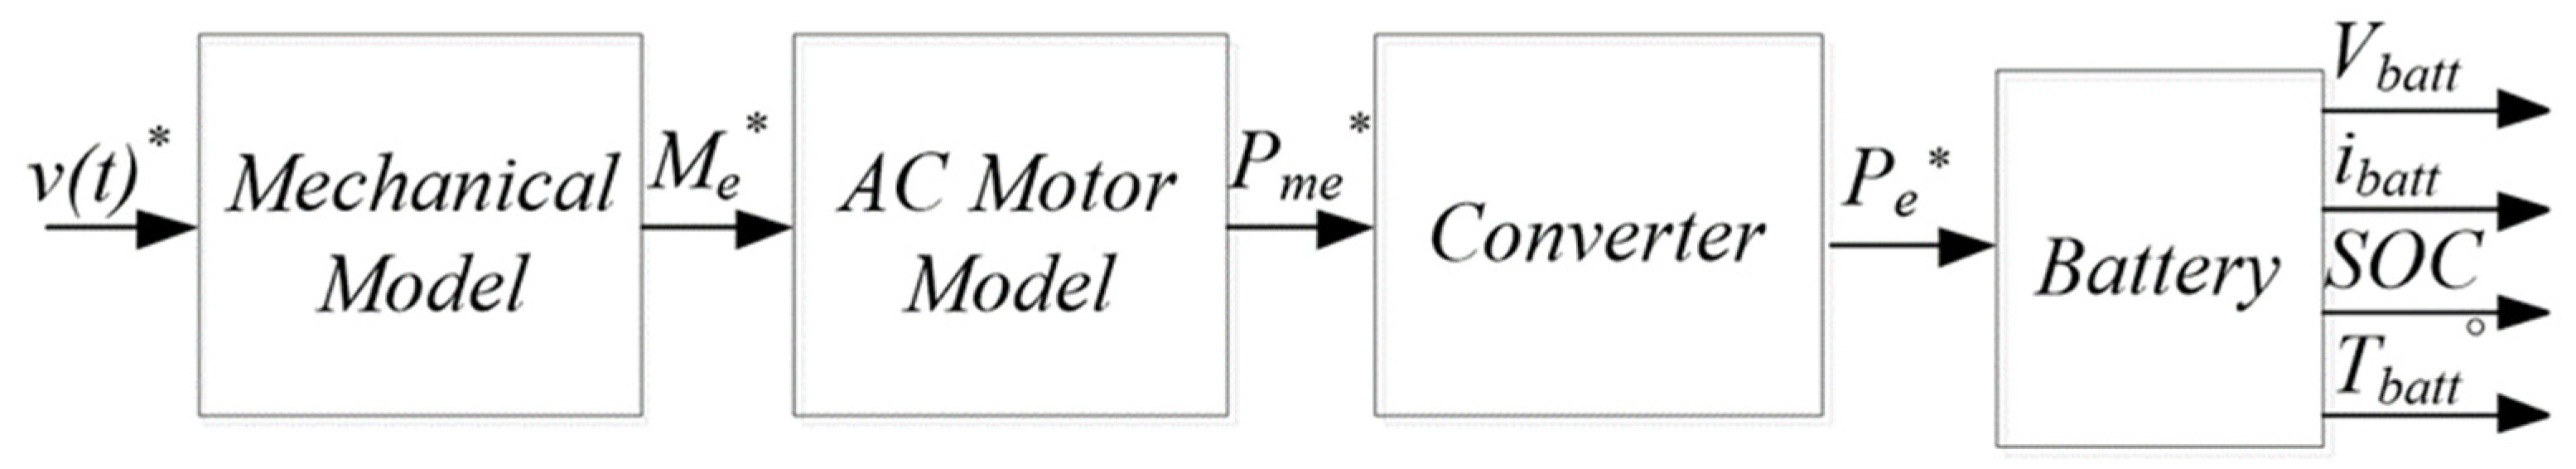
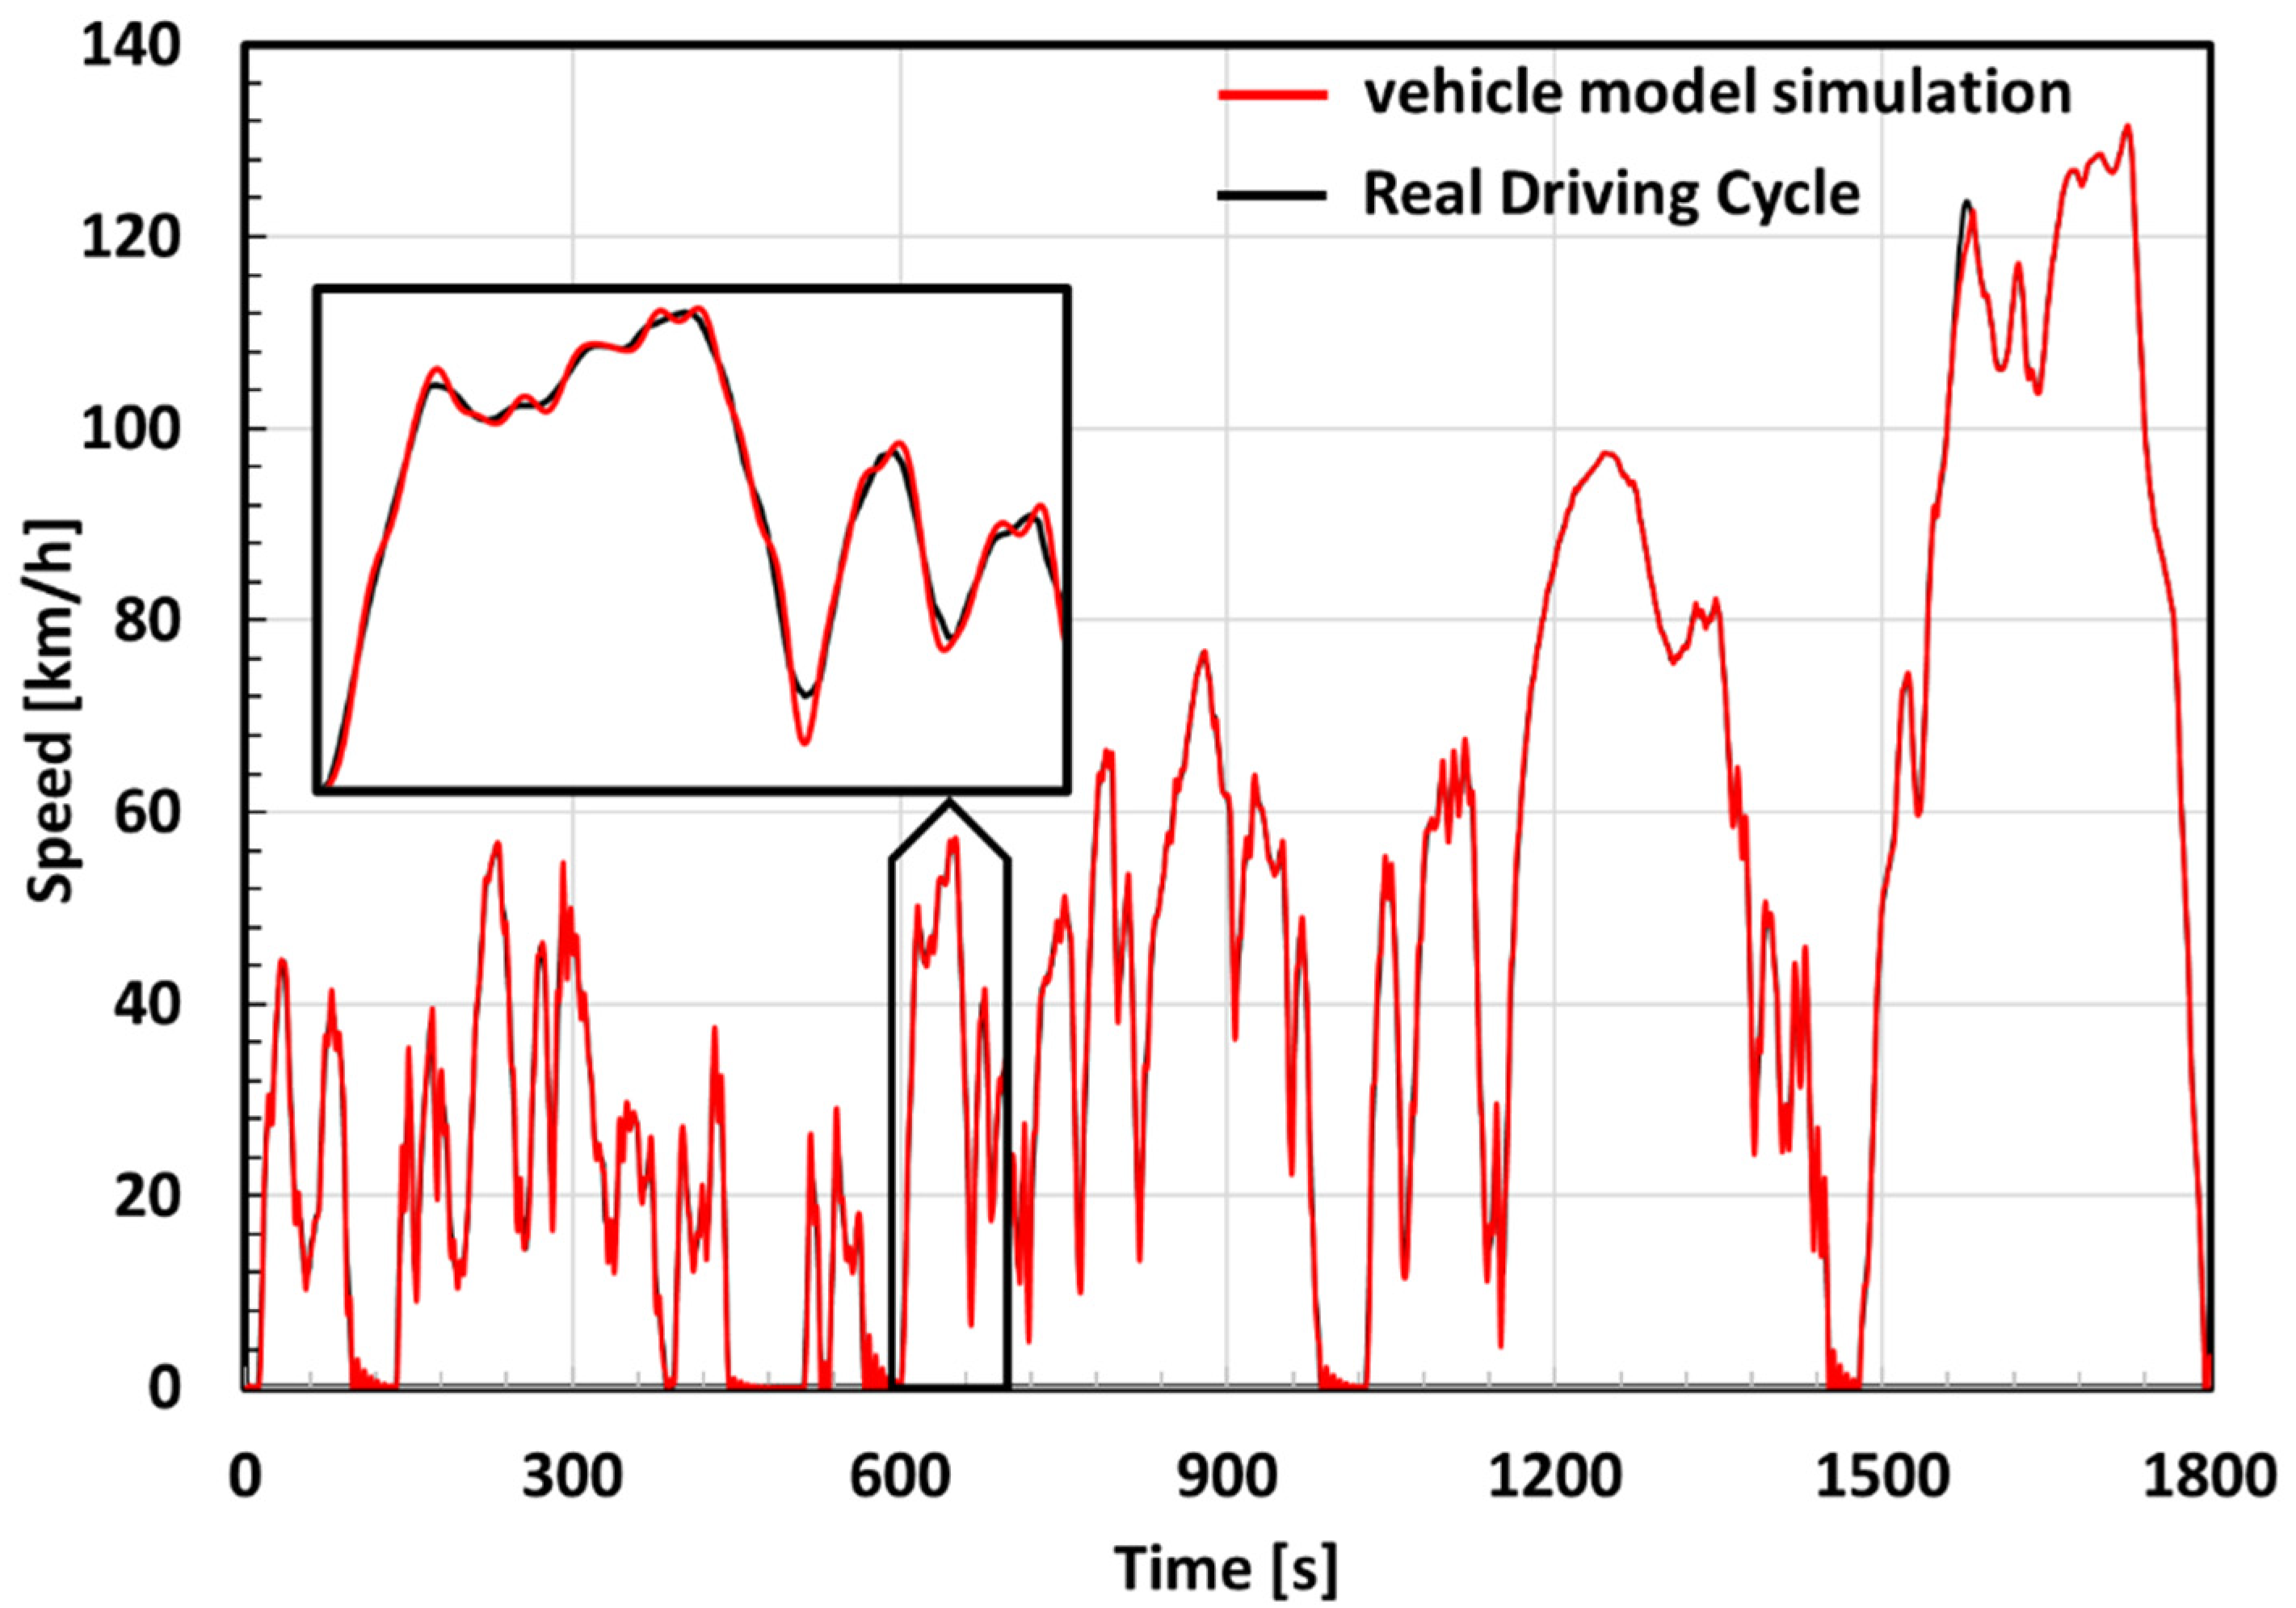
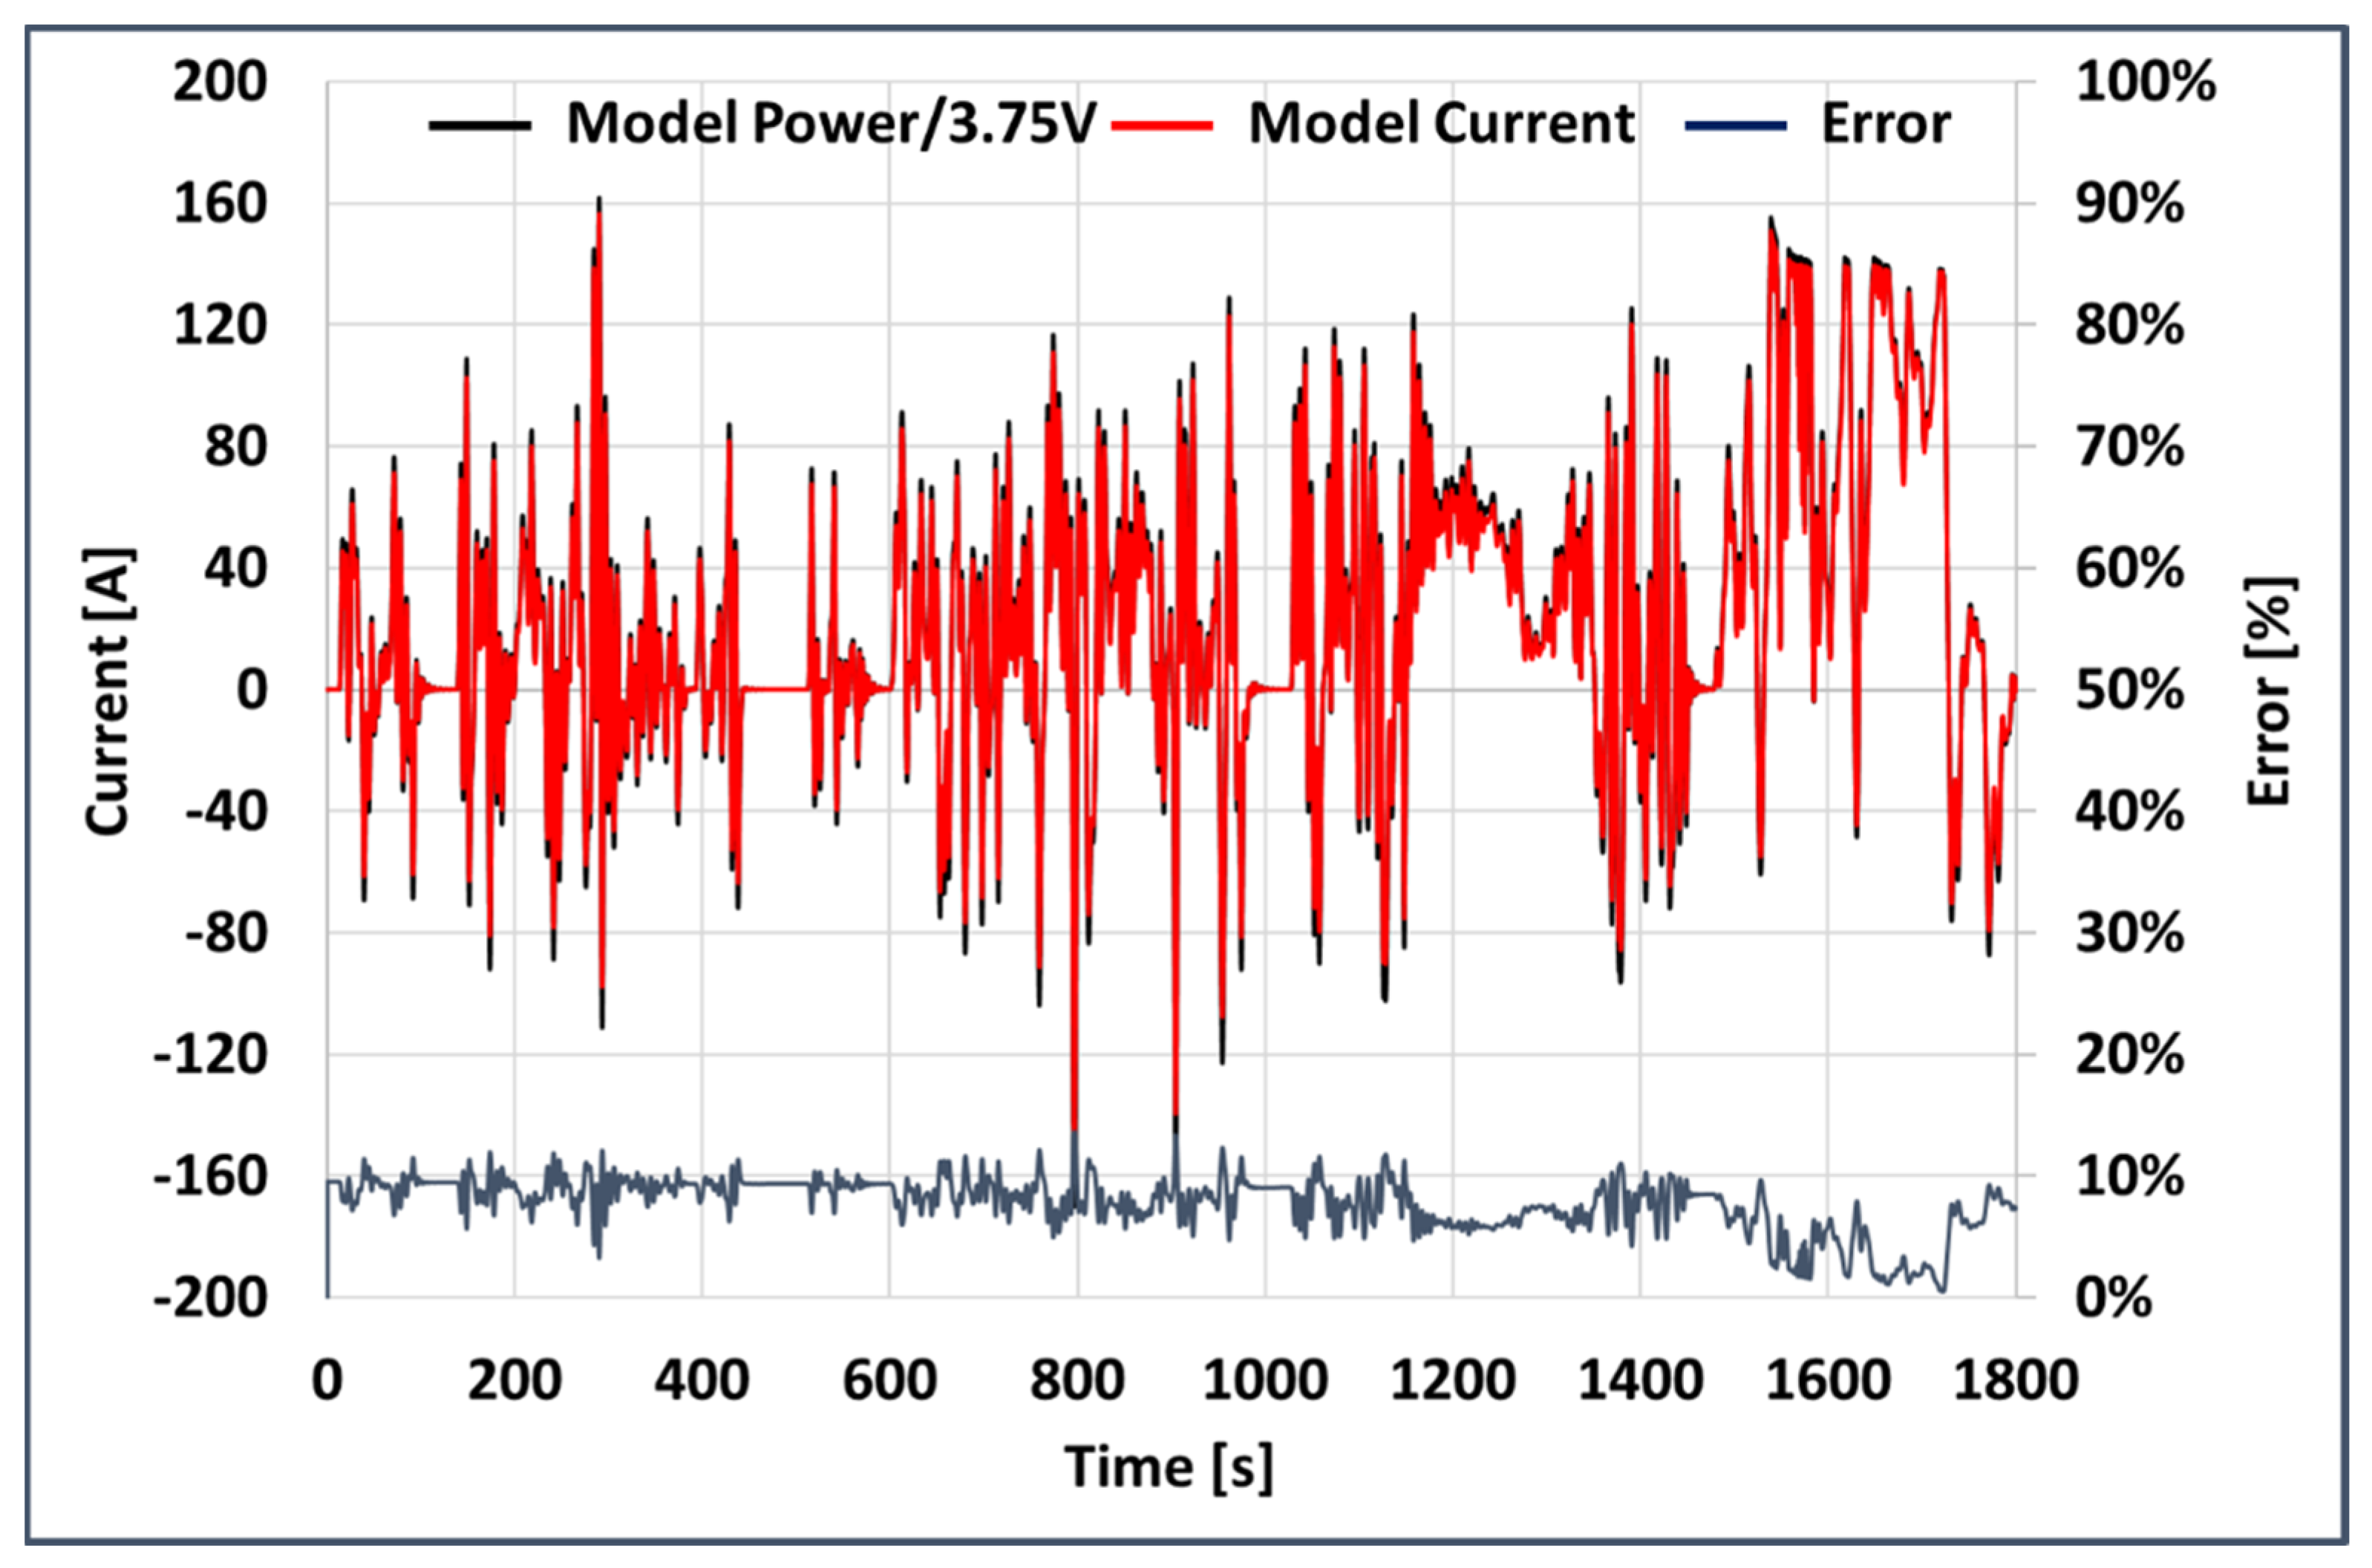
- A dynamic model [22] of an Electric Vehicle was used for the estimation of a current profile delivery by, or supplied to, the battery pack.
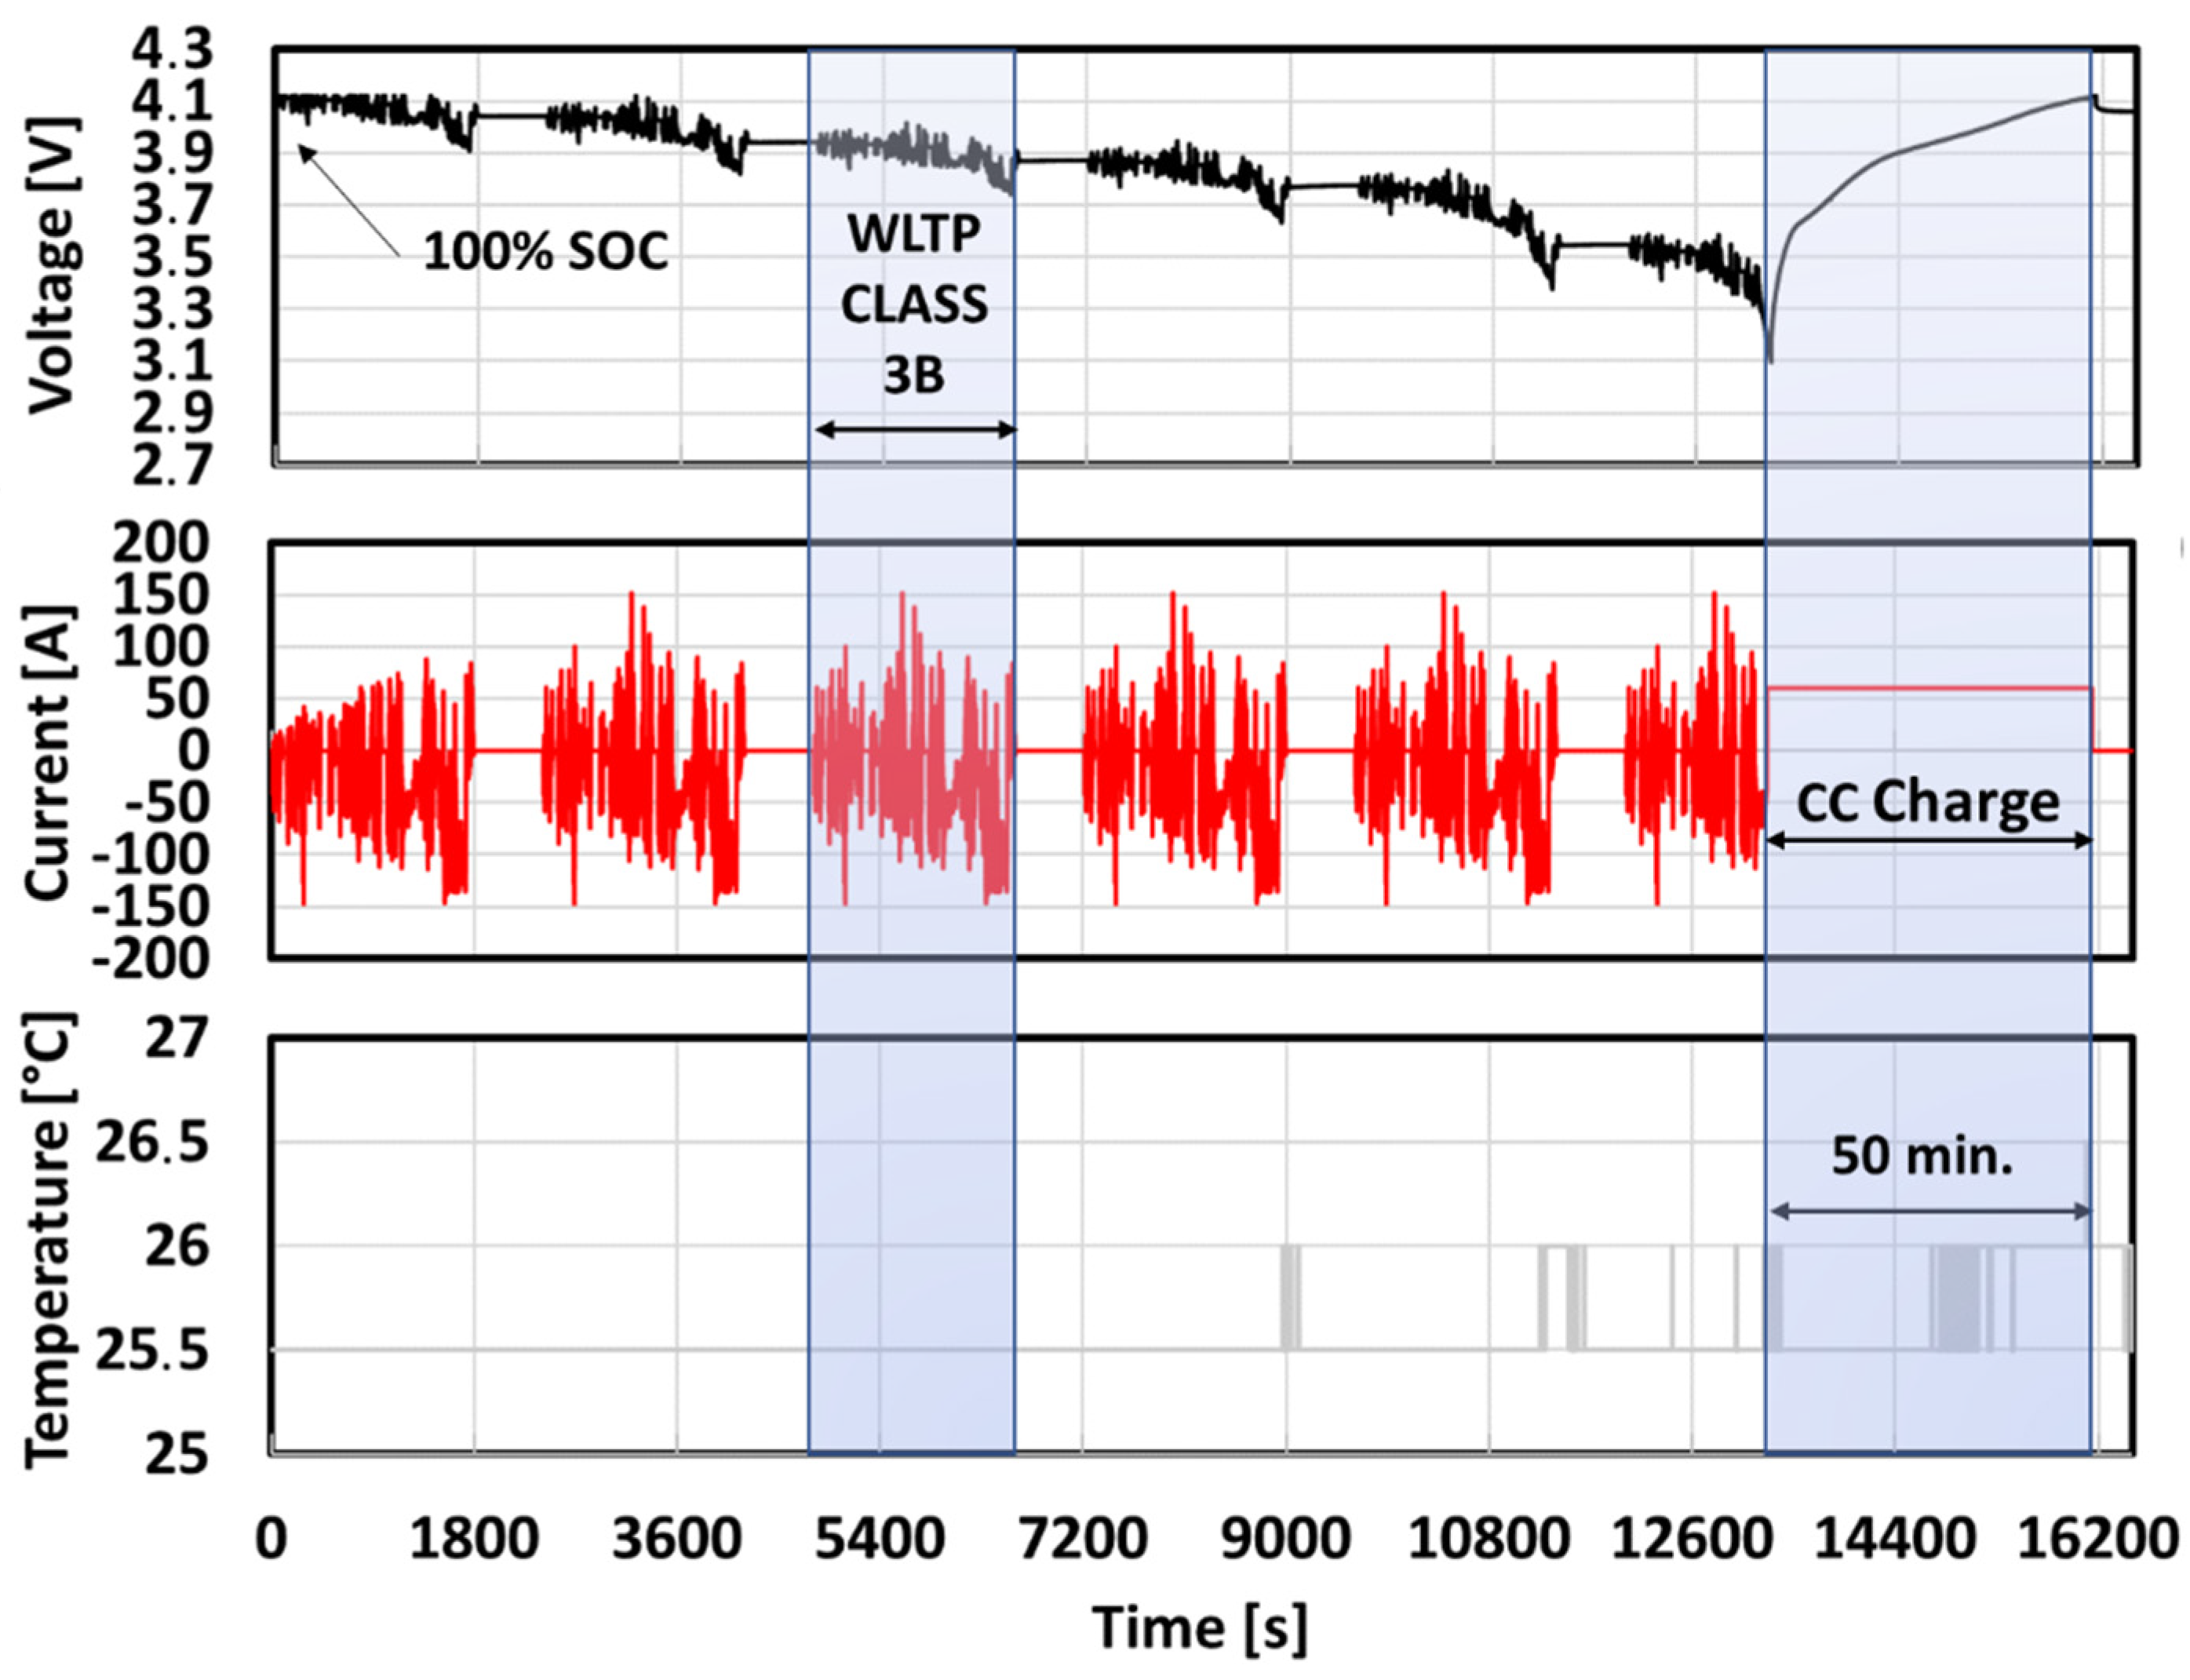
- The current profile extracted from the WLTP CLASS 3B driving cycle simulation was used on a commercial electrochemical cell used for automotive applications.
- Test data were analyzed in order to understand degradation effects to identify capacity loss, resistance increase, and ageing phenomena using IC and DV curves.
- A mathematical model for capacitance loss from cycle ageing and calendar ageing was extracted.
- The model was used to estimate battery ageing over possible vehicle operating scenarios.
2. Materials and Methods
2.1. Lithium Ion Cell Characteristics
Experimental tests are performed to investigate Lithium-ion cell degradation under the WLTP CLASS 3B driving cycle. Full charge/discharge cycles at 1C (capacity test) and a 10% SOC step Pulse test from 100% to 0% SOC were interposed to the ageing cycles.
The Lithium-ion battery for Electric Vehicles applications [23] considered in this paper, hereafter referred to as Device Under Test (DUT), consists of an LMO-NMC cathode and a graphite anode with a capacity of 63 Ah, whose technical specifications are given in Table 2.
Table 2.
Lithium-ion battery technical specifications from the datasheet.
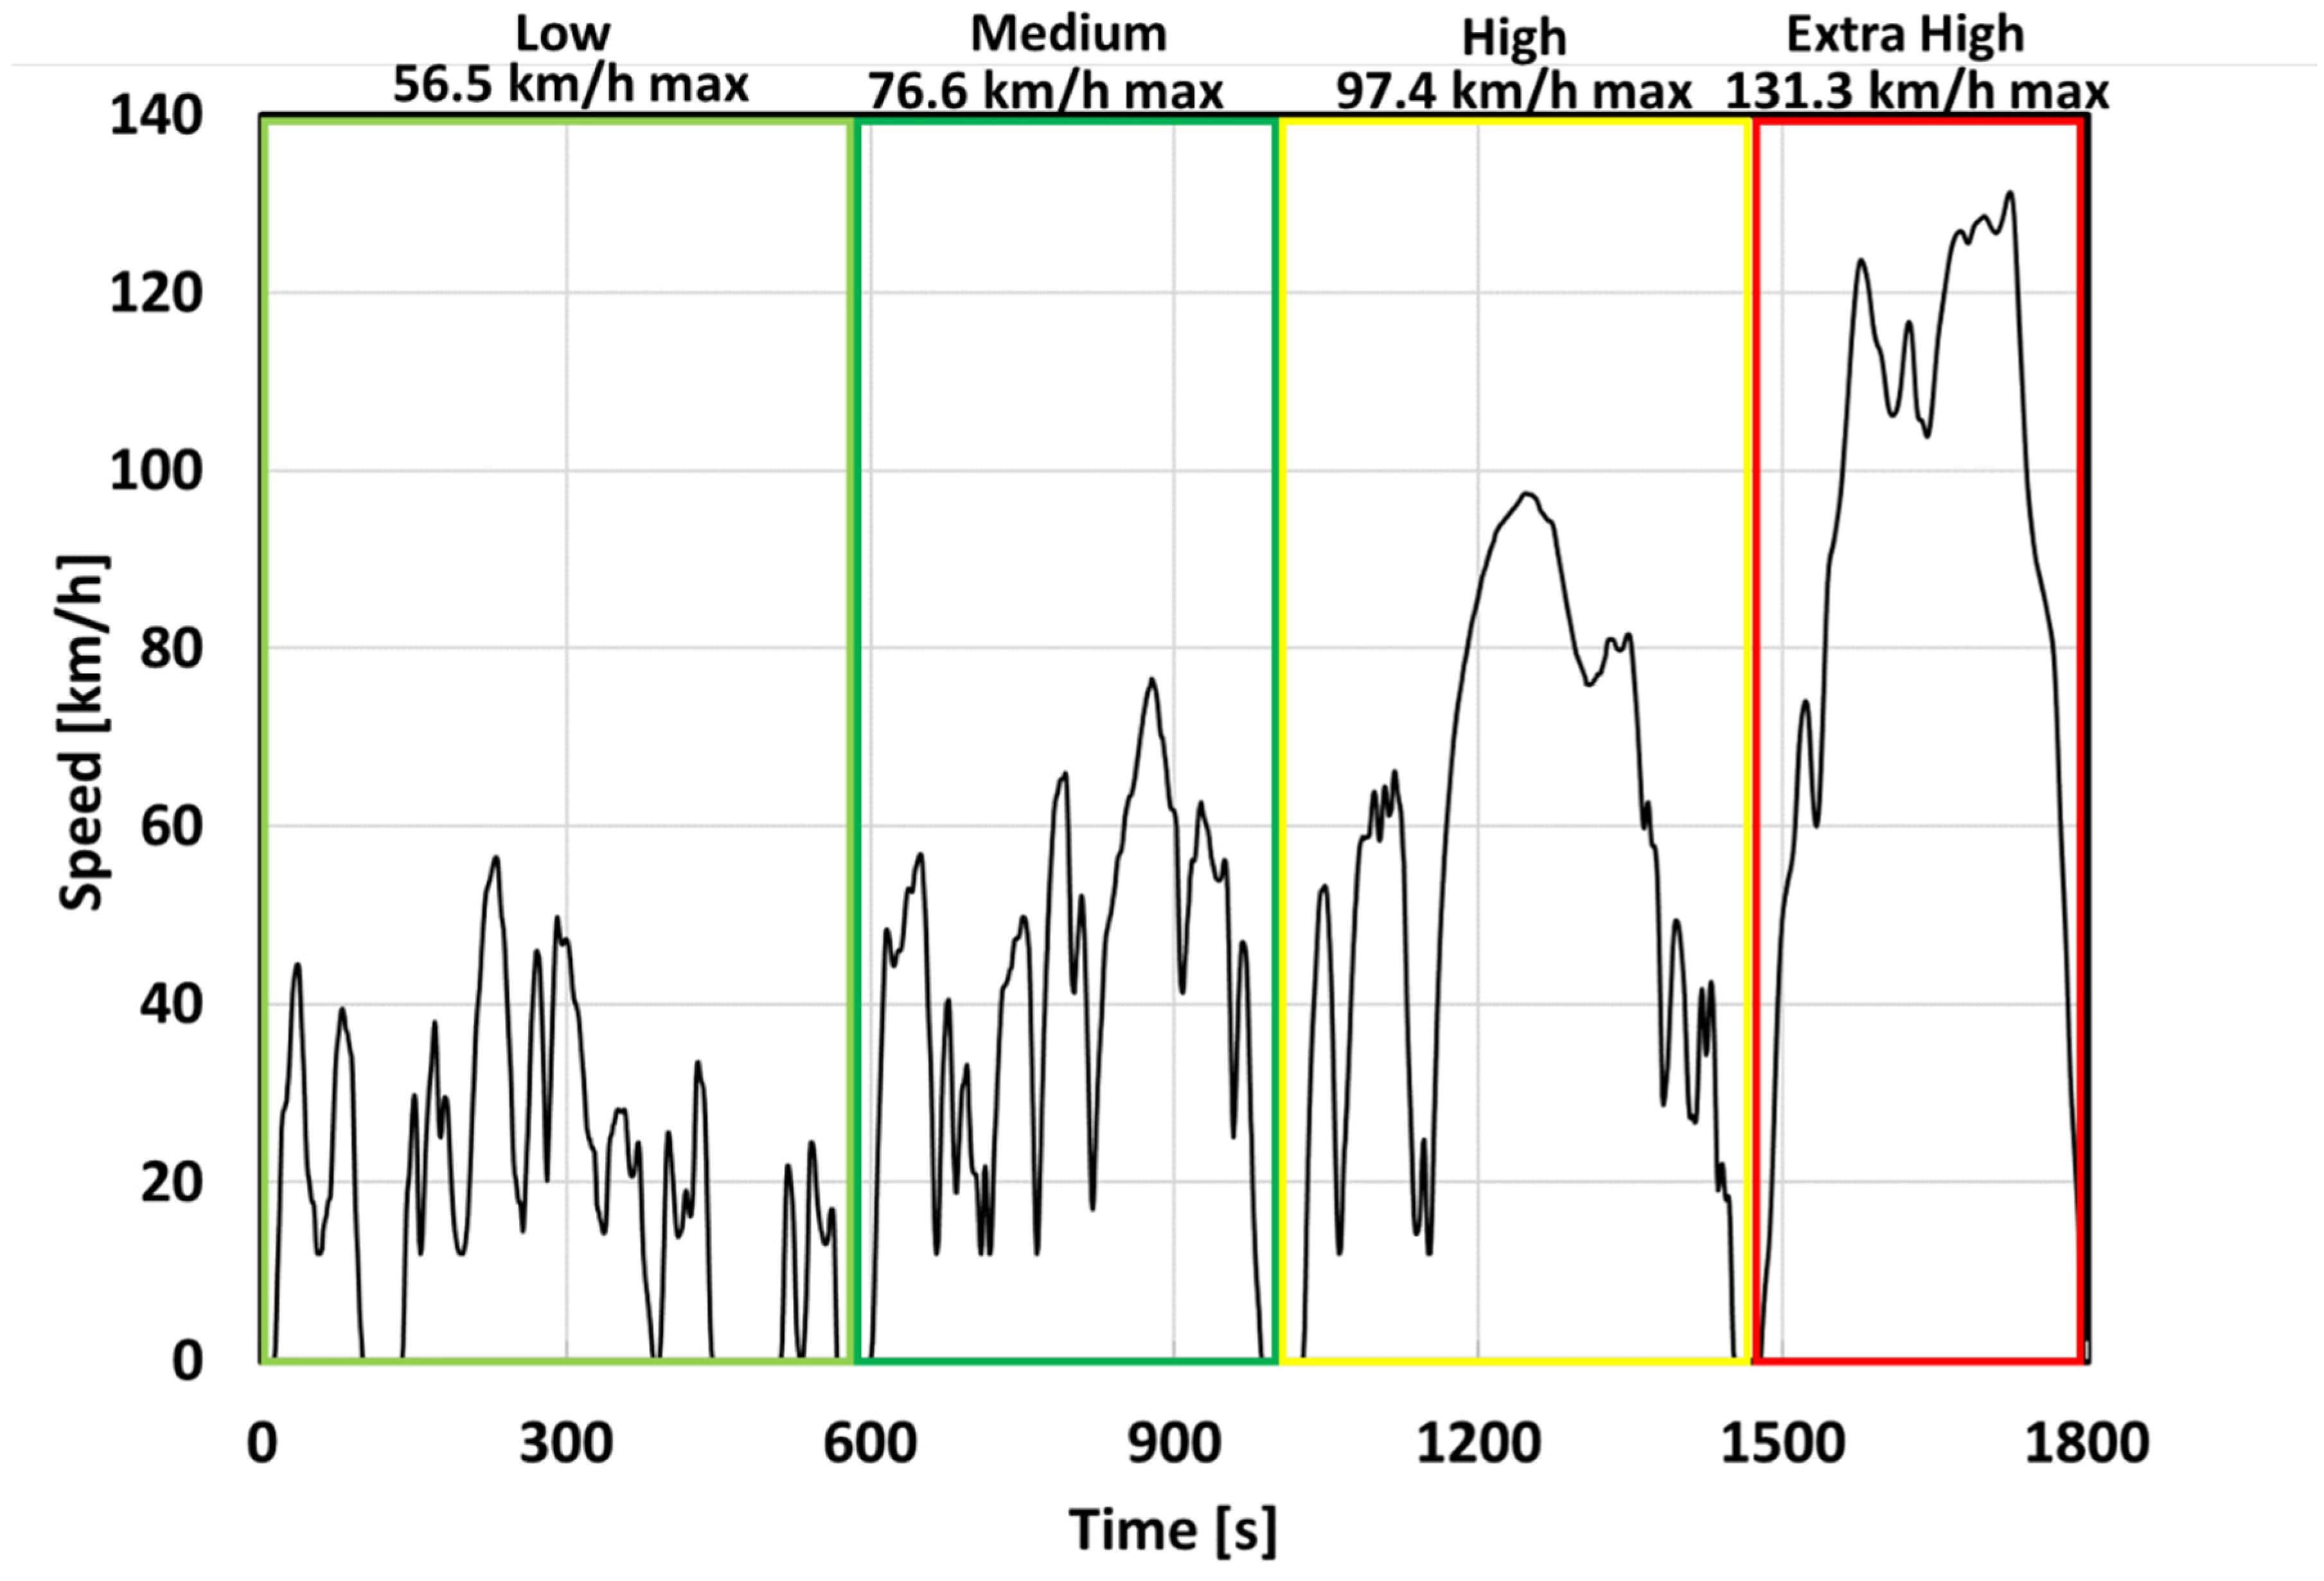
2.2. EV Mission Profile
The World harmonized Light-duty vehicles Test Procedure (WLTP) is a globally harmonized standard for determining levels of pollutants such as CO2; it is used for fuel consumption of internal combustion engines (ICE) and to determine the range of electric vehicles.
The WLTP procedures include several World harmonized Light-duty vehicle Test Cycles (WLTC) for different categories of vehicles based on the power-to-mass ratio (PMR), defined as the ratio of rated power (W) to ground mass (kg) (excluding driver), and the maximum speed (vmax) of the vehicle as declared by the automaker; it includes three different WLTC test cycles, depending on the class of vehicle according to PMR:
- Class 1—low power vehicles with PMR ≤ 22;
- Class 2—vehicles with 22 < PMR ≤ 34;
- Class 3—high-power vehicles with PMR > 34;
The work is focused on high-power vehicles. Therefore, it was chosen to perform the tests using the WLTP CLASS 3B cycle. The WLTP 3b cycle is composed of four sections: low, medium, high, and extra-high. For our purposes, the WLTP CLASS 3B was selected with a length of 23.266 km to be covered in 1800 s with a peak speed of 131.3 km/h, as shown in Figure 1. Each part contains a variety of driving phases, stops, acceleration and braking phases. Usually, the four phases are associated with a high traffic density urban road for the low part, a low traffic density urban road for the medium part, a suburban road for the high part, and a highway road for the extra-high part [24].
Figure 1.
Worldwide harmonized Light vehicles Test Procedure 3B for determining energy consumption for light-duty electric vehicles with a power-to-weight ratio greater than 34 (WLTP CLASS 3B driving cycle).
The driving cycle is defined in terms of speed and time. To identify the power profile required for the cell under test the vehicle model proposed in [22] was used and depicted in Figure 2. The model consists of three main blocks namely, the dynamic model of the vehicle, the AC motor model and the converter model [25]. The first block determines the traction effort on the basis of the mechanical force pushing the vehicle and computes the load torque at the motor shaft (Me*) and shaft speed. The AC motor model computes the electrical power Pme*, which the inverter is tasked to provide. The model of the converter estimates the power at the poles of the battery pack. The main technical specifications of the considered Electric Vehicle are summarized in Table 3.
Figure 2.
The dynamic model of an Electric Vehicle for the estimation power delivery by, or supplied to, the battery pack [22].
Table 3.
Electric Vehicle technical specifications extrapolated from Technical specifications of BMWi3 model [26].
After verifying that the driving cycle used was correctly reproduced from the model, as shown in Figure 3, the battery current profile was extracted through the model and applied to a single electrochemical cell. The current profile was used instead of the power profile because the software for the automatic creation of the cycler program did not support this option.
Figure 3.
Comparison between WLTP CLASS 3B driving cycle and vehicle model simulation.
Since the SOC, it was found useful to limit the SOC of the cell under test to 30% maximum, furthermore for the current profile extraction has been used the nominal voltage matching with 50% SOC. Under these conditions, the operating voltage window is relatively close to the nominal value of 3.75 V. As a result, the error between the current profile extracted from the model and the current profile computed as the ratio of power and rated voltage of 3.75 V have a max error of 13.36% and a mean error of 7.78% (Figure 4). The error was deemed acceptable.
Figure 4.
Battery current computed as the ration of power on rated voltage and error.
To correlate the number of driving cycles and vehicle operating times, average data of distance driven in Europe by a light-duty vehicle were taken as a reference [27]. The total distance is 12,168.12 km, equivalent to 523 driving cycles per year. The tests were then carried out in steps of 261/262 driving cycles before checking the characteristics of the DUT.
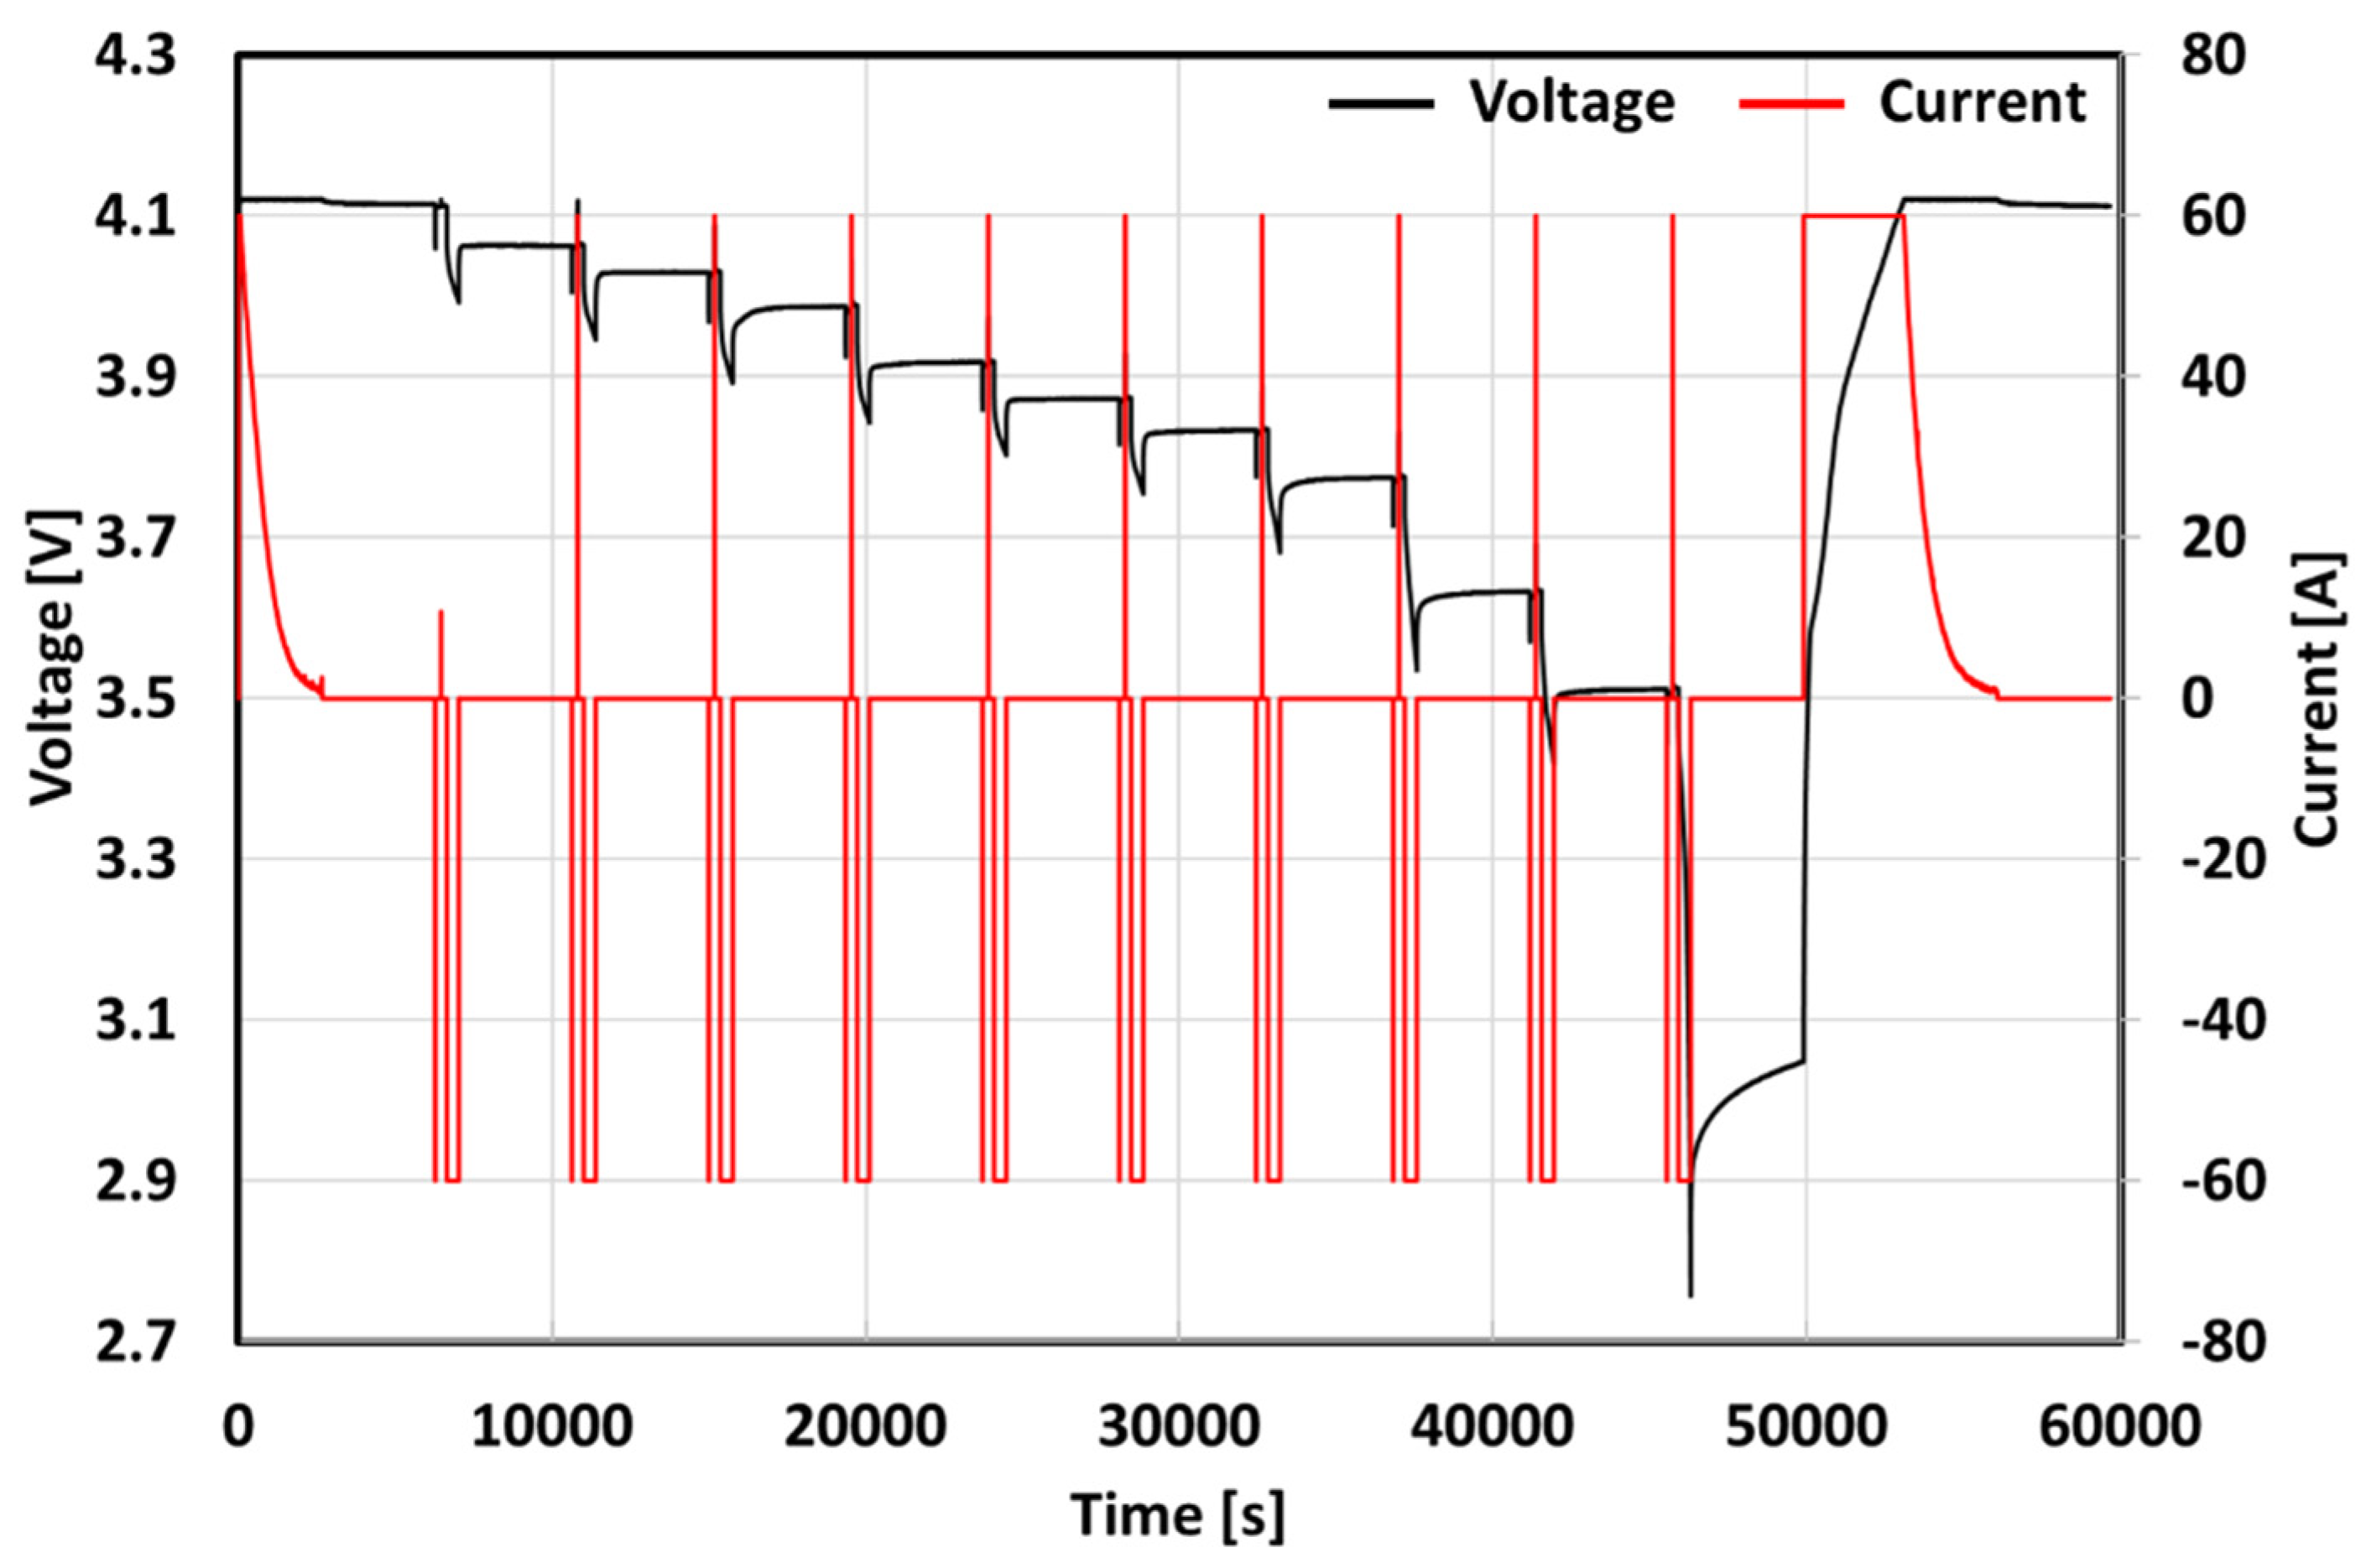
2.3. Test Procedures
A prismatic lithium-ion battery cell was used to investigate the effect of WLTP CLASS 3B driving cycles. The cell is aged with WLTP CLASS 3B driving cycle at ambient temperature (25 °C) for a number of cycles equal to 8 real years (4184 cycles) neglecting calendar ageing (test years). The sequence of cycles involves the electrochemical cell recharging at 1C when the voltage reaches 3.1 V. After the cell has reached the upper cut-off voltage of 4.12 V, the cycle continues from where it had stopped. Suitable tests are accomplished at the beginning of the ageing test and every 261/262 cycles to verify the characteristics of the cell under test; these are a capacity test (Figure 5) and a pulse test (Figure 6).
Figure 5.
Capacity test performed with a prismatic lithium-ion battery cell at 1C (C-rate) charge (CC) and 1C discharge (CC-CV).
Figure 6.
Pulse test performed with a prismatic lithium-ion battery cell with 10 s pulse at 1C charge (CC) and 1C discharge (CC-CV) and 3 min rest phase.
The capacity test is performed to verify the capacity of the cell; it consists of 3 complete charge and discharge cycles within the upper and lower cut-off voltage of 4.12 V and 2.7 V, respectively, at Constant Current (CC) for the discharge and Constant Current-Constant Voltage (CC-CV) for the recharge at 25 °C; this procedure, which is performed to stabilize the active materials of the cells is described in Table 4.
Table 4.
Capacity test procedure.
As described in Table 5, the pulse test encompasses a 10 s discharge at 1C (63 A), a 3-min wait phase, a 10 s charge at 1C, a 3-min wait phase. A 1C discharge of 10% of the capacity is then performed; it is assumed to be 10% of SOC. Finally, a 1-h rest is accomplished. The procedure is repeated until the lower cut-off voltage is reached.
Table 5.
Pulse test procedure.
2.4. Test Facilities
All tests were performed by using a Bitrode cycler model FTV1, whose main features are summarized in Table 6.
Table 6.
Cycler main features.
Note: The instruments and equipment used to carry out the tests indicated in this paper were kindly provided by the Institute of Advanced Energy Technologies “Nicola Giordano” of the National Council of Research (CNR-ITAE) in Messina, Italy.
Current and cell voltage measurements were carried out with sensors located inside the cycler. The cells have been placed in a climate chamber (Table 7) to allow accurate control of the internal temperature, which was monitored with two Pt100 thermistors directly connected to the cycler. In Figure 7 shows the instruments used to perform the tests on the electrochemical cell.
Table 7.
Climatic chamber main features.
Figure 7.
(a) Bitrode cycler on the right and Angelantoni climatic chamber on the left; (b) DUT inside the climatic chamber.
2.5. Test Schedule
The ageing test campaign using the WLTP CLASS 3B cycle was carried out following a procedure, which involved the sequence of tests shown in Table 8.
Table 8.
Ageing test with WLTP CLASS 3B driving cycle.
3. Results and Discussion
3.1. Cells Inspection and Beginning of Life (BOL) Conditions
At the beginning of the work, different cells are taken into account for the ageing test. The first step before starting the ageing tests is to visually inspect the cells to make sure they are not damaged. Capacity tests are then conducted to evaluate the cell’s capacity. The cell with parameters close to those given in the manufacturer’s datasheet was chosen for ageing tests.
Cell capacity and energy were computed for the selected Cell 1 at the end of the third discharge cycle of the capacity test. The efficiency was computed as the ratio of the energy extracted to that injected during the tests. The cell has shown a 64,26 Ah capacity, a value very close to that of manufacturer’s datasheet (Table 9).
Table 9.
Main parameters of cells at the BOL.
3.2. Cells Cycling under Current Driving Cycle
The current driving cycle was applied to Cell 1. During each step of the ageing test the cell starts from the fully charged condition (SOC = 100%). Upon reaching the voltage of 3,1 V, identified as the minimum safety voltage, the charging phase is triggered. Under these conditions the full discharge of the Cell 1 is about 6 current driving cycles. However, current driving cycles will age Cell 1 over time, causing a degradation leading to a shorter time to reach the lower cut-off voltage than under BOL conditions. For the recharging phase, it is known that electric vehicles require rather long charging times. However, electric vehicles can be recharged faster by using high-power charging stations (e.g., DC fast stations) [28]. Therefore, a charging time below one hour has been assumed only with a CC charging until the upper cut-off limit without a CV charging phase. In Figure 8 a single-step of ageing test with a WLTP CLASS 3B driving cycle is reported. The value of SOC was computed by considering the capacity discharged from Cell 1 during the tests.
Figure 8.
Voltage current and temperature profiles recorder during a single step of ageing test of driving cycle ageing at 25 °C.
Figure 9 shows the evolution of both charge and discharge voltage profiles as a function of the capacity, along different equivalent years of driving cycle ageing. Voltage profiles have been recorded during the parametric check-up tests at 1C. A reduction in available cell capacity of 11% and alterations in the shape of the curves after a series of test equivalent to 8 years was found.
Figure 9.
(a) Charge and Discharge time diagram during WLTP CLASS 3B driving cycle at 25 °C from BOL to 8 test years of ageing (b) Capacity drop after battery ageing.
Pulse tests were accomplished to identify the internal resistance of Cell 1 during various stages of ageing at different SOC. The resistance of the battery was computed as the voltage-to-current ratio. Several phenomena contribute to the voltage drop, they can be identified with a contribution due to all electronic resistances, the battery’s electrolyte resistance, the battery’s double layer capacitance and charge transfer resistance, and the polarization resistance which accounts for ionic diffusion in the solid phase [29]. The cell internal resistance (IR) depends on the interval Δt at which voltage and current samples are taken and also depends on the SOC battery. Resistance values at various SOC levels in 10% steps were extracted from the pulse tests. The applied driving cycle did not cause a large increase in the internal resistance of the cell under test; this value is confirmed by the energy efficiency value of the cell remaining almost constant. Probably during the first ageing the cell conditioned itself by improving performance and then remained stable as shown in Figure 10.
Figure 10.
(a) Evolution of Charge and Discharge Energy and Energy efficiency with ageing. (b) Evolution of Internal cell resistance for different SOC values with ageing.
To further investigate the cell behaviour during lifetime IC and DV analyses were also performed; these analyses are two techniques widely applied to identify and quantify degradation mechanism in Lithium-ion batteries [30]. The plateaus in charge and discharge voltage profiles represent phase transitions occurring due to electrochemical reactions, which can be highlighted after the differentiation of the curve, by the presence of well-defined peaks. IC analysis, performed by differentiating the capacity with respect to the voltage, allows obtaining peaks to correspond with the plateaus of the voltage-capacity curve, while DV analysis differentiates the terminal voltage with respect to cell capacity and shows peaks corresponding to the valleys of the IC curve. By the analysis of both techniques, a feature of interests (FOI) can be identified on the differential curves. The most relevant FOIs of the IC curve include intensity, position, and the area under the peaks, while for the DV curve the distance between the two adjacent peaks is the main FOI. In particular, the degradation mechanisms can be related to IC peak shifts toward lower voltage associated with IR, the decrease in IC peaks intensity linked to LAM, and DV peak shift coupled with both LAM and LLI [31].
In Figure 11 is shown the evolution of the IC curve obtained by differentiating the 1C discharge curves at different levels of ageing (years); it should be noted that, here a high C-rate was used to acquire the voltage capacity curve, even though IC and DV often require a signal very close to the equilibrium condition of the cell. Despite the voltage curves used in the present work to perform differential analysis were acquired at 1C, the signals provided were still useful for identifying the most relevant signature typical for the chemistry of the cell under investigation. Indeed, as already proven in previous works, a higher C-rate can still be useful for ageing mechanism identification [32,33]. By observing the IC curve three different peaks A, B and C can be identified at 3.47 V, 3.8 V and 4.1 V, respectively, which can be related to the graphite anode signatures [34]. On the other hand, the cathode phase transitions are not visible on the curve. Nevertheless, the overall shape of the curve suggests that the cathode chemistry is a combined LMO/NMC composition as already reported for the same cell [23]. The most important variations as the effect of ageing are observed on peak A, which dropped almost 36% and shifted by 5 mV to higher potential in comparison to the fresh cell. Lower decreases of the intensity close to 10% are also observed for both peaks B and C. Despite the evolution in intensity, the positions of both peaks B and C on IC curves remain almost unchanged. On the basis of previous interpretations of the IC curve to identify the degradation mechanisms [35,36], the evolution of peak A can be mainly related to LLI, while the constant decrease in both peaks B and C can be due to the LAM of the negative electrode. With regards to the peaks position, during discharging, the change in voltage is negative and the peak in the IC graph are shifted to lower potentials because of the overvoltage caused by the polarization resistance [37]. Since the shift of peak A with ageing is in the opposite direction and both peaks B and C remain unchanged, in agreement with the internal resistance evaluated by the pulse test, also IC analysis confirms that no relevant IR loss occurs.
Figure 11.
Evolution of IC profiles as the effect of driving cycle ageing.
It is worth noting that, by proceeding with ageing a small peak at about 3.62 V appears, becoming well-distinguished on the IC curve matching with 8 years ageing; this peak, representing a typical signature of cathode material, may be masked due slow kinetic of the transformation and the high C-rate of the analysis, which does not allow to detect the process. On the other hand, once the contribution from the negative electrode on the peak shape over cycling is eliminated, the effect of the cathodic reaction is made evident on the IC curve [38].
Figure 12 deals with the evolution of the DV curve when differentiating the 1C discharge voltage profiles, similarly to what was done for IC analysis. The DV curve shows two peaks, which match with the valleys 1 and 2 in the IC curve and are representative of the anode signature of the cell. No cathode signatures are instead observable in the DV curve as already reported for similar batteries when a full cell voltage profile is used for the analysis [39]. In order to deeply investigate the degradation mechanisms of the cell, peak 2, which indicates a 50% graphite lithiation, is used as a reference process; it is to be noted that for the cell under investigation, this peak is centred at about 75% of the total capacity, which suggest that the anode is overhang as typically for lithium battery [40]; this peak divides the DV spectra in two regions identified as distance Q1 and Q2 in Figure 13. The evolution of the distance Q1 with ageing can provide information about alteration on lithium storage capability of the graphite anode, then it is representative of anode degradation due to LAM. On another hand, Q2 gives information about cycling lithium between anode and cathode, therefore its change is indicative of a possible LLI side reaction [41]. Figure 14 deals with the progression of both Q1 and Q2 parameters as the effect of equivalent years of ageing under WLTP CLASS 3B driving cycles. Q1 change rapidly in the first year decreasing its value from 46.7 to 43.2 Ah then holding essentially the same value for the following cycles. On the contrary, a larger variation of the Q1 value can be observed, with a slight increase during the first year, and a progress drop proceeding with cycle ageing. The evolution of Q1 suggests that, after an initial loss of storage capability of the anode it is almost unchanged, then a slow degradation occurs with the cycles in the following years; this observed behaviour suggests that during the first driving cycles, the anode undergoes initial conditioning due to the repeated volume changes of the graphite grains during lithiation and delitiation phases. As is well known, these contractions and expansion lead to the formation of particle cracking or to the detachment of the active material from the electrode with consequent isolation of the particles and therefore to loss of active material (LAM) [42]. The lack of further evolution of Q1 after the first few cycles could mean that, following the initial rearrangement of the anode material, there is no longer a relevant LAM of the negative electrode. In contrast, Q2 follows a linear loss of capacity, suggesting that LLI is the dominant degradation mechanism induced by WLTP CLASS 3B driving cycles on the DUT; this ageing mechanism is in agreement with previous literature for the chemistry of the DUT and it is attributed to the continuously slow growth of the SEI layer on the negative graphite electrode [43,44,45]. However, a more detailed analysis of the trend of Q2 during the first year shows a slight increase in capacity compared to the fresh cell, which could be related to a larger amount of cycling lithium inside the cell. To better understand this phenomenon, it is possible to analyze the change in the shape and height of the peaks in the DV curve. Regarding peak 2, corresponding to the phase transformation of the high SOC anode, it rises in intensity also becoming sharper during the first cycles corresponding to about the first year of ageing, then shifts to the right keeping the shape and magnitude unchanged. The magnitude of the peaks is usually related to the degree of homogeneity of lithium distribution (HLD) inside the cell, and in particular, the increase in intensity due to the charge and discharge cycles could be explained by an improvement in the HLD compared to the fresh cell not yet adequately conditioned [46,47]. A result similar to the one just discussed was obtained by Sieg et al. [48] investigating the ageing phenomena induced by an EV driving profile on a cell based on an NMC cathode; they observed that the peak shown in the differential voltage curve at high SOCs corresponding to an anode transformation shows an increase during the first few cycles and then decreasing over time due to the effect of cycles on the cell. Such an evolution of peak intensity has been related to an initial enhancement of the HLD of the cell and then to a change in graphite material or microstructure. Further confirmation of the improvement in HLD comes from the analysis of peak 1 in Figure 12. As ageing progresses, a shoulder appears on the right side of peak 1. The reason for this phenomenon has been related to the enhancement of HLD as an effect of fresh cell cycling [49]. Although this phenomenon typically occurs immediately after the first full charge cycles [50], we observed it only after having carried out several driving cycles. Since this homogenization of lithium occurs when the slope in the voltage curves of one electrode is remarkably high compared to the counterpart electrode, it is plausible that since the driving cycle operates mainly within intermediates SOC, rarely reaching the end of charge or discharge delaying the phenomenon over time.
Figure 12.
Evolution of DV profiles as an effect of driving cycle ageing.
Figure 13.
Identification of the Q1 and Q2 regions in DV spectra indicative of LAM and LLI, respectively.
Figure 14.
Evolution of Q1 and Q2 regions during the driving cycle ageing and ageing mechanisms.
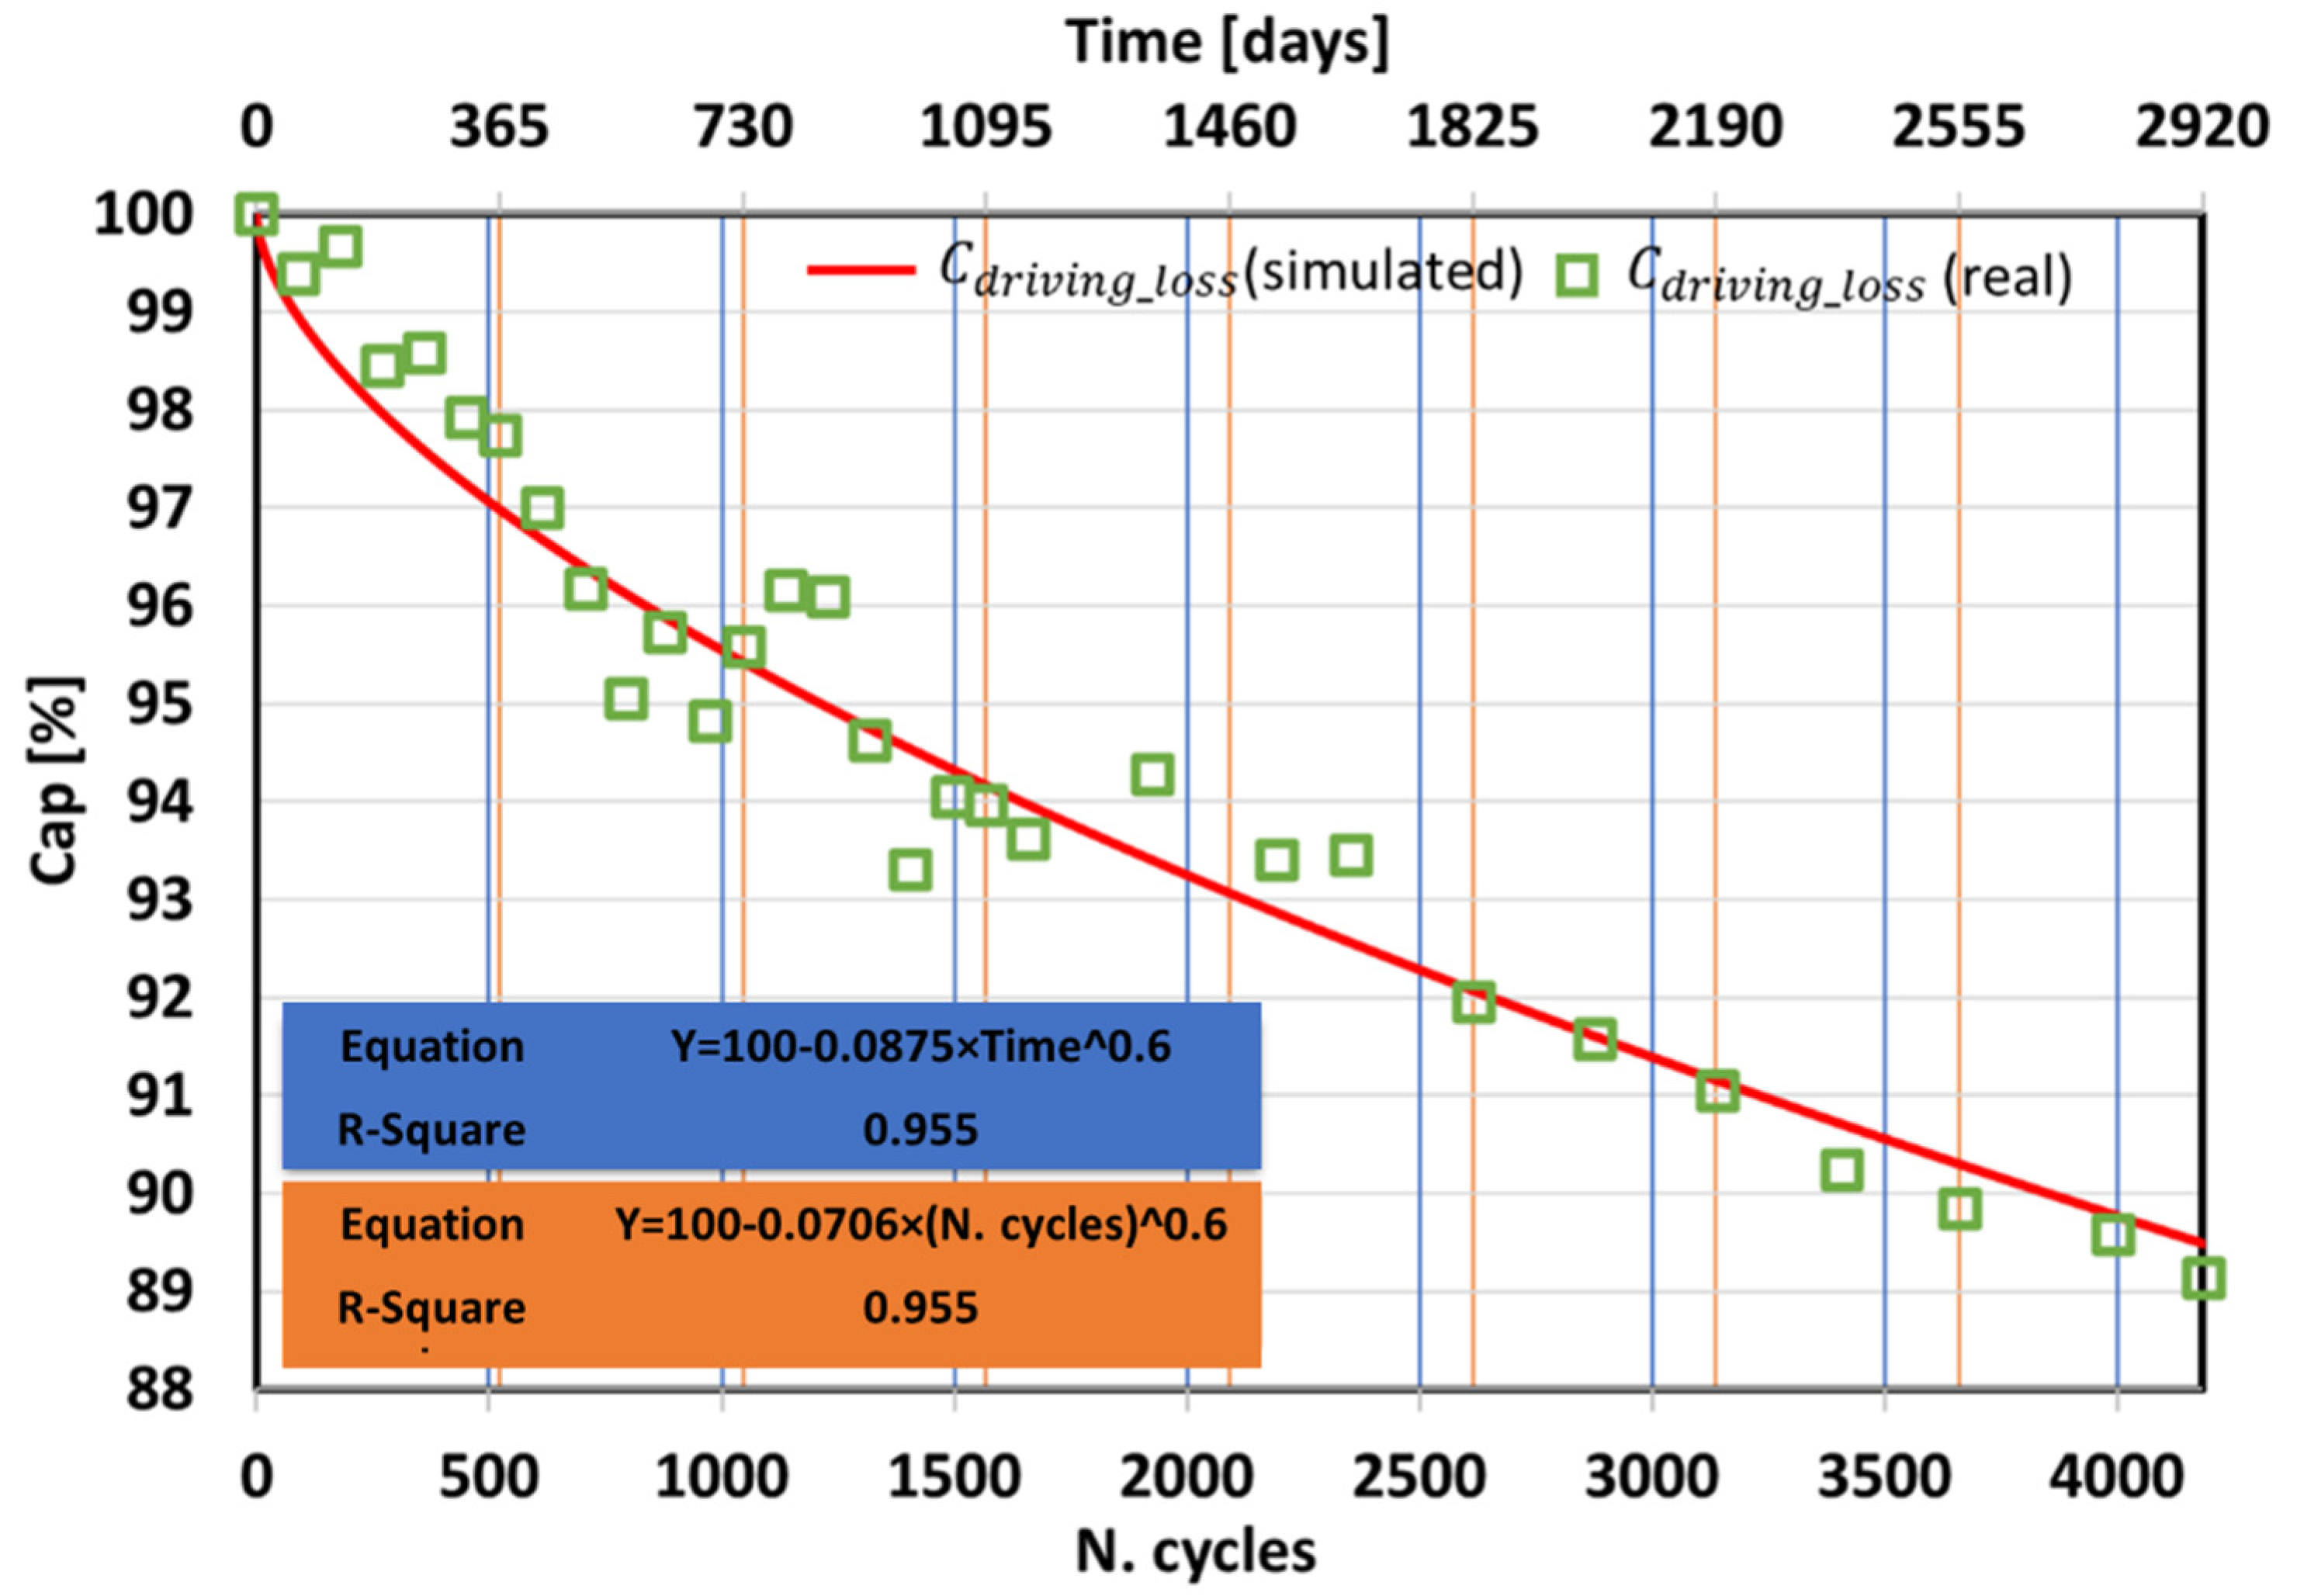
3.3. Lifetime Modeling
In order to estimate the overall capacity loss of an electrochemical commercial graphite/LMO-NMC lithium-ion cell, it is necessary to estimate the capacity loss related both to the driving cycle and calendar ageing. A mathematical representation of the capacity loss resulting from the two contributions is given in the Equation (1):
where is the residual capacity of the cell at time , is the initial capacity of the cell under test at the beginning of its life, is the capacity loss when it is working due to the driving cycle, and is the capacity loss related to the time in which the cell is not working.
As earlier mentioned, only the effect of driving loss was experimentally evaluated using the WLTP CLASS 3B driving cycle. The effect of calendar ageing was not considered because the test would have provided results in an unreasonable time frame.
To evaluate the effects of ageing of the cell undergoing driving cycles, capacity tests performed at different ageing intervals were evaluated as described in Table 8. An expression describing the percentage capacity loss of the DUT was then extracted (2):
represents the capacity loss due to driving cycle ageing expressed in percentage, A is the initial capacity of electrochemical cell, B is a parameter that depends on the vehicle operation (journey time, time of use, C-rate, SOC, Temperature), t is the time while C is a constant as shown in Table 10. In Figure 15 the loss of capacity is shown for each time step considered and the fitting curve (2).
Table 10.
Fixed parameters of the fitted function (2).
Figure 15.
Loss of capacity from the number of driving cycle WLTP CLASS 3B and days.
The results reported in [51] were used to evaluate the effects of calendar ageing. When not operating, the battery pack of an electric vehicle is subjected to calendar ageing. Batteries used in EVs spend approximately 98% of their lifetime on stand-by, during which calendar ageing will occur [52].
In order to evaluate the effect of calendar ageing, some curves were extracted from [51] for a cell with the same characteristics as the DUT. The model proposed by the authors was identified and validated by performing calendar ageing tests on commercial graphite/LMO-NMC lithium-ion cells at different temperatures (0 °C, 25 °C, 45 °C, 60 °C) and SOC (100%, 80%, 65%, 30% 0%). The calendar ageing curves from the last cited work are, however, limited to 600 days ageing. For the purpose of the present work, it was necessary to predict the ageing up to 8 real years. Usually, it is reported that calendar capacity loss follows a square root time dependence, related to SEI growth, as reported in [53,54]. However, different functions might fit this behaviour better. For example, it was reported in [55] that a superposed linear and square root function or a function with match the data very well. The advantage of this particular function is the presence of a single ageing factor to evaluate both effects of the temperature and SOC. In our case, it was found that an equation similar to that of the driving cycle ageing fitted very well the calendar ageing curves and it is described in (3).
represents the capacity loss due to calendar ageing expressed in percentage value, a is the initial capacity of the electrochemical cell, b is a parameter that depends on the temperature and SOC, t is the time period, while the power coefficient is a constant as reported in Table 11. The coefficient of determination (R square) of the fitting performed is also given in Table 11 for the ageing curves considered. Under these conditions, the only temperature- and SOC-dependent parameter that can describe the evolution of the cell capacity fading related to calendar ageing is b. The following figures deal with experimental data of capacity loss as an effect of calendar ageing for the available combination mentioned above. Moreover, the dotted lines represent the fitting curves according to Equation (1) with the parameters of Table 11. As shown in Figure 16 and Figure 17 the decay is higher when the battery is in stand-by at high SOC.
Table 11.
R-square fitting curve (3).
Figure 16.
Calendar ageing data and curve fitting at 45 °C and different SOC levels [51].
Figure 17.
Calendar ageing data and curve fitting at 0 °C and different SOC levels and 25 °C and 80% SOC levels [51].
The fitting carried out on experimental data allowed parameter b to be computed only for the available combinations of SOC and Temperature. Since only experimental data of eleven storage conditions were available, it was therefore necessary to estimate this parameter for different values of SOC and Temperature within the range of interest. For the purposes of this work, the range of temperatures considered is between 0 °C and 45 °C while the SOC is considered from 0% to 100%. The variation of parameter b with respect to temperature and SOC is shown in Figure 18. In the surface, it can be seen that parameter b takes higher values as SOC and temperature increase indicating that the loss of capacity due to calendar ageing is amplified under these conditions. However, the fit does not account for some degradation curves, for example, those with SOC between 5 and 50 percent and a temperature variation between 5 and 40 °C, which could change the surface trend at these points. However, the approximation for known ageing curves is considered excellent.
Figure 18.
3d variation of b parameters with SOC and Temperature.
The overall ageing of an electrochemical cell subjected to driving cycle and calendar ageing was then evaluated. The effects are considered to be separated in time because calendar ageing applies when the vehicle is parked and is not being used, unlike the driving cycle ageing. In order to identify real vehicle usage, average data on distance travelled in Europe were used [27] with an average distance travelled on a weekday of 32.8 km and an average distance travelled on a public holiday of 34.6 km. Assuming a typical year consisting of 365 days including 261 weekdays and 52 weekends (104 days), the total distance is 12,168.12 km; it was then assumed that the WLTP_CLASS_3B driving cycle was used as the standard route as reported in Table 12.
Table 12.
Typical yearly vehicle utilization according to distance travelled in Europe.
An average daily temperature for the 8 years of the test was considered to make this calculation, in particular, referring to a real situation in Messina, Italy [56]. Similarly, considering the effect of range anxiety involving a driver of an electric vehicle, it was assumed that the driver would never want to find himself with a residual range of less than 30% [57,58]. To better define range anxiety, it is the fear of not being able to find an electric recharging station before the battery runs out. Therefore, the SOC value variation due to the driving cycle is between 30% and 100% and depends on the previous SOC value of the cell reached after the last driving cycle is done and computed from the vehicle model described above. Instead, the calendar ageing was computed for each partial day (excluding the time required to perform the driving cycle and the recharging phase if required), and it is affected by reached SOC and temperature. A typical year variation of Temperature, initial daily SOC and number of driving cycles are depicted in Figure 19.
Figure 19.
Temperature, initial daily SOC value and the number of driving cycles in a year.
A time period of 8 years was considered to evaluate the capacity loss for the calendar and driving cycle. A cell charging is done when the voltage is below 3.1 V assessed as a SOC lower than 30%. After the charging period, the upper voltage cut-off of the cell is 4.12 V (100% SOC). The number of daily WLTP driving cycles was distributed as shown in Table 12. The total capacity loss was then computed for an 8-year time frame, and the annual percentages are shown in Table 13.
Table 13.
Typical yearly vehicle utilization.
A number of possible scenarios were then evaluated in order to predict the capacity loss as shown in Table 13. Scenarios 1 and 2 describe a situation in which both the environment temperature and the battery pack conditioning system hold the battery operating temperature at 15 °C (Scenario 1) or 35 °C (Scenario 2). The other scenarios simulate more intensive uses of the vehicle, for example with commercial vehicles. Scenario 3 describes a daily vehicle driving the use of 1 h, Scenario 4 describes a daily vehicle driving use of 2 h, and Scenario 5 describes an intensive daily vehicle driving the use of 6 h. The last three scenarios are repeated from scenarios 3, 4 and 5 with the difference that the ambient temperature is 35 °C. For each Scenario, the WLTP CLASS 3B driving cycle is used as a reference as shown in Table 14. The scenarios were defined considering that the working temperature of a battery pack during the driving cycle ranges from 15 to 35 °C. From data computed at 25 °C for the driving cycle, the temperature-related ageing factor is reported in [22]. To evaluate the scenarios, the number of actual driving cycles was related to the number of daily driving cycles required for the scenarios limiting to 4184 the number of actual driving cycles performed. According to these considerations, a calendar capacity loss was computed as the difference between the daily time (24 h) and the time needed to perform driving cycles. Figure 15 deals with the loss of capacity for each step of driving cycles considered and the fitting curve.
Table 14.
Annual vehicle use scenarios.
Estimating the residual capacity of an EV battery at the end of its operational life is another important aspect for possible further uses, because it still has usable residual capacity. Refurbished EV batteries can be and advantageous alternative to brand new batteries in less stressful applications such as stationary applications. The results obtained can also be used to estimate the maximum range of a vehicle with a second-life battery. The analysis presented through the proposed scenarios is an example of possible use, and the data obtained are shown in Table 15 and Table 16. Herein a reported the remaining capacity of the battery pack for the different Scenarios along the years. Moreover, the overall C reached within the thirty percent of capacity loss and the single contributes of calendar and capacity loss.
Table 15.
Estimated capacity loss percentage in the vehicle according to the scenarios @ 15 °C.
Table 16.
Estimated capacity loss percentage in the vehicle according to the scenarios @ 35 °C.
In order to compare the effect of the different Scenarios, a 30% of capacity loss as the limit to define the useful life of the battery was assumed. In Table 15, the remaining capacity under different scenarios at the fixed temperature of 15 °C and for different yearly distances is shown. Comparing the different scenarios, a 30% of loss of capacity is reached after about 13 years for the best Scenario (Scenario 1–12.168 km/year). While in the worst case (Scenario 5–101.905 km/year) the same loss of capacity is reached after only 5 years with a consequence reduction in vehicle life of about 8 years. Similarly, in Table 16 the same yearly distance as in Table 15 is reported but at a fixed temperature of 35 °C. The proposed scenarios show a strong impact of temperature on the ageing of the electrochemical cell, which decreases from 14 years to about 3 in the best case in terms of kilometres travelled (Scenario 1 vs. Scenario 2). In the worst case in terms of kilometres (Scenario 5 vs. Scenario 8), the temperature impact decreases the lifetime of the battery pack from 5 years to about 1 year. In conclusion a data comparison of all Scenarios highlights a strong impact of temperature on both calendar and cycling ageing capacity loss; it is worth noting that in case of less intensive scenarios, calendar ageing is the most relevant contribution on the overall capacity loss because the battery spends most of the time in resting condition. On the other hand, in the case of more intensive scenarios in terms of yearly distance, the battery spends more time in driving conditions with the consequence that cycle ageing contributes more than calendar ageing.
4. Conclusions
In this manuscript are described experimental ageing tests on a lithium-ion battery for electric vehicles with up to 10% capacity loss. Experimental tests are performed to investigate Lithium-ion cell degradation under the WLTP CLASS 3B driving cycle. The Lithium-ion battery considered in this paper consists of an LMO-NMC cathode and a graphite anode with a capacity of 63 Ah used in EV applications. A vehicle model [22] was used to convert the WLTP CLASS 3B driving cycle into an electrochemical cell-level scaled current profile. The cell under test was aged at room temperature (25 °C) for a number of cycles equal to 8 test years (4184 cycles) excluding calendar ageing. IC and DV analyses were also performed to understand the evolution of the ageing process. The main outcomes of the present study are summarized below:
- A reduction in available cell capacity of 11% after 8 test years from BOL condition is found and it does not cause a large increase in the internal resistance.
- IC curve shows three different peaks mainly related to LLI and LAM of the negative electrode. Important variations are observed on the first peak, which dropped almost 36% and shifting of 5 mV to higher potential in comparison to the fresh cell after ageing.
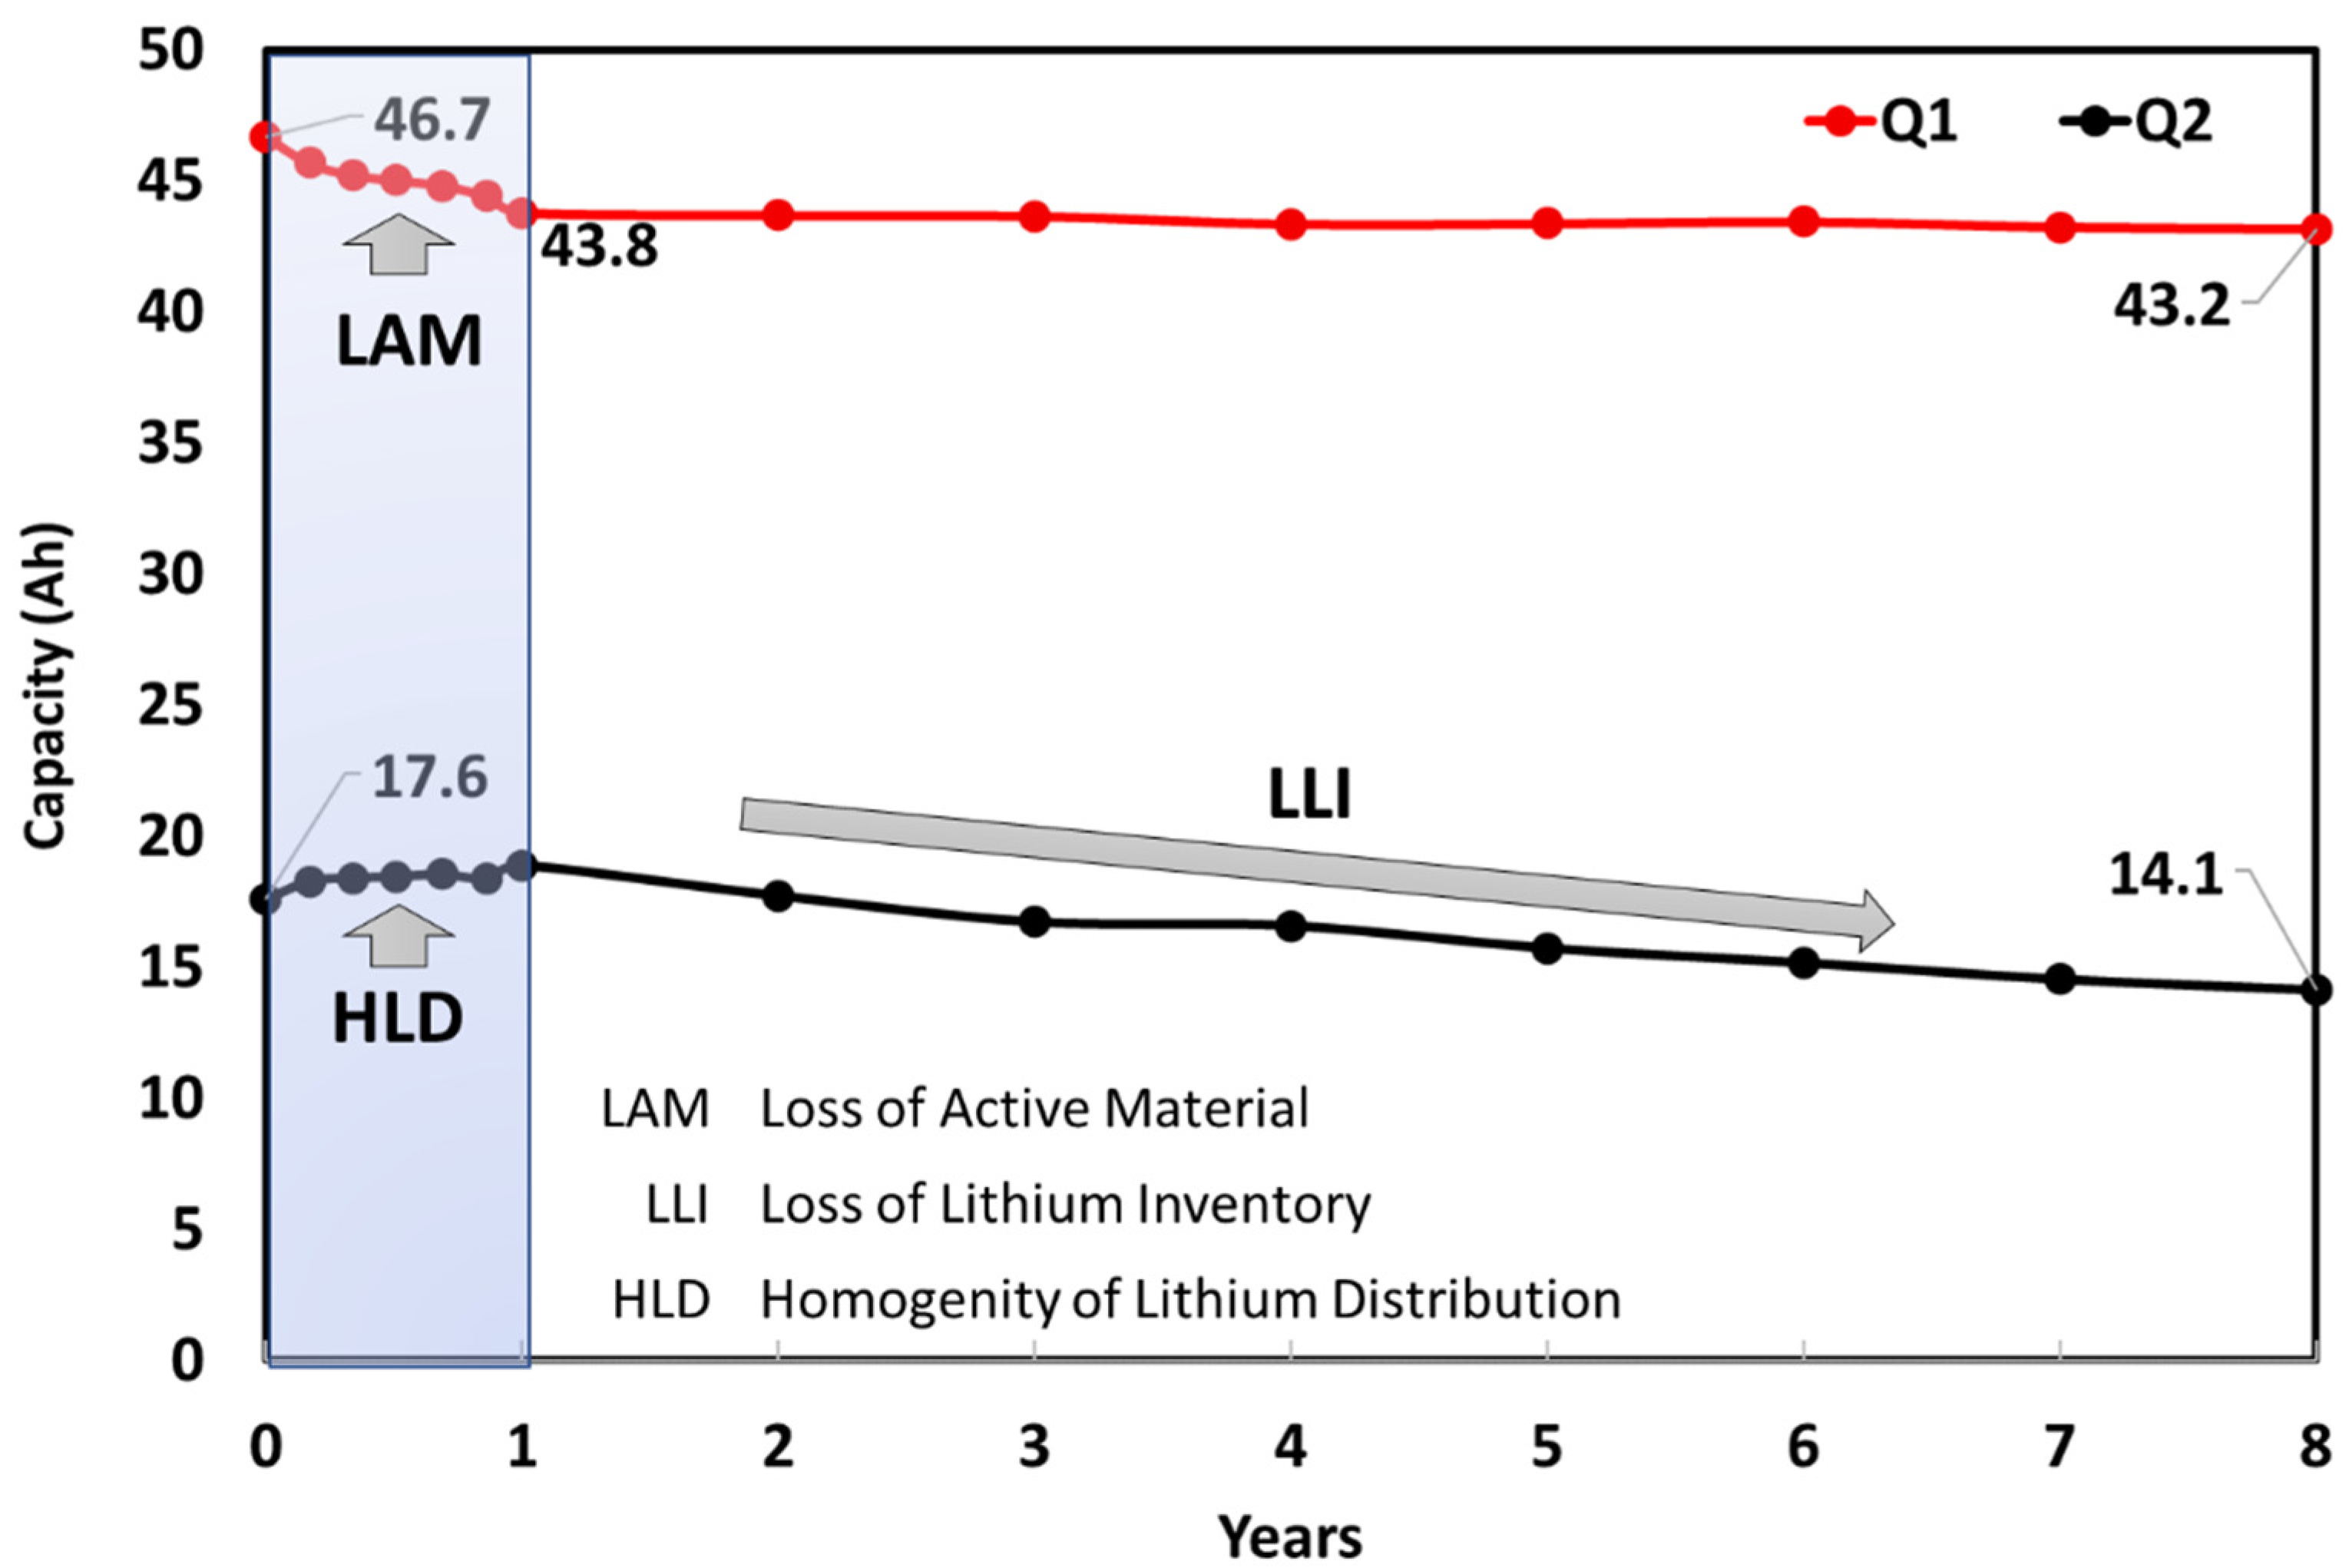
- DV analysis shows an alteration on the lithium storage capability of the graphite anode, then it is representative of anode degradation due to LAM. Q2 changing is indicative of possible LLI side reaction. An increment of peaks is noted in the first year; this evolution of peak magnitude has been related to an initial enhancement of the HLD of the cell and then to a change in graphite material or microstructure.
- From real data coming from the WLTP CLASS 3B driving cycle a mathematical model for capacitance loss from cycle ageing was extracted.
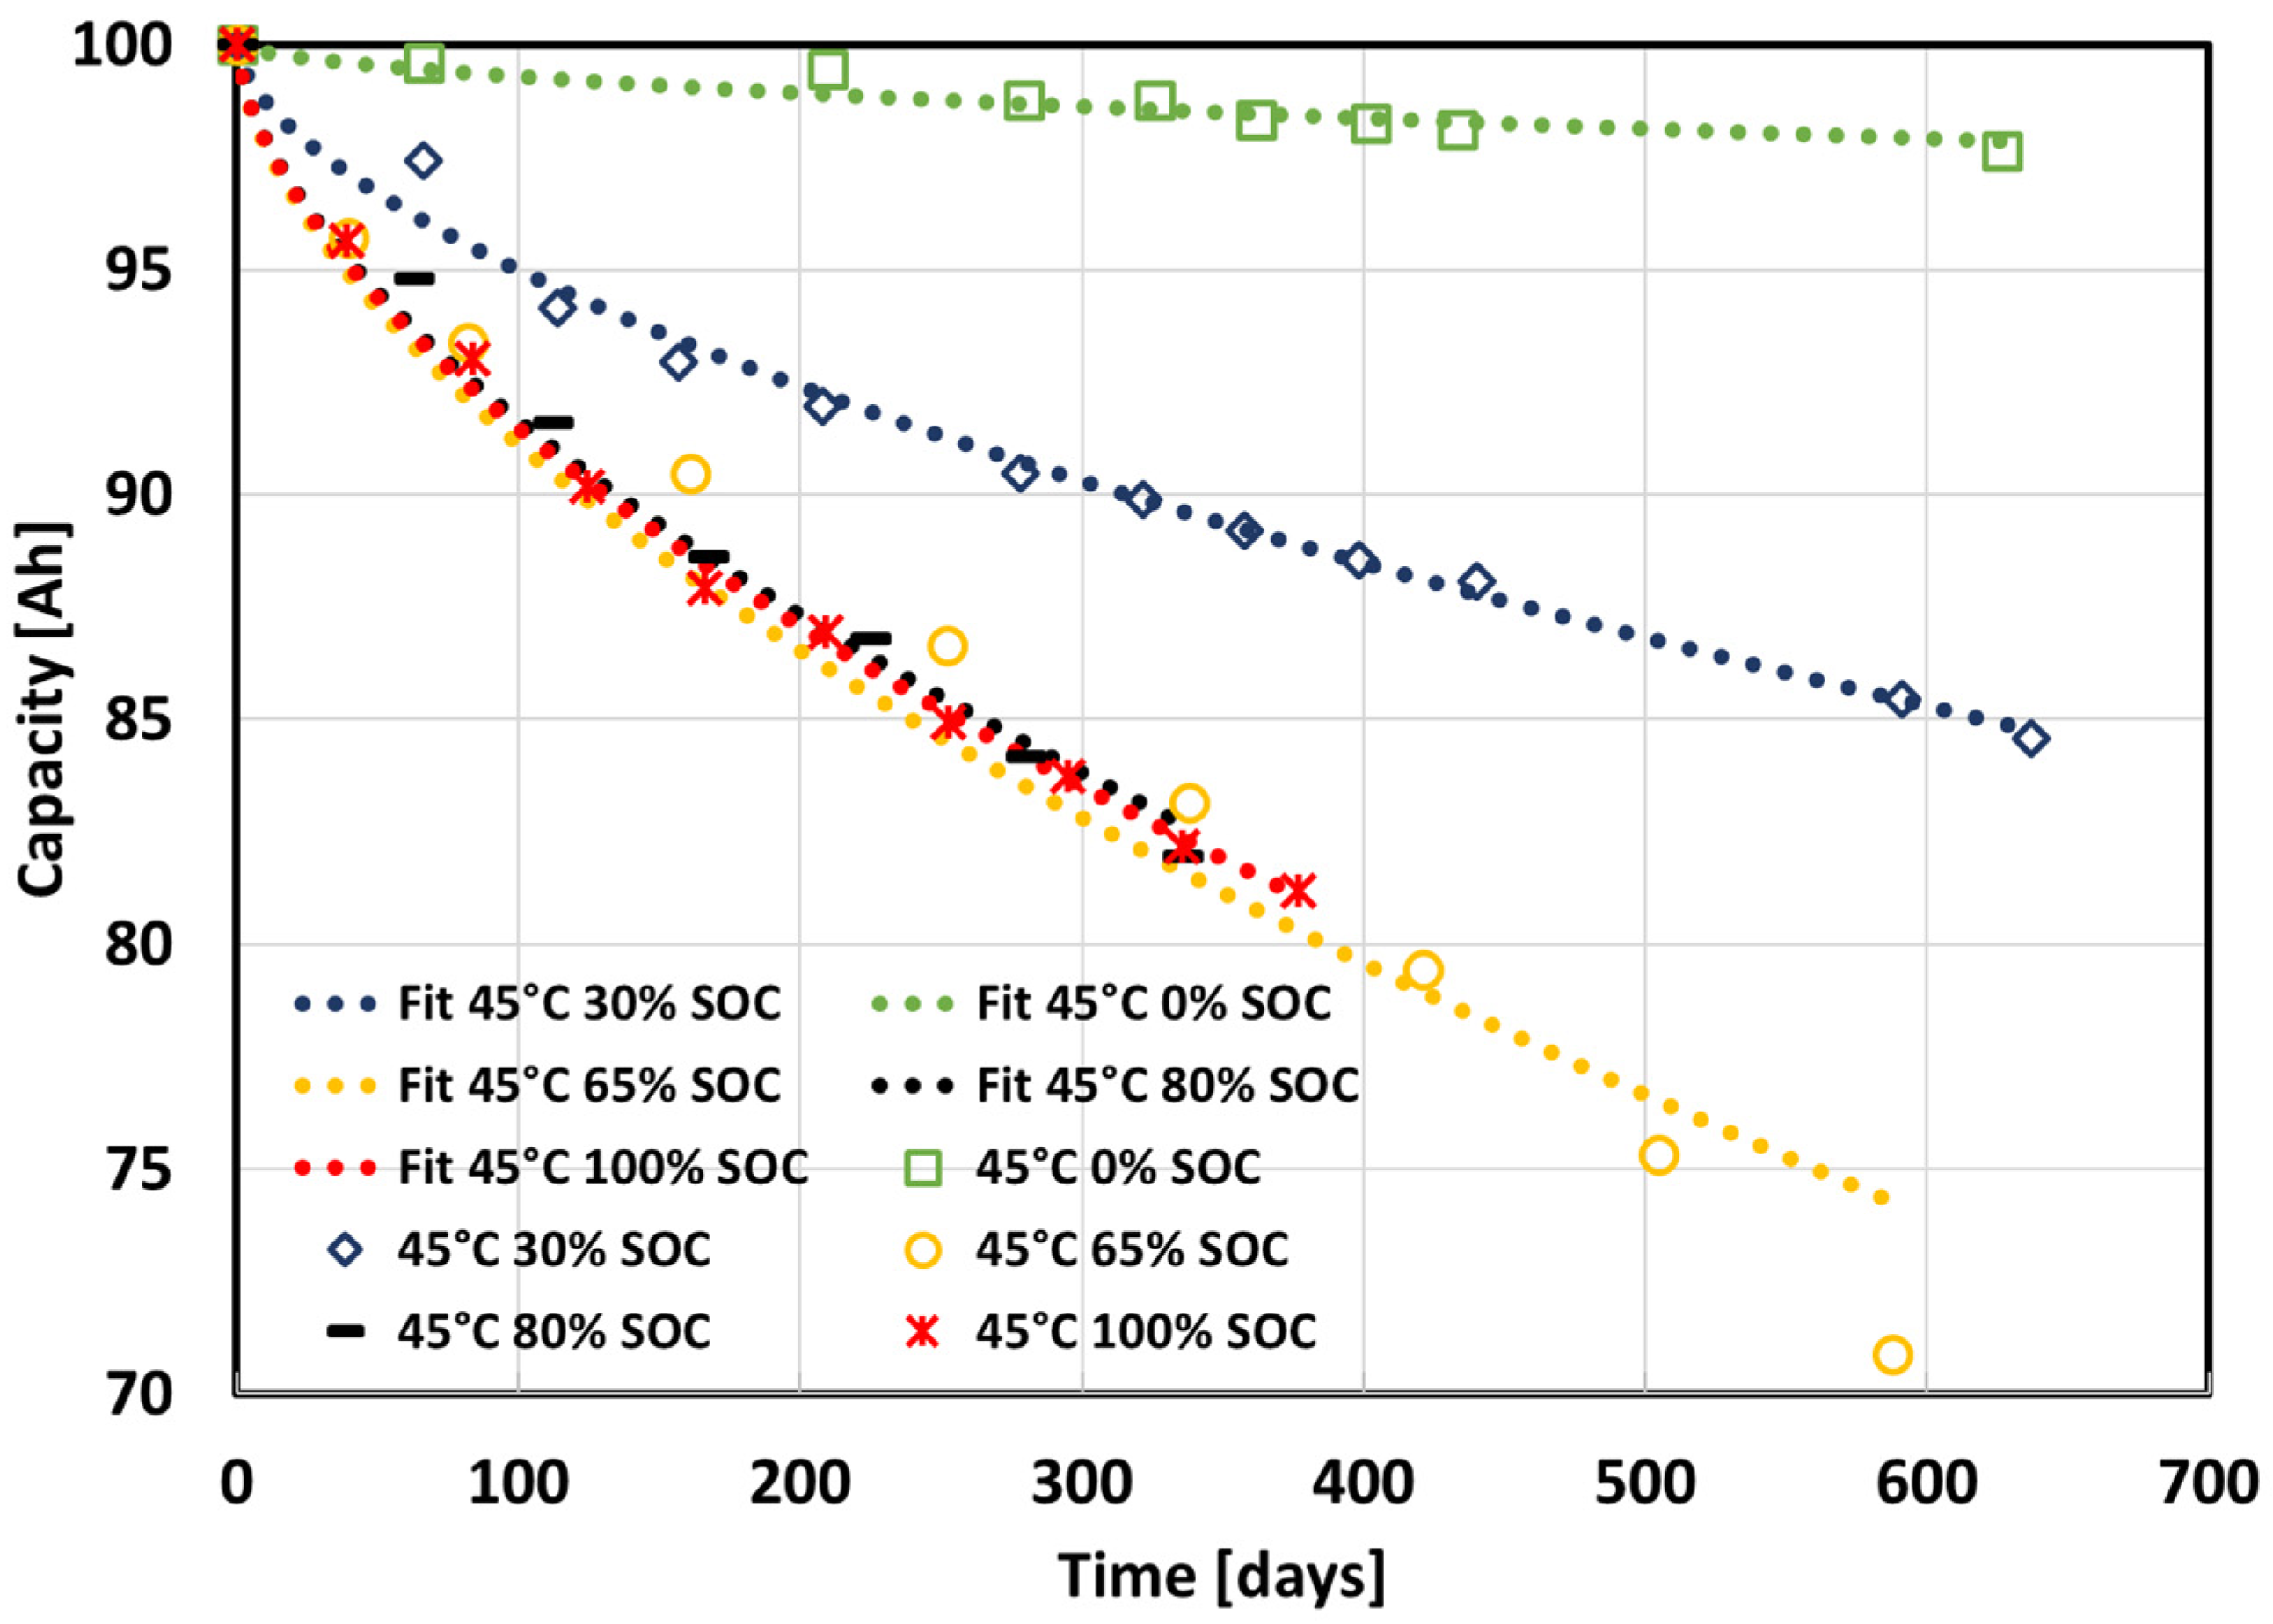
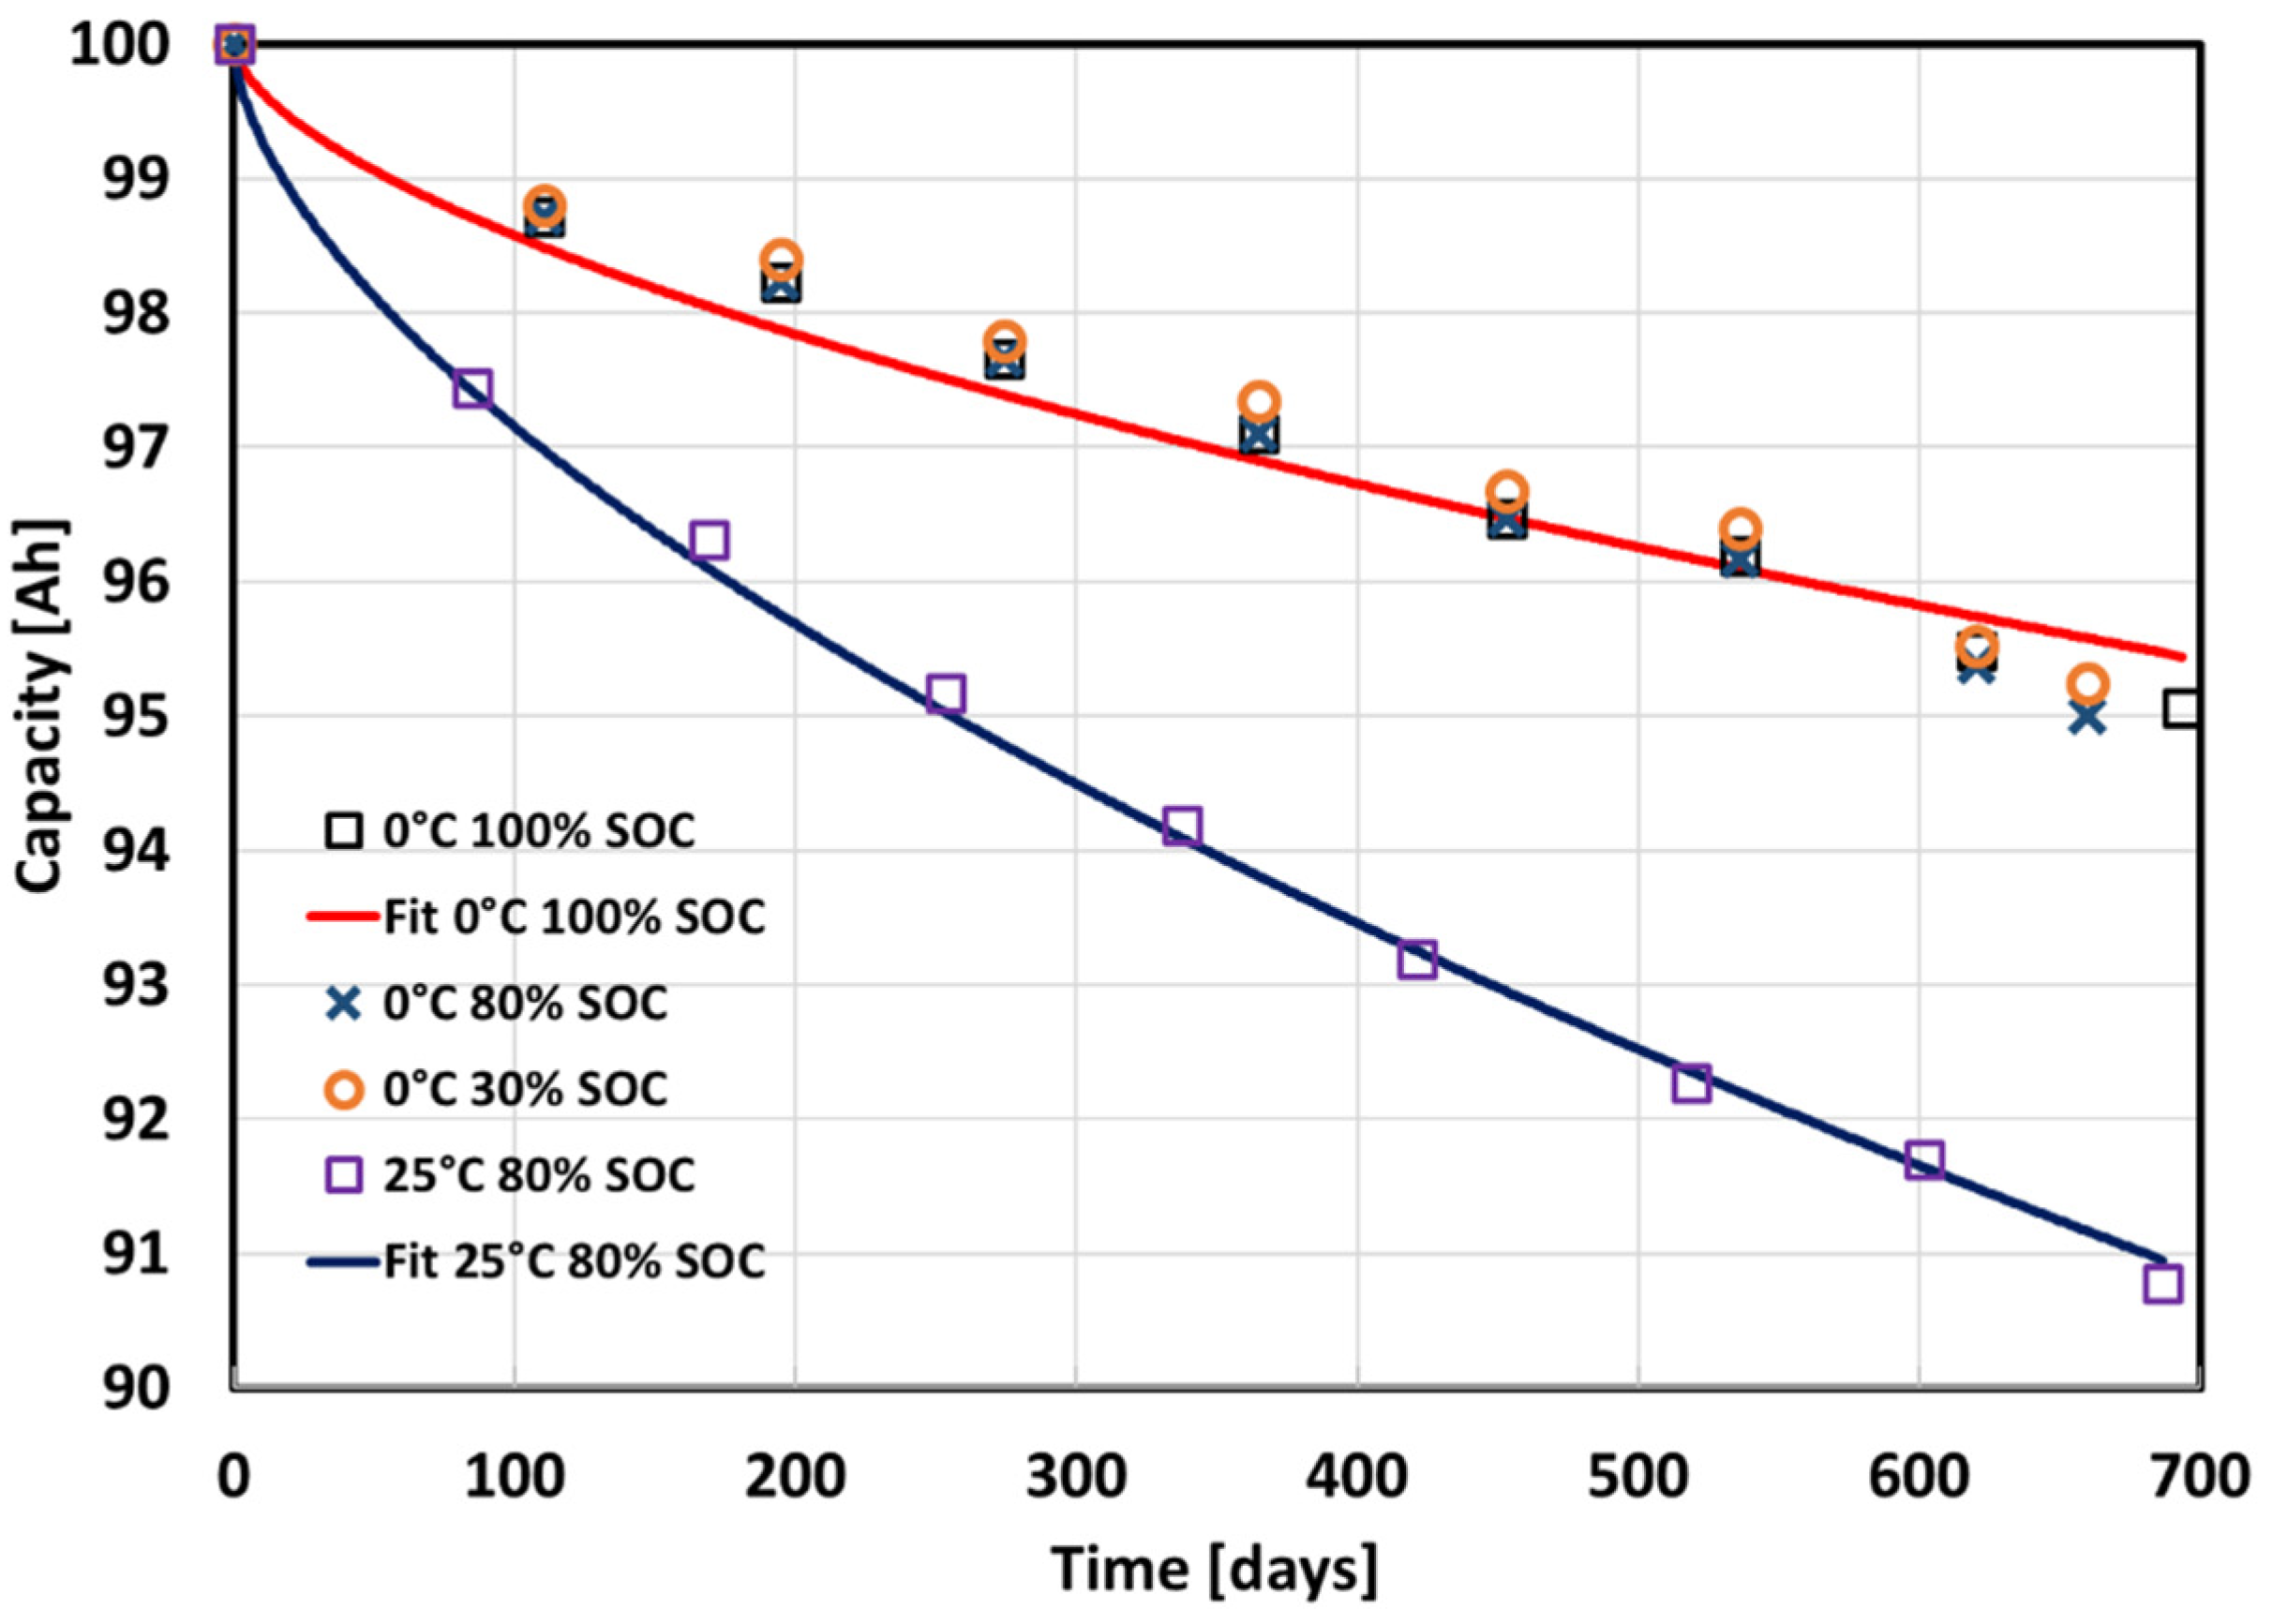
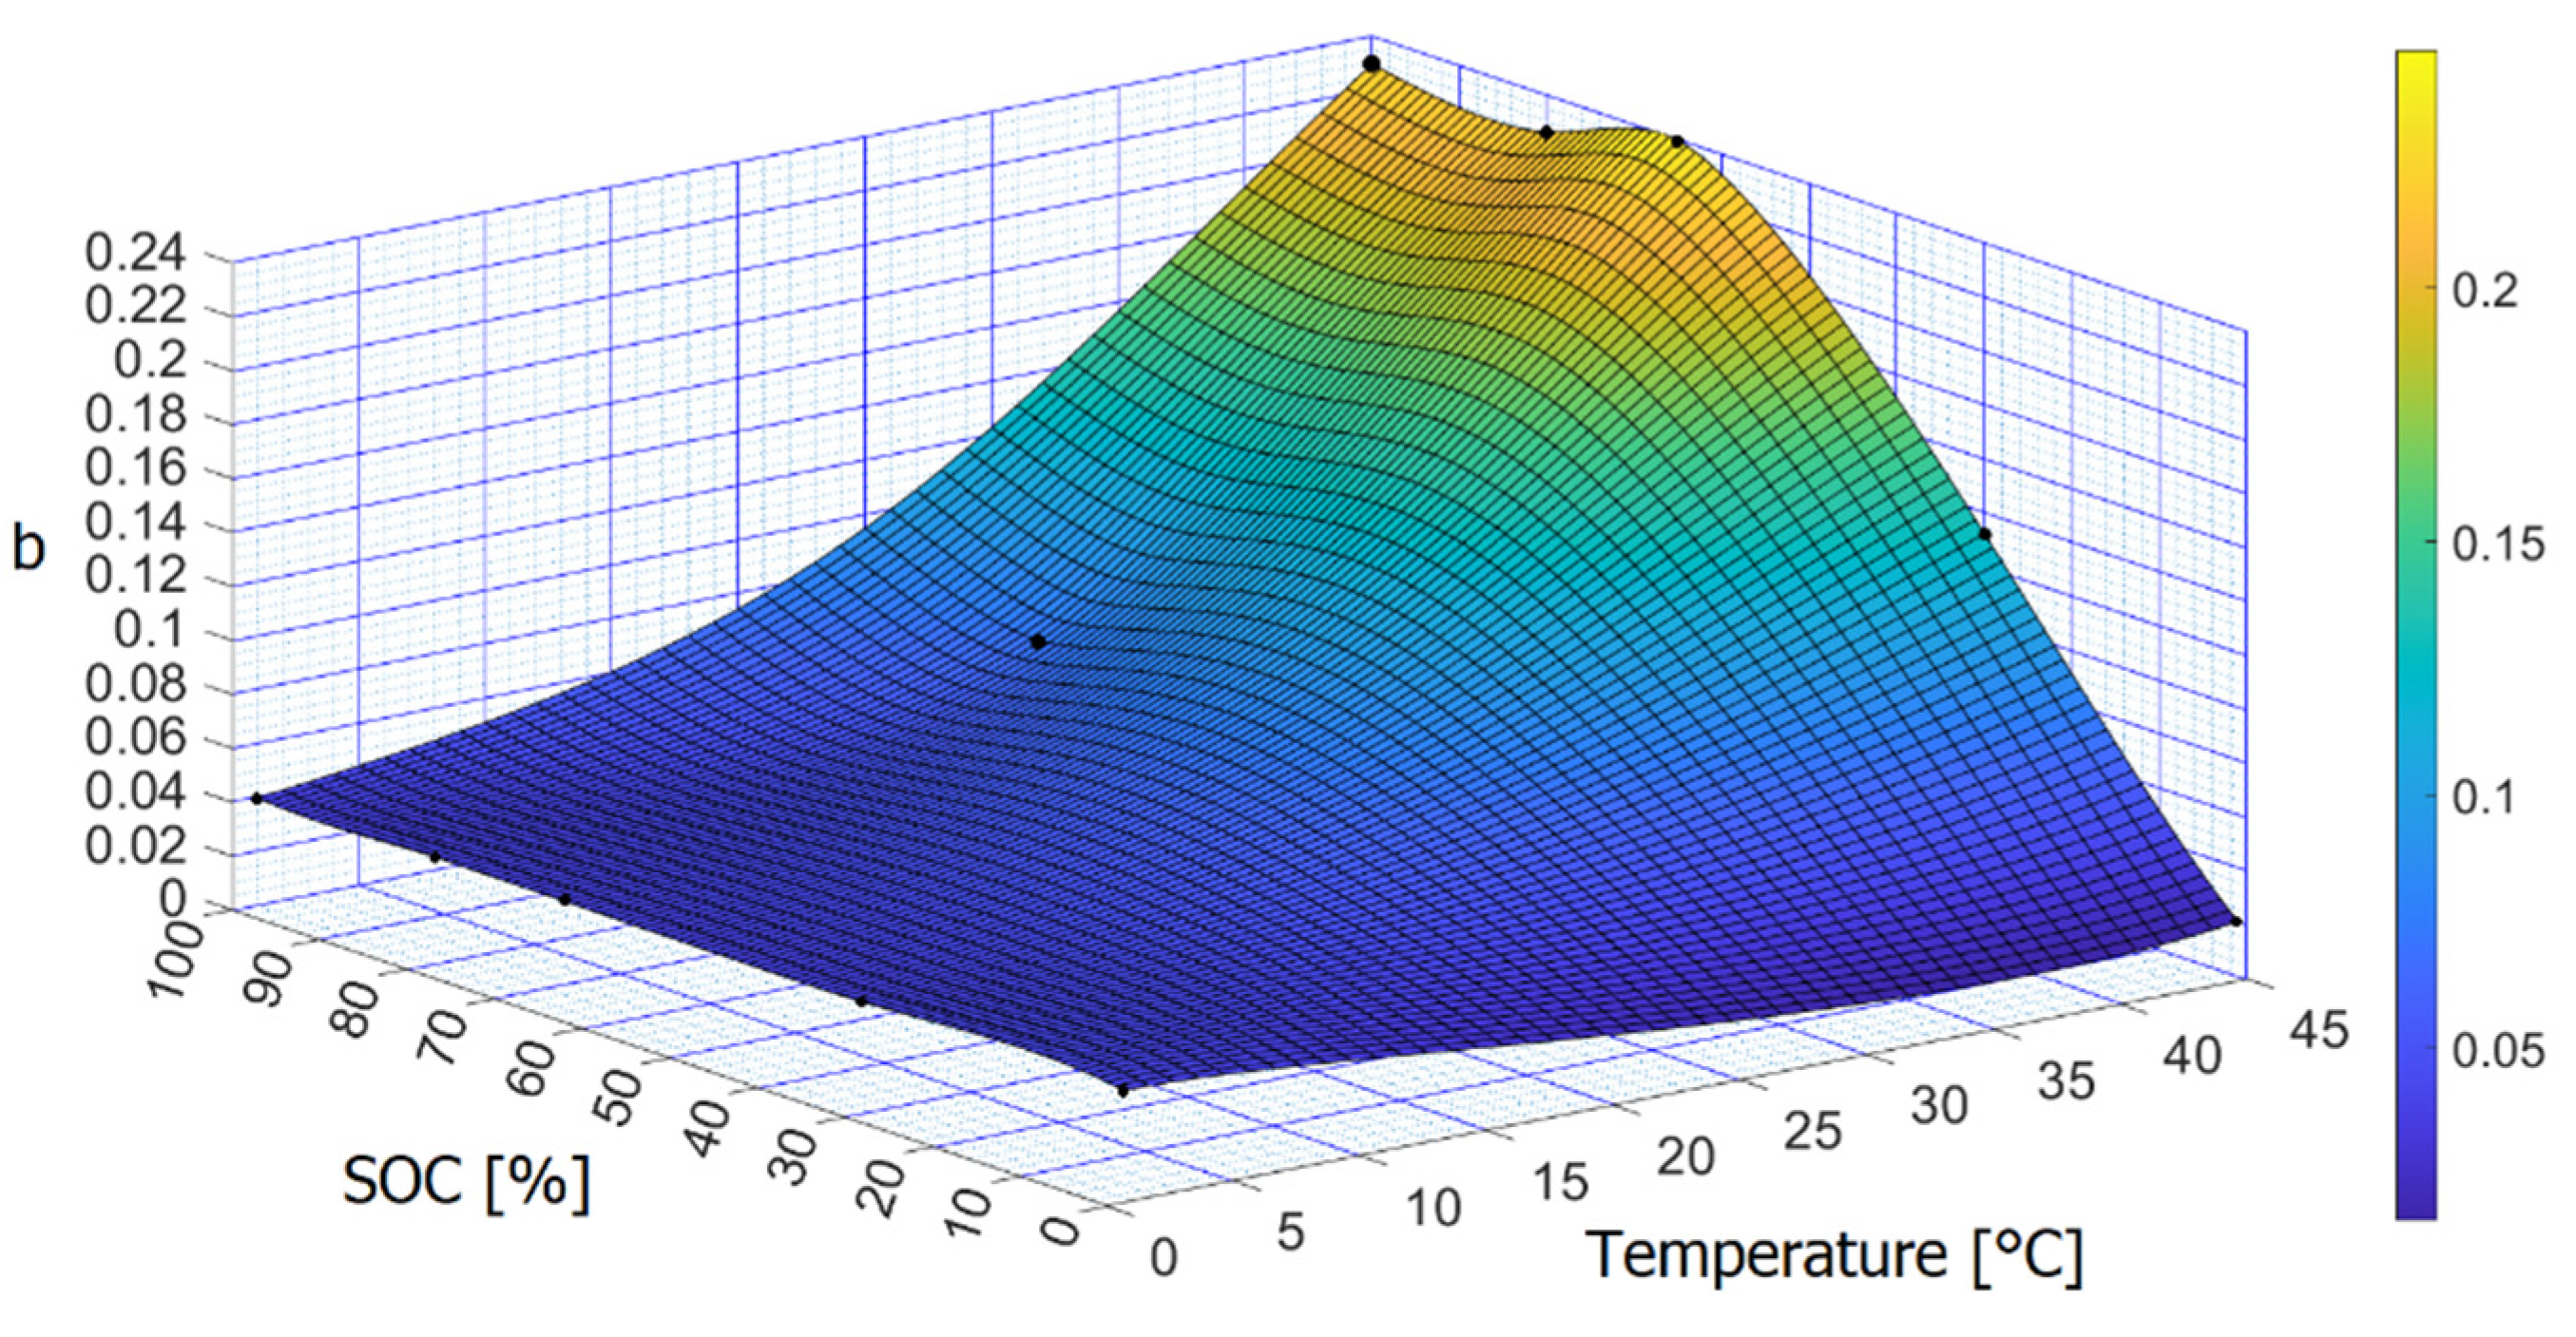
- Real data retrieved from a literature article [51] were analyzed and a mathematical curve dependent on temperature and SOC were extracted to estimate the calendar ageing.
- Total ageing was computed as the sum of the calendar and driving cycle contributions for 8 years, and different Scenarios were then evaluated in order to predict the capacity loss.
Author Contributions
Conceptualization, S.M., S.F., A.T., F.S. and G.N.; Data curation, S.M., A.T., S.D.C., L.A., D.A., S.G.L. and G.N.; Formal analysis, S.M., A.T., S.D.C., S.G.L. and G.N.; Funding acquisition, L.A.; Investigation, S.M., S.F., A.T., D.A. and G.N.; Methodology, S.M., A.T., S.D.C. and D.A.; Project administration, S.D.C. and L.A.; Software, S.M. and S.G.L.; Supervision, F.S.; Validation, S.F., A.T., S.D.C., L.A., D.A., S.G.L. and G.N.; Visualization, A.T.; Writing—original draft, S.M., L.A. and S.G.L. All authors have read and agreed to the published version of the manuscript.
Funding
This research received no external funding.
Institutional Review Board Statement
Not applicable.
Informed Consent Statement
Not applicable.
Data Availability Statement
Data were collected through laboratory tests performed at National Research Council (CNR), Advanced Energy Technology Institute (ITAE) “Nicola Giordano”. The authors can be contacted for inquiries on this subject.
Conflicts of Interest
The authors declare no conflict of interest.
References
- European Parliament. New EU Regulatory Framework for Batteries Setting Sustainability Requirements. Available online: https://www.europarl.europa.eu/RegData/etudes/BRIE/2021/689337/EPRS_BRI(2021)689337_EN.pdf (accessed on 10 March 2022).
- Hume, N.; Terazono, E.; Wilson, T. European Gas Prices Soar and Oil Tops $105 after Russia Attacks Ukraine. Financial Times. Available online: https://www.ft.com/content/c6303127-5edf-4256-9c25-effa75766002 (accessed on 24 February 2022).
- Duh, Y.-S.; Sun, Y.; Lin, X.; Zheng, J.; Wang, M.; Wang, Y.; Lin, X.; Jiang, X.; Zheng, Z.; Zheng, S.; et al. Characterization on thermal runaway of commercial 18650 lithium-ion batteries used in electric vehicles: A review. J. Energy Storage 2021, 41, 102888. [Google Scholar] [CrossRef]
- Duh, Y.-S.; Theng, J.-H.; Chen, C.-C.; Kao, C.-S. Comparative study on thermal runaway of commercial 14500, 18650 and 26650 LiFePO4 batteries used in electric vehicles. J. Energy Storage 2020, 31, 101580. [Google Scholar] [CrossRef]
- Verma, A.; Rakshit, D. Performance analysis of PCM-fin combination for heat abatement of Li-ion battery pack in electric vehicles at high ambient temperature. Therm. Sci. Eng. Prog. 2022, 32, 101314. [Google Scholar] [CrossRef]
- Eboli, L.; Mazzulla, G.; Pungillo, G. How drivers’ characteristics can affect driving style. Transp. Res. Procedia 2017, 27, 945–952. [Google Scholar] [CrossRef]
- Wang, A.; Kadam, S.; Li, H.; Shi, S.; Qi, Y. Review on modeling of the anode solid electrolyte interphase (SEI) for lithium-ion batteries. npj Comput. Mater. 2018, 4, 15. [Google Scholar] [CrossRef]
- Lin, C.; Tang, A.; Mu, H.; Wang, W.; Wang, C. Aging Mechanisms of Electrode Materials in Lithium-Ion Batteries for Electric Vehicles. J. Chem. 2015, 2015, 104673. [Google Scholar] [CrossRef]
- Zhou, W.; Hao, F.; Fang, D. The effects of elastic stiffening on the evolution of the stress field within a spherical electrode particle of lithium-ion batteries. Int. J. Appl. Mech. 2013, 5, 1350040. [Google Scholar] [CrossRef]
- Christensen, J.; Newman, J. A Mathematical Model of Stress Generation and Fracture in Lithium Manganese Oxide. J. Electrochem. Soc. 2006, 153, A1019. [Google Scholar] [CrossRef]
- Zhou, W. Effects of external mechanical loading on stress generation during lithiation in Li-ion battery electrodes. Electrochimica Acta 2015, 185, 28–33. [Google Scholar] [CrossRef]
- Vetter, J.; Novák, P.; Wagner, M.R.; Veit, C.; Möller, K.-C.; Besenhard, J.O.; Winter, M.; Wohlfahrt-Mehrens, M.; Vogler, C.; Hammouche, A. Ageing mechanisms in lithium-ion batteries. J. Power Sources 2005, 147, 269–281. [Google Scholar] [CrossRef]
- Birkl, C.R.; Roberts, M.R.; McTurk, E.; Bruce, P.G.; Howey, D.A. Degradation diagnostics for lithium ion cells. J. Power Sources 2017, 341, 373–386. [Google Scholar] [CrossRef]
- Barré, A.; Deguilhem, B.; Grolleau, S.; Gérard, M.; Suard, F.; Riu, D. A review on lithium-ion battery ageing mechanisms and estimations for automotive applications. J. Power Sources 2013, 241, 680–689. [Google Scholar] [CrossRef]
- Gailani, A.; Mokidm, R.; El-Dalahmeh, M.; El-Dalahmeh, M.; Al-Greer, M. Analysis of Lithium-ion Battery Cells Degradation Based on Different Manufacturers. In Proceedings of the 2020 55th International Universities Power Engineering Conference (UPEC), Turin, Italy, 1–4 September 2020. [Google Scholar] [CrossRef]
- Su, L.; Wu, M.; Li, Z.; Zhang, J. Cycle life prediction of lithium-ion batteries based on data-driven methods. eTransportation 2021, 10, 100137. [Google Scholar] [CrossRef]
- Svens, P.; Smith, A.J.; Groot, J.; Lacey, M.J.; Lindbergh, G.; Lindstrom, R.W. Evaluating Performance and Cycle Life Improvements in the Latest Generations of Prismatic Lithium-Ion Batteries. IEEE Trans. Transp. Electrif. 2022, 8, 3696–3706. [Google Scholar] [CrossRef]
- Gandoman, F.H.; Jaguemont, J.; Goutam, S.; Gopalakrishnan, R.; Firouz, Y.; Kalogiannis, T.; Omar, N.; Van Mierlo, J. Concept of reliability and safety assessment of lithium-ion batteries in electric vehicles: Basics, progress, and challenges. Appl. Energy 2019, 251, 113343. [Google Scholar] [CrossRef]
- Jaguemont, J.; Boulon, L.; Dubé, Y. A comprehensive review of lithium-ion batteries used in hybrid and electric vehicles at cold temperatures. Appl. Energy 2016, 164, 99–114. [Google Scholar] [CrossRef]
- Choi, D.; Wang, D.; Viswanathan, V.V.; Bae, I.-T.; Wang, W.; Nie, Z.; Zhang, J.-G.; Graff, G.L.; Liu, J.; Yang, Z.; et al. Li-ion batteries from LiFePO4 cathode and anatase/graphene composite anode for stationary energy storage. Electrochem. Commun. 2010, 12, 378–381. [Google Scholar] [CrossRef]
- Hesse, H.C.; Schimpe, M.; Kucevic, D.; Jossen, A. Lithium-Ion Battery Storage for the Grid—A Review of Stationary Battery Storage System Design Tailored for Applications in Modern Power Grids. Energies 2017, 10, 2107. [Google Scholar] [CrossRef]
- Micari, S.; Foti, S.; Testa, A.; De Caro, S.; Sergi, F.; Andaloro, L.; Aloisio, D.; Napoli, G. Reliability assessment and lifetime prediction of Li-ion batteries for electric vehicles. Electr Eng. 2022, 104, 165–177. [Google Scholar] [CrossRef]
- Stroe, D.-I.; Schaltz, E. Lithium-Ion Battery State-of-Health Estimation Using the Incremental Capacity Analysis Technique. IEEE Trans. Ind. Appl. 2020, 56, 678–685. [Google Scholar] [CrossRef]
- Orecchini, F.; Santiangeli, A.; Zuccari, F. Real Drive Well-to-Wheel Energy Analysis of Conventional and Electrified Car Powertrains. Energies 2020, 13, 4788. [Google Scholar] [CrossRef]
- Luigi, F.; Tarsitano, D. Modeling of Full Electric and Hybrid Electric Vehicles. In New Generation of Electric Vehicles; Chapter 7; IntechOpen: London, UK, 2012. [Google Scholar] [CrossRef]
- Technical Specifications. BMW i3 (120 Ah). Available online: https://www.press.bmwgroup.com/global/article/attachment/T0284828EN/415571 (accessed on 12 December 2020).
- Ahern, A.; Weyman, G.; Redelbach, M. Analysis of National Travel Statistics in Europe. Available online: https://publications.jrc.ec.europa.eu/repository/bitstream/JRC83304/tch-d2.1_final.pdf (accessed on 3 July 2022).
- Hemavathi, S.; Shinisha, A. A study on trends and developments in electric vehicle charging technologies. J. Energy Storage 2022, 52, 105013. [Google Scholar] [CrossRef]
- Barai, A.; Uddin, K.; Widanage, W.D.; McGordon, A.; Jennings, P. A study of the influence of measurement timescale on internal resistance characterisation methodologies for lithium-ion cells. Sci. Rep. 2018, 8, 21. [Google Scholar] [CrossRef] [PubMed]
- Xie, W.; He, R.; Gao, X.; Li, X.; Wang, H.; Liu, X.; Yan, X.; Yang, S. Degradation identification of LiNi0.8Co0.1Mn0.1O2/graphite lithium-ion batteries under fast charging conditions. Electrochim. Acta 2021, 392, 138979. [Google Scholar] [CrossRef]
- Pastor-Fernández, C.; Yu, T.F.; Widanage, W.D.; Marco, J. Critical review of non-invasive diagnosis techniques for quantification of degradation modes in lithium-ion batteries. Renew. Sustain. Energy Rev. 2019, 109, 138–159. [Google Scholar] [CrossRef]
- Li, Y.; Abdel-Monem, M.; Gopalakrishnan, R.; Berecibar, M.; Nanini-Maury, E.; Omar, N.; van den Bossche, P.; Van Mierlo, J. A quick on-line state of health estimation method for Li-ion battery with incremental capacity curves processed by Gaussian filter. J. Power Sources 2018, 373, 40–53. [Google Scholar] [CrossRef]
- Leonardi, S.G.; Aloisio, D.; Brunaccini, G.; Stassi, A.; Ferraro, M.; Antonucci, V.; Sergi, F. Investigation on the ageing mechanism for a lithium-ion cell under accelerated tests: The case of primary frequency regulation service. J. Energy Storage 2021, 41, 102904. [Google Scholar] [CrossRef]
- Dubarry, M.; Truchot, C.; Cugnet, M.; Liaw, B.Y.; Gering, K.; Sazhin, S.; Jamison, D.; Michelbacher, C. Evaluation of commercial lithium-ion cells based on composite positive electrode for plug-in hybrid electric vehicle applications. Part I: Initial characterizations. J. Power Sources 2011, 196, 10328–10335. [Google Scholar] [CrossRef]
- Dubarry, M.; Truchot, C.; Liaw, B.Y. Synthesize battery degradation modes via a diagnostic and prognostic model. J. Power Sources 2012, 219, 204–216. [Google Scholar] [CrossRef]
- Pastor-Fernández, C.; Uddin, K.; Chouchelamane, G.H.; Widanage, W.D.; Marco, J. A Comparison between Electrochemical Impedance Spectroscopy and Incremental Capacity-Differential Voltage as Li-ion Diagnostic Techniques to Identify and Quantify the Effects of Degradation Modes within Battery Management Systems. J. Power Sources 2017, 360, 301–318. [Google Scholar] [CrossRef]
- Krupp, A.; Ferg, E.; Schuldt, F.; Derendorf, K.; Agert, C. Incremental Capacity Analysis as a State of Health Estimation Method for Lithium-Ion Battery Modules with Series-Connected Cells. Batteries 2021, 7, 2. [Google Scholar] [CrossRef]
- Dubarry, M.; Truchot, C.; Liaw, B.Y.; Gering, K.; Sazhin, S.; Jamison, D.; Michelbacher, C. Evaluation of commercial lithium-ion cells based on composite positive electrode for plug-in hybrid electric vehicle applications. Part II. Degradation mechanism under 2C cycle aging. J. Power Sources 2011, 196, 10336–10343. [Google Scholar] [CrossRef]
- Fath, J.P.; Dragicevic, D.; Bittel, L.; Nuhic, A.; Sieg, J.; Hahn, S.; Alsheimer, L.; Spier, B.; Wetzel, T. Quantification of aging mechanisms and inhomogeneity in cycled lithium-ion cells by differential voltage analysis. J. Energy Storage 2019, 25, 100813. [Google Scholar] [CrossRef]
- Gyenes, B.; Stevens, D.A.; Chevrier, V.; Dahn, J.R. Understanding Anomalous Behavior in Coulombic Efficiency Measurements on Li-Ion Batteries. J. Electrochem. Soc. 2014, 162, A278–A283. [Google Scholar] [CrossRef]
- Keil, P.; Schuster, S.F.; Wilhelm, J.; Travi, J.; Hauser, A.; Karl, R.C.; Jossen, A. Calendar Aging of Lithium-Ion Batteries. J. Electrochem. Soc. 2016, 163, A1872–A1880. [Google Scholar] [CrossRef]
- O’Kane, S.E.J.; Ai, W.; Madabattula, G.; Alonso-Alvarez, D.; Timms, R.; Sulzer, V.; Edge, J.S.; Wu, B.; Offer, G.J.; Marinescu, M. Lithium-ion battery degradation: How to model it. Phys. Chem. Chem. Phys. 2022, 24, 7909–7922. [Google Scholar] [CrossRef] [PubMed]
- Xu, J.; Deshpande, R.D.; Pan, J.; Cheng, Y.-T.; Battaglia, V.S. Electrode Side Reactions, Capacity Loss and Mechanical Degradation in Lithium-Ion Batteries. J. Electrochem. Soc. 2015, 162, A2026–A2035. [Google Scholar] [CrossRef]
- Stiaszny, B.; Ziegler, J.C.; Krauß, E.E.; Schmidt, J.P.; Ivers-Tiffée, E. Electrochemical characterization and post-mortem analysis of aged LiMn2O4–Li(Ni0.5Mn0.3Co0.2)O2/graphite lithium ion batteries. Part I: Cycle aging. J. Power Sources 2014, 251, 439–450. [Google Scholar] [CrossRef]
- Smith, A.J.; Svens, P.; Varini, M.; Lindbergh, G.; Lindström, R.W. Expanded In Situ Aging Indicators for Lithium-Ion Batteries with a Blended NMC-LMO Electrode Cycled at Sub-Ambient Temperature. J. Electrochem. Soc. 2021, 168, 110530. [Google Scholar] [CrossRef]
- Lewerenz, M.; Sauer, D.U. Evaluation of cyclic aging tests of prismatic automotive LiNiMnCoO2-Graphite cells considering influence of homogeneity and anode overhang. J. Energy Storage 2018, 18, 421–434. [Google Scholar] [CrossRef]
- Lewerenz, M.; Dechent, P.; Sauer, D.U. Investigation of capacity recovery during rest period at different states-of-charge after cycle life test for prismatic Li(Ni1/3Mn1/3Co1/3)O2-graphite cells. J. Energy Storage 2019, 21, 680–690. [Google Scholar] [CrossRef]
- Sieg, J.; Storch, M.; Fath, J.; Nuhic, A.; Bandlow, J.; Spier, B.; Sauer, D.U. Local degradation and differential voltage analysis of aged lithium-ion pouch cells. J. Energy Storage 2020, 30, 101582. [Google Scholar] [CrossRef]
- Lewerenz, M.; Marongiu, A.; Warnecke, A.; Sauer, D.U. Differential voltage analysis as a tool for analyzing inhomogeneous aging: A case study for LiFePO4|Graphite cylindrical cells. J. Power Sources 2017, 368, 57–67. [Google Scholar] [CrossRef]
- Lewerenz, M.; Münnix, J.; Schmalstieg, J.; Käbitz, S.; Knips, M.; Sauer, D.U. Systematic aging of commercial LiFePO 4 |Graphite cylindrical cells including a theory explaining rise of capacity during aging. J. Power Sources 2017, 345, 254–263. [Google Scholar] [CrossRef]
- Montaru, M.; Fiette, S.; Koné, J.-L.; Bultel, Y. Calendar ageing model of Li-ion battery combining physics-based and empirical approaches. J. Energy Storage 2022, 51, 104544. [Google Scholar] [CrossRef]
- Eddahech, A.; Briat, O.; Woirgard, E.; Vinassa, J. Remaining useful life prediction of lithium batteries in calendar ageing for automotive applications. Microelectron. Reliab. 2012, 52, 2438–2442. [Google Scholar] [CrossRef]
- Kebede, A.A.; Hosen, S.; Messagie, M.; Behabtu, H.A.; Jemal, T.; Van Mierlo, J.; Coosemans, T.; Berecibar, M. Development of a lifetime model for large format nickel-manganese-cobalt oxide-based lithium-ion cell validated using a real-life profile. J. Energy Storage 2022, 50, 104289. [Google Scholar] [CrossRef]
- Belt, J.; Utgikar, V.; Bloom, I. Calendar and PHEV cycle life aging of high-energy, lithium-ion cells containing blended spinel and layered-oxide cathodes. J. Power Sources 2011, 196, 10213–10221. [Google Scholar] [CrossRef]
- Schmalstieg, J.; Käbitz, S.; Ecker, M.; Sauer, D.U. A holistic aging model for Li(NiMnCo)O2 based 18650 lithium-ion batteries. J. Power Sources 2014, 257, 325–334. [Google Scholar] [CrossRef]
- National Centers for Environmental Information. Past-Weather in Messina, Italy. 2022. Available online: https://www.ncei.noaa.gov/access/past-weather/messina (accessed on 20 July 2022).
- Pevec, D.; Babic, J.; Carvalho, A.; Ghiassi-Farrokhfal, Y.; Ketter, W.; Podobnik, V. Electric Vehicle Range Anxiety: An Obstacle for the Personal Transportation (R)evolution? In Proceedings of the 2019 4th International Conference on Smart and Sustainable Technologies (SpliTech), Split, Croatia, 18–21 June 2019. [Google Scholar] [CrossRef]
- Napoli, G.; Micari, S.; Dispenza, G.; Andaloro, L.; Antonucci, V.; Polimeni, A. Freight distribution with electric vehicles: A case study in Sicily. RES, infrastructures and vehicle routing. Transp. Eng. 2021, 3, 100047. [Google Scholar] [CrossRef]
Publisher’s Note: MDPI stays neutral with regard to jurisdictional claims in published maps and institutional affiliations. |
© 2022 by the authors. Licensee MDPI, Basel, Switzerland. This article is an open access article distributed under the terms and conditions of the Creative Commons Attribution (CC BY) license (https://creativecommons.org/licenses/by/4.0/).