Article

Optimization of Proton Exchange Membrane Electrolyzer Cell Design Using Machine Learning

1
School of Mechanical Engineering, Chungbuk National University, Cheongju 28644, Korea
2
School of Electrical and Computer Engineering, Chungbuk National University, Cheongju 28644, Korea
3
Physics and Engineering Department, North Park University, Chicago, IL 60625, USA
*
Author to whom correspondence should be addressed.
Energies 2022, 15(18), 6657; https://doi.org/10.3390/en15186657
Submission received: 12 August 2022 / Revised: 30 August 2022 / Accepted: 7 September 2022 / Published: 12 September 2022
(This article belongs to the Section F5: Artificial Intelligence and Smart Energy)

Abstract

:

Highlights

What are the main findings?
  • A dataset of PEM water electrolysis was constructed for machine learning purposes.
  • Machine learning can be used for optimal PEM water electrolyzer cell design.
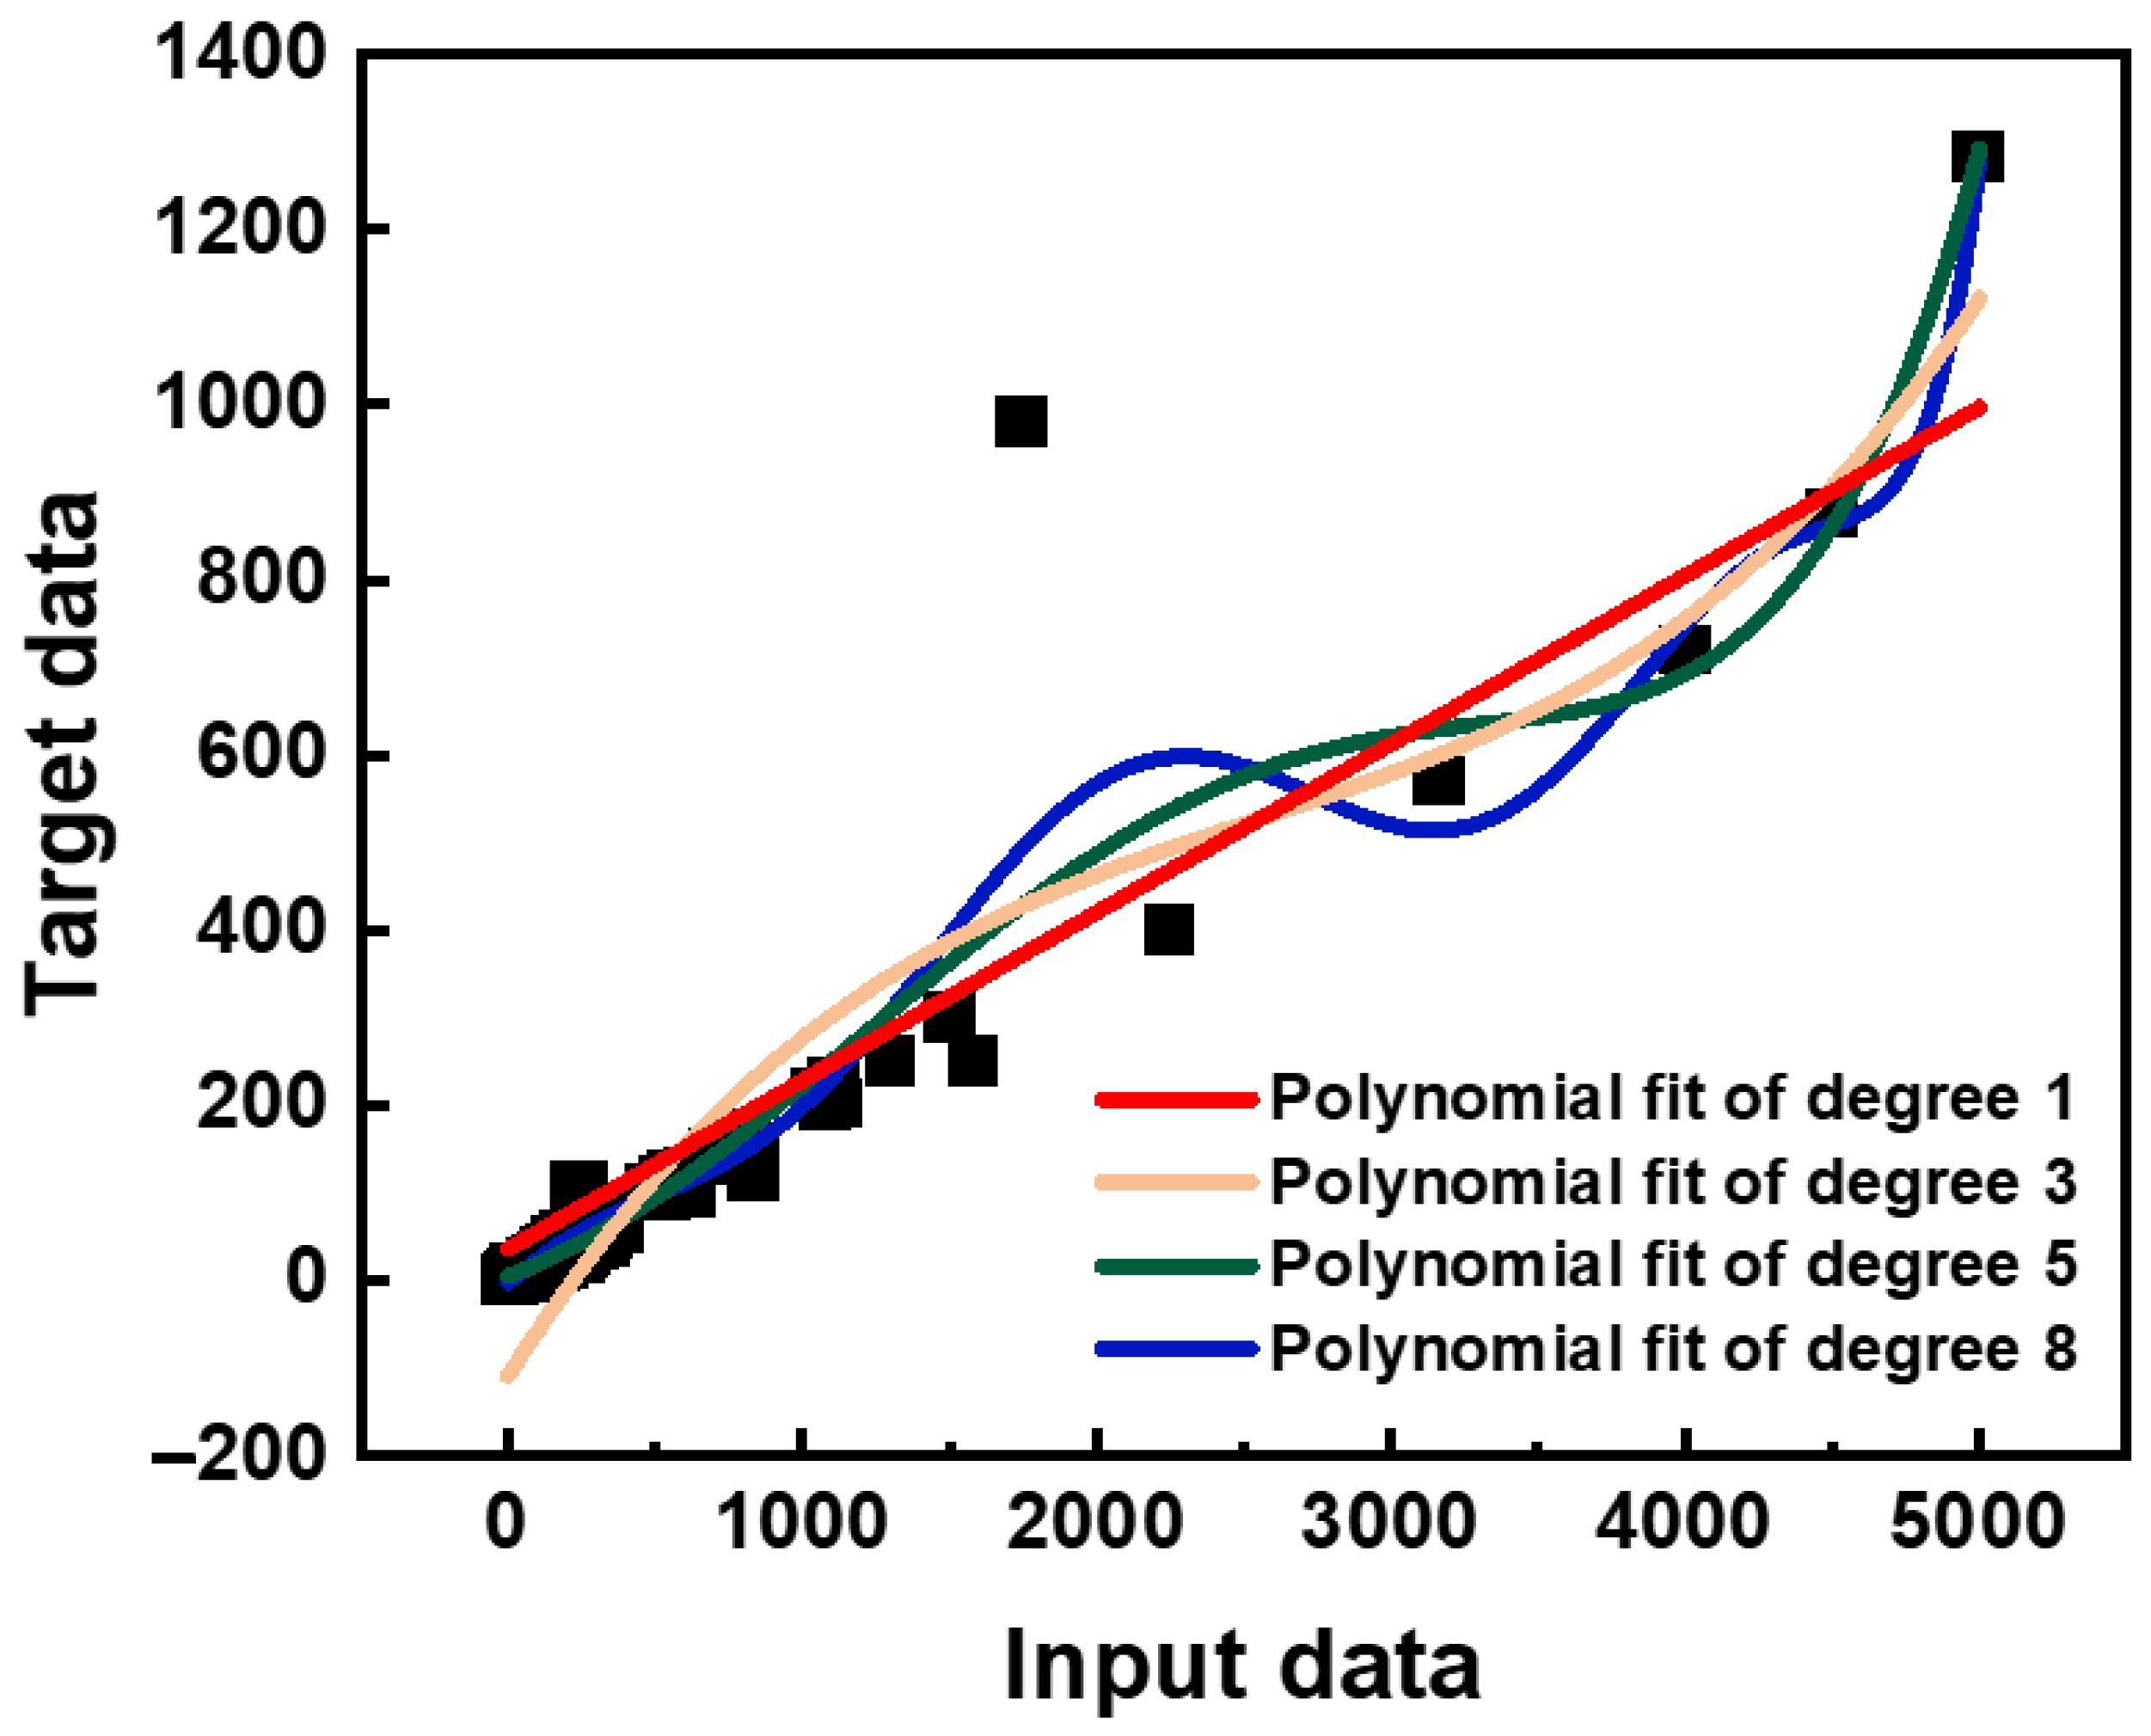
  • Adaptive degree prediction can be employed to optimize the polynomial regression models.
What is the implication of the main finding?
  • The proposed model can predict the cell design parameters for small-scale and commercial-scale PEM water electrolyzer cells.
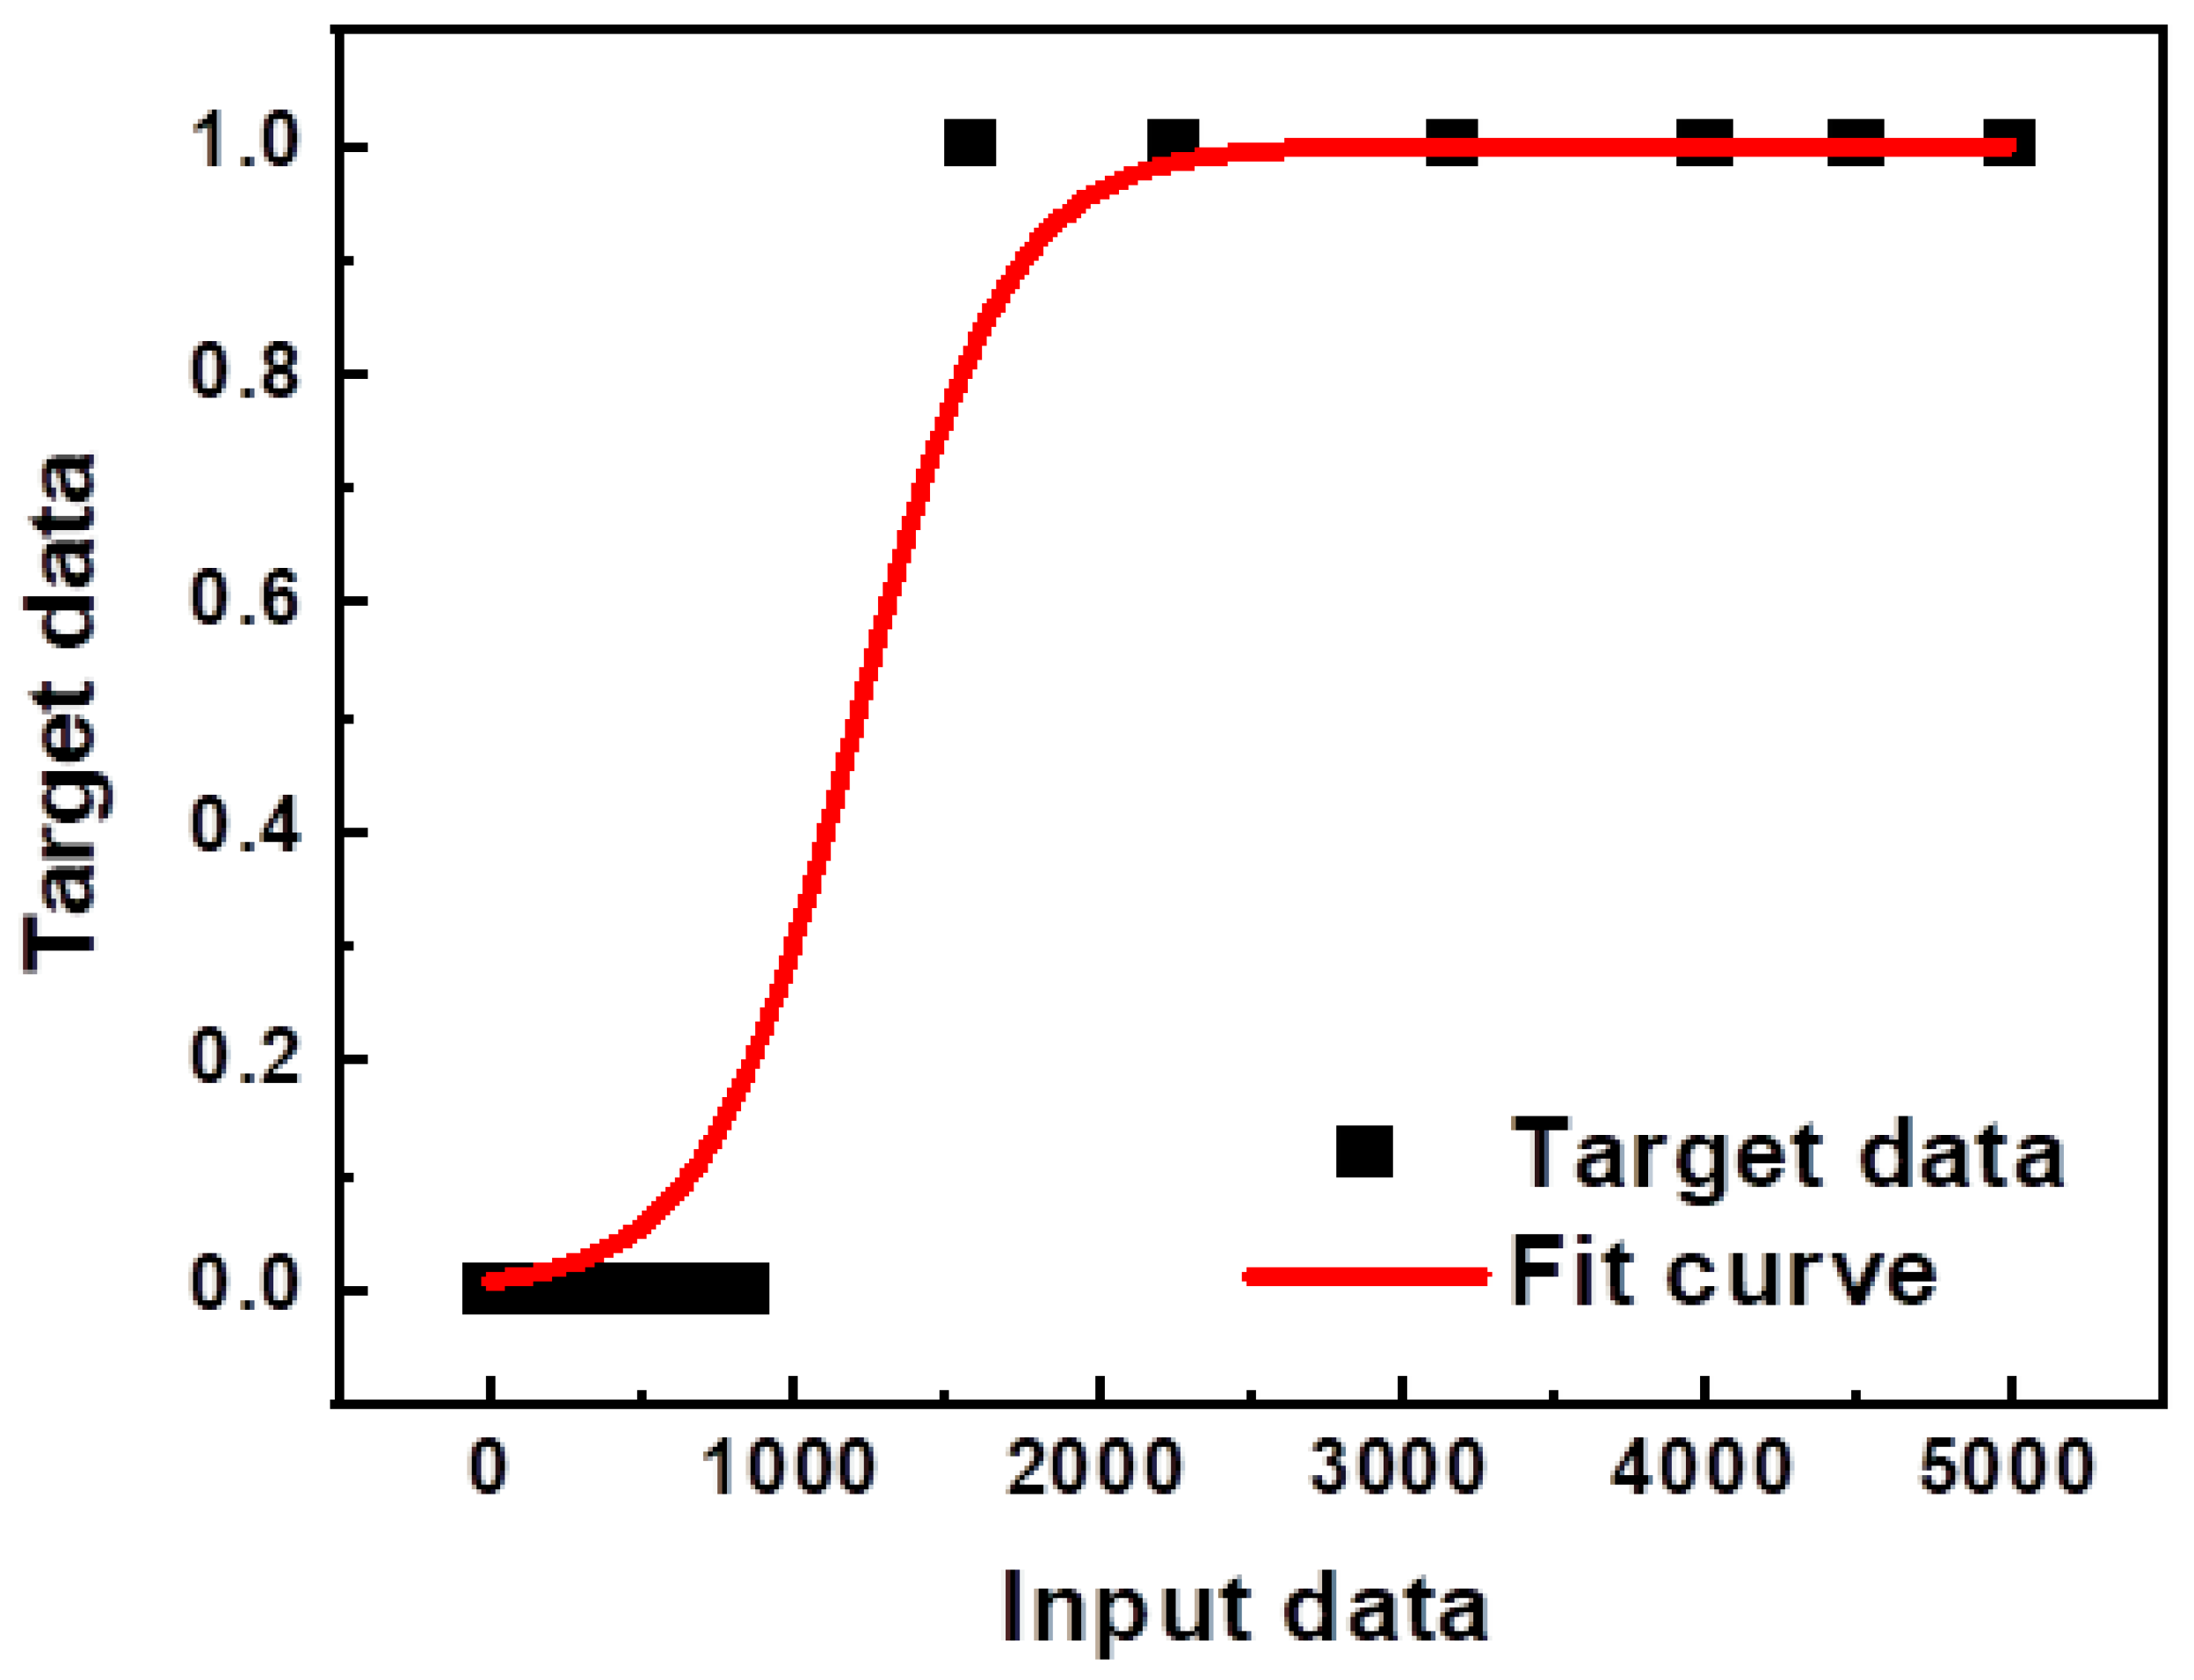
  • Optimal PEM water electrolyzer cell design can be modeled using polynomial regression and logistic regression machine learning models.

Abstract

We propose efficient multiple machine learning (ML) models using specifically polynomial and logistic regression ML methods to predict the optimal design of proton exchange membrane (PEM) electrolyzer cells. The models predict eleven different parameters of the cell components for four different input parameters such as hydrogen production rate, cathode area, anode area, and the type of cell design (e.g., single or bipolar). The models fit well as we trained multiple machine learning models on 148 samples and validated the model performance on a test set of 16 samples. The average accuracy of the classification model and the mean absolute error is 83.6% and 6.825, respectively, which indicates that the proposed technique performs very well. We also measured the hydrogen production rate using a custom-made PEM electrolyzer cell fabricated based on the predicted parameters and compared it to the simulation result. Both results are in excellent agreement and within a negligible experimental uncertainty (i.e., a mean absolute error of 0.615). Finally, optimal PEM electrolyzer cells for commercial-scaled hydrogen production rates ranging from 500 to 5000 mL/min were designed using the machine learning models. To the best of our knowledge, we are the first group to model the PEM design problem with such large parameter predictions using machine learning with those specific input parameters. This study opens the route for providing a form of technology that can greatly save the cost and time required to develop water electrolyzer cells for future hydrogen production.

Graphical Abstract

1. Introduction

Nowadays, numerous researchers and industry experts pay much attention to hydrogen production through water electrolysis. It is the most environmentally friendly among the many hydrogen production methods as hydrogen can be produced with zero carbon emissions. Water electrolysis occurs in an electrolyzer cell consisting of the following two compartments: an anode and a cathode that are separated by a diaphragm (membrane). Hydrogen and oxygen are produced at the cathode and anode sides. The electrolyzer cells are categorized according to the different types of electrolyte substances such as alkaline, proton exchange membrane (PEM), and solid oxide (SO). The alkaline water electrolysis process (AWE) is well established for hydrogen production, and it is considered the most commercially used technology globally [1,2,3,4]. The AWE cell consists of two electrodes separated by a diaphragm immersed in a liquid alkaline solution of sodium (NaOH) or potassium hydroxide (KOH) as the electrolyte. The AWE has many advantages including a low manufacturing cost and relatively high lifetime; however, it also has drawbacks such as the low purity of the produced hydrogen (purity <99.8), the complexity, the immense size of the electrolyzer, and rapid corrosion to the electrode materials. Solid oxide electrolyzers (SOE) utilize water as vapor at a high temperature range of 500–700 °C and use an oxygen ion conductor (ceramic proton conducting materials) as the electrolyte [5,6,7]. SO electrolyzers are still in the research stage due to the high cost of implementation and the particular working environment required, such as steam power plants. PEM electrolyzers are easy to implement and produce high-purity hydrogen, unlike the AWE and SOE [8,9].
The PEM electrolyzer cell consists of two electrodes (cathode and anode) separated with a solid polymer electrolyte called a proton exchange membrane. In PEM electrolysis, water enters the anode, where it is split into oxygen (O2), protons (H+), and electrons (e). The protons (H+) pass through the electrolyte membrane to the cathode side, and two protons react with two moles of electrons and become hydrogen, as shown in Figure 1. The half-reaction of the cell for each electrode (the anode and cathode reactions are shown in Equations (1) and (2), respectively), and the overall cell reaction are shown in Equation (3):
Anode :   H 2 O     2 H + + 1 2   O 2 + 2 e
Cathode: 2H+ + 2e → H2
Overall :   H 2 O   ( l )     H 2 ( g ) + 1 2   O 2
Although the working principle seems simple, the optimal design of the PEM electrolyzer cell requires the maximization of the hydrogen production rate of the cell. Many parameters must be taken into account for optimization, and the electrochemical reactions are affected by many unknown variables. Many researchers work on the development of electrolyzers to enhance electrolyzer performance; investigate the corrosion of electrodes at high anodic potentials and a low pH; and analyze the use of expensive transition metals such as Iridium (Ir) and Platinum (Pt), which would raise the capital cost of the electrolyzer. To address these issues, novel materials have been investigated with polarization curves under various operating conditions, such as a varied electrolyte flow rate, pH, and operating temperatures. These materials include porous transport layers, various support materials, different types of ion-exchange membranes, and a variety of cell configurations. Additionally, catalysts with a high activity of hydrogen evolution or oxygen evolution reactions have been studied at the cathode and anode electrodes for long-term high-performance electrolyzer operation using non-noble metals or low noble metals [10,11,12,13,14,15]. Recent research has also focused on enhancing the electrochemical reaction of PEM electrolysis cells. A uniform coating of catalyst particles over an electrode surface was achieved by a research group [16], and they also explored the optimal operating conditions to improve the performance of PEM water electrolysis cells [17]. Lee et al. [18] created micro-dimples on the surface of the gas diffusion electrode (GDE) using laserplasma to increase the open area of the original pores. Voronova et al. provided a logical framework for building a uniform accelerated stress test (AST) protocol applicable to PEM water electrolysis systems driven by renewable energy and ensuing material-development tactics to reduce degradation processes [19]. Menesy et al. obtained ideal PEM fuel cell parameter values for farmland fertility, making the suggested model fit well with the observed PEM data [20].
Optimization through experimental methods is demanding in terms of cost and time. With this fact in mind, we propose a solution that can help to rapidly and easily reach the optimal design of the PEM electrolyzer cell using machine learning (ML) methods with existing experimental data collected from previous research. The data were used as training data for the proposed model. Water electrolysis is a relatively well-established method for hydrogen production; however, few research papers have presented modelling-specific parameters in the process of electrolyzer cell design using machine learning approaches. Bahr et al. proposed a machine learning method based on artificial neural networks to estimate the aging of electrolyzer cell stacks [21]. They showed the degradation effect of the performance of the electrolyzer cell stack on the current, the temperature, and the operation time. They modelled the relation between input parameters (stack current, stack temperature, and operation time) and the output parameter voltage difference to the starting point of the respective operation setup. Curtains et al. simulated the electrolysis process in wastewater treatment using an artificial neural network [22]. They employed single and stacked artificial neural networks to predict the efficiency of the electrolysis process after removing the chlorophyll from the wastewater in the wastewater treatment plant. They also modelled the relationship between the wastewater components (e.g., Total Suspended Solids (TSS), chlorophyll, and Chemical Oxygen Demand (COD)) and the cell input parameters, specifically electrical power, temperature, time, electrode distance, electrode type, and initial value for the considered output. Wang et al. proposed a machine learning method to predict the hydrogen and oxygen evolution reactions (HER and OER) using non-precious-metal catalysts [23]. There are no or few previous examples of efforts to employ ML methods for the optimal design of the PEM electrolyzer cell. Tapan et al. developed ML models based on collected data from past research to optimize the design and operation of direct alcohol fuel cells [24]. Satjaritanun et al. created an ML model to study the oxygen-preferred paths across porous transport layers of polymer electrolyte–water electrolyzers at various water flow rates and current densities [25]. Hossain et al. suggested an ML technique based on Support Vector Machine (SVM) regression, Regression Trees, and Gaussian Process Regression (GPR) to estimate the effect of palladium-supported carbon nanotubes utilized in formic acid electro-oxidation for DBFC [26].
In this study, we evaluated the reliability of ML for a specific purpose. Our main contribution is modelling the PEM electrolyzer cell design problem using a multi-ML model while considering a number of design parameters that were not considered in other related research. Currently, studies related to PEM design using ML [21,22,23,24,25,26] are limited to modeling only one or two parameters, unlike our study, which aimed to model all possible cell parameters we could find in recent PEM design research.

2. Theory and Calculation

Successful PEM electrolyzer cell designs were introduced in numerous works [27,28,29,30,31,32,33,34,35,36,37,38]. The experiments presented in those papers were employed to prepare a dataset for training and evaluating the proposed machine learning models. Polynomial and logistic regressions were used to predict a continuous value (i.e., regression) and a discrete value of a category or class (i.e., classification), respectively.
Polynomial regression is the extended version of the linear regression model, which assumes a linear relationship between the input and the output of the model. The relationship can be stated as
Y = W 1 X + W 0
where X and Y are the input and the output parameters, respectively. W1 and W0 are the learnable parameters representing the slope of the line and the intersection between the line and the vertical axis, respectively. The linear equation can be solved with the least-squares method, which attempts to find the best slope of the line that fits the input data to the output data using the mean absolute error as a loss function. Nevertheless, the relation between the input and output parameters is not linear. It is much more complex, representing a curve with different degrees depending on the nature of the inputs and outputs. The polynomial regression [39] can be expressed as
Y = i = 0 N ( W i X i ) ,
where Wi = {W0, W1, W2 …} are learnable parameters of the model used to train the mapping from the input parameters to the output parameters, N is the polynomial degree, i is an iterator over the polynomial degree N, N is the number of the learnable parameters. The effect of the polynomial degree on the learned curve parameters is shown in Figure 2. For the case of multiple input parameters and single output parameters, the model learns the weights that map multiple inputs to a single output. In this case, the multiple input polynomial regression function can be given by
Y = j = 0 N ( i = 0 N ( W i . X j i ) )
where Xj represents the input parameters and j is an iterator over the number of the input parameters.
We used an adaptive degree for the polynomial regression training in which predefined constraints were applied to the output to select the best polynomial degree.
Logistic regression is a popular linear model in machine learning usually used to solve a multiclass classification problem. The model, in our case, is required to predict the category of some materials such as cathodic and anodic catalysts from known fixed catalyst types that are available in the dataset. The logistic regression [40] model uses a logistic function (namely sigmoid) to model the probability of each class of the output classes. The sigmoid function can be stated as
Y = 1 1 + e W 1 X + W 0
where e is the natural logarithmic function. The output of this function is the probability of each class given the values of the inputs. The predicted output probabilities must sum up to 1 since the output probabilities follow a probability distribution. An optimization method called maximum likelihood estimation (MLE) is used to estimate the model parameters. MLE can be expressed mathematically as
M L E = Σ i y i   l o g p x i + 1 y i   l o g 1 p x i
where xi and yi are the input and output vectors. An example of the logistic regression curve based on Equations (7) and (8) is shown in Figure 3. For the case of multiple input parameters, the logistic regression function can be given by
Y = 1 1 + e i = 0 N ( W i . X 1 i + i = 0 N ( W i . X 2 i ) + i = 0 N ( W i . X 3 i )
where x1, x2, x3… are the input parameters.

3. Dataset Collection

Since the training process of a machine learning model requires sufficient experimental data, we strictly collected actual design data from previous research papers depending on the availability of all 15 design parameters. The dataset information is provided in the Supplementary Materials.
Lee et al. [27] made a dynamic simulation of PEM electrolysis that shows the effects of different temperatures and flow rates on the experimental output for the efficient generation of hydrogen and oxygen. Navarro-Solís et al. [28] carried out different PEM electrolyzer cell experiments to demonstrate hydrogen production with PEM electrolysis assisted by effluent treatment in an industrial wastewater anolyte, which is an economical method with which to produce hydrogen from industrial wastewater. The experiments showed the effects of using different electrode materials (e.g., stainless steel and carbon plate), treatment solutions for the electrolyte, and applied electric voltages on the hydrogen production rate. Sarno et al. [29] reported a new nanocatalyst—a combination of MoS2 nanosheets and RuS2 nanoparticles (NPs)—that produced a high rate of hydrogen during PEM water electrolysis. Gibson et al. [30] designed a photovoltaic (PV)-electrolysis system to optimize the efficiency of the system by obtaining the maximum output power of the photovoltaic used in PEM electrolysis. The authors proved that the efficient water electrolysis process increases the efficiency of hydrogen generation. Caravaca et al. [31] studied the influence of the system parameters of a PEM water electrolyzer cell with a bimetallic Pt–Ru carbon-based anode and a Pt carbon-based cathode on hydrogen production. Siracusano et al. [32] performed a study on the electrochemical properties of the PEM cell stack for water electrolysis, and they carried out experiments on a 9-cell PEM stack water electrolyzer at different temperatures and different electric voltages, which affect the hydrogen production rate. Valverde et al. [33] developed an electrochemical sub-model depending on the properties of the membrane and electrocatalyst. Selamet et al. [34] optimized a highly efficient 10-cell stack of a PEM water electrolyzer to produce a considerable amount of hydrogen. They carried out experiments to investigate the effect of the different temperatures and water flow rates on the PEM cell performance. Garcia et al. [35] designed a single-cell PEM electrolyzer for hydrogen production to show the effect of different membrane materials, catalyst loading, and clamping pressures on cell performance. Naga et al. [36] evaluated the performance of 5 wt% and 10 wt% Palladium (Pd) on activated carbon as cathodic catalysts in a 10 cm2 PEM water electrolyzer single cell at a different operating temperature which affected the yield of hydrogen. Tebibel and Medjebour [37] conducted three different experiments with various electrolytes using water, methanol, and hybrid sulfur, and a grid-connected PV system powered those PEM cells. Based on the results, the methanol and hybrid sulfur electrolytes produced 65% and 100% more hydrogen than water as an electrolyte. Siracusano et al. [38] optimized the electrochemical performance of three bipolar cells of PEM electrolyzer (100 cm2) using Ti-based backing layer current collectors with different thicknesses to reduce the ohmic contact resistance between the bipolar plates and to obtain the efficient performance of the PEM electrolyzer.
Those papers provide around 164 experimental designs at a 1 atm operating pressure for the training and testing of our multi-model based on a machine learning approach (148 samples for training and 16 samples for testing). Table 1 shows the details of the categories and the ranges of the different parameter values of the collected dataset.

4. Machine Learning Models Training and Validation

In this study, the multiple machine learning models for predicting the optimal design of a PEM electrolyzer cell have four input (hydrogen production rate, cathode area, anode area, and the type of cell design (single or bipolar)) parameters and another eleven output parameters (anode type, cathode type, membrane type, cathode catalyst, anode catalyst, anolyte, catholyte, power, water flow rate, cell temperature, and a number of cells). The models employ the following two machine learning methods: polynomial regression (PR) and logistic regression (LR). The LR is a statistical method used for classification (the prediction is a category). It was used to predict the seven following output parameters: anode type, cathode type, membrane type, cathodic catalyst, anodic catalyst, anolyte, and catholyte. PR was used to predict the following four outputs of numerical values (regression): power, water flow rate, cell temperature, and number of cells. We employed adaptive degree prediction to optimize the PR model by iteratively changing the polynomial degree to obtain the best prediction bounded by predefined constraints such as power prediction >0.01, a water flow rate prediction of 0–750, temperature of 298–359, and the number of cells was ≥1. The constraints are predefined based on the ranges of those parameters in the dataset to avoid out-of-range predictions. LR models are trained using different iterations depending on the best fit of the data to the curve. Since we have four input parameters and one output parameter in each model, the problem dimension is 5D which cannot be plotted or visualized. There is no way to represent the learned relationship between the inputs and the output. The learned numerical values of the weights of the LR models are reported in Appendix A. Although the output parameters are modelled using separate ML models for each parameter, the learned ML models are indirectly related since the models are trained on the same input parameters, and the models already learned to attend to the cross-relation between the input parameters and the corresponding output parameters, which can be proven mathematically as shown in Appendix B.
The models were trained on 148 experimental samples until the best fitting for the PR and the LR models to the output parameters was obtained. We validated the model’s performance on the 16 samples of the test set. We also carried out four experiments in different input and output parameters to validate the PEM cell-design ML models. The multi-models have four inputs (hydrogen production rate (mL/min), cathode area (mm2), anode area (mm2), and the type of cell design). The hydrogen production rate varied at 2.5, 5, 7.5, and 10 mL/min, while other parameters such as anode and cathode areas were fixed at 900 and 900 mm2, respectively. In addition, the single-cell design was used to evaluate the parameters. After that, the models predicted the optimum design parameters of the PEM cell (anode type, cathode type, membrane type, cathode catalyst, anode catalyst, anolyte, catholyte, power (W), water flow rate (mL/min), cell Temperature (K), and number of cells). Table 2 lists the input and prediction parameters (materials and values) of the PEM electrolyzer cell design for the four experiments. The ML model suggests the same predicted parameters except for catalysts, operating power, temperature, and water flow rate for all experiments. The result indicates that those parameters significantly affect the hydrogen production rate in the range where the hydrogen production rate is relatively low from 2.5 to 10 mL/min. However, one should remain hesitant when coming to the conclusion that the effects of other parameters on the rate of hydrogen production are negligibly small. It is possible the amount of data based on the results of the 148 experiments used in ML model training was insufficient. In common knowledge, it is well known that using acidic or basic solutions as an anolyte and catholyte is more advantageous for hydrogen production through electrolysis. We collected all available data and trained the ML model to anticipate the predicted parameters based on that data. More custom experiments are ongoing and will be added to the dataset in future studies.
The learned weights by the logistic regression models using Equation (9) are shown in Appendix A. The number of learned weights is the number of input parameters (Ni) which is four multiplied by the number of categories (Nc) of this parameter (Ni × Nc). The weights of the polynomial regression cannot be shown as we applied an online training method that uses adaptive degree learning during inference in which the degree of the polynomial is changed based on the input parameter values. Hence, the polynomial weights are dynamic and variable in any inference execution.

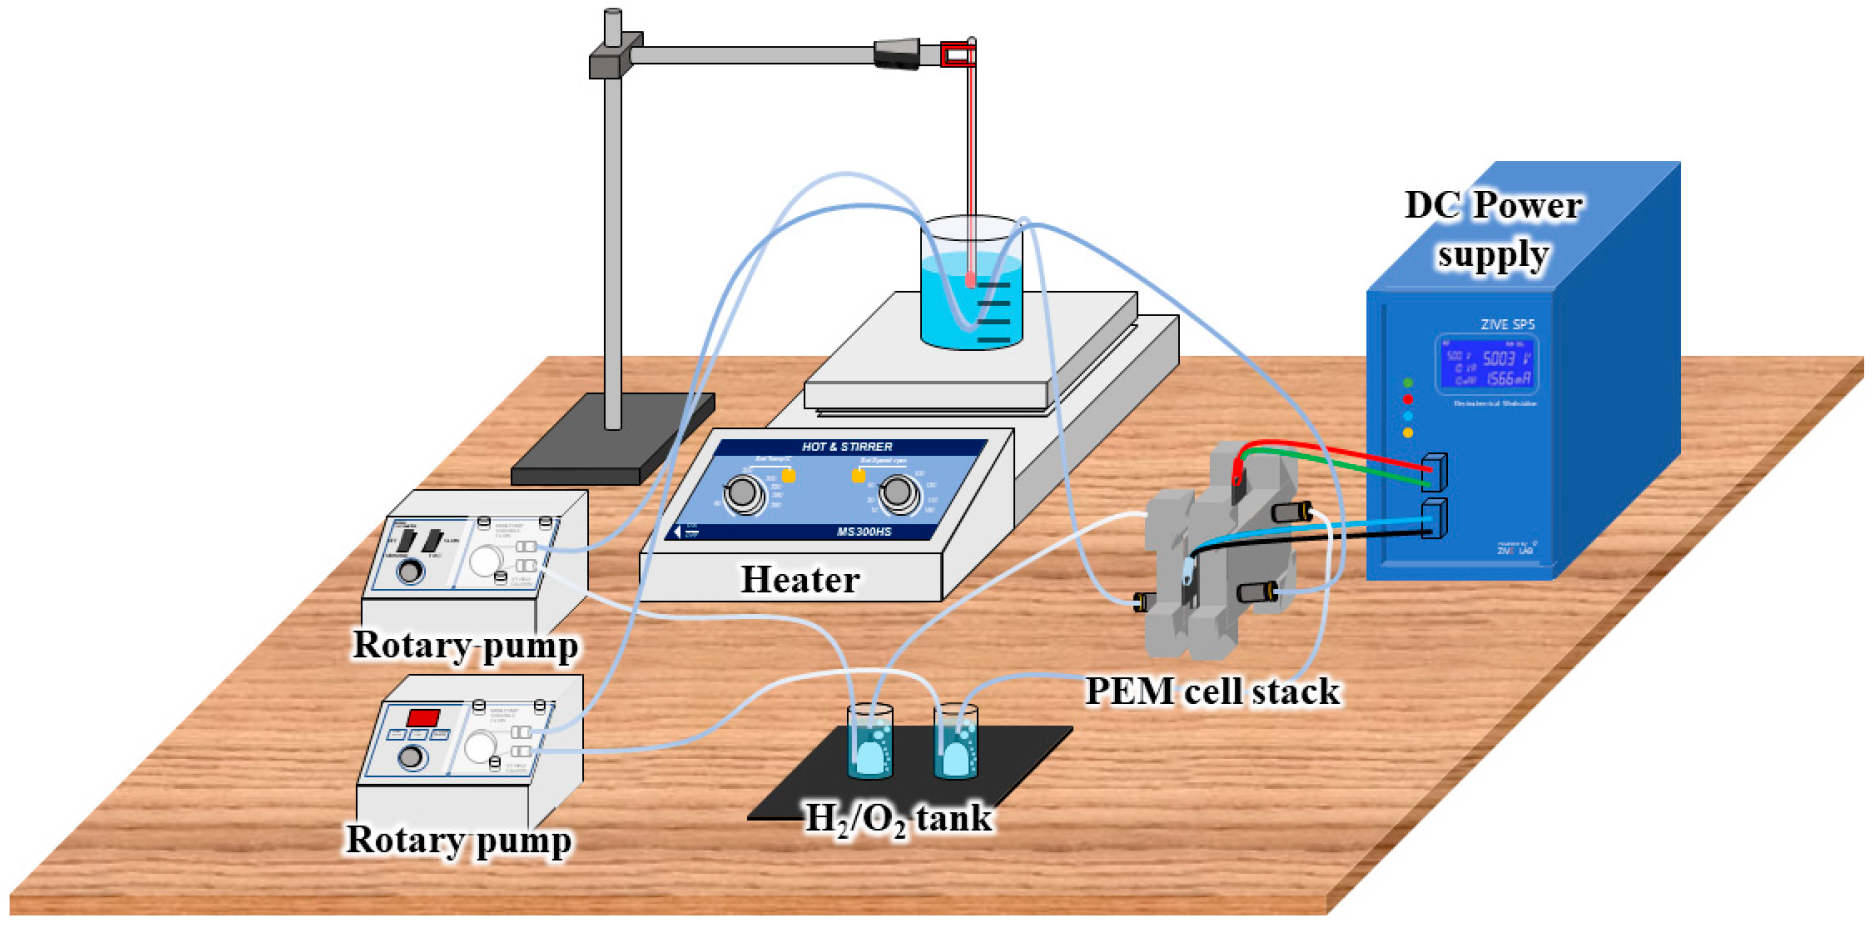
5. Laboratory Experiments for Validating Models

5.1. Preparation of the Catalysts

Most of the research papers did not provide the details of the catalyst preparation; hence, we used a standard method of catalyst preparation for the four experiments in this study. The catalyst ink (RuO2, 10% Pd, and 20% Pt) was made by sonicating a mixture of 30 mg of a catalyst particle (~1 µm) in a 3.6 mL isopropyl alcohol solution (50 wt%) with a 30 µL Nafion solution (DuPont (DuPont de Nemours, Wilmington, DE, USA), 1100 EW 5 wt%). The catalyst ink was then sprayed over a nine cm2 carbon gas diffusion layer (GDE, Toray (Tokyo, Japan), TGP-H-060). Catalysts were uniformly dispersed on carbon paper after the isopropanol thoroughly evaporated from the surface. The process was repeated until a fine coating of the catalysts was developed.

5.2. Experimental Method

We designed (9 cm2) a single cell at a 1 atm operating pressure using a carbon plate as the electrode material (cathode and anode) of the cell and Nafion115 as a membrane. The Pt/C (20% Pt) on the carbon electrode was used as the cathode catalyst for experiments 1 and 2, and the Pd/C (10% Pd) on carbon was used as the cathode catalyst for experiments 3 and 4. The Ruthenium dioxide (RuO2) was used as the anode catalyst for all experiments (1, 2, 3, and 4). Figure 4 shows the experimental setup used in this study. A regulated (DC) power supply was used to control and set the power. We set the cell voltage first in the regulated power supply, and the power supply automatically set the cell current while we changed the voltage until we obtained the required power. The anolyte and the catholyte were deionized water in each experiment. They were supplied to each side of the cell using a rotary pump (Fisher Scientific (Hampton, NH, USA), Variable-Flow Peristaltic Pumps 13-876-2). The temperature of electrolytes was set at 60 °C with a Heater (Mtops (Seoul, Korea), Hot plate-Magnetic stirrer heater MS300HS).

6. Results and Discussion

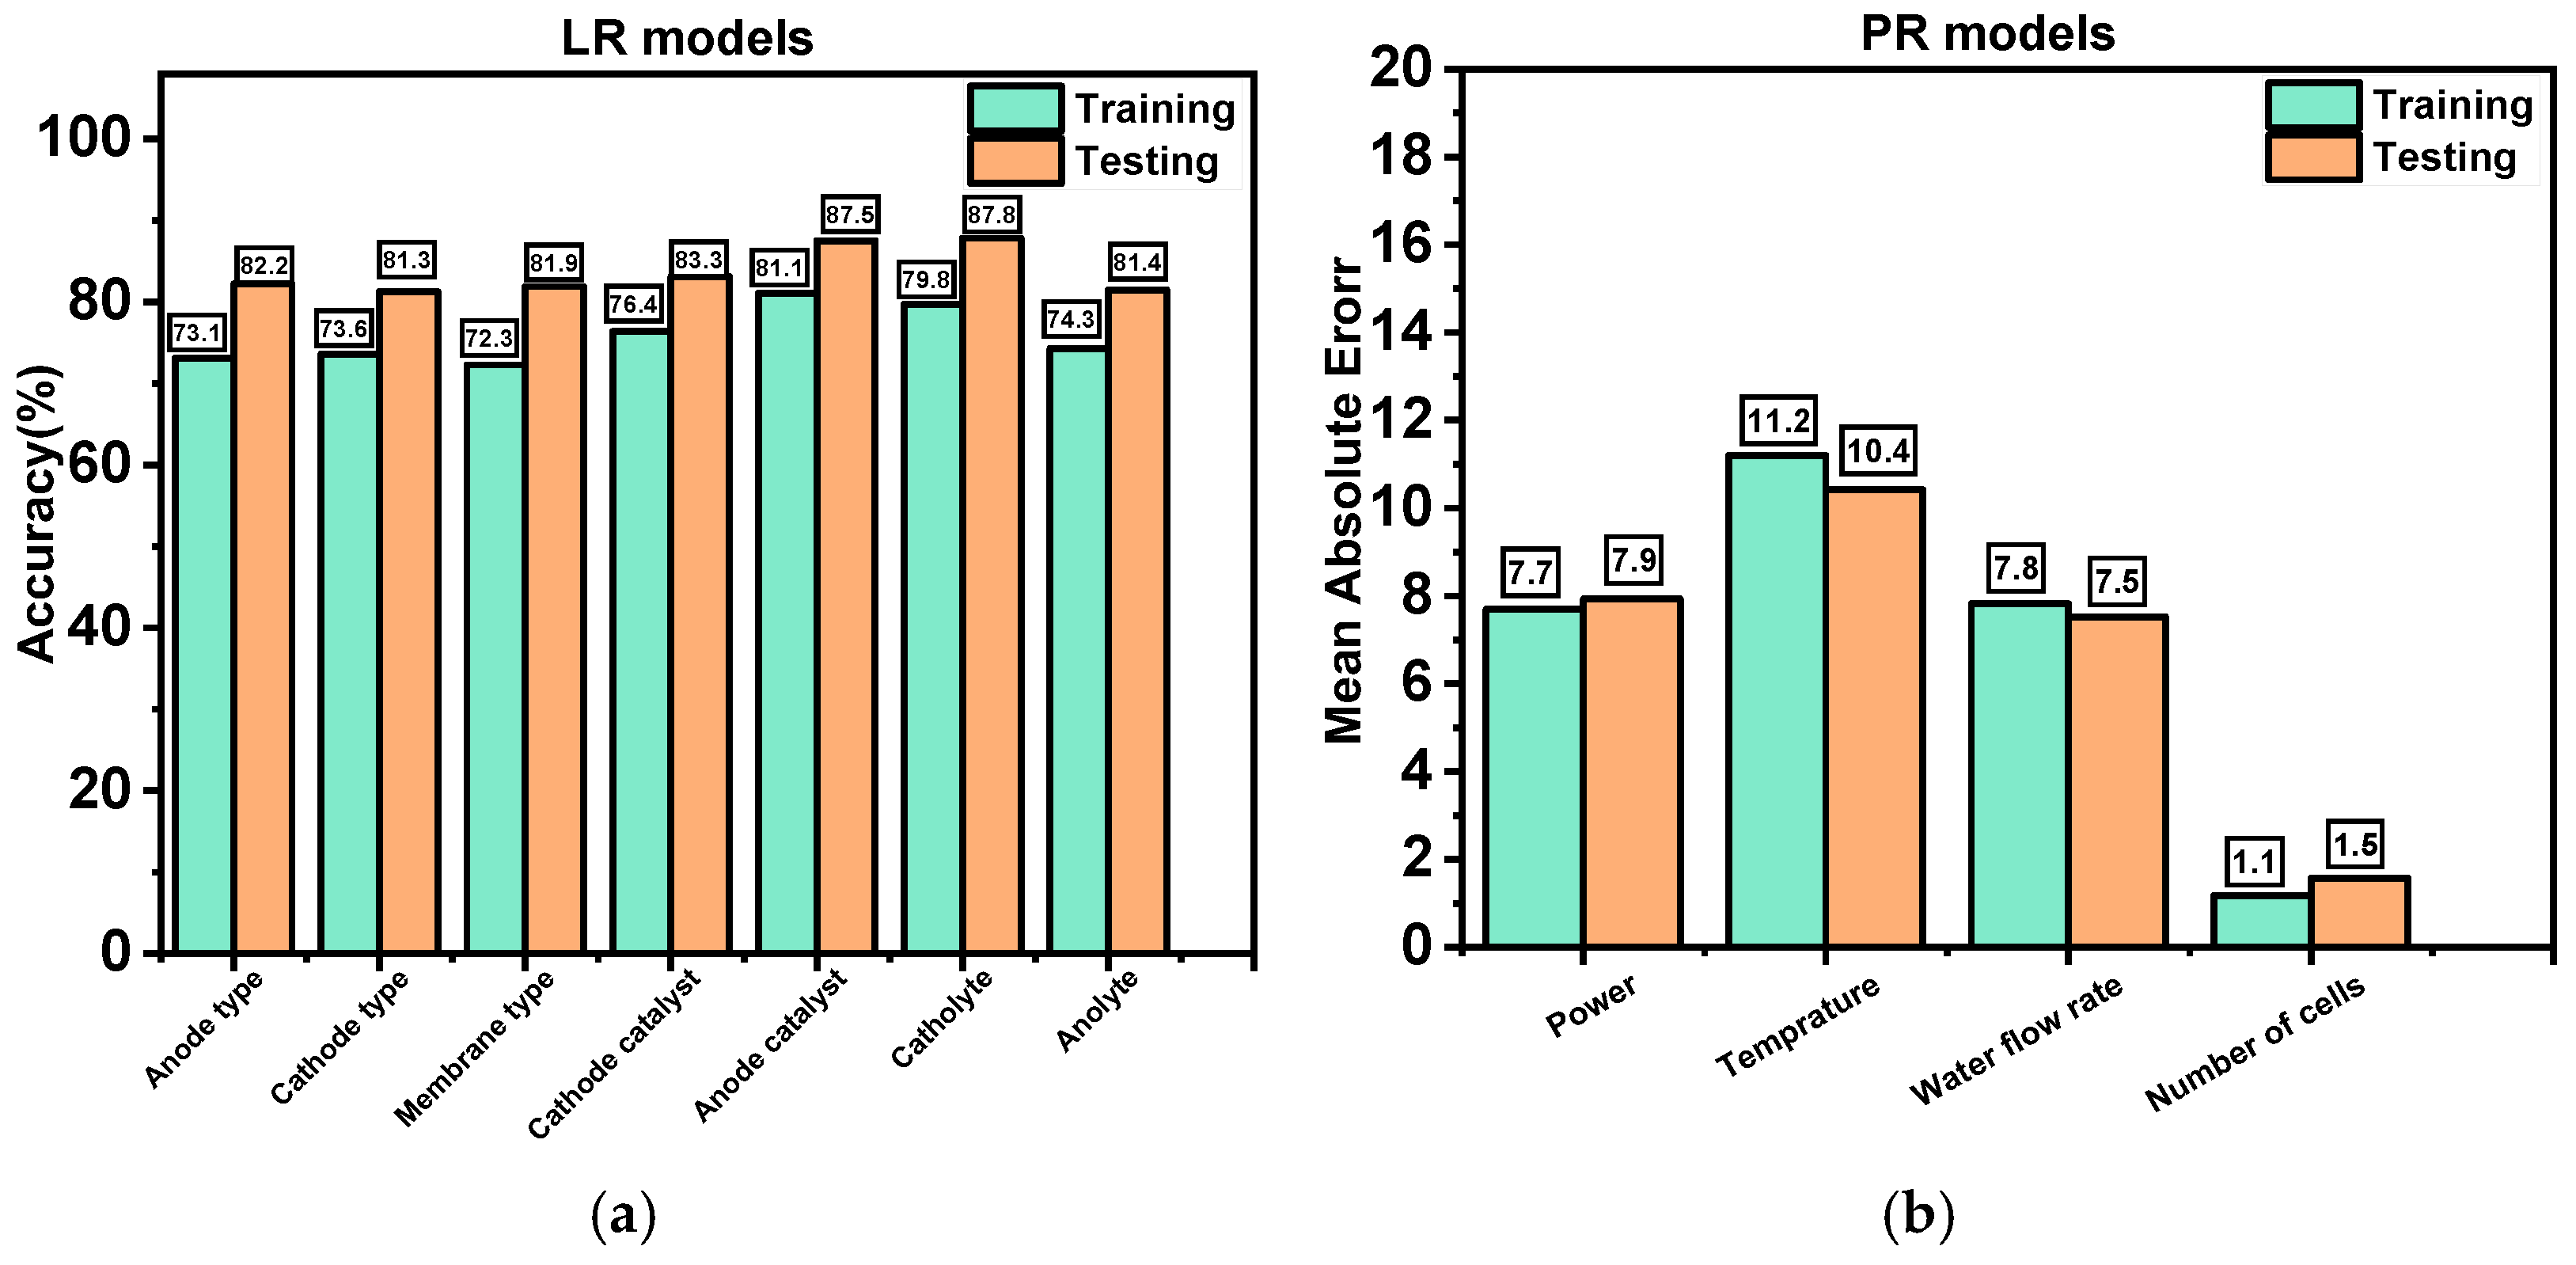
6.1. Performance of the Machine Learning Models

We trained our models on 90% of the collected dataset (148 samples) and validated them on 10% of the dataset (16 samples). The best metric for the validation of the classification (LR) machine learning models (anode type, cathode type, cathode catalyst, anode catalyst, catholyte, anolyte membrane type) is the scoring accuracy, as shown in Equation (10).
s c o r e = N u m b e r   o f   t r u e l y   p r e d i c t e d   s a m p l e s T o t a l   n u m b e r   o f   s a m p l e s
The selected metric for the validation of the regression (PR) machine learning models (power, water flow rate, number of cells, temperature) is the mean absolute error (MAE) as shown in Equation (11):
M A E = 1 N i = 1 N Y Y ^ 2
where Y is the ground truth value, Y ^ is the predicted value, N is the number of samples (dataset size), and i is an iterator over the dataset samples. Figure 5a shows the training and validation accuracy for each classification model, while Figure 5b shows the training and validation MAE for each regression model. The mean test accuracy of the classification models is 83.6% which is fairly good since the model tries to select the best category for each parameter instead of the exact category in the dataset corresponding to the input parameters. Additionally, the mean test MAE for the regression models is extremely small (MAE = 6.825), which reflects the good performance of the proposed method in modeling the PEM design parameters. The performances of the classification models are similar since all of them have an accuracy of around the 83.6%. For the regression models, the MAE values are highly dependent on the range of the predicted parameter itself, e.g., the test MAE for the temperature, power, and water flow rate PR models are relatively high compared to the number of cells in the model since the ranges of the temperature, power, and water flow in the dataset are 298~359 K, 0~1300 W, and 5~750 mL/min, respectively. However, the range of the number of cells in the PR model is 1~20, which is small compared to the other PR models. Overall, the classification and the regression models are good enough to design a reliable PEMWE cell with very close design requirements defined by the user.
For further validation of the proposed models, we performed laboratory experiments (specifically four experiments) to ensure that the proposed models can simulate real world conditions, as described in Section 6.2.

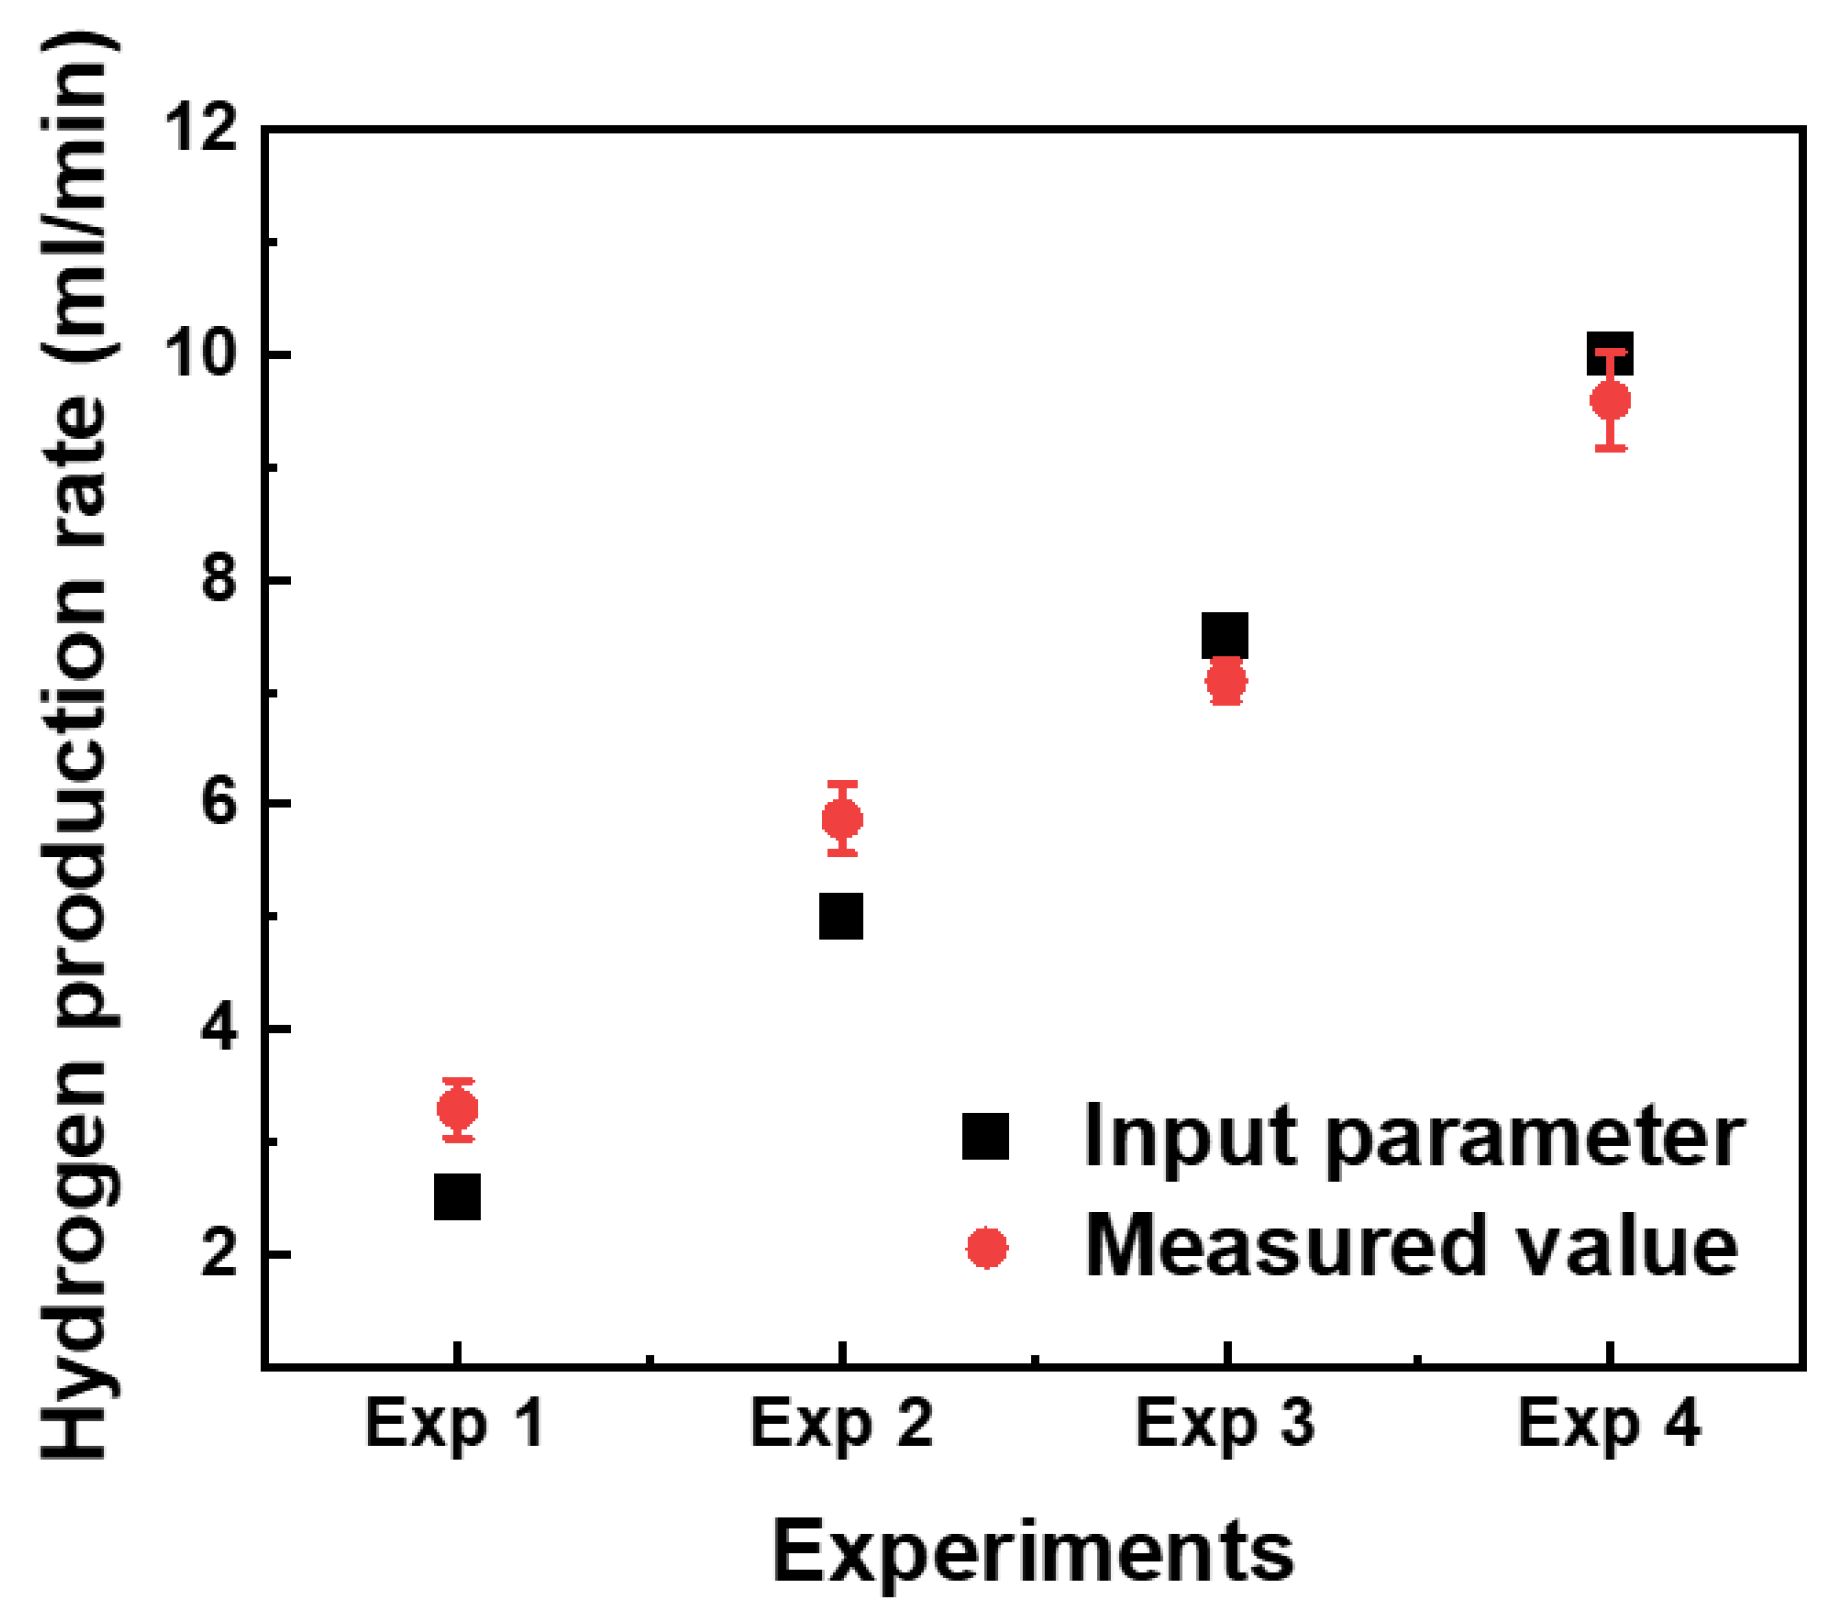
6.2. Model Validation Using Laboratory Experiments

Table 2 shows the optimal design and operating conditions of PEM electrolyzer cells for a particular hydrogen production rate. During the PEM water electrolysis experiments, the rate of hydrogen produced from the cathode side was measured with PEM electrolyzer cells prepared based on parameters tabulated in Table 2 and compared to the model input value (hydrogen production). For experiments 1, 2, 3, and 4, each experiment was replicated five times, and the average hydrogen production for the replications is calculated and summarized in Table 3.
The average hydrogen production rate for experiments 1, 2, 3, and 4 was 3.2, 5.8, 7.0, and 9.6 mL/min, respectively. The measured hydrogen production rate from the experiments is in excellent agreement with the required input hydrogen production (2.5, 5.0, 7.5, and 10 mL/min, respectively) in the ML models. Figure 6 demonstrates that the hydrogen production absolute error values for the four experiments are 0.7, 0.8, 0.50, and 0.40 mL/min with a mean absolute error of 0.615. Those error values come derive from some unmentioned design parameters in most research papers used in the dataset that did not record all conditions such as catalyst loading, electrode path pattern, and unclear input power setting during the experiment. However, the error values are very small, which means the proposed method simulates the real PEM cell performance well.
Our model predicts the same electrodes type (carbon plate), membrane type (nafion115), catholyte (pure water), anolyte (pure water), anode catalyst (RuO2), and temperature for each experiment due to the simple change in the input parameters (hydrogen production rate) of 2.5, 5, 7.5, and 10 mL/min for the experiments 1, 2, 3, and 4, respectively. However, the model predicts the different cathodic catalysts for experiments 1 and 2 and experiments 3 and 4. As the model tries to find similar input conditions in the training data, the model predicts Pt/C (20% Pt) as the cathodic catalyst for low hydrogen production rates with an input of 2.5 and 5 mL/min in experiments 1 and 2. The model recommends Pd/C (10% Pd) as a cathodic catalyst for higher hydrogen production rates of 7.5 and 10 mL/min in experiments 3 and 4. As expected, the power and water flow rate prediction increases with the required hydrogen production rate increase.

6.3. ML Model Performance for a Commercial-Scaled PEM Water Electrolyzer Cell Design

After validating the reliability of the ML model, the model was used to predict design parameters for commercial-scale PEM water electrolyzer cells since our dataset contains commercial-size designs. For example, we used the model to design a commercial-scale (e.g., electrodes of 100 cm2 for each cell) PEM water electrolyzer bipolar cells stack for different hydrogen production rates of 500, 1000, 3000, and 4500 mL/min. Our model predicted the design parameters for each case as summarized in Table 4. The model selected fewer cells but better electrochemical characteristics for electrode type (anode and cathode) and cathode catalyst for the high hydrogen production rates such as 3000 and 4500 mL/min. The anode and cathode types are selected to be titanium due to the superior electrochemical characteristics of titanium electrodes. The cathodic catalyst is selected to be Pt/C (30% Pt) which is much better than Pt/C (10% Pt). The predicted power, water flow rate, and temperature increase with the required hydrogen production rate. The class category of “Ruthenium (RuO2) or Iridium oxide (IrO2)” in the anode catalyst categories for 500 and 1000 mL/min hydrogen production rates, provides the flexibility to choose one of them. IrO2 (~$570/g and high durability for OER) is much more expensive than RuO2 (~$78/g and low durability for OER); therefore, manufacturers can select the cheaper one for lower hydrogen production rates in the suggested commercial-sized PEM cell designs by taking the durability for OER into consideration.

7. Conclusions

We developed ML models that could predict eleven parameters using four inputs to optimize the design of PEM electrolyzer cells. With 148 data samples, we trained the machine learning models and evaluated their performance on a test set of 16 samples. The training and validation values matched well, indicating that the models fit well. The average accuracy of the classification models is 83.6%, which is an optimal range, and the mean absolute error for regression models is 6.825, suggesting that the recommended approach performs quite well. The reliability of the models was also verified by comparing the target hydrogen production rate to the measured results with the electrolyzer cells of four different designs. The laboratory experimental results agreed well with the model values within a low mean absolute error of approximately 0.615. In addition, the validation of our proposed models showed the high performance in classification and regression of the PEM cell design, which proves the excellent fitting of the proposed models. We also showed that the models could design commercial-sized PEM electrolyzer cells suitable for high hydrogen production rates ranging from 500 to 5000 mL/min. The proposed work has obvious limitations, such as the limited number of material categories used in the input parameters (i.e., cathode, anode, catholyte, anolyte, cathode, and anode catalyst types) and the numerical values’ limited working range (i.e., temperature, power, electrode area, water flow rate, and number of cells). The experimental data in the dataset have restrictions due to the nature of the data. To develop a more universal machine learning-based design for the PEM water electrolysis, we will focus on expanding the current dataset to encompass more materials and a wider range of numerical parameters in future work.

Supplementary Materials

The following supporting information can be downloaded at: https://www.mdpi.com/article/10.3390/en15186657/s1. The supplementary material contains PEM water electrolysis dataset for machine learning.

Author Contributions

Conceptualization, A.M. and H.I.; methodology, A.M. and H.I.; software, A.M. and H.I.; validation, A.M. and H.I.; formal analysis, K.K.; investigation, K.K.; resources, K.K.; data curation, A.M.; experimental work, A.M. and R.Y. writing—original draft preparation, A.M.; writing—review and editing, A.M., H.I. and K.K.; visualization, K.K.; supervision, K.K.; project administration, K.K.; funding acquisition, K.K. All authors have read and agreed to the published version of the manuscript.

Funding

This research was funded by the National Research Foundation of Korea (NRF), grant number (2019R1D1A3A03103616).

Institutional Review Board Statement

Not applicable.

Informed Consent Statement

Not applicable.

Data Availability Statement

The data used in this research is collected by the authors themselves.

Acknowledgments

The authors appreciate the valuable contribution of the artworks made by Seung-Hyeon Lee in this paper.

Conflicts of Interest

The authors declare no conflict of interest.

Appendix A

We demonstrate the learned weights by the logistic regression classification models using Equation (9). The number of learned weights is the number of input parameters (Ni), i.e., four multiplied by the number of categories (Nc) of this parameter (Ni × Nc). The learned weights for each LR model are shown in the table below.
LR ModelNumber of CategoriesNumber of Learnable WeightsLearnt Weight Values as a Python List
Anode type44 × 4[[1.44462466 × 10⁻¹ −6.12298768 × 10⁻² 6.13973935 × 10⁻² 3.64800267 × 10⁻¹]
[1.46054452 × 10⁻¹ −7.60564943 × 10⁻⁴ 1.38269198 × 10⁻⁴ 1.21432242 × 10⁻²]
[−4.31161394 × 10⁻¹ 1.00330176 × 10⁻¹ −1.00065339 × 10⁻¹ −2.70354882 × 10⁻²]
[1.40644477 × 10⁻¹ −3.83397333 × 10⁻² 3.85296768 × 10⁻² −3.49908003 × 10⁻¹]]
Cathode type54 × 5[[1.44462466 × 10⁻¹ −6.12298768 × 10⁻² 6.13973935 × 10⁻² 3.64800267 × 10⁻¹]
[1.46054452 × 10⁻¹ −7.60564943 × 10⁻⁴ 1.38269198 × 10⁻⁴ 1.21432242 × 10⁻²]
[−4.31161394 × 10⁻¹ 1.00330176 × 10⁻¹ −1.00065339 × 10⁻¹ −2.70354882 × 10⁻²]
[1.40644477 × 10⁻¹ −3.83397333 × 10⁻² 3.85296768 × 10⁻² −3.49908003 × 10⁻¹]]
Membrane type44 × 4[[−3.61453160 × 10⁻² 7.37919754 × 10⁻³ 9.38431838 × 10⁻³ 7.59994519 × 10⁻²]
[−3.63925709 × 10⁻² −3.34377249 × 10⁻² 5.02725002 × 10⁻² 1.14175043 ]
[−3.81851194 × 10⁻² 5.23432817 × 10⁻² −3.53771847 × 10⁻² −1.21776783 ]
[1.10723006 × 10⁻¹ −2.62847497 × 10⁻² −2.42796289 × 10⁻² 1.79419465 × 10⁻⁵]]
Cathode catalyst94 × 9[[4.62538696 × 10⁻¹ −1.73429684 × 10⁻¹ −1.72194908 × 10⁻¹ 9.44123724 × 10⁻⁵]
[8.74550852 × 10⁻³ 2.07860659 × 10⁻² 2.20208426 × 10⁻² −4.41194136 × 10⁻²]
[−2.34382706 × 10⁻¹ 9.27164067 × 10⁻² −4.67910927 × 10⁻² −1.36263928 ]
[−7.60384199 × 10⁻³ 2.19398429 × 10⁻² 2.31746196 × 10⁻² −1.10382521 × 10⁻¹]
[4.66713125 × 10⁻³ −4.21039516 × 10⁻² 8.78954152 × 10⁻² 2.20360246 × 10⁻¹]
[−1.96806895 × 10⁻¹ 1.90339303 × 10⁻² 2.02687069 × 10⁻² −2.88371268 × 10⁻²]
[8.17614369 × 10⁻³ 2.19340870 × 10⁻² 2.40335601 × 10⁻² 1.32154990 ]
[−2.23215768 × 10⁻² 1.95596857 × 10⁻² 2.07944624 × 10⁻² 2.05992475 × 10⁻³]
[−2.30124632 × 10⁻² 1.95636123 × 10⁻² 2.07983889 × 10⁻² 1.91386035 × 10⁻³]]
Anode catalyst94 × 9[[5.59937140 × 10⁻¹ −1.34767419 × 10⁻¹ −1.34974607 × 10⁻¹ 1.14946617 × 10⁻⁴]
[2.48528231 × 10⁻² 1.90093734 × 10⁻² 1.88021862 × 10⁻² −2.74401454 × 10⁻²]
[−4.51294267 × 10⁻¹ 3.15581162 × 10⁻² 9.32589281 × 10⁻³ −1.19339127 ]
[1.79141511 × 10⁻² 9.65845025 × 10⁻³ 3.11238126 × 10⁻² 2.23865612 ]
[−1.90096227 × 10⁻¹ 1.49808056 × 10⁻² 1.96494875 × 10⁻² −1.98781788 × 10⁻²]
[2.18144668 × 10⁻² 2.07939216 × 10⁻² 1.91745657 × 10⁻² 1.09433554 ]
[−2.68433462 × 10⁻³ 1.78404022 × 10⁻² 1.76332512 × 10⁻² −6.46443455 × 10⁻³]
[1.95562480 × 10⁻² 2.09263455 × 10⁻² 1.92654063 × 10⁻² −2.08593258 ]]
Anolyte84 × 8[[8.41818183 × 10⁻² −3.77899754 × 10⁻⁴ 1.03837844 × 10⁻³ −2.30651817 × 10⁻¹]
[9.34764020 × 10⁻² −9.71012939 × 10⁻⁴ 4.45506477 × 10⁻⁴ −2.65266069 × 10⁻¹]
[6.89813505 × 10⁻² −1.59102629 × 10⁻³ −1.74836248 × 10⁻⁴ −1.19477921 × 10⁻²]
[8.80060005 × 10⁻² −1.08905169 × 10⁻³ 3.26999016 × 10⁻⁴ −3.86594484 × 10⁻¹]
[9.39022060 × 10⁻² −1.12957815 × 10⁻¹ 1.13610766 × 10⁻¹ 1.29855994 ]
[−2.81643536 × 10⁻¹ −6.00417095 × 10⁻⁴ 1.36202923 × 10⁻³ −1.90252849 × 10⁻¹]
[−2.27920956 × 10⁻¹ 1.18191783 × 10⁻¹ −1.17420389 × 10⁻¹ −1.59723081 × 10⁻¹]
[8.10167126 × 10⁻² −6.04560766 × 10⁻⁴ 8.11546336 × 10⁻⁴ −5.41238514 × 10⁻²]]
Catholyte84 × 8[[0.07478746 0.04592284 −0.04188776 −0.23696409]
[0.07708628 0.00384208 −0.00328621 0.12424417]
[0.05464852 0.00182964 −0.00529848 0.01823618]
[0.0727397 0.00466682 −0.00245757 0.1467709 ]
[0.08341487 −0.12855017 0.13257934 0.99461289]
[−0.21004092 0.07089918 −0.06678267 −1.08327702]
[−0.21321721 −0.00277489 −0.00990302 0.01055434]
[0.0605813 0.0041645 −0.00296362 0.02582262]]

Appendix B

The mathematical proof that the output parameters of two ML models trained using the same input parameters is as follows:
Let us assume we have two output parameters (e.g., cathode and anode types) modeled by machine learning models (for instance, let us assume linear regression (LR) for simplicity.
Y 1 = W 0 X + W 1
Y 2 = W 2 X + W 3
where Y 1 and Y 2 represent two different output parameters. X is the same input parameter used in both models. W 0 and W 1 are the learnable parameters of the first LR model. W 2 and W 3 are the learnable parameters of the second LR model. If we subtract (A2) from (A1), we obtain:
Y 1 Y 2 = W 0 W 2   X + ( W 1 W 3 )
Then, if we represent W 0 W 2   with   A , and ( W 1 W 3 )   w i t h   B and move Y 2 to the other equation, we obtain
Y 1 = A   X + B + Y 2
(A3) implies that the Y1 and Y2 parameters are related with a direct relationship; however, they are modelled using two separate ML models with the same input parameter X.

References

  1. Ursua, A.; Gandia, L.M.; Sanchis, P. Hydrogen production from water electrolysis: Current status and future trends. Proc. IEEE 2012, 100, 410–426. [Google Scholar] [CrossRef]
  2. Zeng, K.; Zhang, D. Recent progress in alkaline water electrolysis for hydrogen production and applications. Prog. Energy Combust. 2010, 36, 307–326. [Google Scholar] [CrossRef]
  3. Manabe, A.; Kashiwase, M.; Hashimoto, T.; Hayashida, T.; Kato, A.; Hirao, K.; Shimomura, I.; Nagashima, I. Basic study of alkaline water electrolysis. Electrochim. Acta 2013, 100, 249–256. [Google Scholar] [CrossRef]
  4. Marini, S.; Salvi, P.; Nelli, P.; Pesenti, R.; Villa, M.; Berrettoni, M.; Zangari, G.; Kiros, Y. Advanced alkaline water electrolysis. Electrochim. Acta 2012, 82, 384–391. [Google Scholar] [CrossRef]
  5. Hauch, A.; Ebbesen, S.D.; Jensen, S.H.; Mogensen, M. Highly efficient high temperature electrolysis. J. Mater. Chem. 2008, 18, 2331–2340. [Google Scholar] [CrossRef]
  6. Ni, M.; Leung, M.K.H.; Leung, D.Y.C. Technological development of hydrogen production by solid oxide electrolyzer cell (SOEC). Int. J. Hydrogen Energy 2008, 33, 2337–2354. [Google Scholar] [CrossRef]
  7. Laguna-Bercero, M.A. Recent advances in high temperature electrolysis using solid oxide fuel cells: A review. J. Power Sources 2012, 203, 4–16. [Google Scholar] [CrossRef]
  8. Carmo, M.; Fritz, D.L.; Mergel, J.; Stolten, D. A comprehensive review on PEM water electrolysis. Int. J. Hydrogen Energy 2013, 38, 4901–4934. [Google Scholar] [CrossRef]
  9. Aricò, A.S.; Siracusano, S.; Briguglio, N.; Baglio, V.; di Blasi, A.; Antonucci, V. Polymer electrolyte membrane water electrolysis: Status of technologies and potential applications in combination with renewable power sources. J. Appl. Electrochem. 2013, 43, 107–118. [Google Scholar] [CrossRef]
  10. Grigoriev, S.A.; Mamat, M.S.; Dzhus, K.A.; Walker, G.S.; Millet, P. Platinum and palladium nano-particles supported by graphitic nano-fibers as catalysts for PEM water electrolysis. Int. J. Hydrogen Energy 2011, 36, 4143–4147. [Google Scholar] [CrossRef]
  11. Khan, M.A.; Zhao, H.; Zou, W.; Chen, Z.; Cao, W.; Fang, J.; Xu, J.; Zhang, L.; Zhang, J. Recent progresses in electrocatalysts for water electrolysis. Electrochem. Energy Rev 2018, 1, 483–530. [Google Scholar] [CrossRef]
  12. Liu, C.; Carmo, M.; Bender, G.; Everwand, A.; Lickert, T.; Young, J.L.; Smolinka, T.; Stolten, D.; Lehnert, W. Performance enhancement of PEM electrolyzers through iridium-coated titanium porous transport layers. Electrochem. Commun. 2018, 97, 96–99. [Google Scholar] [CrossRef]
  13. Tang, C.; Pu, Z.; Liu, Q.; Asiri, A.M.; Luo, Y.; Sun, X. Ni3S2 nanosheets array supported on Ni foam: A novel efficient three-dimensional hydrogen-evolving electrocatalyst in both neutral and basic solutions. Int. J. Hydrogen Energy 2015, 40, 4727–4732. [Google Scholar] [CrossRef]
  14. Saha, S.; Rajbongshi, B.M.; Ramani, V.; Verma, A. Titanium carbide: An emerging electrocatalyst for fuel cell and electrolyser. Int. J. Hydrogen Energy 2021, 46, 12801–12821. [Google Scholar] [CrossRef]
  15. Shi, H.; Yu, Q.; Liu, G.; Hu, X. Promoted electrocatalytic hydrogen evolution performance by constructing Ni12P5–Ni2P heterointerfaces. Int. J. Hydrogen Energy 2021, 46, 17097–17105. [Google Scholar] [CrossRef]
  16. Lee, H.-O.; Yoon, J.-S.; Kim, K. Influence of uniform deposition of molybdenum disulfide particles on electrochemical reaction. Electrochim. Acta 2020, 353, 136480. [Google Scholar] [CrossRef]
  17. Lee, H.O.; Yesuraj, J.; Kim, K. Parametric study to optimize proton exchange membrane electrolyzer cells. Appl. Energy 2022, 314, 118928. [Google Scholar] [CrossRef]
  18. Lee, S.-H.; Lee, H.-O.; Kim, K. Micromachined dimples on carbon electrode for enhancing electrochemical reaction. Energy Convers. Manag. 2022, 255, 115320. [Google Scholar] [CrossRef]
  19. Voronova, A.; Kim, H.J.; Jang, J.H.; Park, H.Y.; Seo, B. Effect of low voltage limit on degradation mechanism during high-frequency dynamic load in proton exchange membrane water electrolysis. Int. J. Energy Res. 2022, 46, 11867–11878. [Google Scholar] [CrossRef]
  20. Menesy, A.S.; Sultan, H.M.; Korashy, A.; Kamel, S.; Jurado, F.L. A modified farmland fertility optimizer for parameters estimation of fuel cell models. Neural Comput. Appl. 2021, 33, 12169–12190. [Google Scholar] [CrossRef]
  21. Bahr, M.; Gusak, A.; Stypka, S.; Oberschachtsiek, B. Artificial Neural Networks for Aging Simulation of Electrolysis Stacks. Chem. Ing. Technol. 2020, 92, 1610–1617. [Google Scholar] [CrossRef]
  22. Curteanu, S.; Piuleac, C.G.; Godini, K.; Azaryan, G. Modeling of electrolysis process in wastewater treatment using different types of neural networks. Chem. Eng. J. 2011, 172, 267–276. [Google Scholar] [CrossRef]
  23. Wang, J.; Gao, Y.; Kong, H.; Kim, J.; Choi, S.; Ciucci, F.; Hao, Y.; Yang, S.; Shao, Z.; Lim, J. Non-precious-metal catalysts for alkaline water electrolysis: Operando characterizations, theoretical calculations, and recent advances. Chem. Soc. Rev. 2020, 49, 9154–9196. [Google Scholar] [CrossRef] [PubMed]
  24. Tapan, N.A.; Günay, M.E.; Yildirim, R. Constructing global models from past publications to improve design and operating conditions for direct alcohol fuel cells. Chem. Eng. Res. Des. 2016, 105, 162–170. [Google Scholar] [CrossRef]
  25. Satjaritanun, P.; O’Brien, M.; Kulkarni, D.; Shimpalee, S.; Capuano, C.; Ayers, K.E.; Danilovic, N.; Parkinson, D.Y.; Zenyuk, I.V. Observation of preferential pathways for oxygen removal through porous transport layers of polymer electrolyte water electrolyzers. iScience 2020, 23, 101783. [Google Scholar] [CrossRef]
  26. Hossain, S.S.; Ali, S.S.; Rushd, S.; Ayodele, B.V.; Cheng, C.K. Interaction effect of process parameters and Pd-electrocatalyst in formic acid electro-oxidation for fuel cell applications: Implementing supervised machine learning algorithms. Int. J. Energy Res. 2022. [Google Scholar] [CrossRef]
  27. Lee, B.; Park, K.; Kim, H.M. Dynamic simulation of PEM water electrolysis and comparison with experiments. Int. J. Electrochem. Sci. 2013, 8, 235–248. [Google Scholar]
  28. Navarro-Solís, I.; Villalba-Almendra, L.; Alvarez-Gallegos, A. H2 production by PEM electrolysis, assisted by textile effluent treatment and a solar photovoltaic cell. Int. J. Hydrogen Energy 2010, 35, 10833–10841. [Google Scholar] [CrossRef]
  29. Sarno, M.; Ponticorvo, E. High hydrogen production rate on RuS2@MoS2 hybrid nanocatalyst by PEM electrolysis. Int. J. Hydrogen Energy 2019, 44, 4398–4405. [Google Scholar] [CrossRef]
  30. Gibson, T.L.; Kelly, N.A. Optimization of solar powered hydrogen production using photovoltaic electrolysis devices. Int. J. Hydrogen Energy 2008, 33, 5931–5940. [Google Scholar] [CrossRef]
  31. Caravaca, A.; Sapountzi, F.M.; de Lucas-Consuegra, A.; Molina-Mora, C.; Dorado, F.; Valverde, J.L. Electrochemical reforming of ethanol–water solutions for pure H2 production in a PEM electrolysis cell. Int. J. Hydrogen Energy 2012, 37, 9504–9513. [Google Scholar] [CrossRef]
  32. Siracusano, S.; Baglio, V.; Briguglio, N.; Brunaccini, G.; Di Blasi, A.; Stassi, A.; Ornelas, R.; Trifoni, E.; Antonucci, V.; Aricò, A.S. An electrochemical study of a PEM stack for water electrolysis. Int. J. Hydrogen Energy 2012, 37, 1939–1946. [Google Scholar] [CrossRef]
  33. Garcia-Valverde, R.; Espinosa, N.; Urbina, A. Simple PEM water electrolyser model and experimental validation. Int. J. Hydrogen Energy 2011, 37, 1927–1938. [Google Scholar] [CrossRef]
  34. Selamet, Ö.F.; Becerikli, F.; Mat, M.D.; Kaplan, Y. Development and testing of a highly efficient proton exchange membrane (PEM) electrolyzer stack. Int. J. Hydrogen Energy 2011, 36, 11480–11487. [Google Scholar] [CrossRef]
  35. Garcia, A.L.T.; Mirzaeian, M.; Chisholm, G.; Olabi, A.G. Design and testing of a single-cell PEM electrolyser for small-scale hydrogen production under mild conditions. In Proceedings of the 10th International Conference on Sustainable Energy and Environmental Protection: Mechanical Engineering, Bled, Slovenia, 27–30 June 2017. [Google Scholar]
  36. Mahesh, K.N.; Prasad, J.S.; Rao, M.V.; Himabindu, V.; Yerramilli, A.; Rao, P.R. Performance of Pd on activated carbon as hydrogen electrode with respect to hydrogen yield in a single cell proton exchange membrane (PEM) water electrolyser. Int. J. Hydrogen Energy 2009, 34, 6085–6088. [Google Scholar] [CrossRef]
  37. Tebibel, H.; Medjebour, R. Comparative performance analysis of a grid connected PV system for hydrogen production using PEM water, methanol and hybrid sulfur electrolysis. Int. J. Hydrogen Energy 2018, 43, 3482–3498. [Google Scholar] [CrossRef]
  38. Siracusano, S.; Baglio, V.; Briguglio, N.; Brunaccini, G.; Di Blasi, A.; Stassi, A.; Ornelas, R.; Trifoni, E.; Antonucci, V.; Aricò, A.S. Optimization of components and assembling in a PEM electrolyzer stack. Int. J. Hydrogen Energy 2011, 36, 3333–3339. [Google Scholar] [CrossRef]
  39. Ostertagová, E. Modelling using Polynomial Regression. Procedia Eng. 2012, 48, 500–506. [Google Scholar] [CrossRef] [Green Version]
  40. Hosmer, D.W., Jr.; Lemeshow, S.; Sturdivant, R.X. Applied Logistic Regression; John Wiley & Sons: Hoboken, NJ, USA, 2000. [Google Scholar]
Figure 1. Schematic of the PEM electrolyzer cell.
Energies 15 06657 g001
Figure 2. Effect of changing the degree of the polynomial regression on the learning curve. The black squares represent the data samples.
Energies 15 06657 g002
Figure 3. An example of a learned logistic regression curve.
Energies 15 06657 g003
Figure 4. Schematic diagram of experimental apparatus for PEM water electrolyzer cell experiments [17].
Energies 15 06657 g004
Figure 5. Training and Testing Accuracy/MAE for each ML model. (a) Training/Testing Accuracy for each classification model (anode type, cathode type, membrane type, cathode catalyst, anode catalyst, catholyte, and anolyte); (b) Training/Testing MAE for each regression model (power, temperature, water flow rate, and number of cells).
Energies 15 06657 g005
Figure 6. Hydrogen production rate for experiment and ML model.
Energies 15 06657 g006
Table 1. Categories and Values range of the dataset.
ParameterCategory/Value Range
Anode/Cathode typePorous titanium, titanium, porous carbon, 304 stainless steel, carbon plate
Membrane typenafion112, nafion115, nafion117, nafion110
Cathode catalyst4 mg/cm2 platinum, (0.5) mg/cm2 platinum, nano sheets of MoS2/RuS2,10% platinum, 20% platinum, 30% platinum, 5% Palladium, 10% Palladium
Anode catalystUsing 2 (mg/cm2) platinum and 2 (mg/cm2) iridium oxide (IrO2),1 (mg/cm2) iridium oxide (IrO2), ruthenium oxide or iridium oxide, 40% platinum and 20% ruthenium, iridium oxide (IrO2), Ruthenium (RuO2), Platinum and ruthenium (RuO2), platinum and iridium oxide (IrO2)
Anolyte/Catholytehybrid sulfur (SO2), 4 mol methanol, pure water, normal water, Deionized water, wastewater + 2 L of (0.1) mol of Sulfuric acid (H2SO4), wastewater + 2 L OF (0.05) Na2SO5, (0.5) mol Sulfuric acid H2SO4
Cell design typeSingle or bipolar
Number of cells1–20 cells
Hydrogen flow rate (mL/min)0–5000
Power (w)0–1300
Water flow rate (mL/min)5–750
cell Temperature (k)298–359
Pressure (atm)1
Table 2. Input and predicted PEM cell design by our model.
Input ParametersExp 1Exp 2Exp 3Exp 4
Hydrogen production rate (mL/min)2.557.510
Cathode area (mm2)900900900900
Anode area (mm2)900900900900
Type of cell designsinglesinglesinglesingle
Predicted Parameters
Anode typeCarbon plateCarbon plateCarbon plateCarbon plate
Cathode typeCarbon plateCarbon plateCarbon plateCarbon plate
Membrane typenafion115nafion115nafion115nafion115
Cathode catalystPt/C (20% Pt)Pt/C (20% Pt)Pd/C (10% Pd)Pd/C (10% Pd)
Anode catalystRuthenium (RuO2)Ruthenium (RuO2)Ruthenium (RuO2)Ruthenium (RuO2)
Anolytepure waterpure waterpure waterpure water
Catholytepure waterpure waterpure waterpure water
Power (W)2.152.683.213.75
Water flow rate (mL/min)12.6213.614.6215.61
Cell Temperature (K)332.75332.95333.15333.36
Number of cells1111
Table 3. Hydrogen flow rate (mL/min) measurement for each experiment.
No.Exp 1Exp 2Exp 3Exp 4
13.16.06.99.2
22.95.57.29.6
33.35.66.710.0
43.45.97.09.7
53.36.07.39.5
Average value3.25.87.09.6
Table 4. Optimal predicted parameters for suggested commercial-sized PEM cell designs.
Design Parameters(500 mL/min) Hydrogen Production Rate (1000 mL/min) Hydrogen Production Rate(3000 mL/min) Hydrogen Production Rate(4500 mL/min) Hydrogen Production Rate
Anode typeTitaniumTitaniumTitaniumTitanium
Cathode typeTitaniumTitaniumTitaniumTitanium
Membrane typeNafion 115Nafion 115Nafion 115Nafion 115
Cathode catalystPt/C (10% Pt)Pt/C (10% Pt)Pt/C (30% Pt)Pt/C (30% Pt)
Anode catalystRuthenium (RuO2) or Iridium oxide (IrO2)Ruthenium (RuO2) or Iridium oxide (IrO2)Iridium oxide (IrO2)Iridium oxide (IrO2)
AnolyteDeionized WaterDeionized WaterDeionized WaterDeionized Water
CatholyteDeionized WaterDeionized WaterDeionized WaterDeionized Water
Power (W)98.9190.5531.7874.8
Water flow rate (mL/min)18.830.66953.7
Cell Temperature(K)304311339359
Number of cells1815611
Publisher’s Note: MDPI stays neutral with regard to jurisdictional claims in published maps and institutional affiliations.

