
IoT-Based Alternating Current Electrical Parameters Monitoring System


Abstract
:1. Introduction
1.1. Motivation
1.2. Related Works
2. Materials and Methods
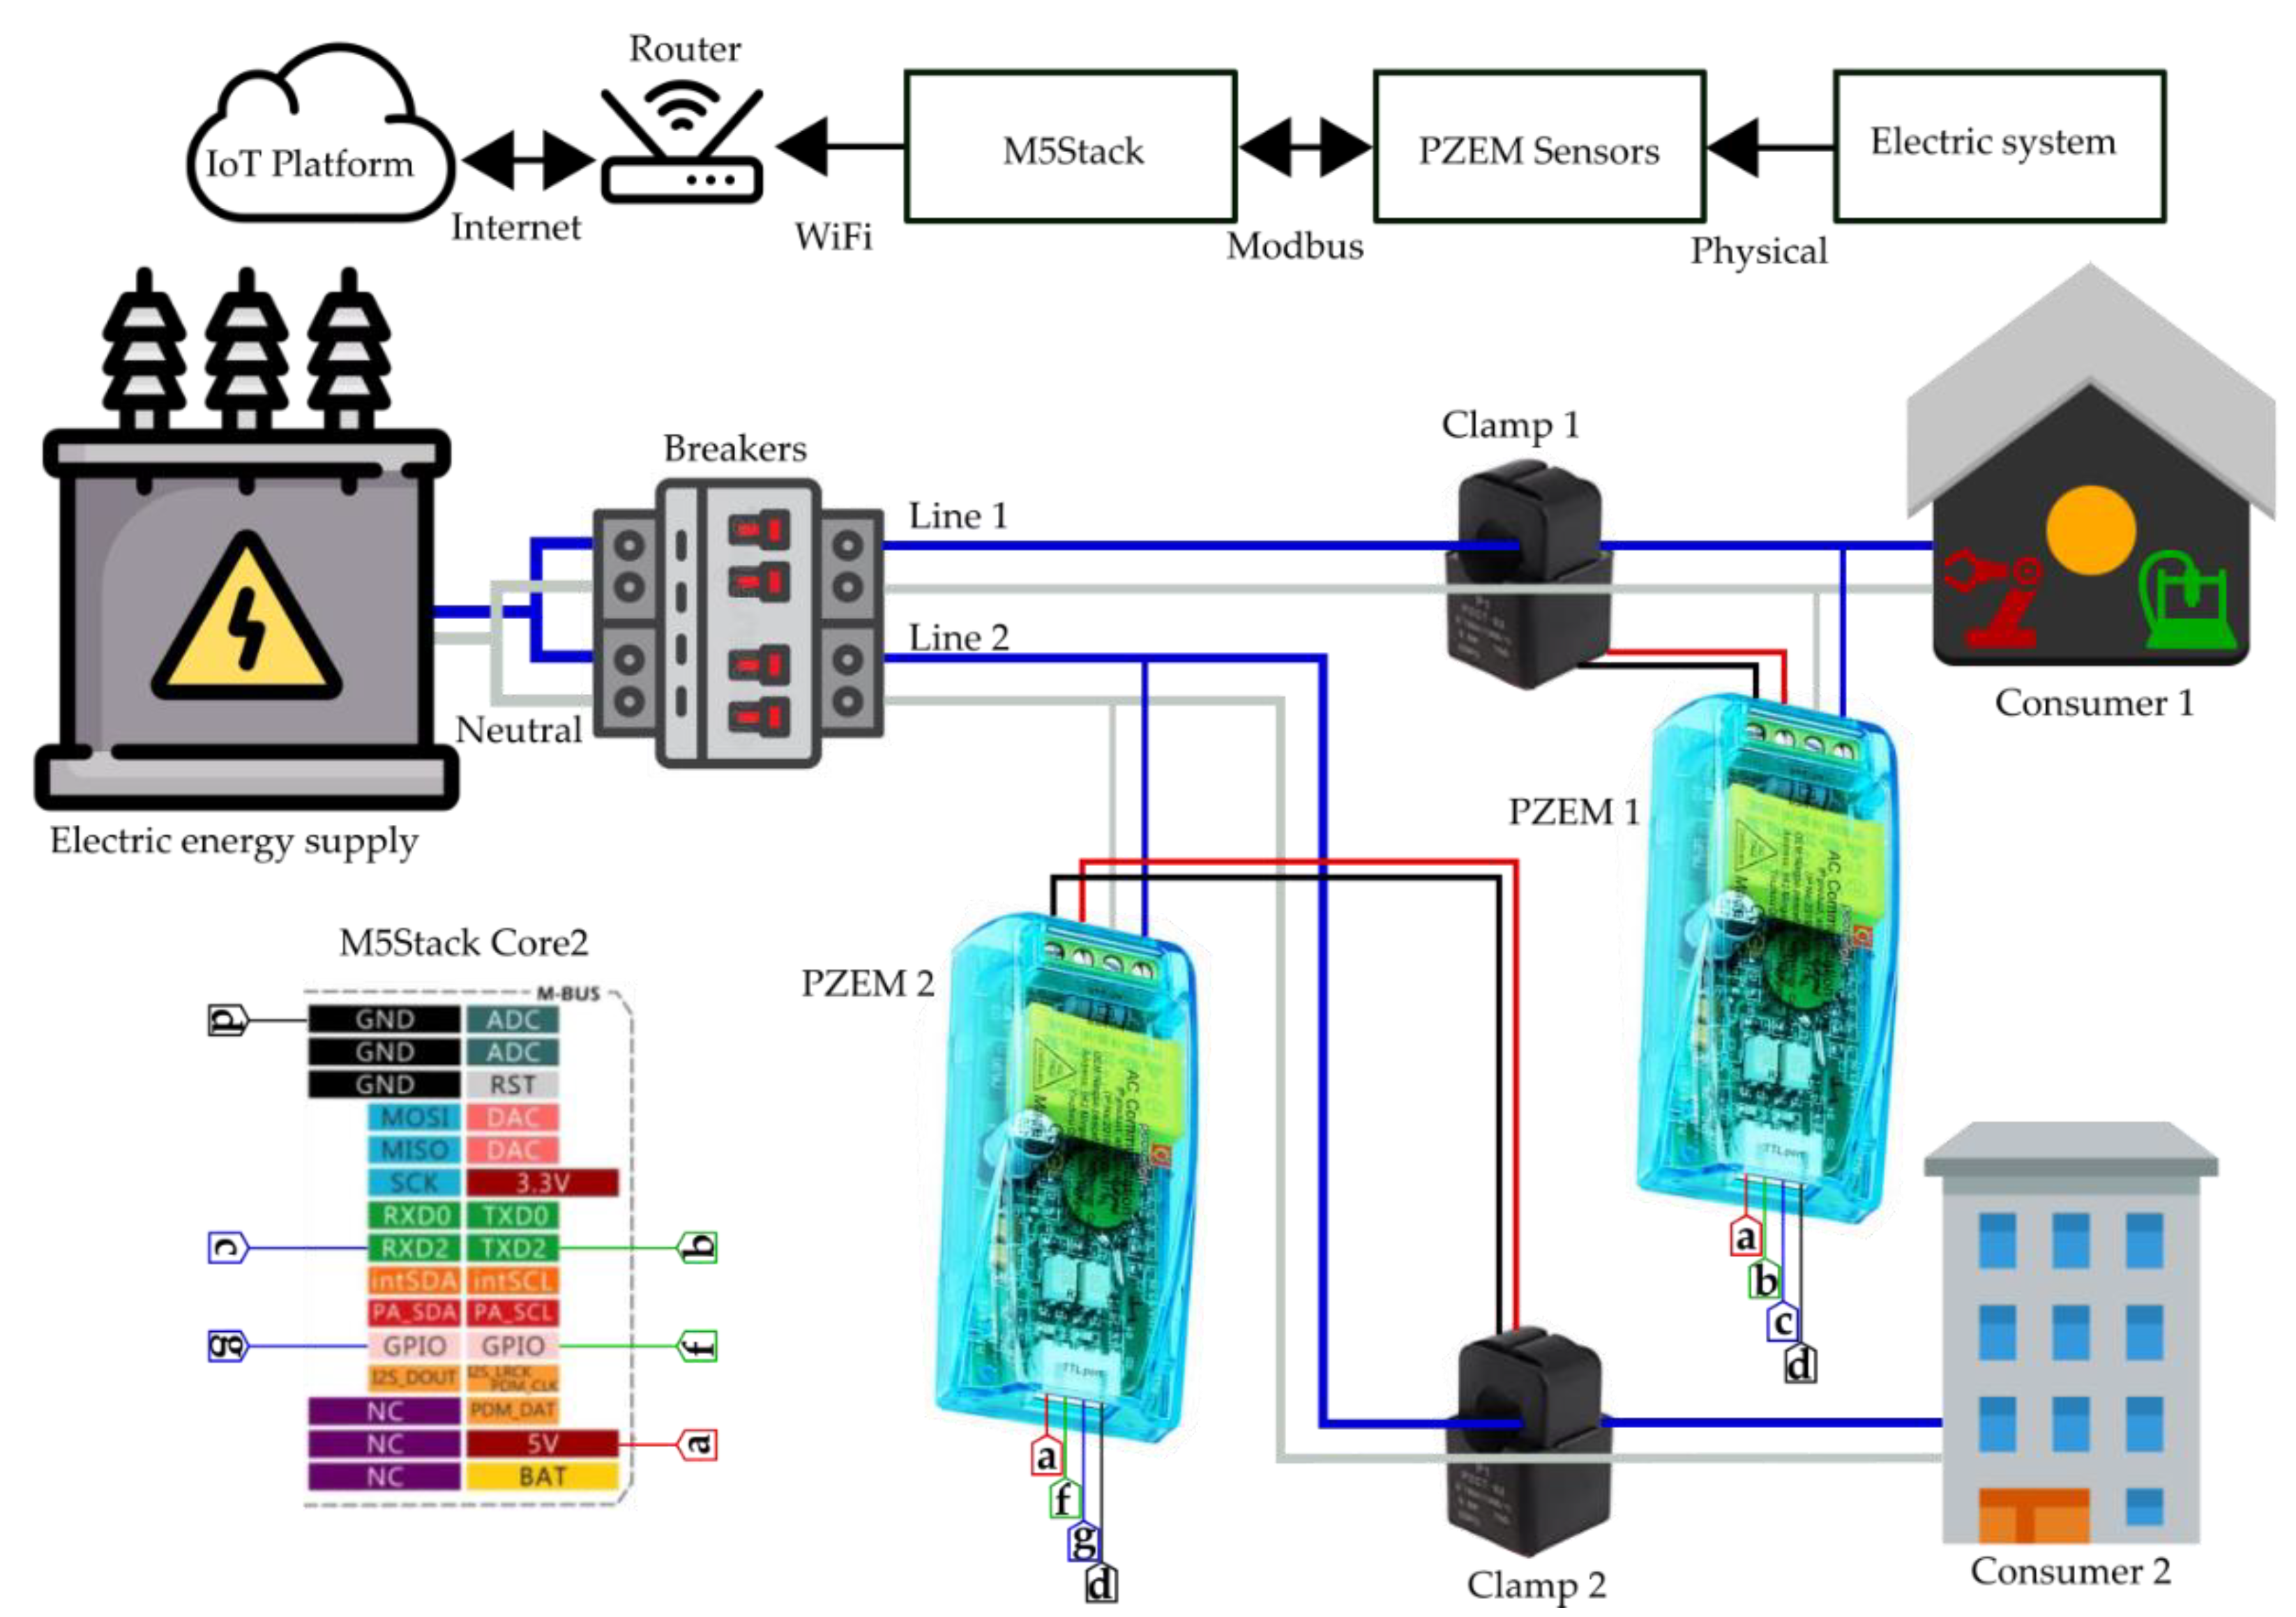
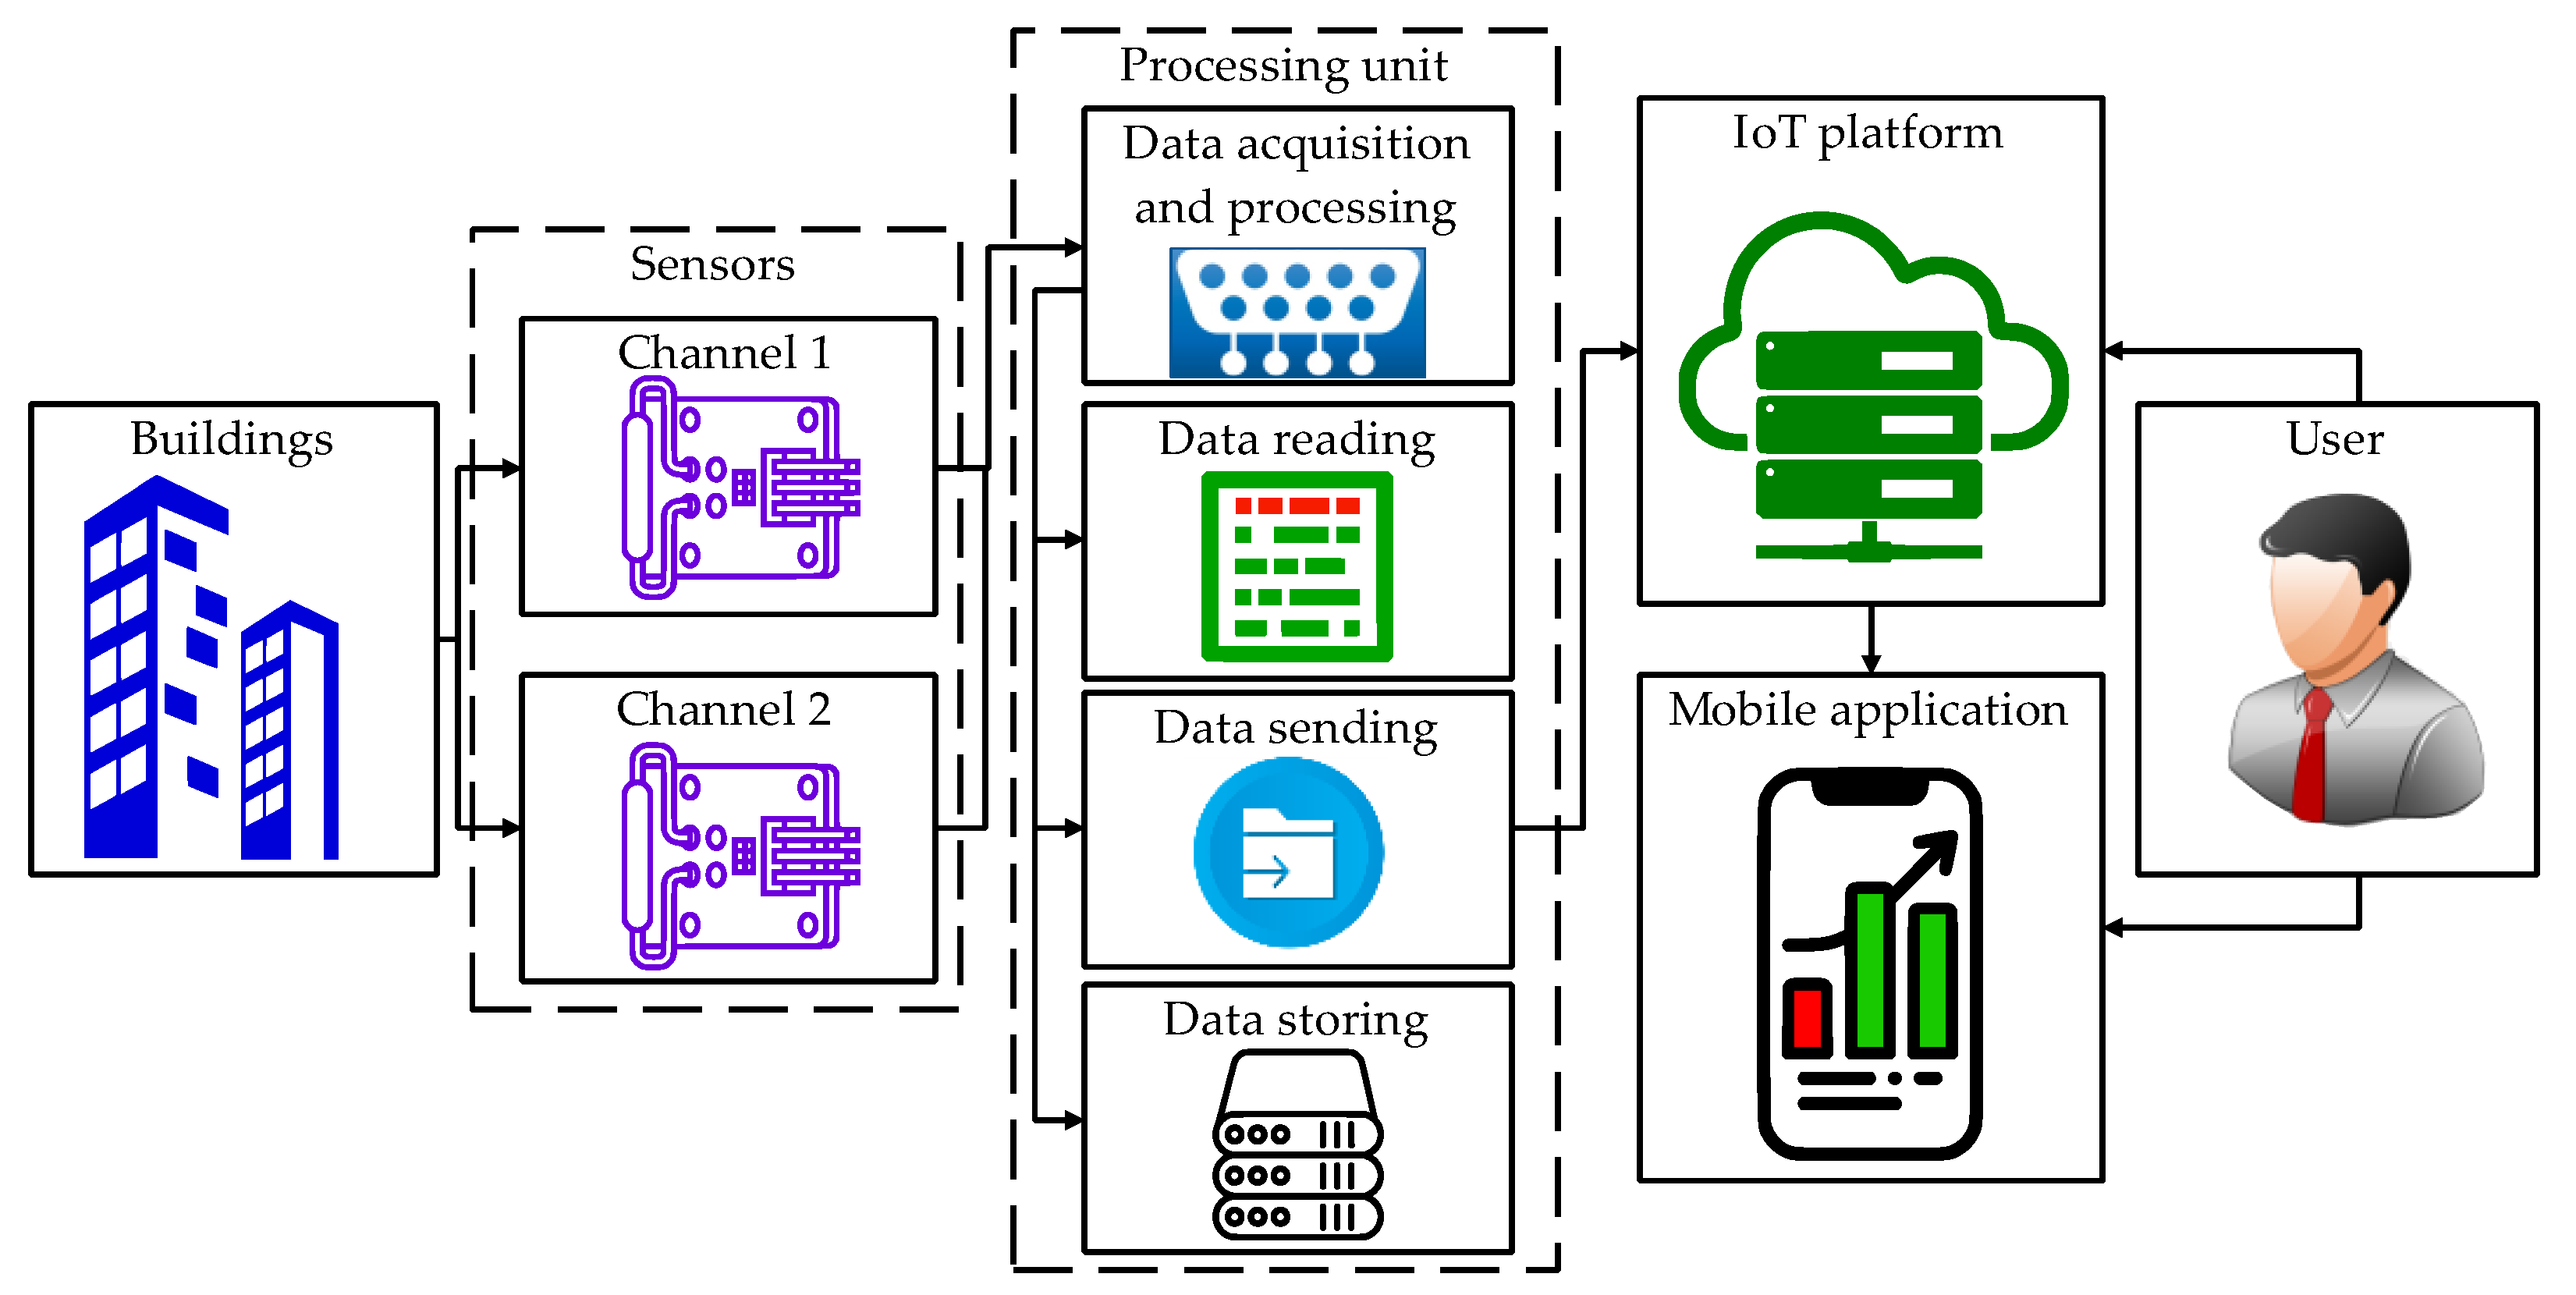
2.1. General Description
2.2. Hardware
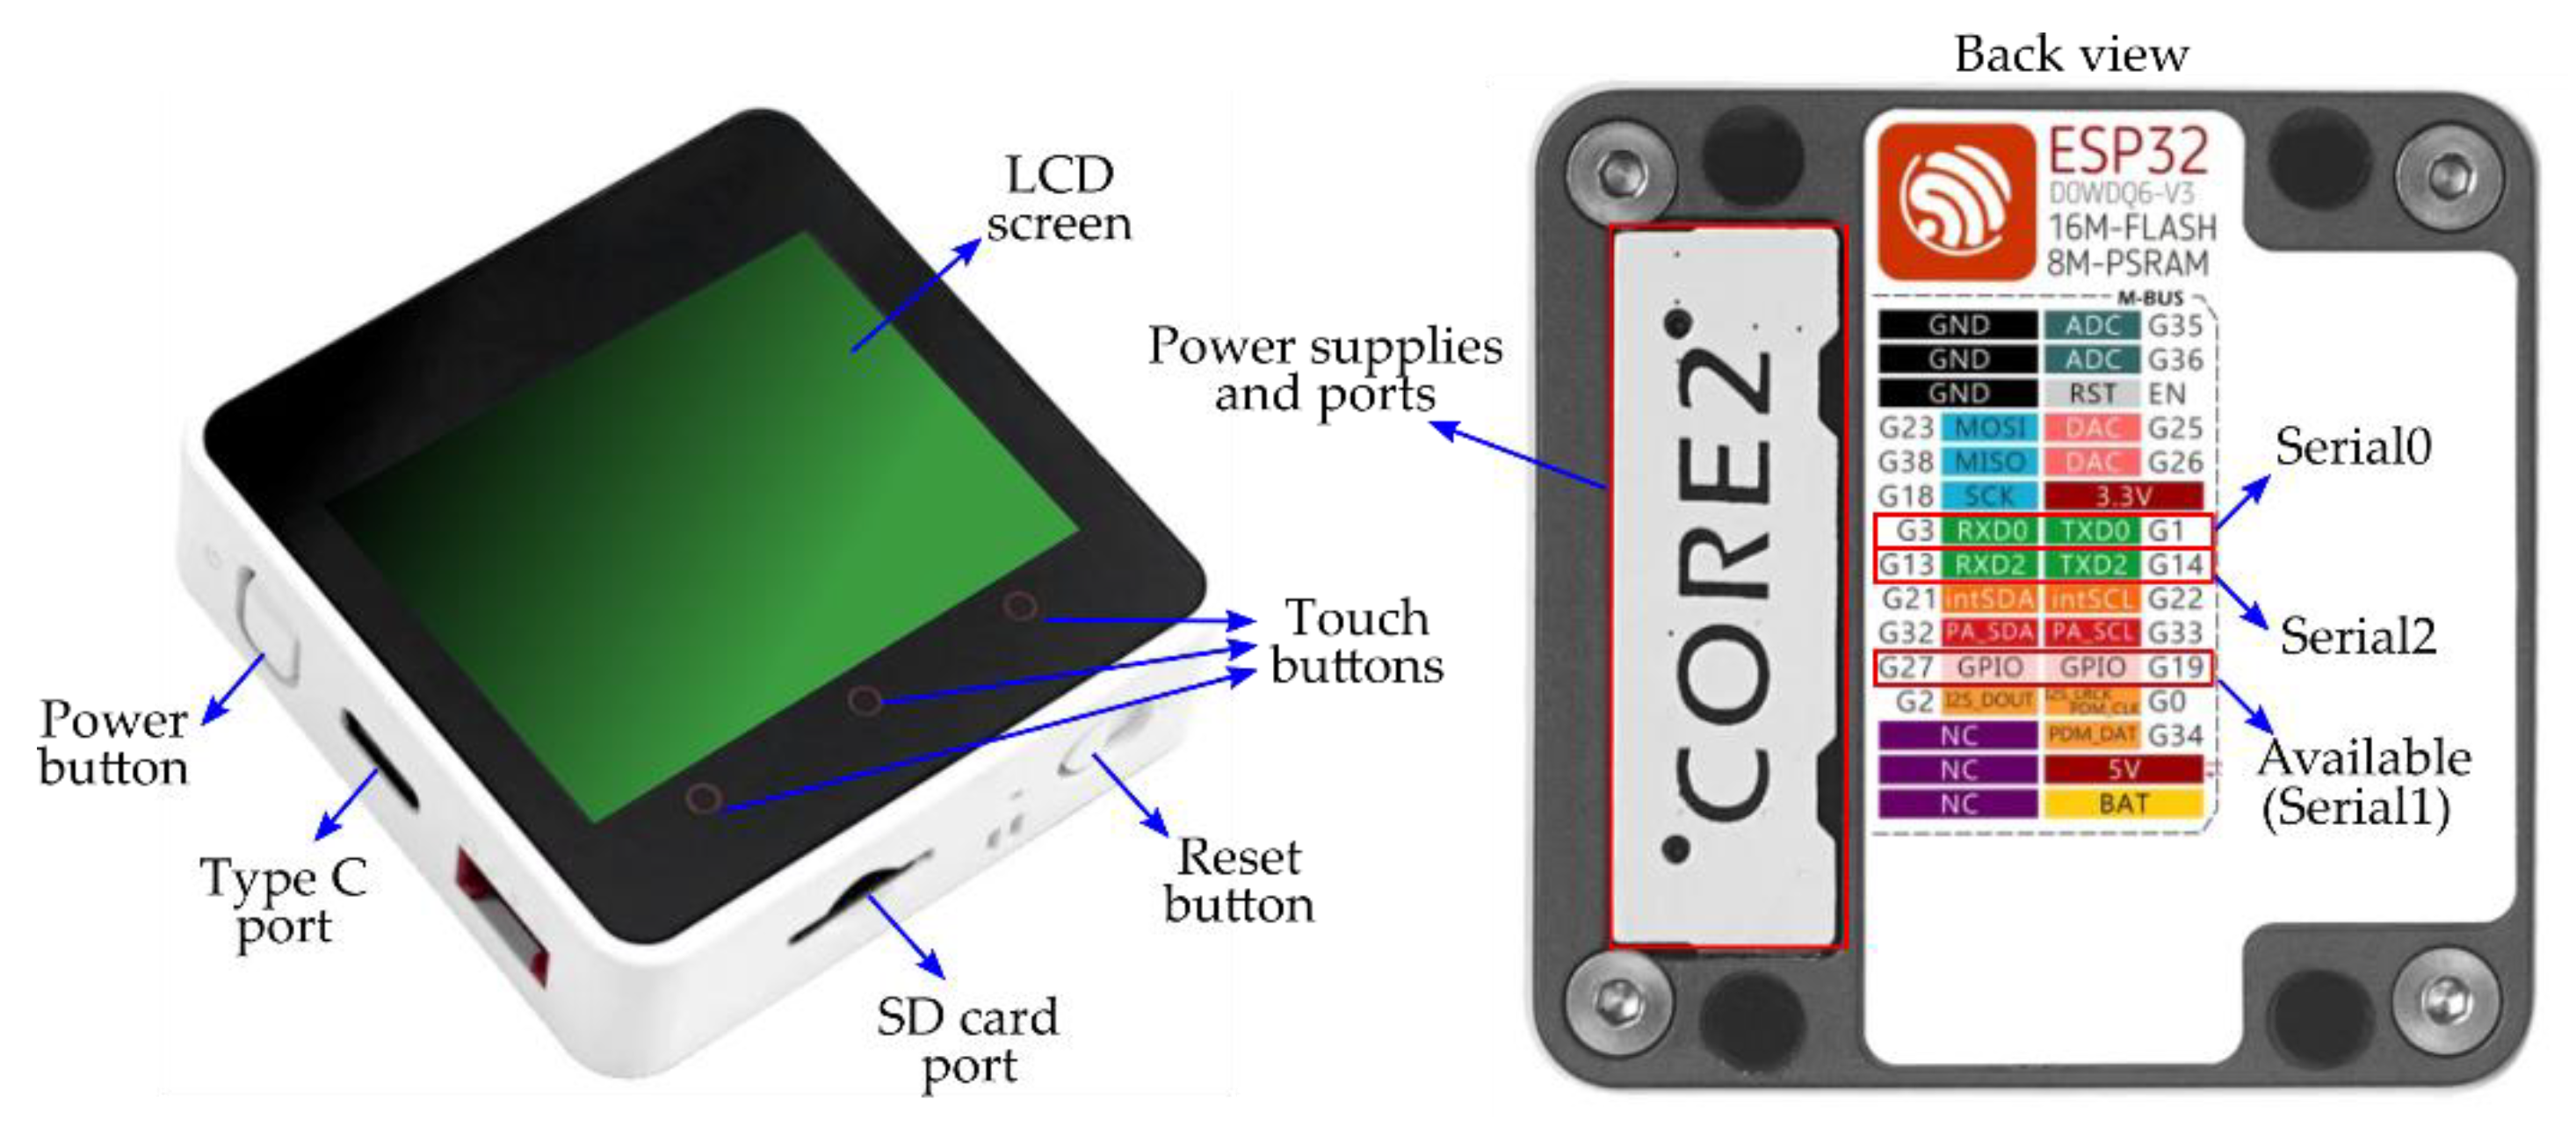
2.2.1. Processing Unit
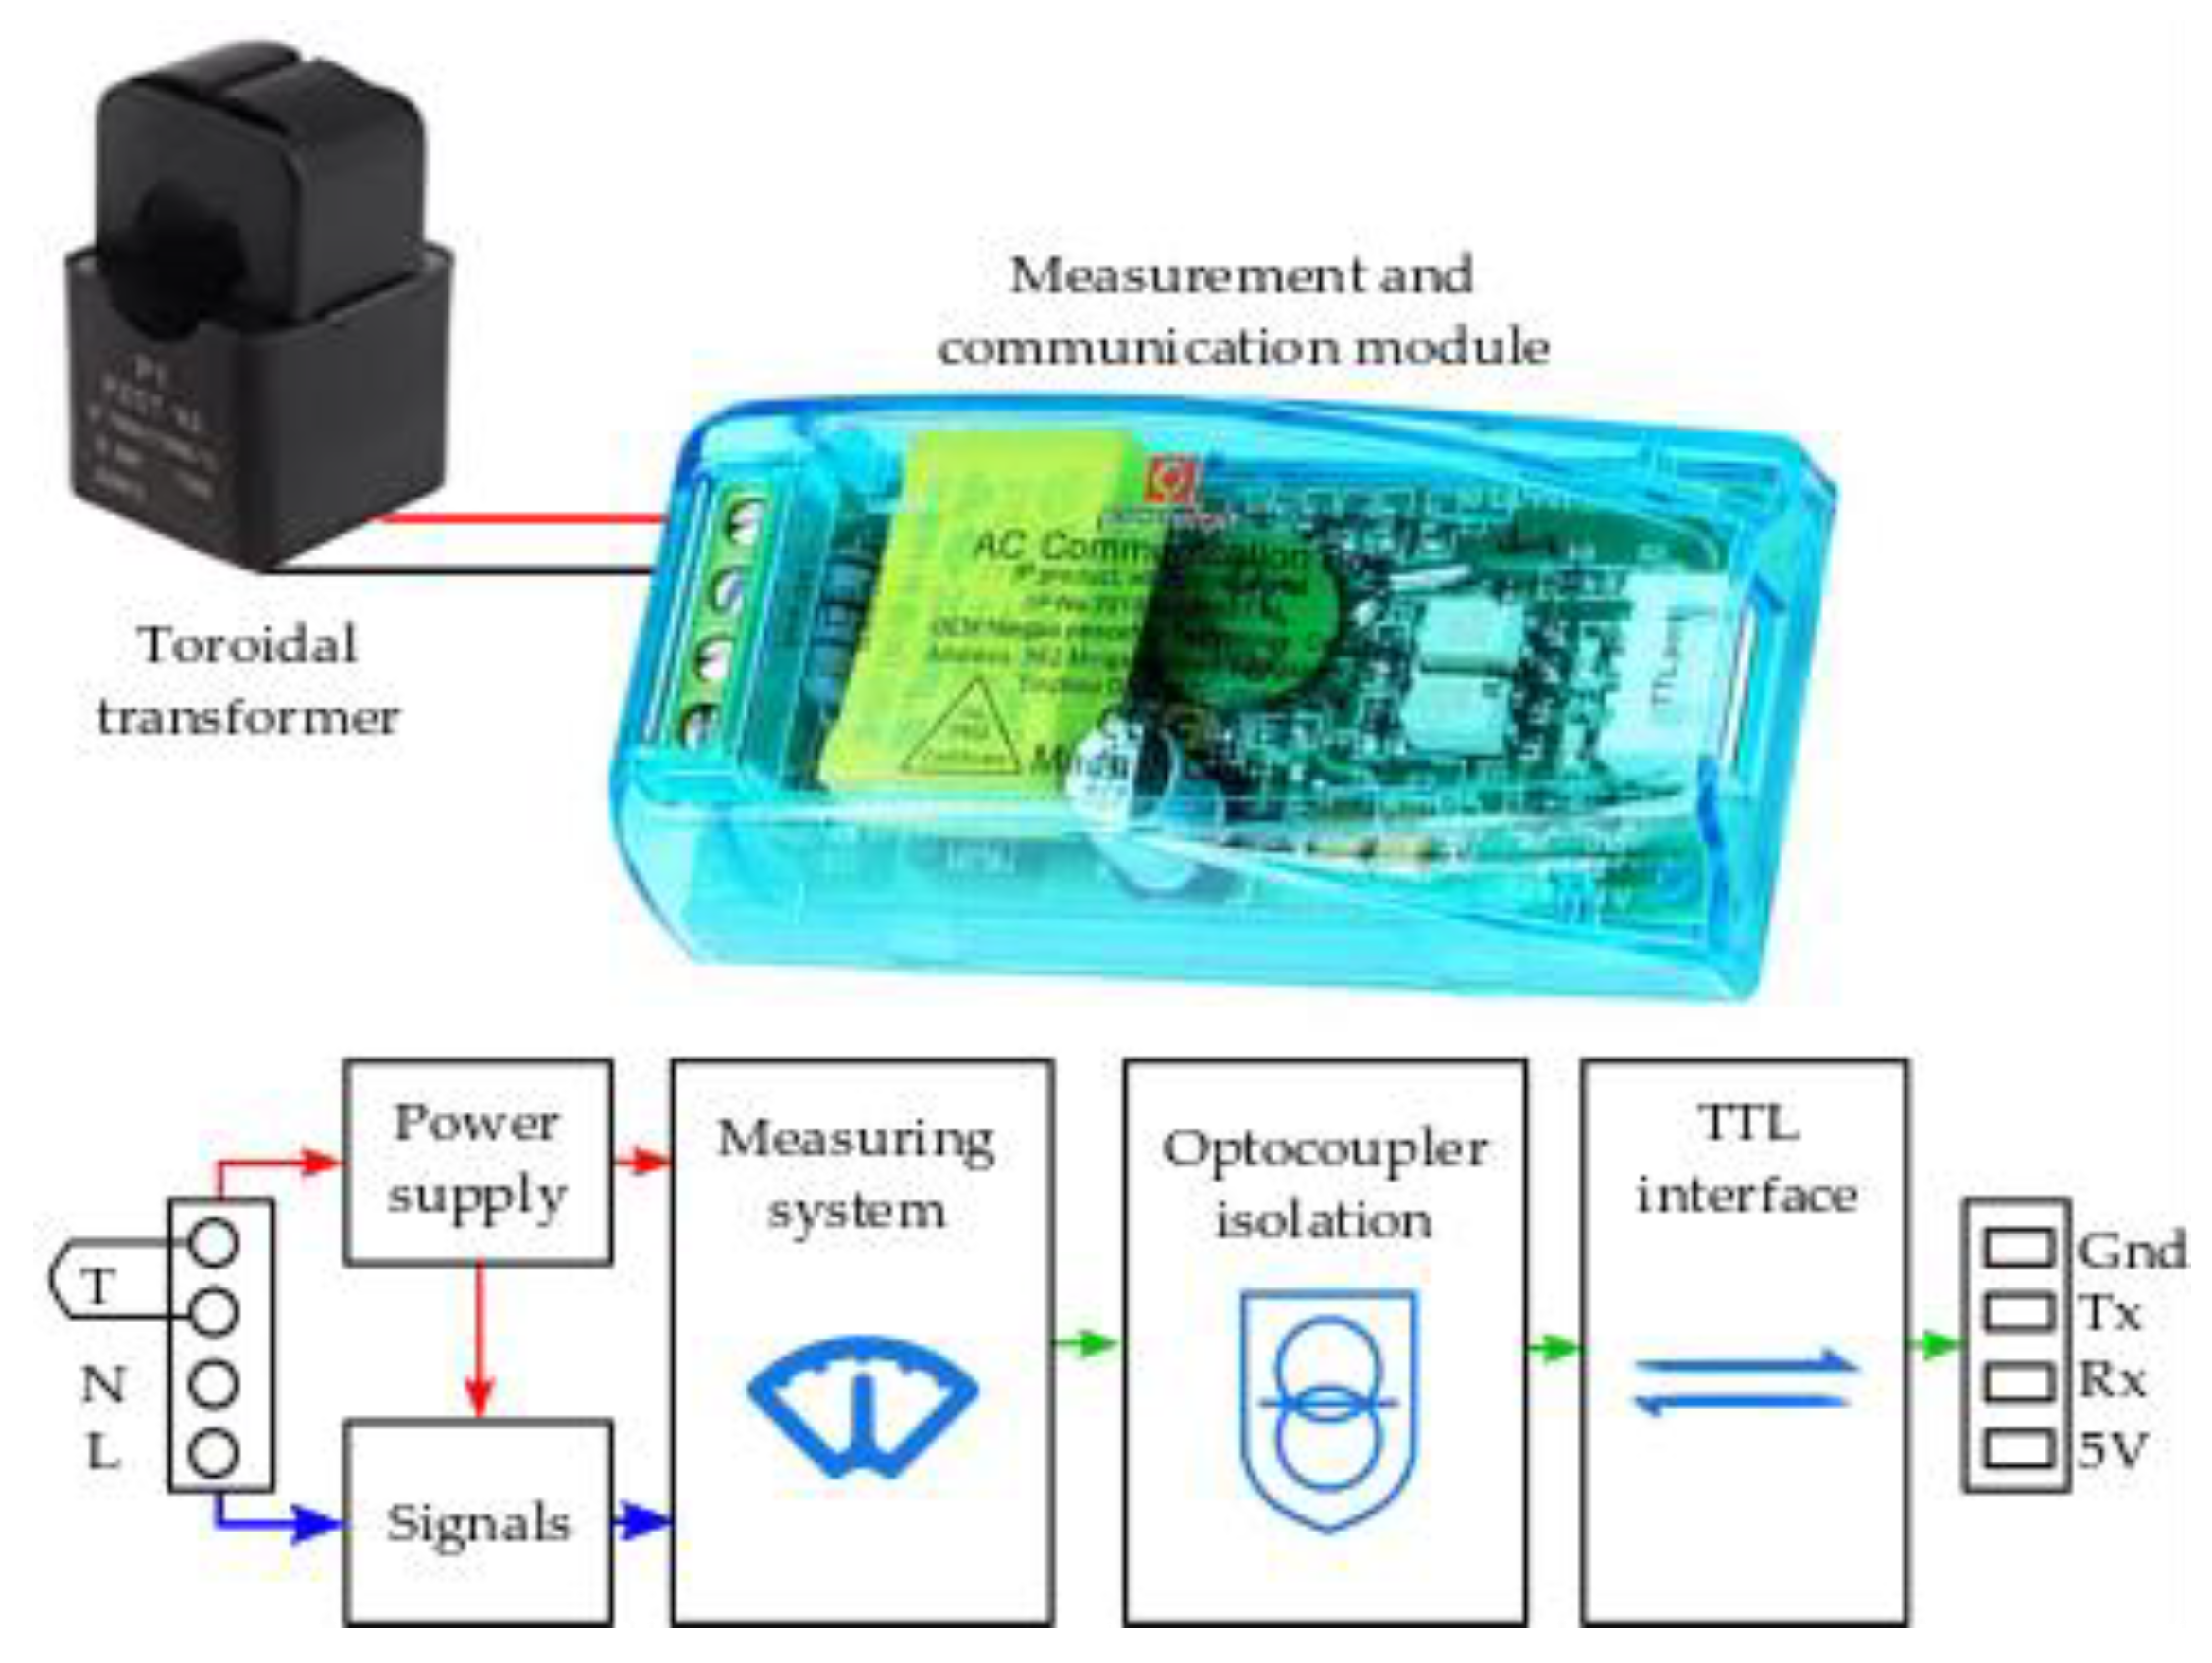
2.2.2. Data Acquisition
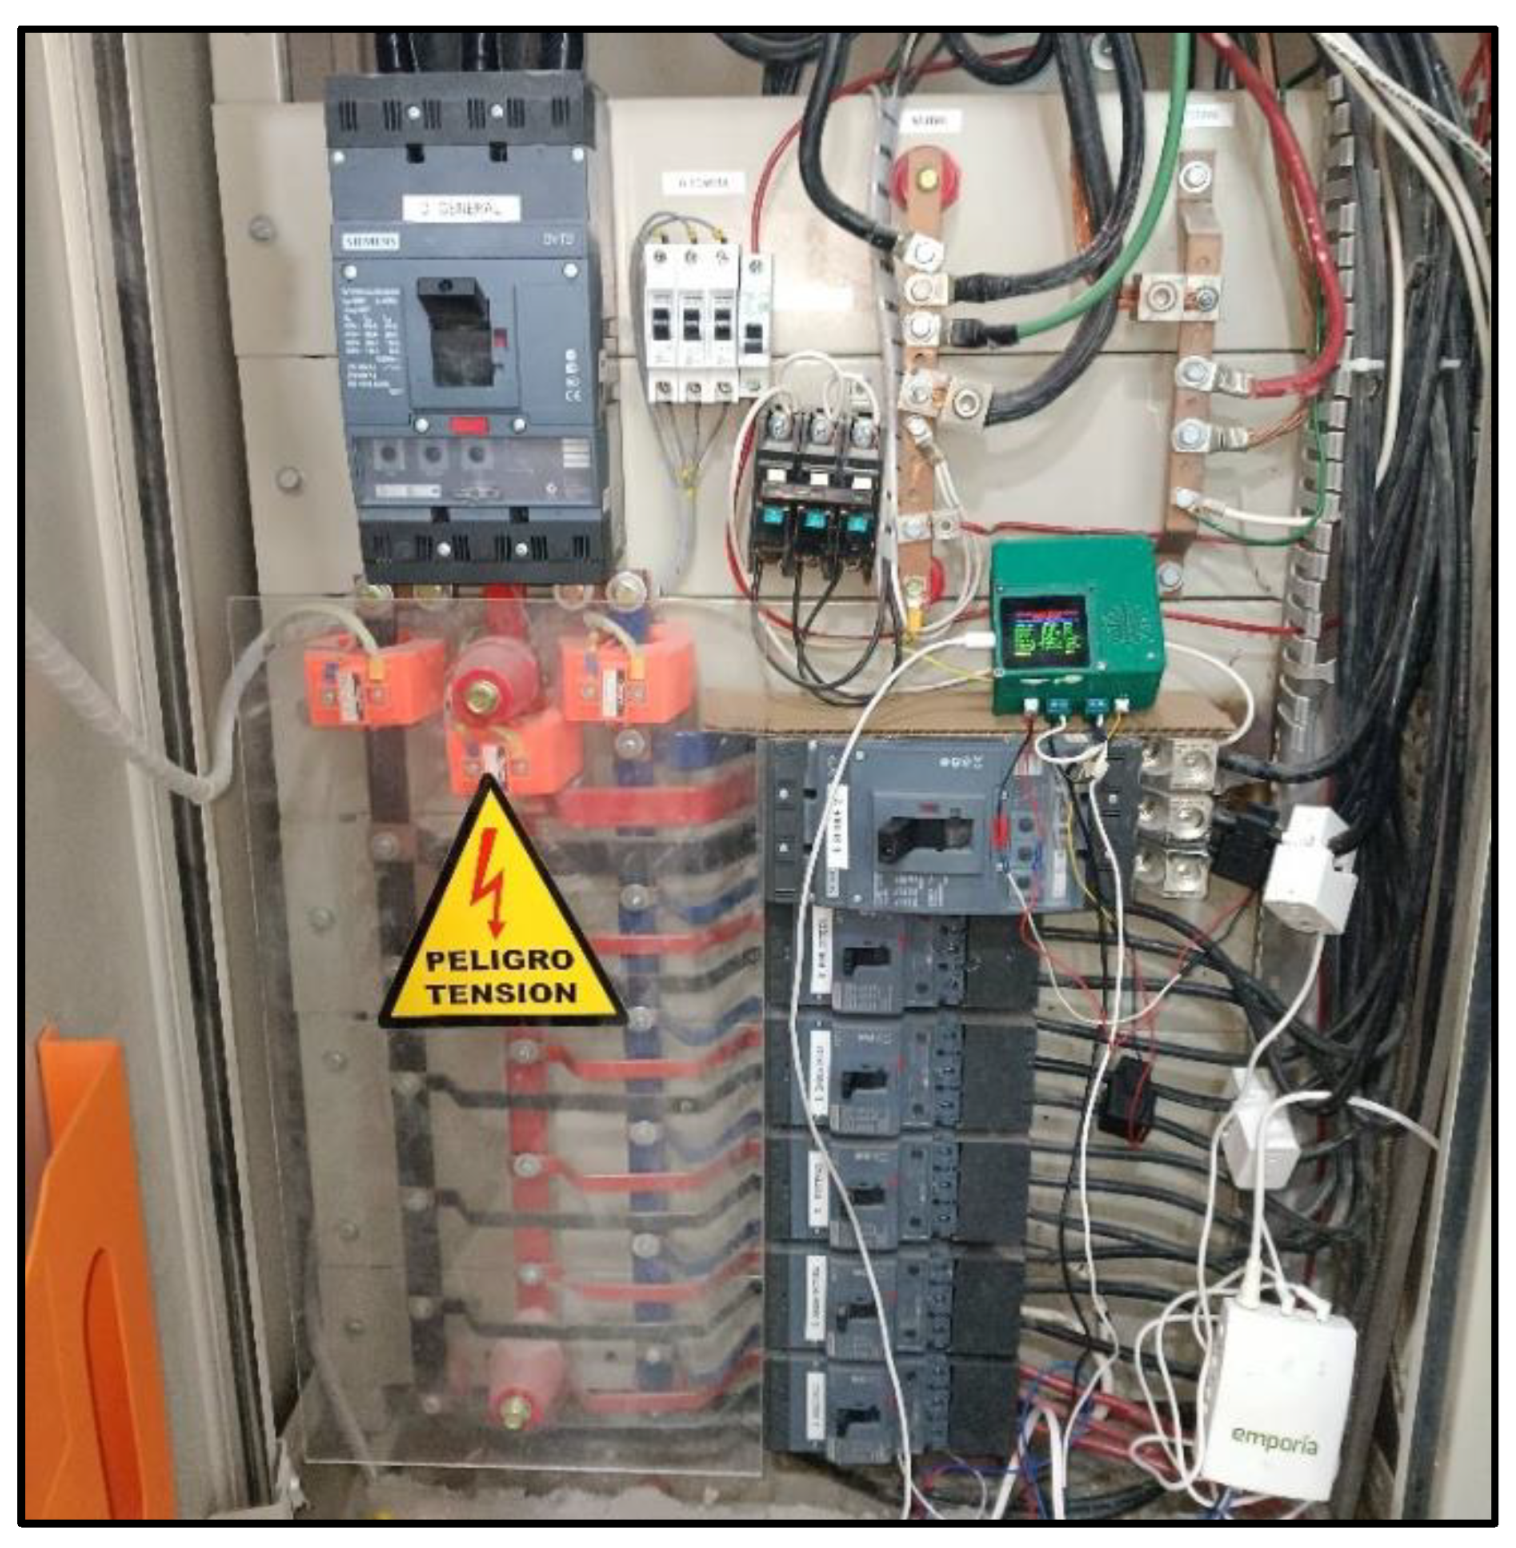
2.2.3. Electric Connections
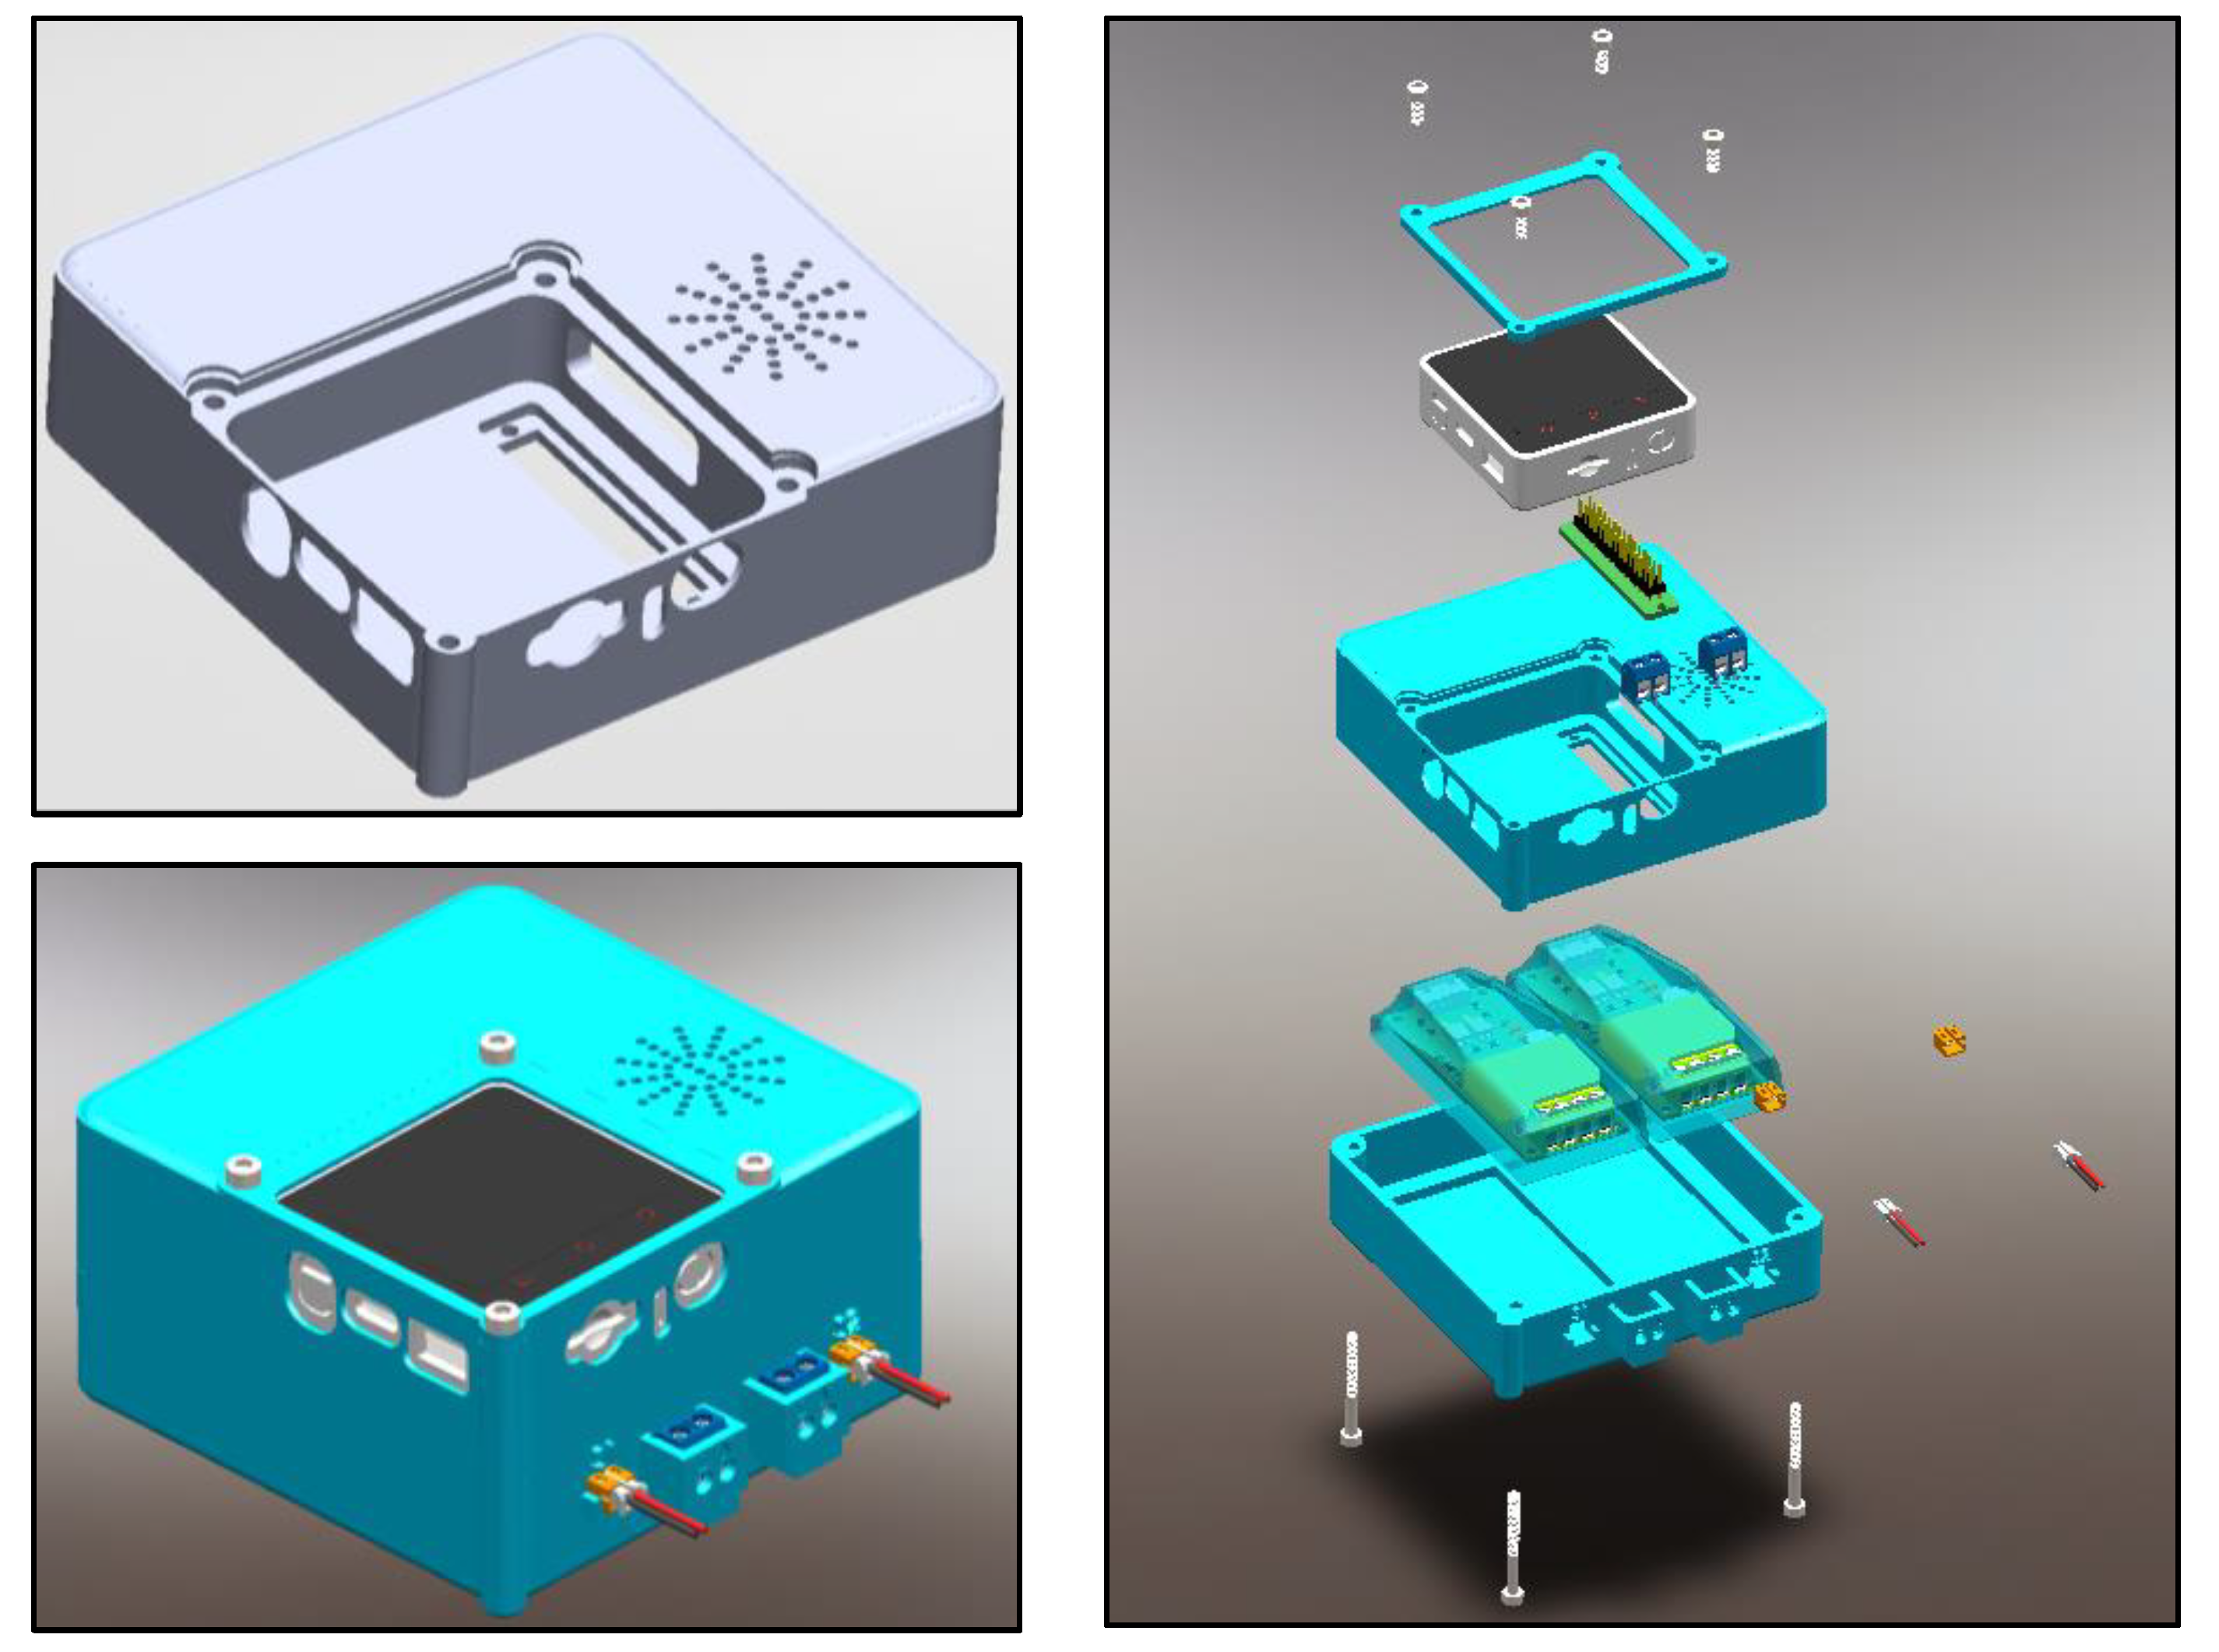
2.2.4. Case
2.3. Software
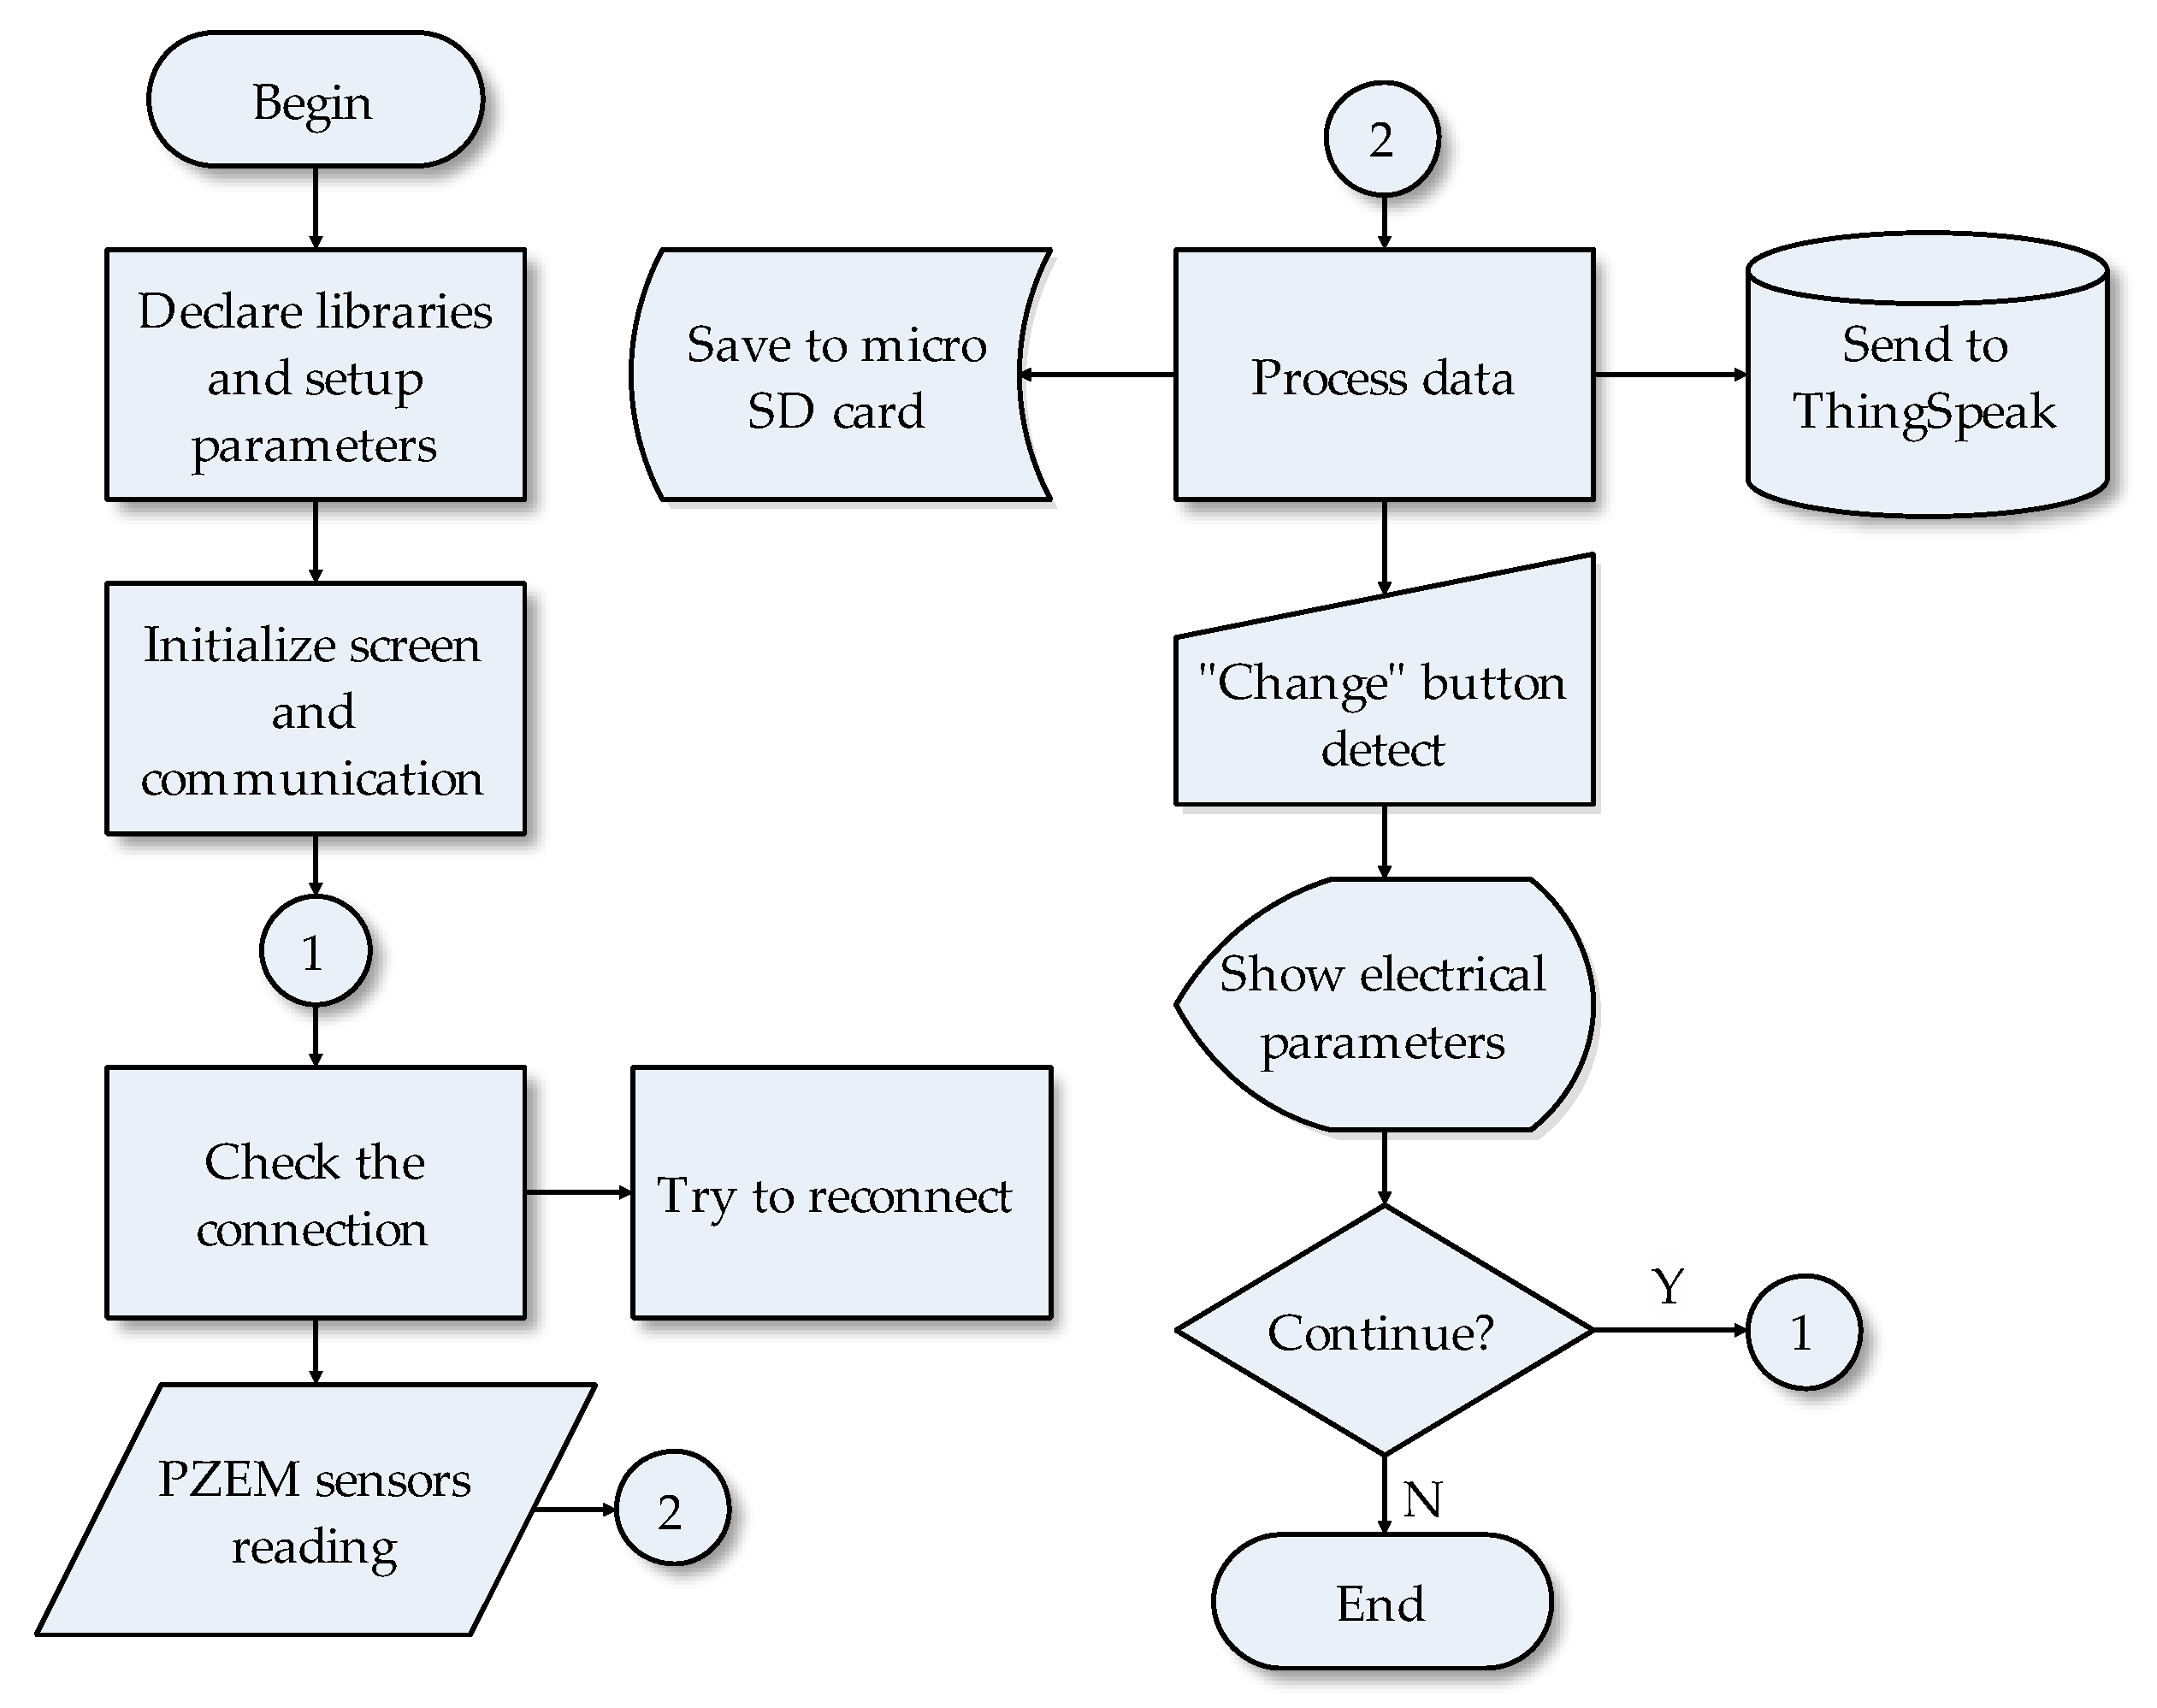
2.3.1. Main Program
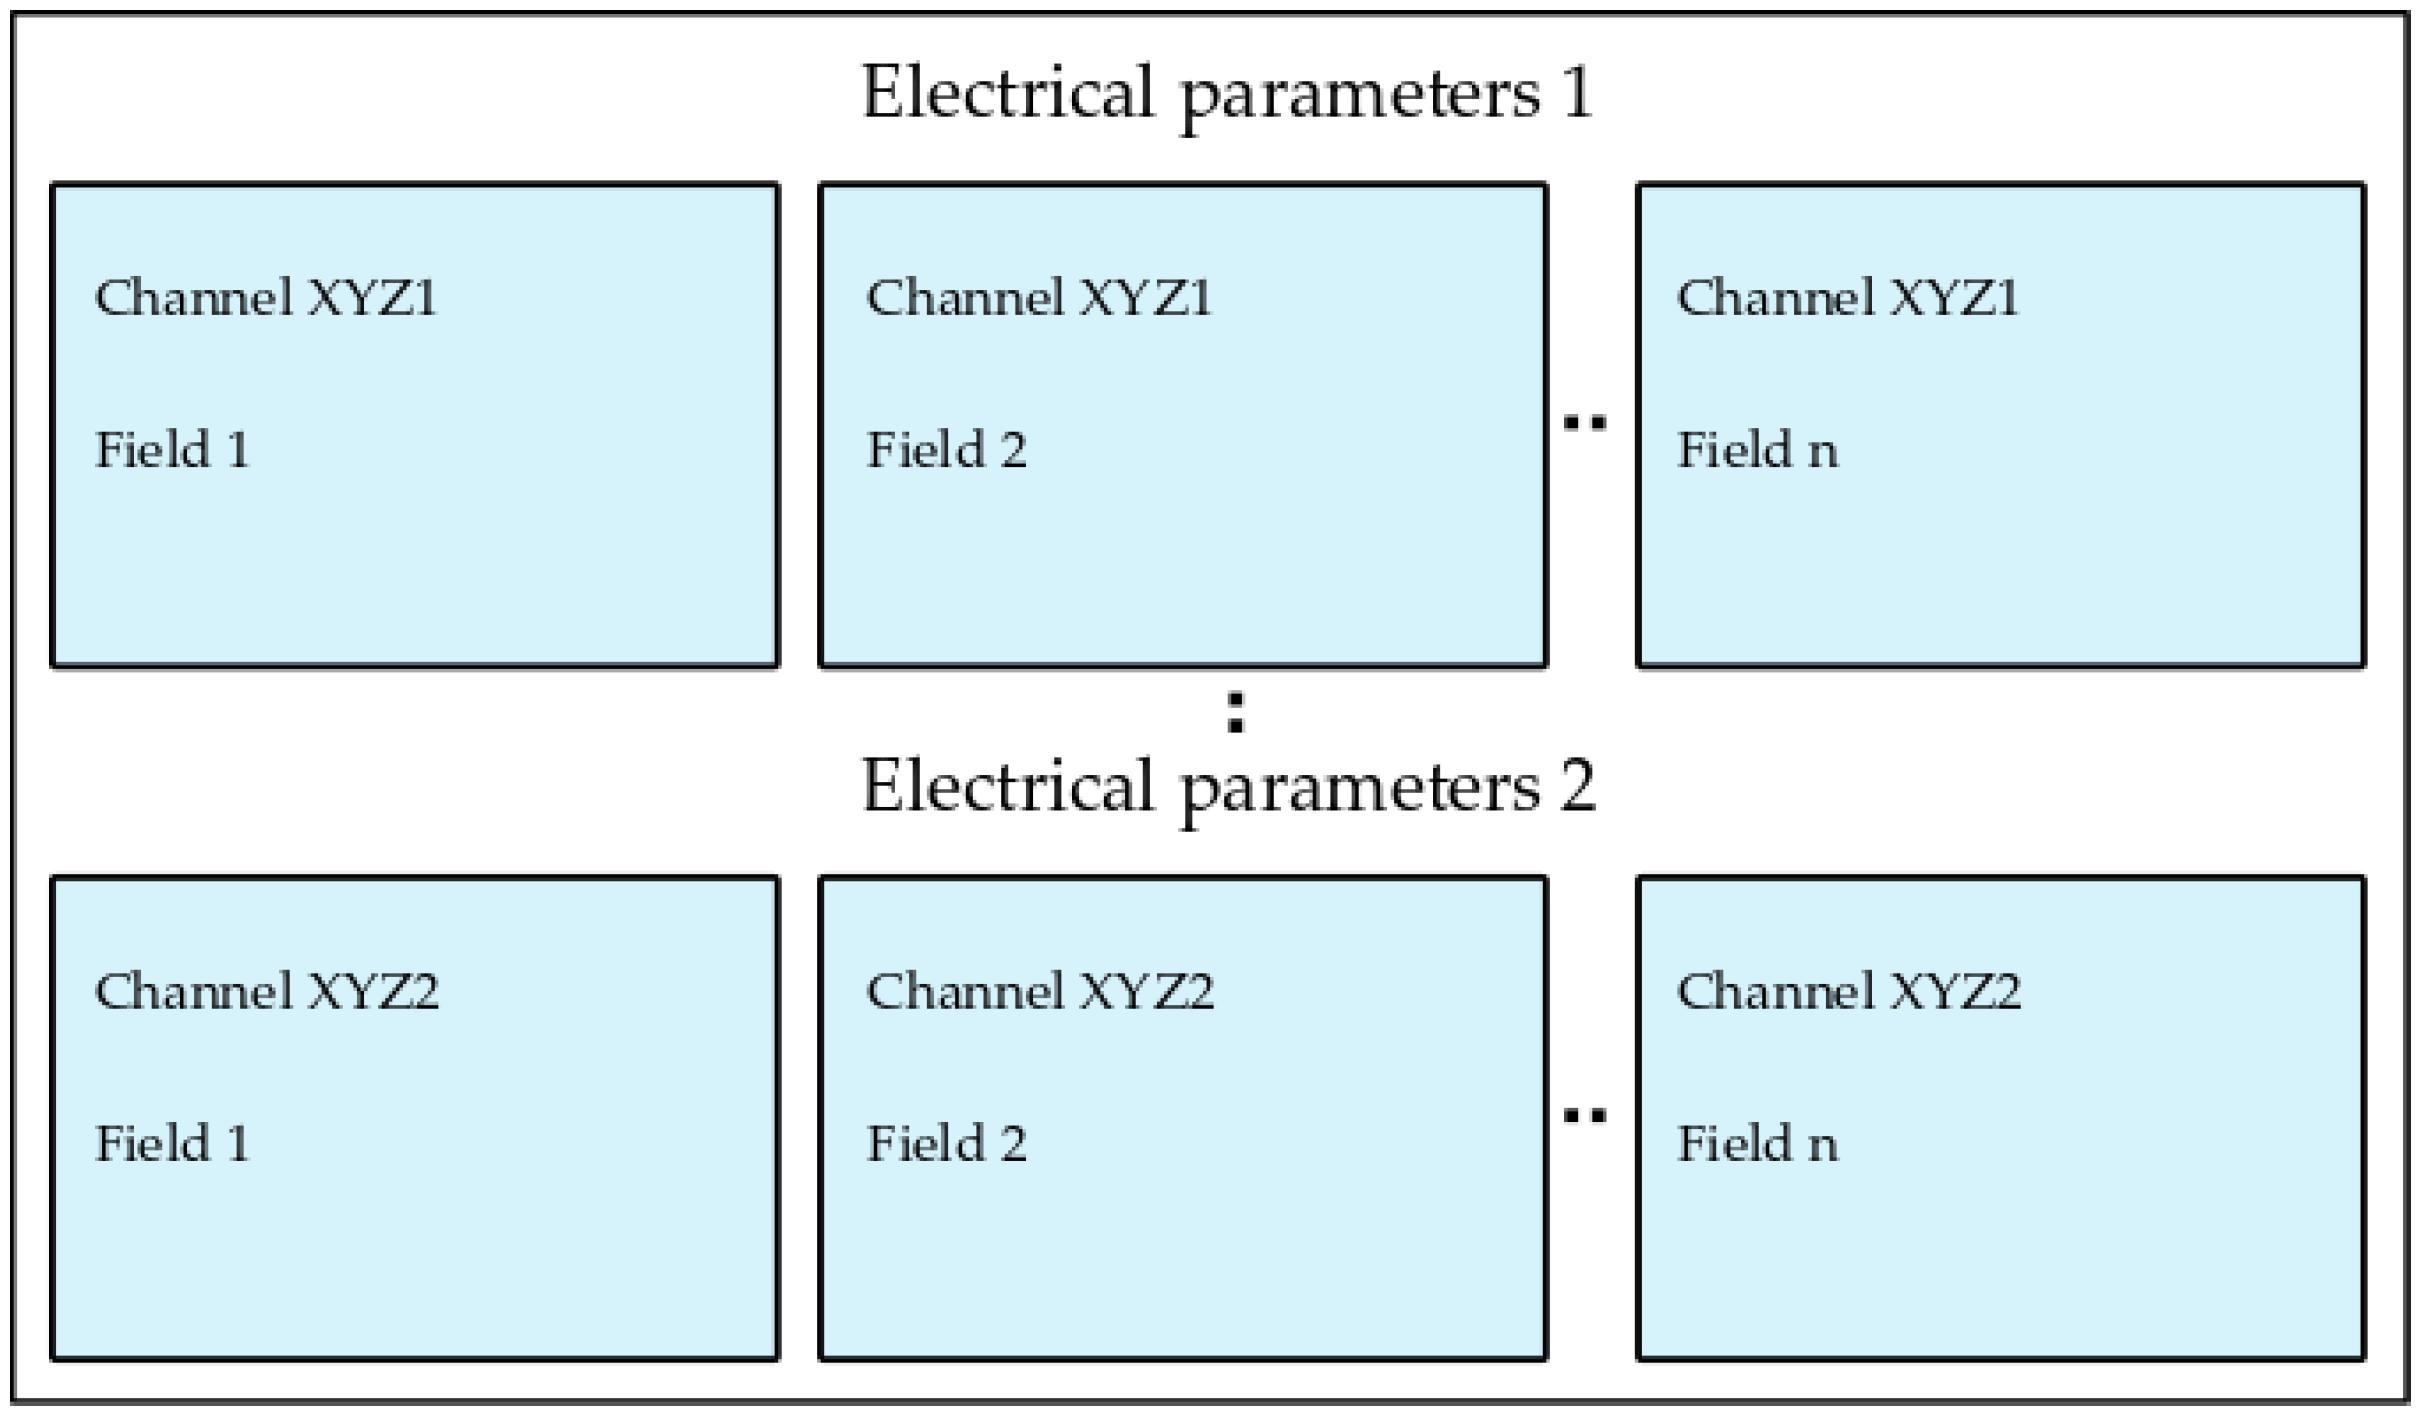
2.3.2. Web Application
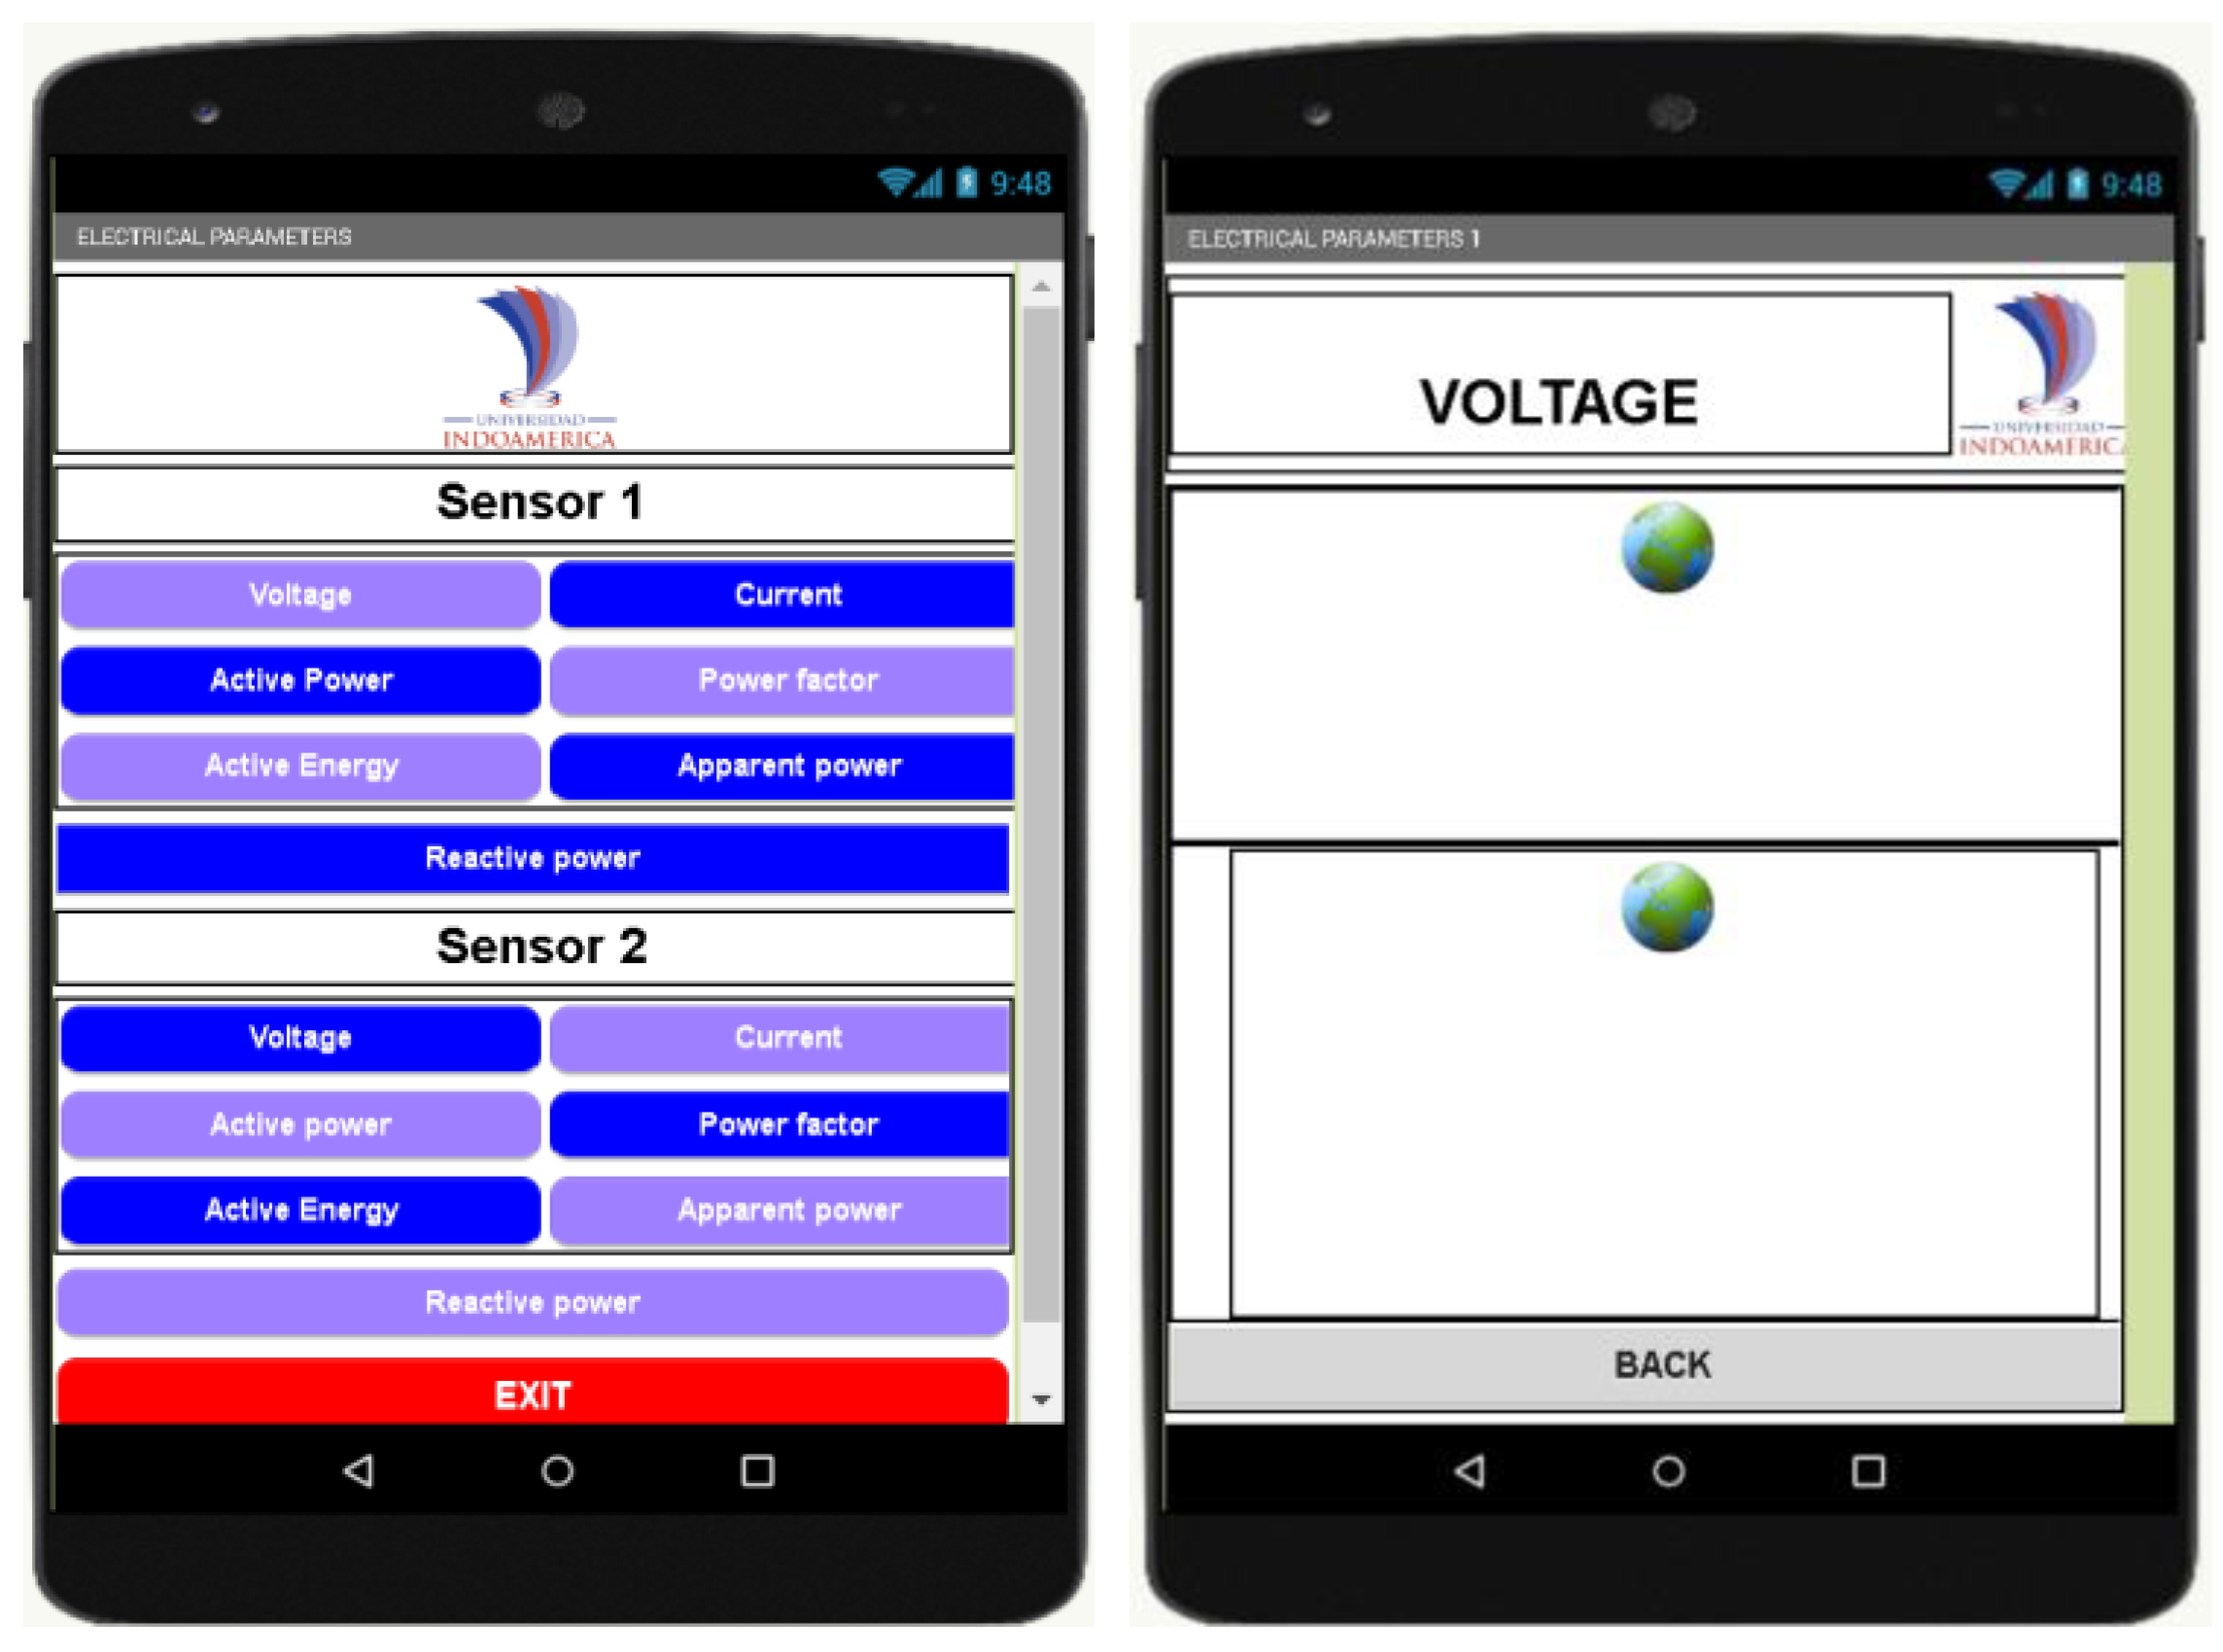
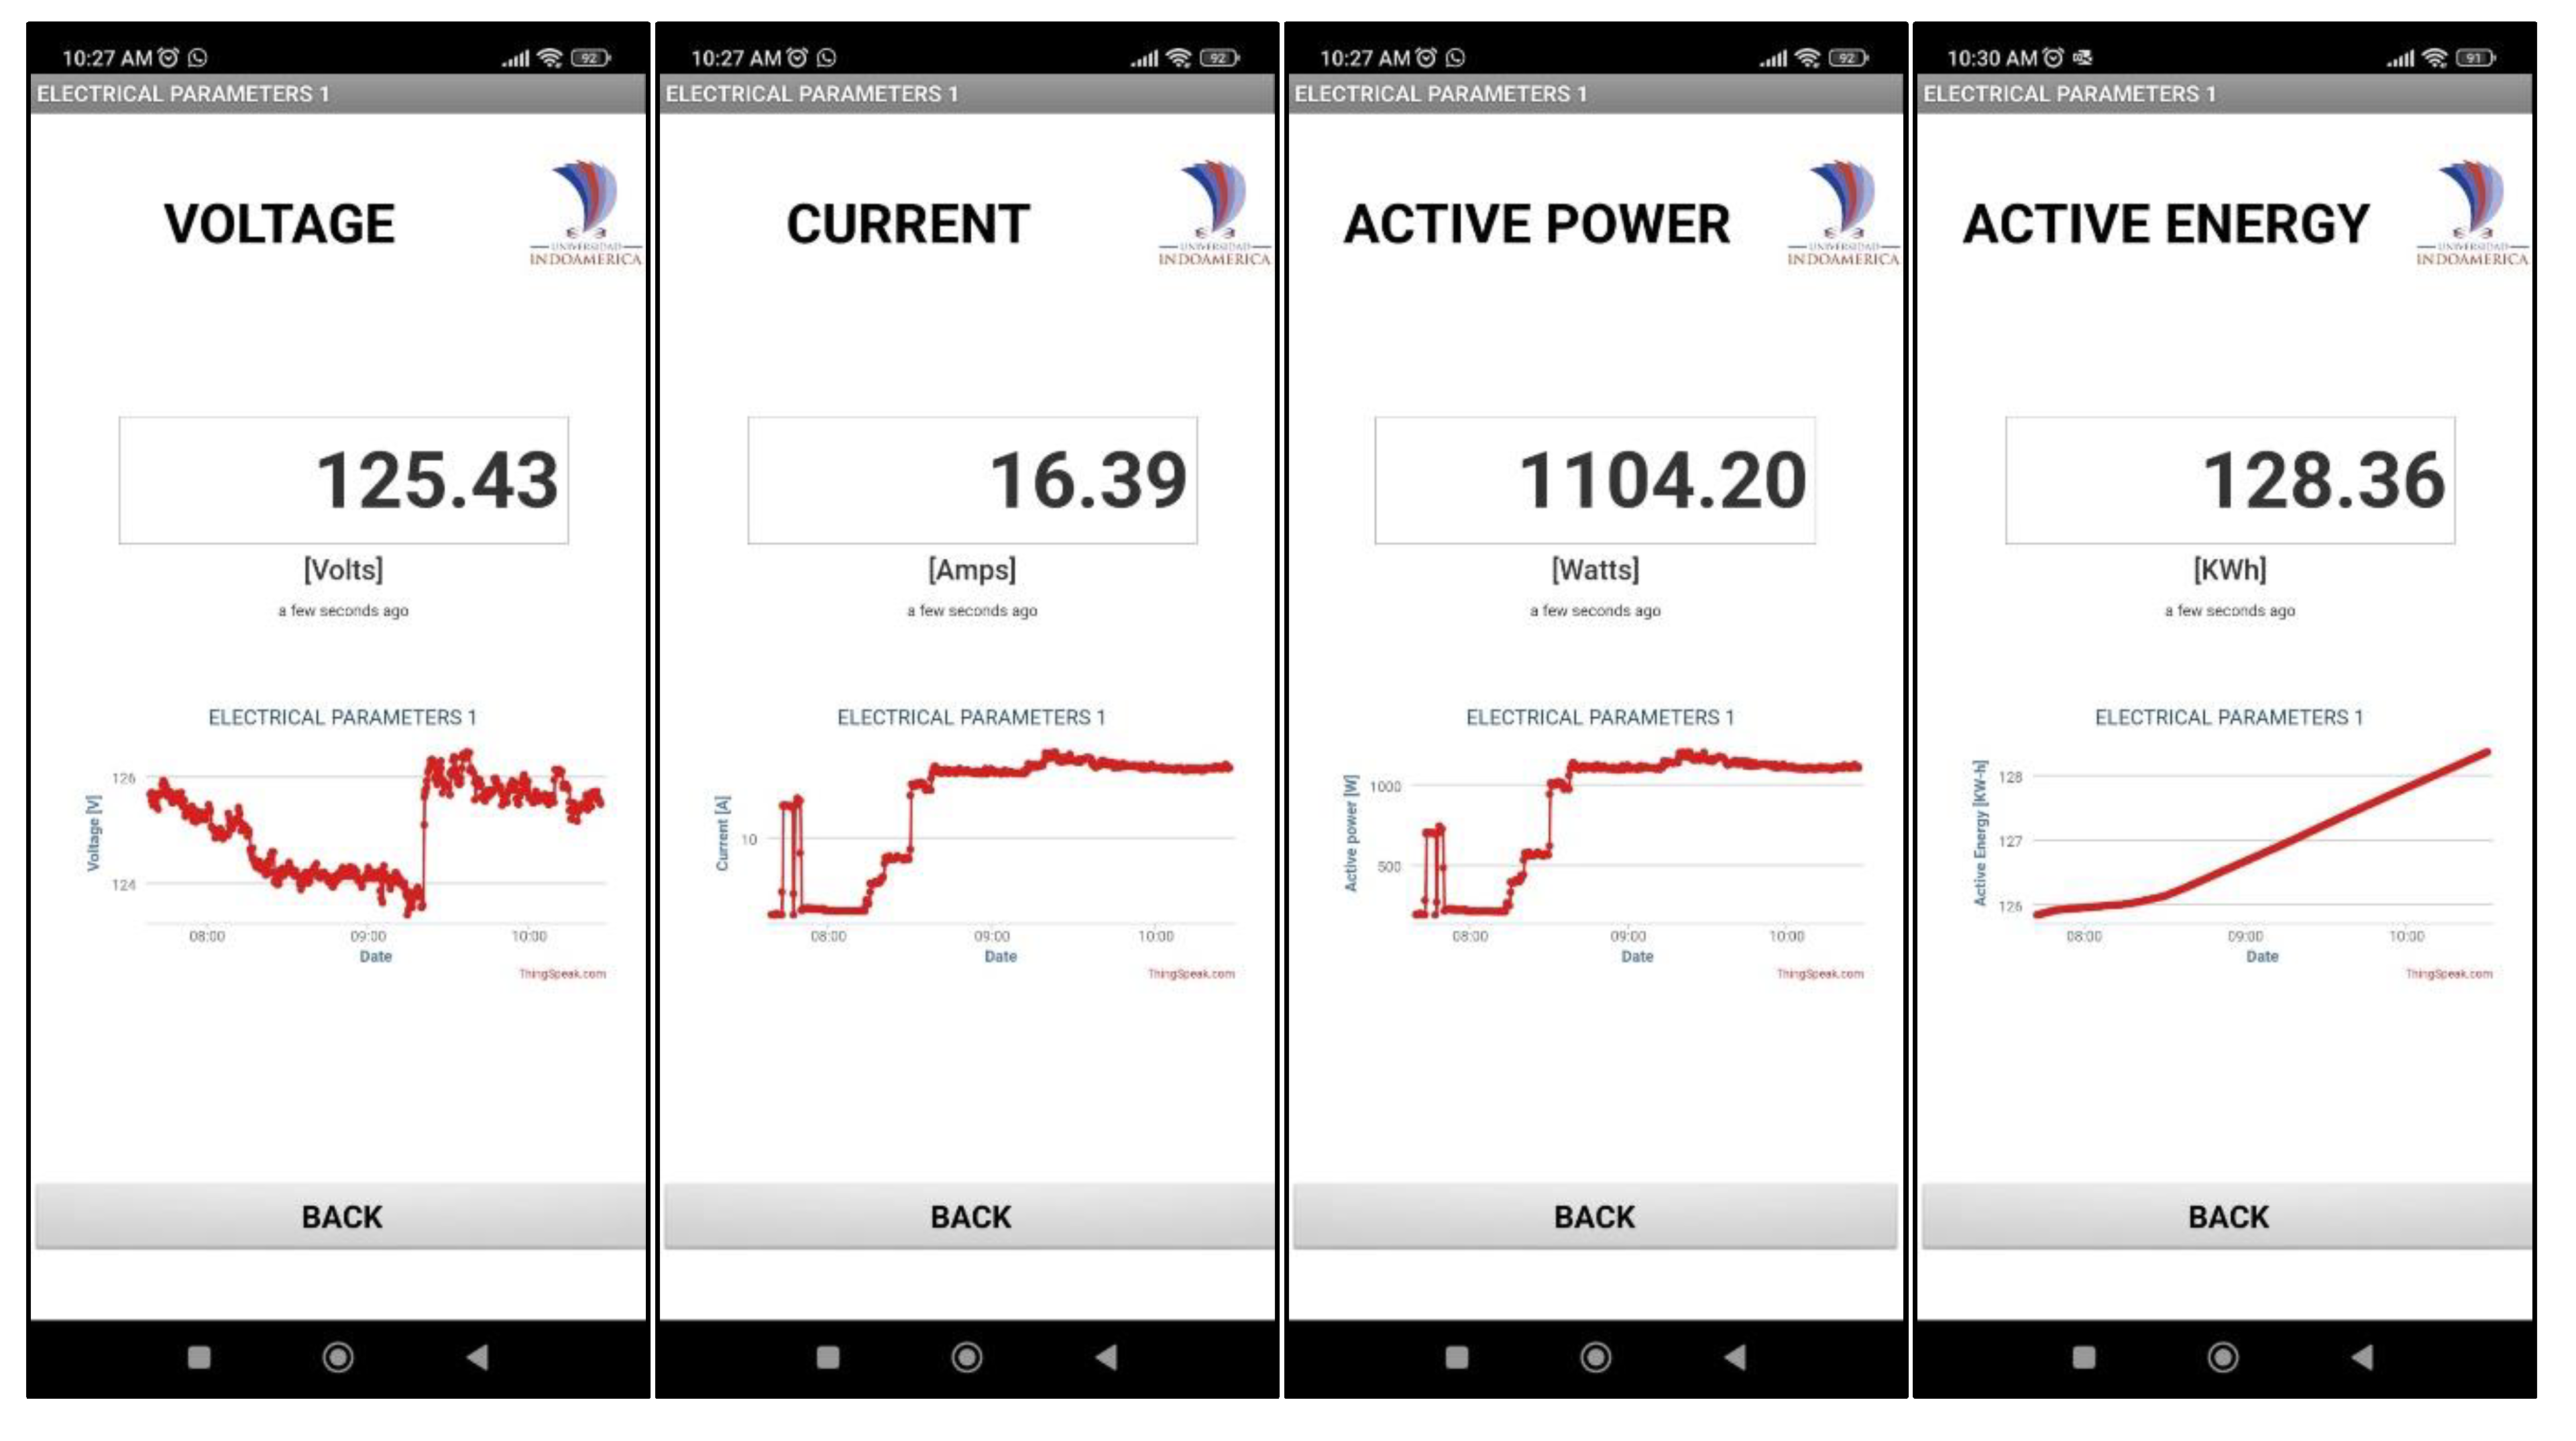
2.3.3. Mobile Application
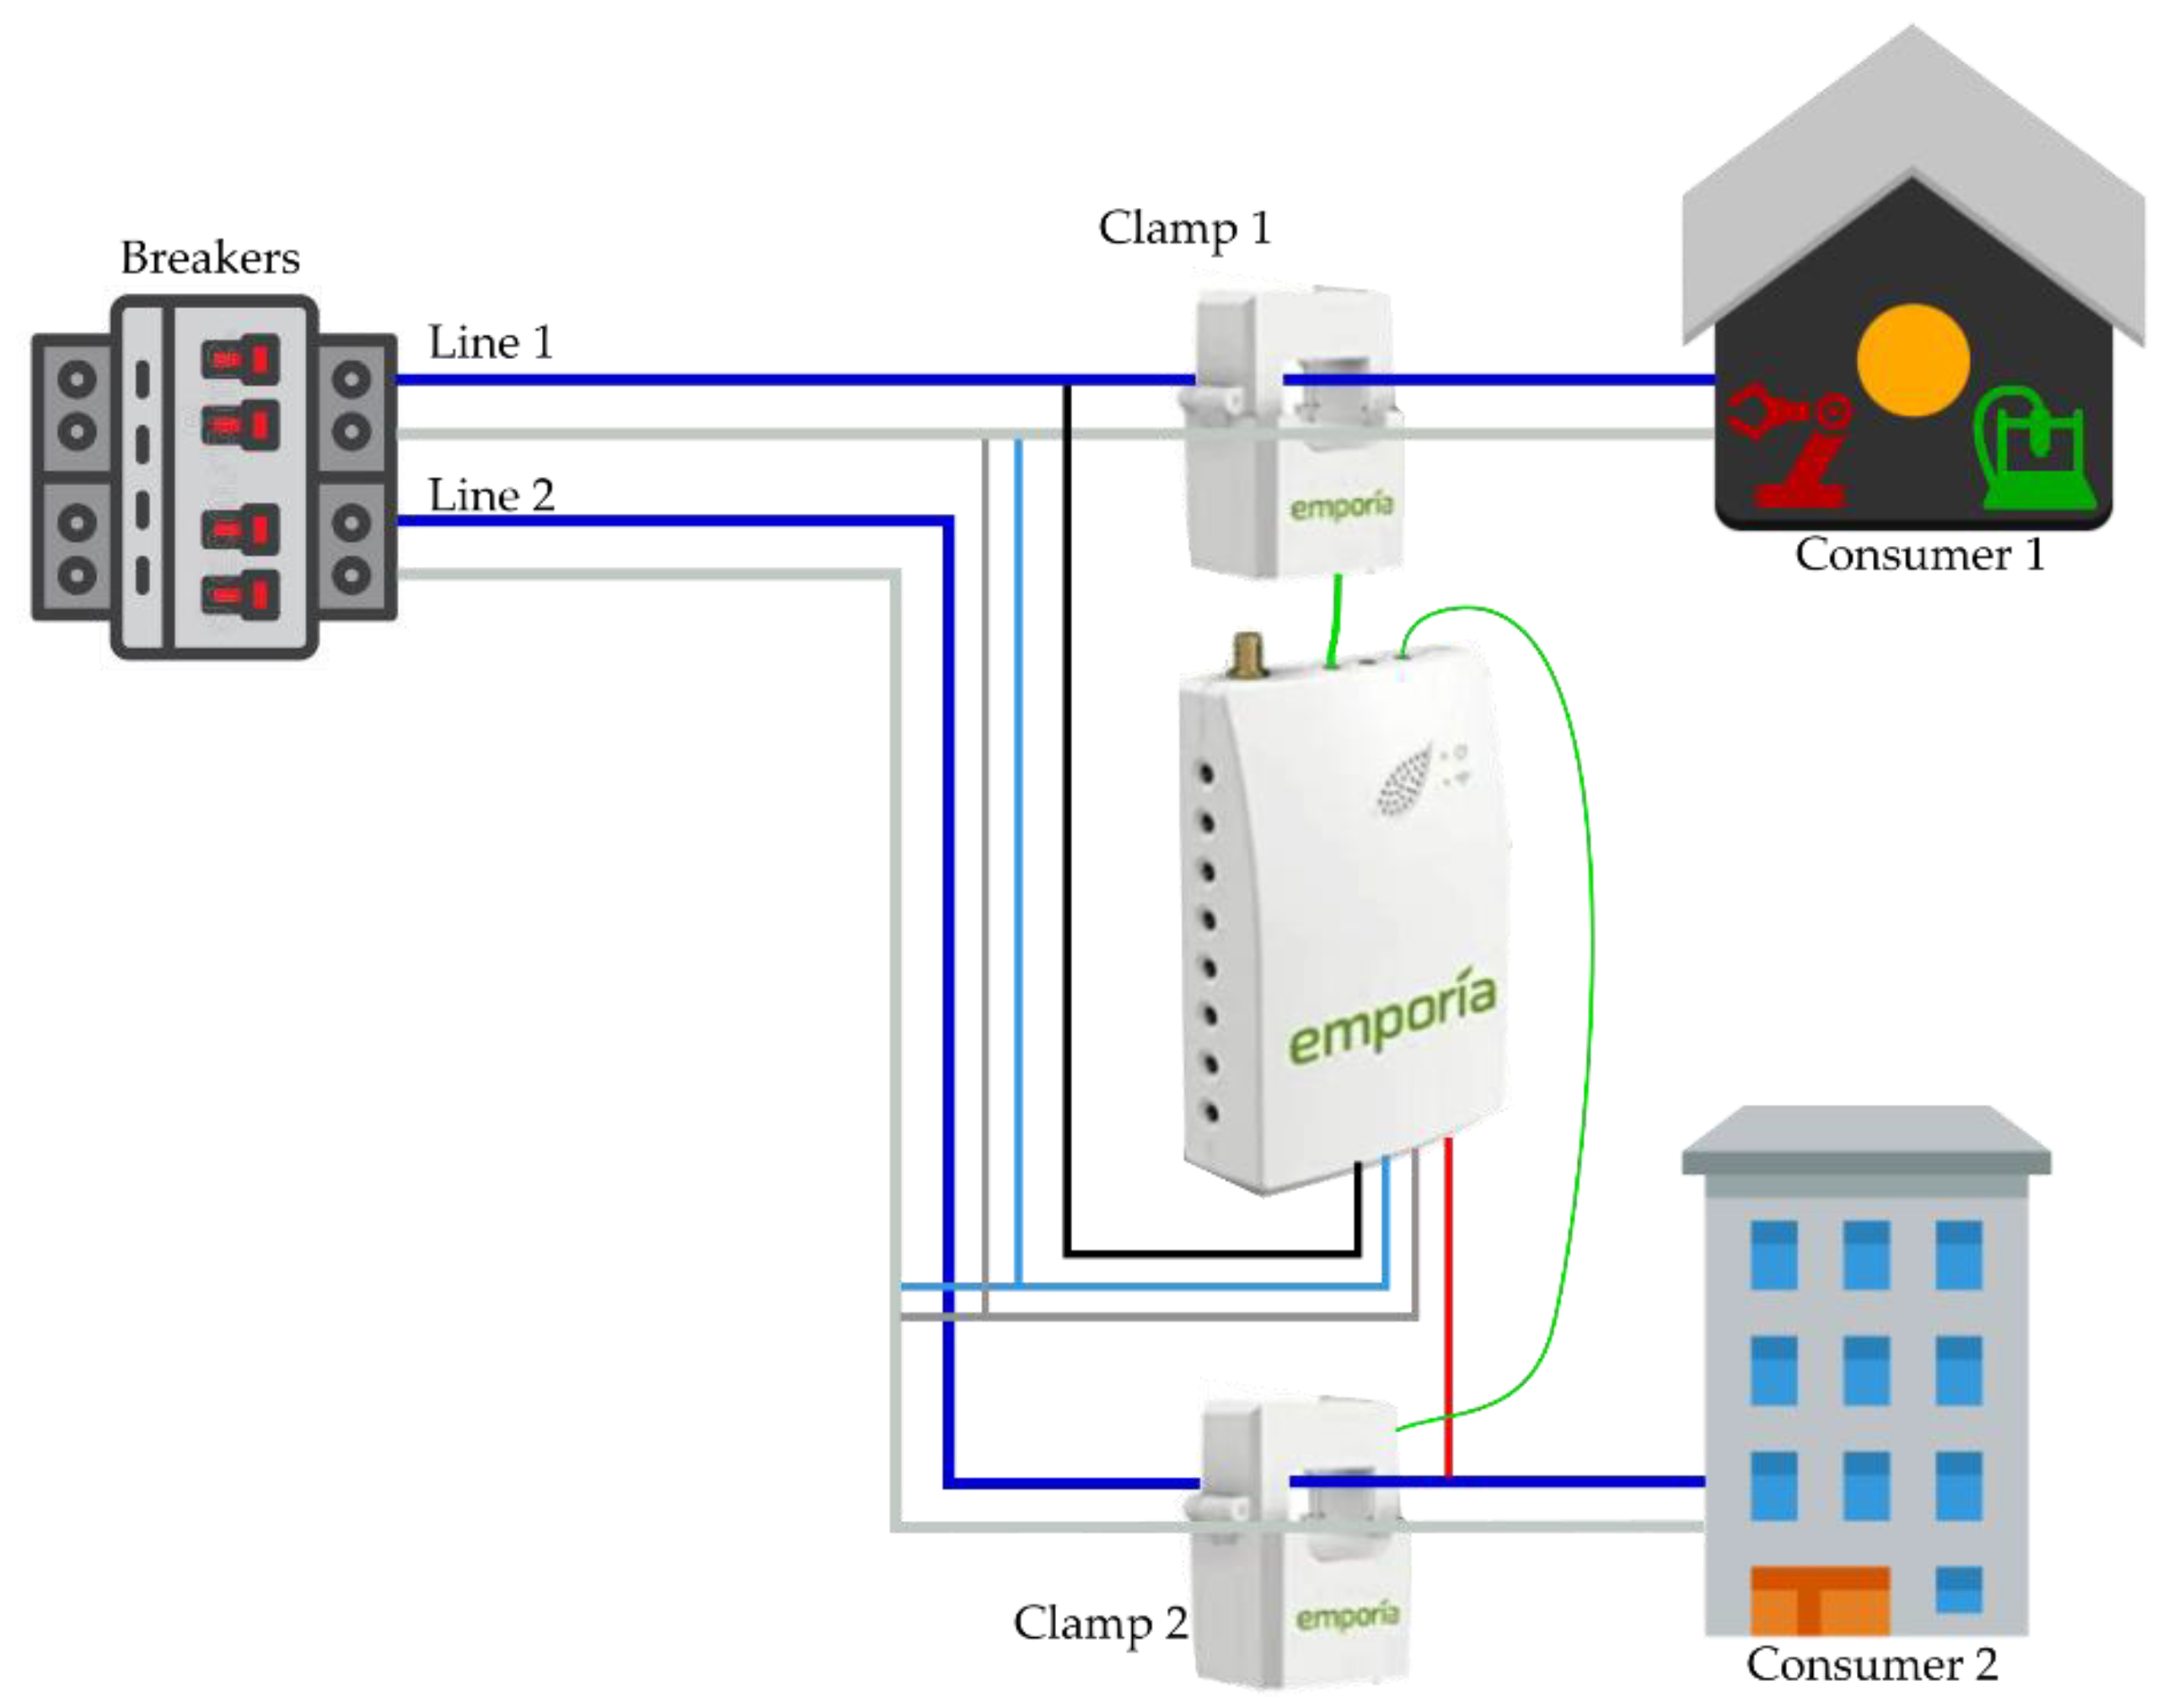
2.4. Validation Device
3. Results
3.1. Functionality Test
3.1.1. Local Readings
3.1.2. Remote Monitoring
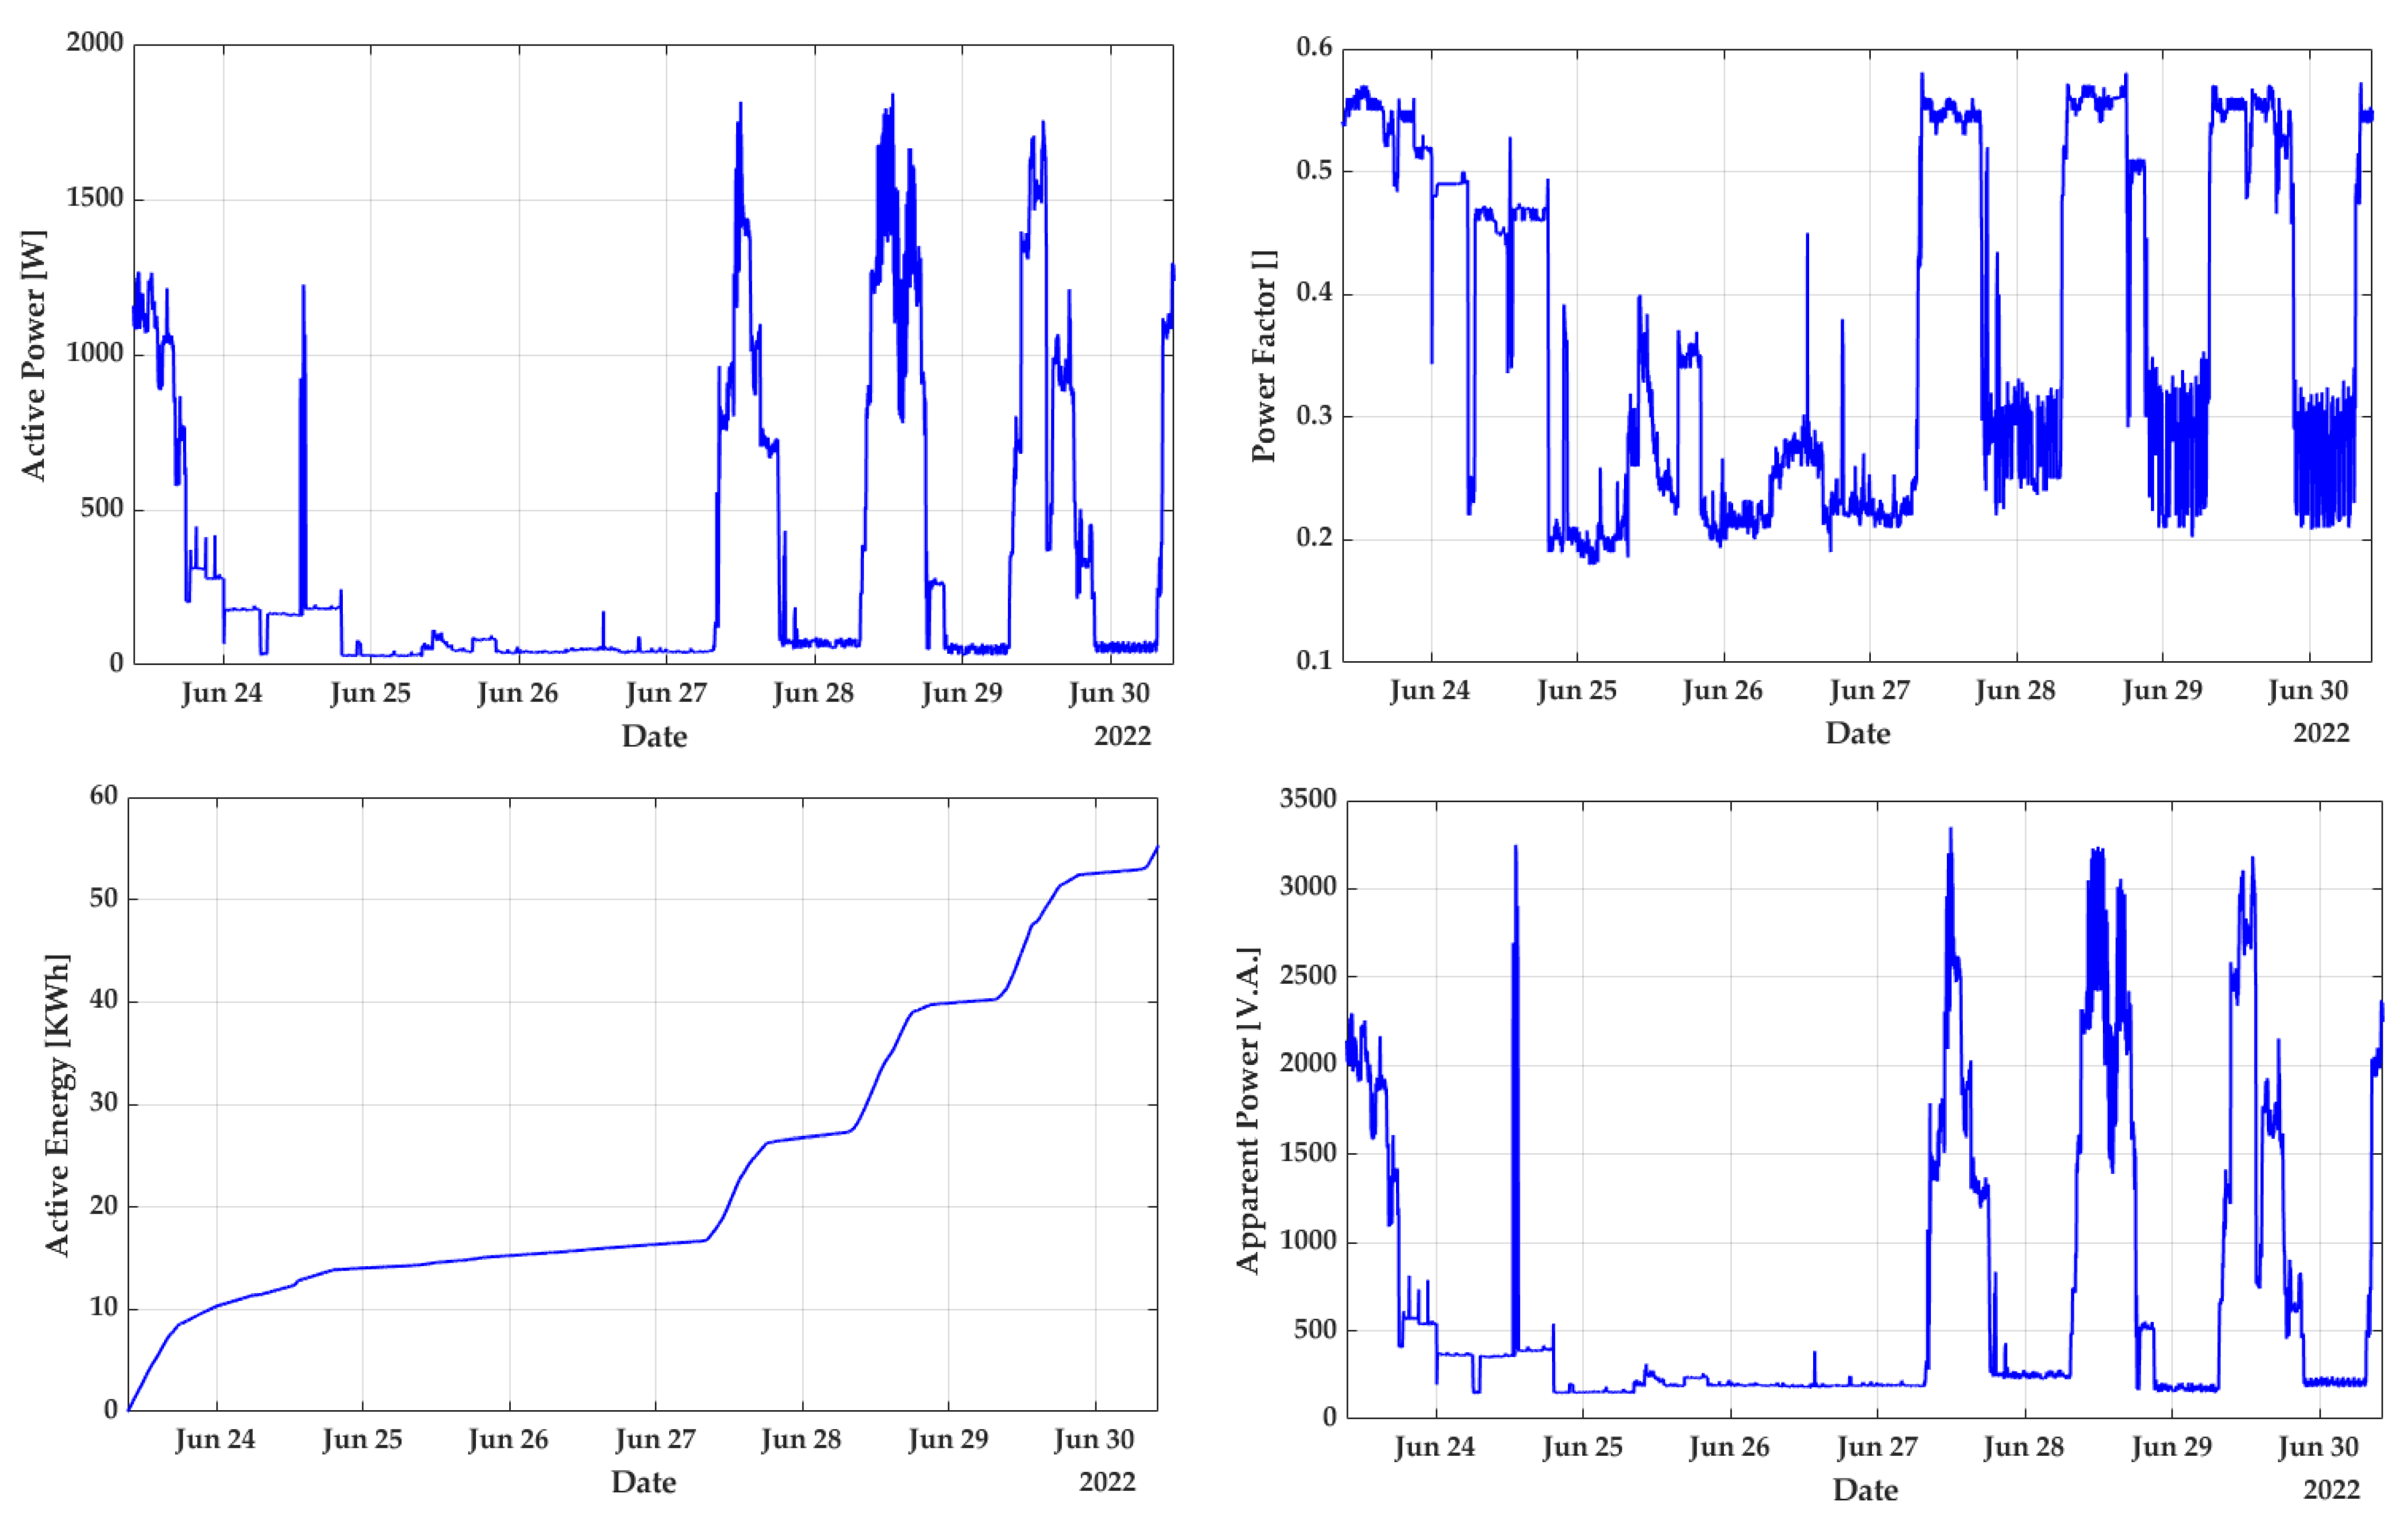
3.2. Measurement of Electrical Parameters
3.3. Validation
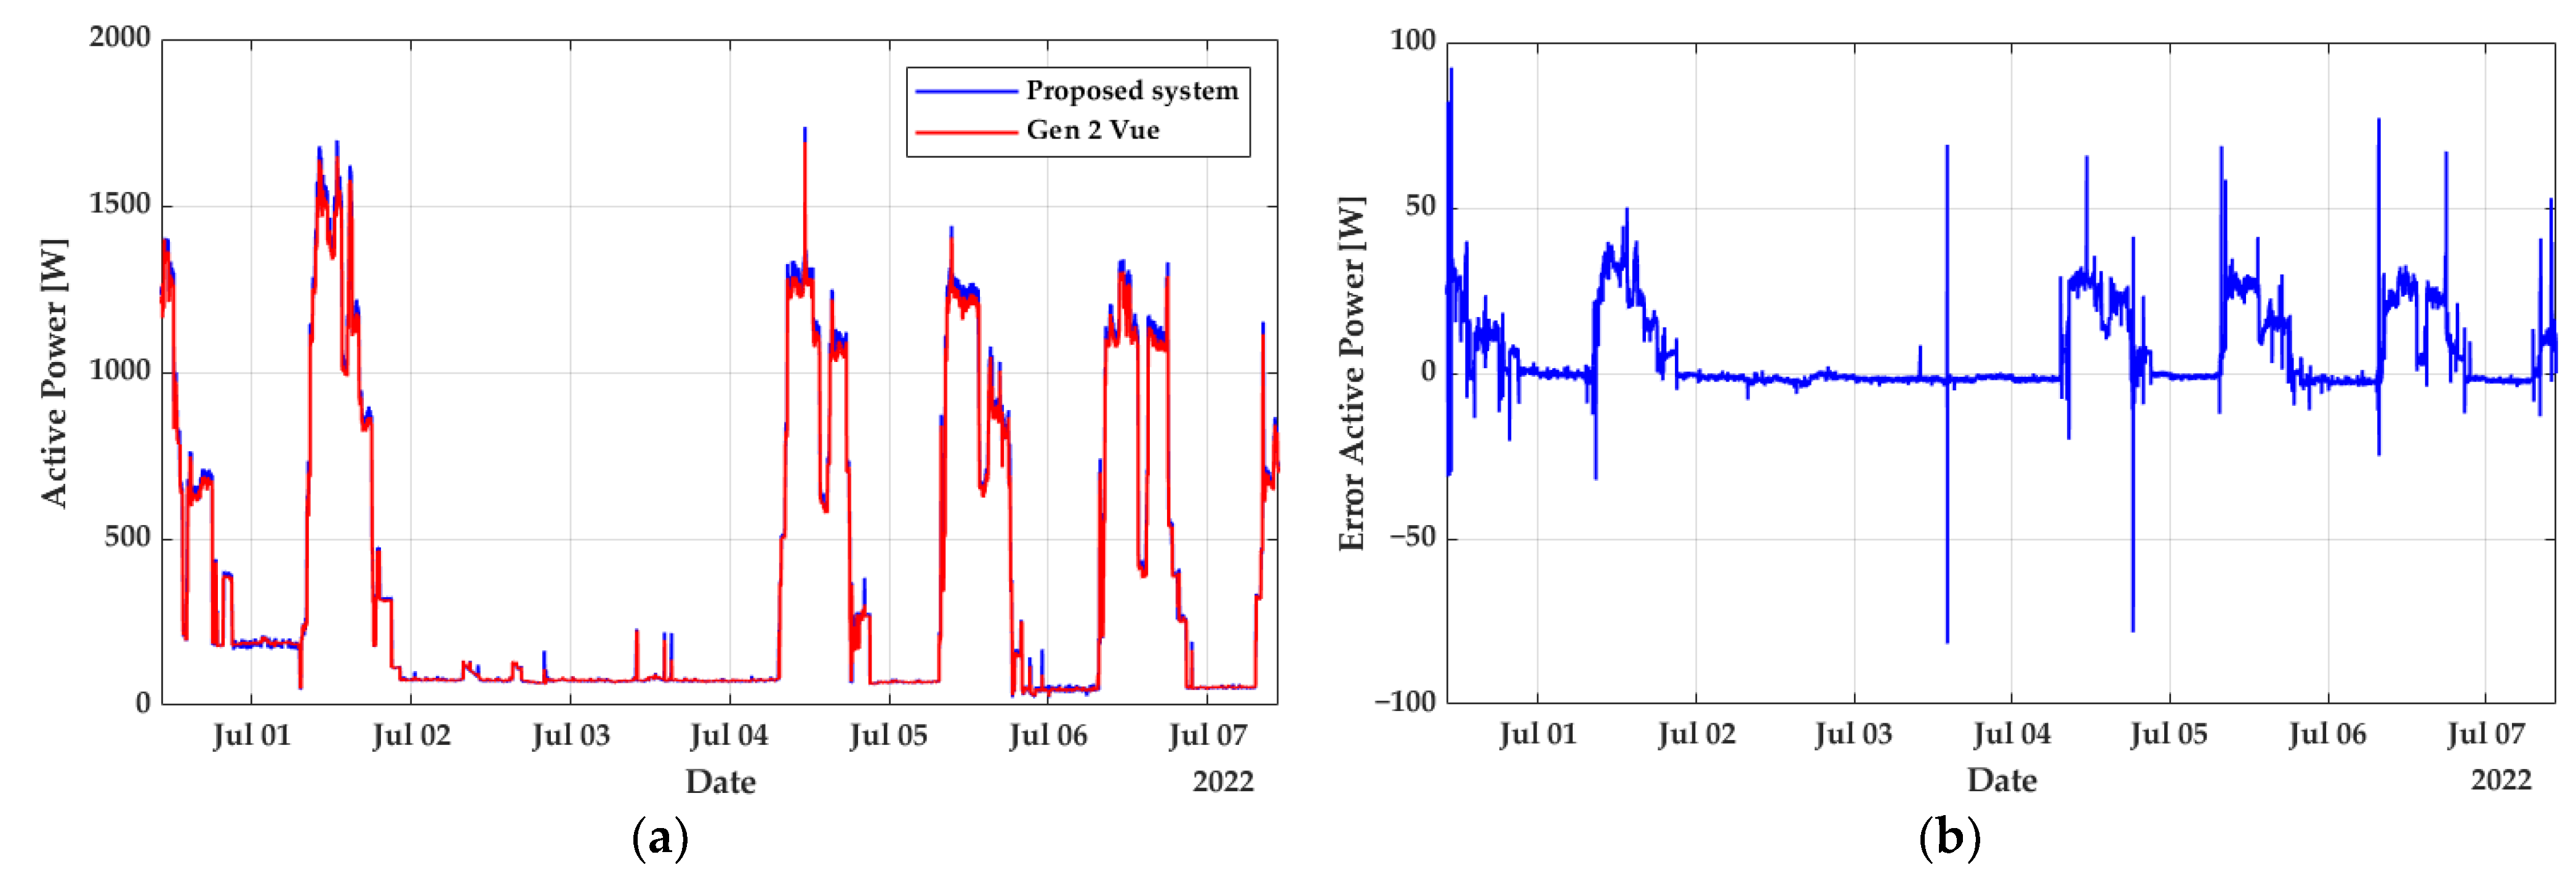
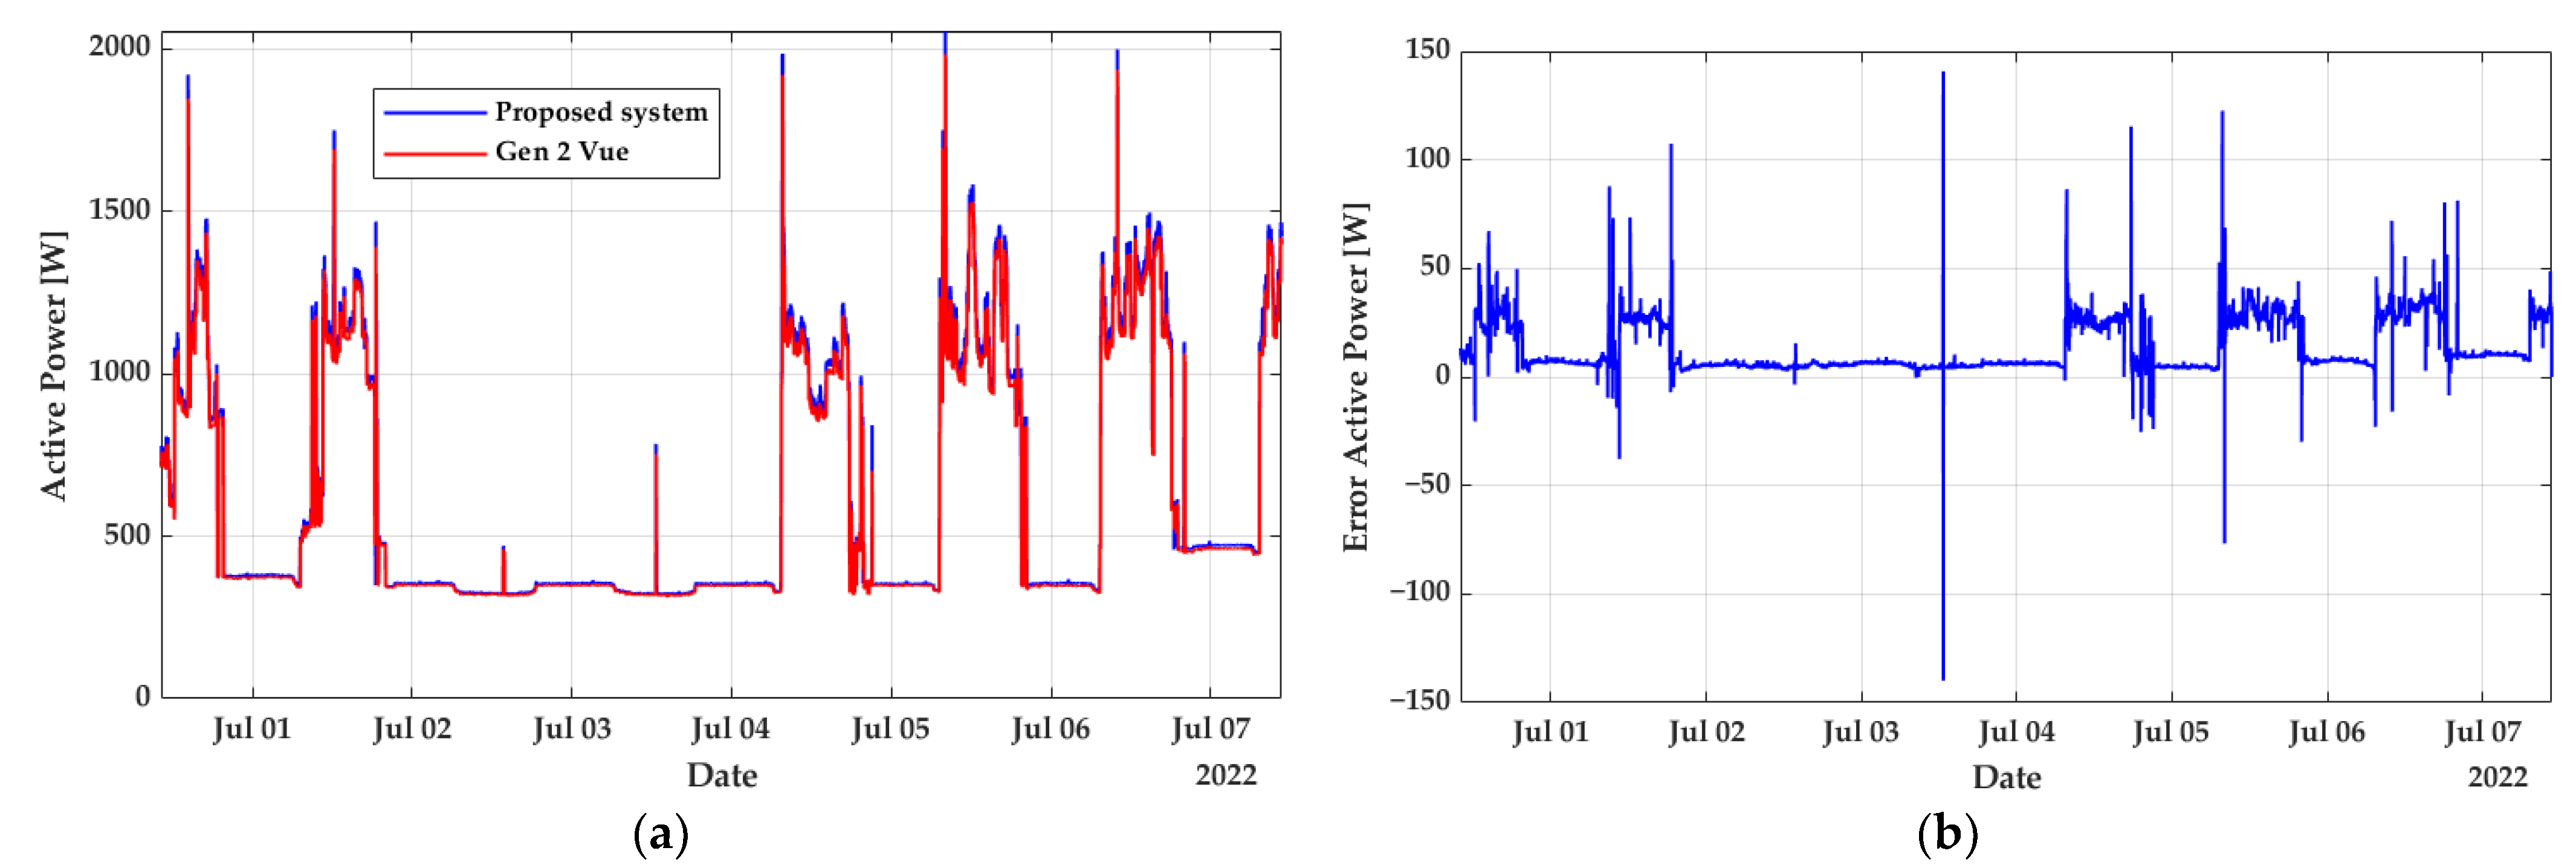
3.3.1. Active Power
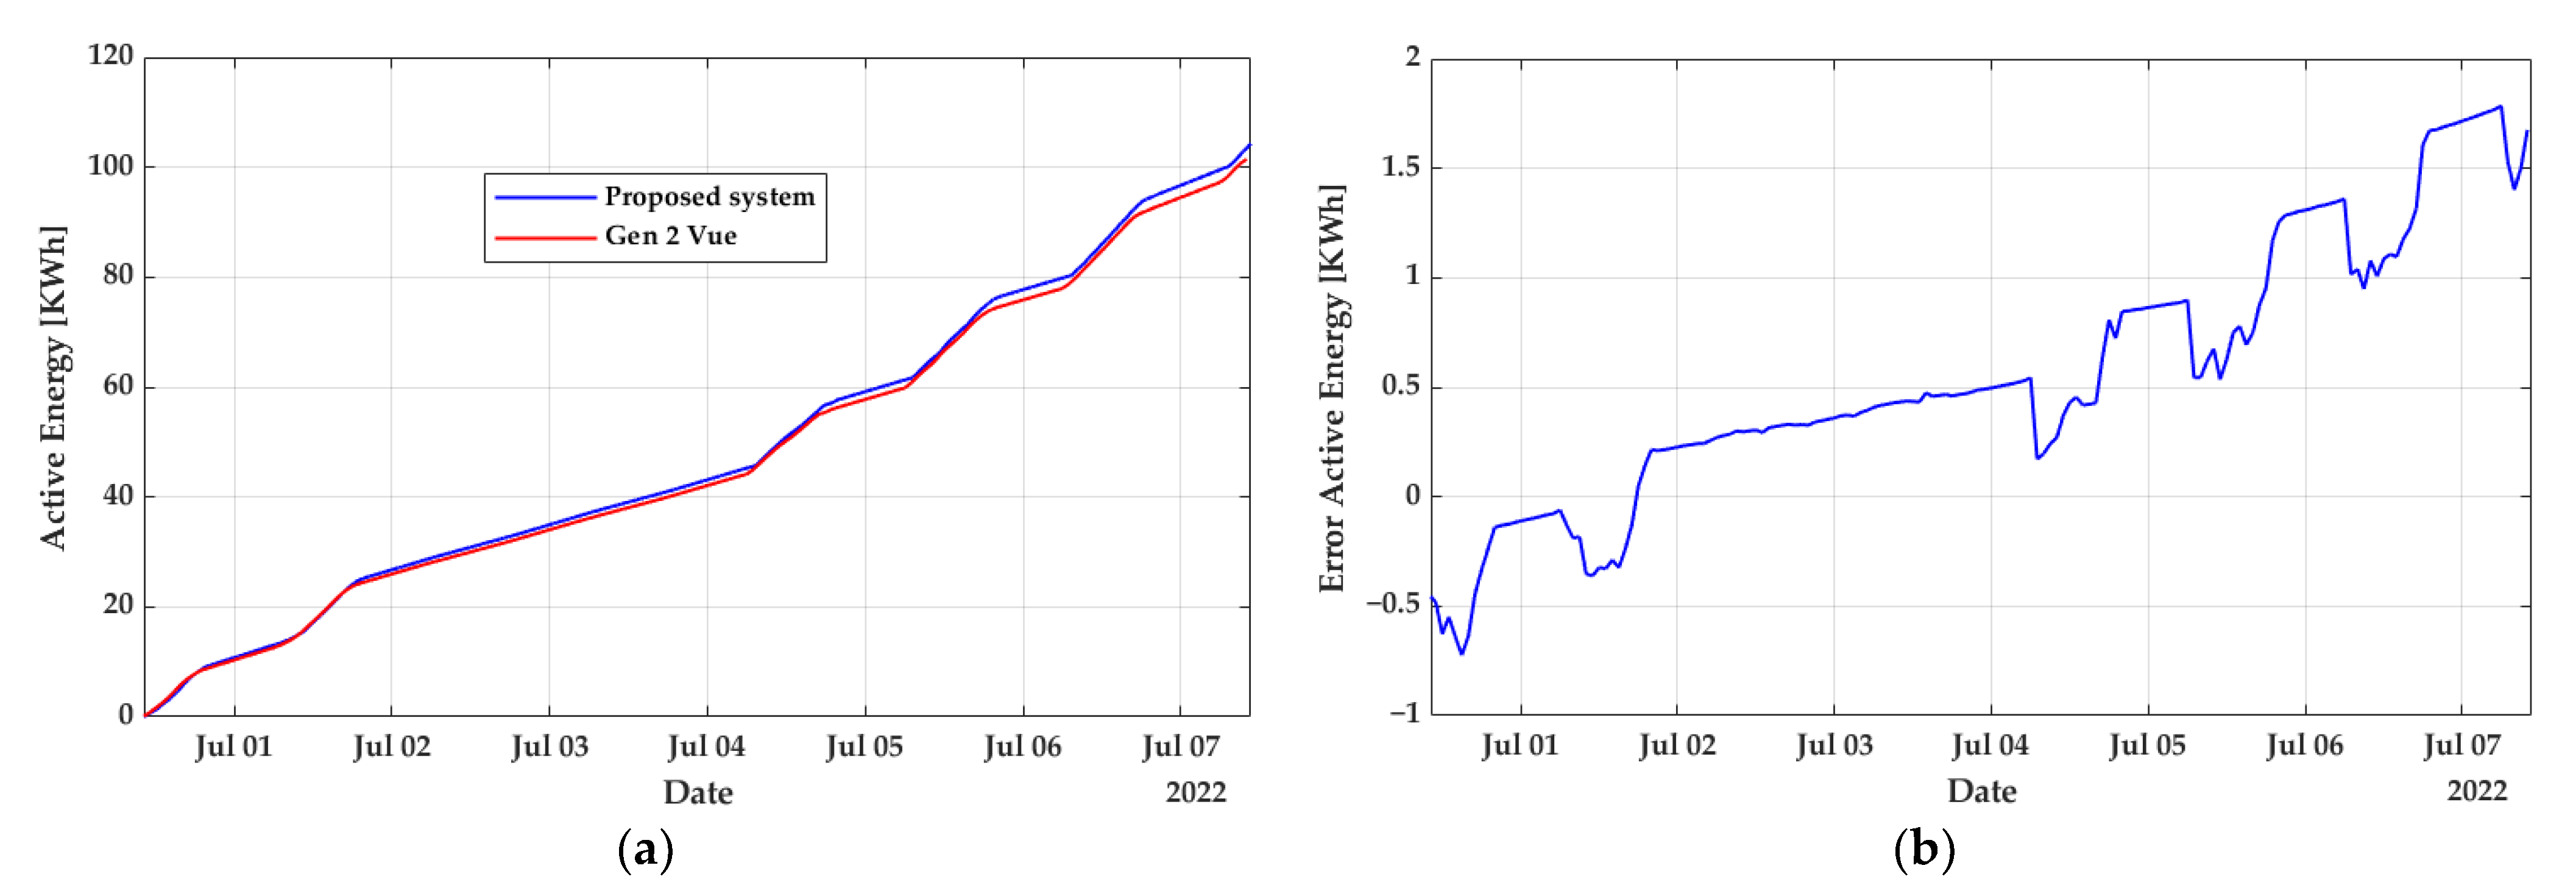
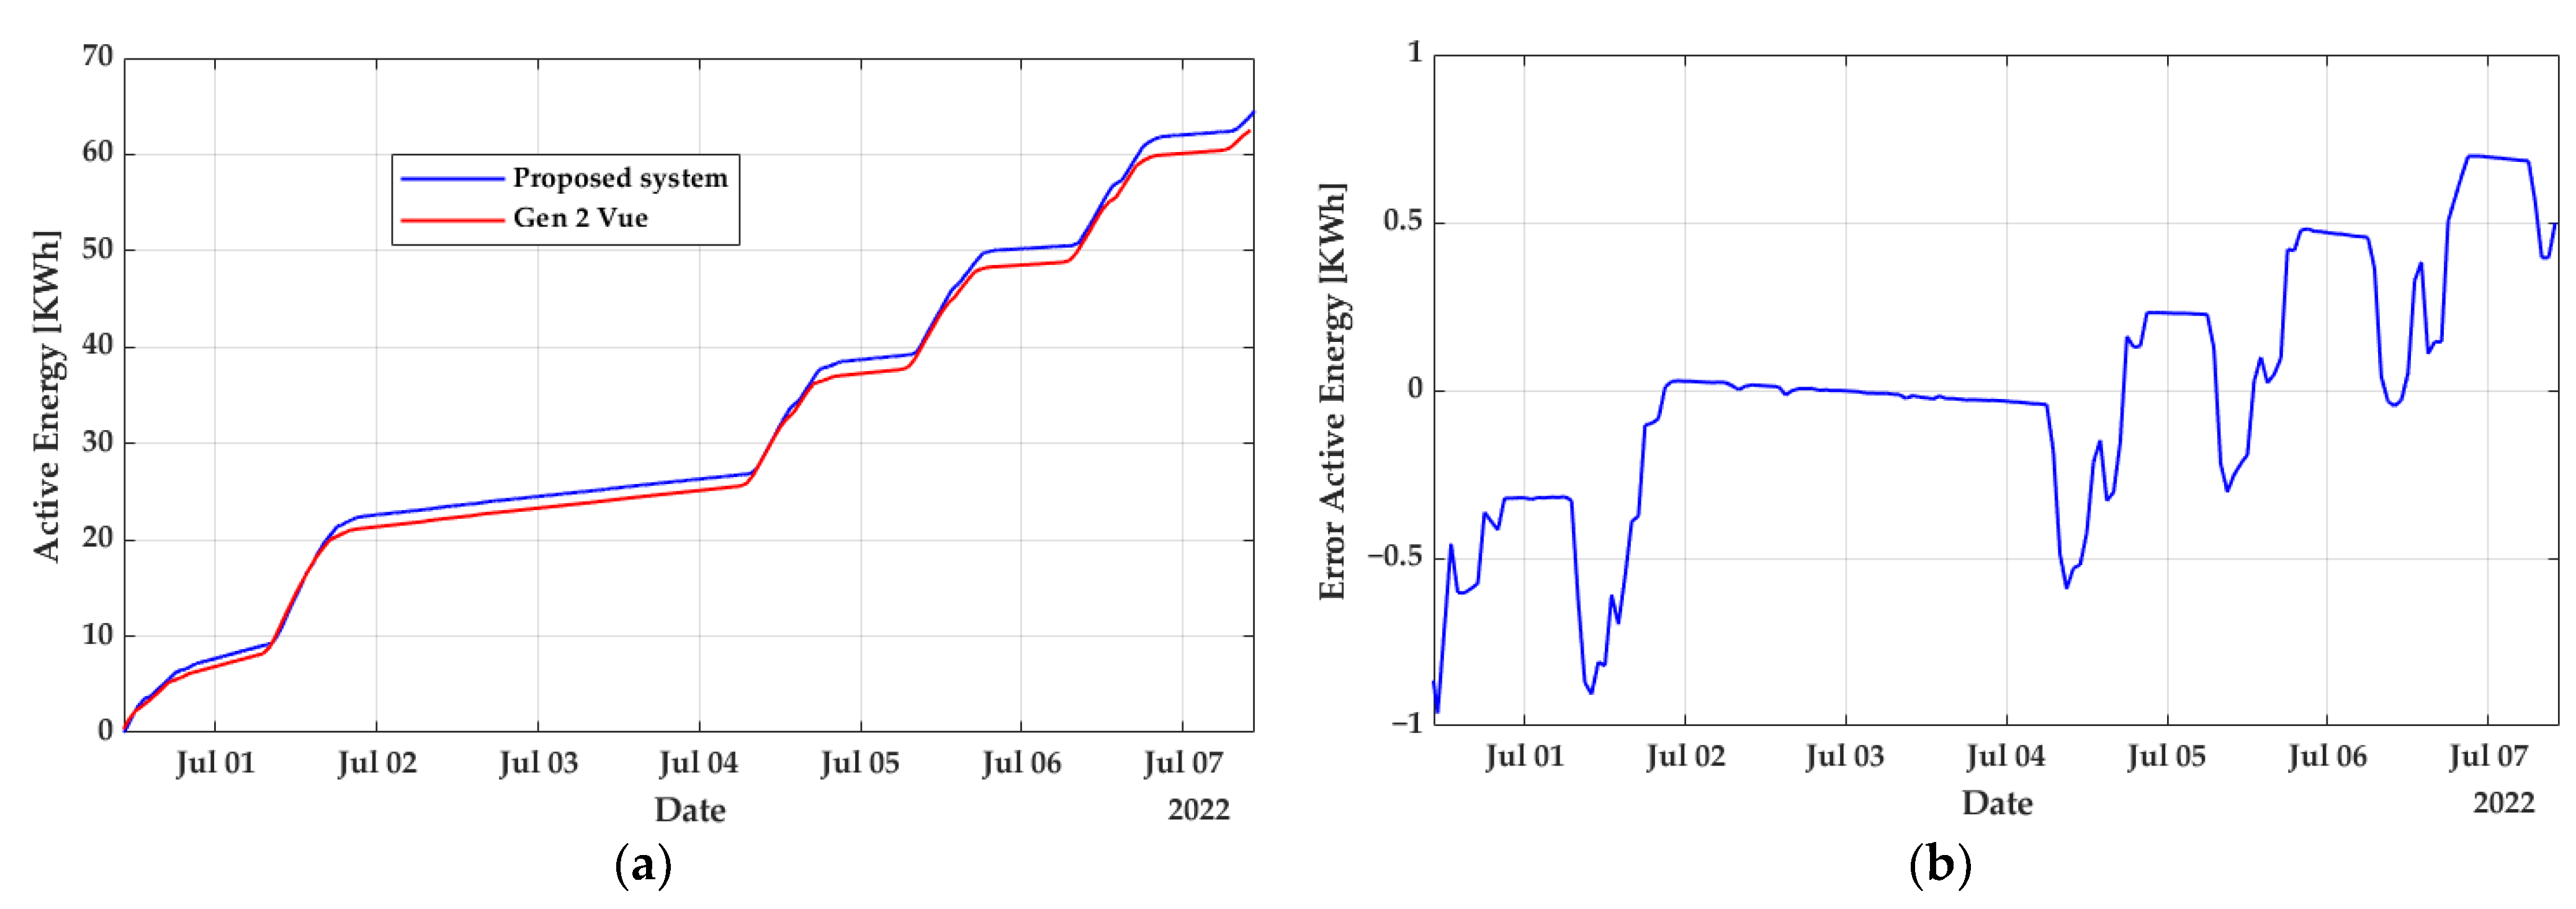
3.3.2. Active Energy
4. Discussion
5. Conclusions
Author Contributions
Funding
Institutional Review Board Statement
Informed Consent Statement
Data Availability Statement
Acknowledgments
Conflicts of Interest
References
- Hussain, H.; Javaid, N.; Iqbal, S.; Hasan, Q.; Aurangzeb, K.; Alhussein, M. An Efficient Demand Side Management System with a New Optimized Home Energy Management Controller in Smart Grid. Energies 2018, 11, 190. [Google Scholar] [CrossRef]
- Saleem, Y.; Crespi, N.; Rehmani, M.H.; Copeland, R. Internet of Things-Aided Smart Grid: Technologies, Architectures, Applications, Prototypes, and Future Research Directions. IEEE Access 2019, 7, 62962–63003. [Google Scholar] [CrossRef]
- Di Somma, M.; Graditi, G.; Heydarian-Forushani, E.; Shafie-khah, M.; Siano, P. Stochastic Optimal Scheduling of Distributed Energy Resources with Renewables Considering Economic and Environmental Aspects. Renew. Energy 2018, 116, 272–287. [Google Scholar] [CrossRef]
- Yellampalli, S. Wireless Sensor Networks: Design, Deployment and Applications; IntechOpen: London, UK, 2021; ISBN 978-1-83880-910-9. [Google Scholar]
- Kanoun, O.; Bradai, S.; Khriji, S.; Bouattour, G.; El Houssaini, D.; Ben Ammar, M.; Naifar, S.; Bouhamed, A.; Derbel, F.; Viehweger, C. Energy-Aware System Design for Autonomous Wireless Sensor Nodes: A Comprehensive Review. Sensors 2021, 21, 548. [Google Scholar] [CrossRef]
- Duobiene, S.; Ratautas, K.; Trusovas, R.; Ragulis, P.; Šlekas, G.; Simniškis, R.; Račiukaitis, G. Development of Wireless Sensor Network for Environment Monitoring and Its Implementation Using SSAIL Technology. Sensors 2022, 22, 5343. [Google Scholar] [CrossRef]
- Jabbar, W.A.; Kian, T.K.; Ramli, R.M.; Zubir, S.N.; Zamrizaman, N.S.M.; Balfaqih, M.; Shepelev, V.; Alharbi, S. Design and Fabrication of Smart Home with Internet of Things Enabled Automation System. IEEE Access 2019, 7, 144059–144074. [Google Scholar] [CrossRef]
- Soberon, J.C.; Gamboa, G.; Castillo, F.; Palacios-Navarro, G.; Varela-Aldás, J. Development of a Scale Prototype of Smart Bed Controlled Using a Mobile Application. In Proceedings of the International Conference on Human-Computer Interaction, Virtual, 26 June–1 July 2022; pp. 368–374. [Google Scholar]
- Kwiatkowski, A.; Drozdowska, K.; Smulko, J. Embedded Gas Sensing Setup for Air Samples Analysis. Rev. Sci. Instrum. 2021, 92, 074102. [Google Scholar] [CrossRef]
- Lee, U.; Islam, M.P.; Kochi, N.; Tokuda, K.; Nakano, Y.; Naito, H.; Kawasaki, Y.; Ota, T.; Sugiyama, T.; Ahn, D.-H. An Automated, Clip-Type, Small Internet of Things Camera-Based Tomato Flower and Fruit Monitoring and Harvest Prediction System. Sensors 2022, 22, 2456. [Google Scholar] [CrossRef]
- Muliadi Areni, I.S.; Palantei, E.; Achmad, A.; Hadis, M.S. An IOT based power consumption and losses monitoring technique for a mini scale electrical network. ICIC Express Lett. 2022, 16, 897–904. [Google Scholar] [CrossRef]
- Saputro, A.K.; Purnamasari, D.N.; Haryanto Ulum, M.; Alfita, R.; Ibrahim, M. Electrical Parameter Analysis on DLP 3D Printers Using IoT (Internet of Things). In Proceedings of the 2021 IEEE 7th Information Technology International Seminar (ITIS), Surabaya, Indonesia, 6–8 October 2021; IEEE: Piscataway, NJ, USA, 2021; pp. 1–5. [Google Scholar]
- Rabie, A.H.; Saleh, A.I.; Ali, H.A. Smart Electrical Grids Based on Cloud, IoT, and Big Data Technologies: State of the Art. J. Ambient Intell. Humaniz. Comput. 2021, 12, 9449–9480. [Google Scholar] [CrossRef]
- Raju, M.P.; Laxmi, A.J. IOT Based Online Load Forecasting Using Machine Learning Algorithms. Procedia Comput. Sci. 2020, 171, 551–560. [Google Scholar] [CrossRef]
- Ahmed, Z.E.; Hasan, M.K.; Saeed, R.A.; Hassan, R.; Islam, S.; Mokhtar, R.A.; Khan, S.; Akhtaruzzaman, M. Optimizing Energy Consumption for Cloud Internet of Things. Front. Phys. 2020, 8, 358. [Google Scholar] [CrossRef]
- Pawar, P.; TarunKumar, M.; Vittal, K.P. An IoT Based Intelligent Smart Energy Management System with Accurate Forecasting and Load Strategy for Renewable Generation. Measurement 2020, 152, 107187. [Google Scholar] [CrossRef]
- Bagdadee, A.H.; Zhang, L.; Saddam Hossain Remus, M. A brief review of the IoT-based energy management system in the smart industry. In Artificial Intelligence and Evolutionary Computations in Engineering Systems; Springer: Berlin, Germany, 2020; pp. 443–459. [Google Scholar]
- Buele, J.; Morales-Sánchez, J.C.; Varela-Aldás, J.; Palacios-Navarro, G.; Ayala-Chauvin, M. Electric monitoring system for residential customers using wireless technology. In International Conference on Computational Science and Its Applications; Springer: Berlin, Germany, 2022; pp. 560–575. [Google Scholar]
- Jabbarar, W.A.; Annathurai, S.; Rahim, T.A.; Fauzi, M.F. Smart Energy Meter Based on a Long-Range Wide-Area Network for a Stand-Alone Photovoltaic System. Expert Syst. Appl. 2022, 197, 116703. [Google Scholar] [CrossRef]
- Qays, M.O.; Ahmed, M.M.; Mahmud, M.A.P.; Abu-Siada, A.; Muyeen, S.M.; Hossain, M.L.; Yasmin, F.; Rahman, M.M. Monitoring of Renewable Energy Systems by IoT-Aided SCADA System. Energy Sci. Eng. 2022, 10, 1874–1885. [Google Scholar] [CrossRef]
- Gomes de Melo, G.C.; Torres, I.C.; Queiroz de Araújo, Í.B.; Brito, D.B.; Barboza, E. de A. A Low-Cost IoT System for Real-Time Monitoring of Climatic Variables and Photovoltaic Generation for Smart Grid Application. Sensors 2021, 21, 3293. [Google Scholar] [CrossRef]
- Lestari, D.; Arrohman, M.L.; Wirawan, I.M. Implementation of the Internet of Things for KWh Meter Data Logger in Shopping Mall. In Proceedings of the 2021 7th International Conference on Electrical, Electronics and Information Engineering (ICEEIE), Malang, Indonesia, 2 October 2021; IEEE: Piscataway, NJ, USA, 2021; pp. 329–334. [Google Scholar]
- Muliadi Fahrezi, M.Y.; Areni, I.S.; Palantei, E.; Achmad, A. A Smart Home Energy Consumption Monitoring System Integrated with Internet Connection. In Proceedings of the 2020 IEEE International Conference on Communication, Networks and Satellite (Comnetsat), Batam, Indonesia, 17–18 December 2020; IEEE: Piscataway, NJ, USA, 2020; pp. 75–80. [Google Scholar]
- Wahyutama, A.B.; Hwang, M. YOLO-Based Object Detection for Separate Collection of Recyclables and Capacity Monitoring of Trash Bins. Electronics 2022, 11, 1323. [Google Scholar] [CrossRef]
- Singh, J.J.; Ravi, N.N.; Krishnan, P.S. Iot Based Parking Sensor Network for Smart Campus. Int. J. Eng. Technol. 2018, 7, 26. [Google Scholar] [CrossRef]
- Alturki, R. Research Onion for Smart IoT-Enabled Mobile Applications. Sci. Program. 2021, 2021, 1–9. [Google Scholar] [CrossRef]
- Anang, N.; Hamid, M.S.A.; Muda, W.M.W. Simulation and Modelling of Electricity Usage Control and Monitoring System Using ThingSpeak. Baghdad Sci. J. 2021, 18, 0907. [Google Scholar] [CrossRef]
- Ghosh, S. Neuro-Fuzzy-Based IoT Assisted Power Monitoring System for Smart Grid. IEEE Access 2021, 9, 168587–168599. [Google Scholar] [CrossRef]
- Ahmed, M.M.; Qays, M.O.; Abu-Siada, A.; Muyeen, S.M.; Hossain, M.L. Cost-Effective Design of IoT-Based Smart Household Distribution System. Designs 2021, 5, 55. [Google Scholar] [CrossRef]
- Chen, Y.-Y.; Lin, Y.-H.; Kung, C.-C.; Chung, M.-H.; Yen, I.-H. Design and Implementation of Cloud Analytics-Assisted Smart Power Meters Considering Advanced Artificial Intelligence as Edge Analytics in Demand-Side Management for Smart Homes. Sensors 2019, 19, 2047. [Google Scholar] [CrossRef] [PubMed]
- Sayed, S.; Hussain, T.; Gastli, A.; Benammar, M. Design and Realization of an Open-source and Modular Smart Meter. Energy Sci. Eng. 2019, 7, 1405–1422. [Google Scholar] [CrossRef]
- Aghenta, L.O.; Iqbal, M.T. Low-Cost, Open Source IoT-Based SCADA System Design Using Thinger.IO and ESP32 Thing. Electronics 2019, 8, 822. [Google Scholar] [CrossRef]
- González, I.; Calderón, A.J.; Folgado, F.J. IoT Real Time System for Monitoring Lithium-Ion Battery Long-Term Operation in Microgrids. J. Energy Storage 2022, 51, 104596. [Google Scholar] [CrossRef]
- Viciana, E.; Alcayde, A.; Montoya, F.; Baños, R.; Arrabal-Campos, F.; Zapata-Sierra, A.; Manzano-Agugliaro, F. OpenZmeter: An Efficient Low-Cost Energy Smart Meter and Power Quality Analyzer. Sustainability 2018, 10, 4038. [Google Scholar] [CrossRef]
- M5STACK. M5STACK-CORE2-ESP32-IOT-DEVELOPMENT-KIT. Available online: https://shop.m5stack.com/products/m5stack-core2-esp32-iot-development-kit (accessed on 29 July 2022).
- AliExpress PZEM 004T 3.0 Version Single Phase Wattmeter Kwh Meter TTL Modbus-RTU 220V 100A Electricity Volt Amp Frequency Energy Meter. Available online: https://www.aliexpress.com/item/4001102546990.html?gatewayAdapt=glo2esp (accessed on 29 July 2022).
- Emporia. Gen 2 Vue Energy Monitor. Available online: https://www.emporiaenergy.com/technical-specs (accessed on 29 July 2022).
- Rama Krishnan, V.B.; Sandepudi, K.; Gazal, S. An Optimised System for Energy Monitoring and Data Acquisition in Substations/Domestic Applications Using IoT. E3S Web Conf. 2019, 87, 01001. [Google Scholar] [CrossRef]
- Jalal, M.A.; Yusof, M.I.; Yusof, E.M.M. Development of Smart IOt Energy Meter with Energy Saving Estimator. Int. J. Innov. Technol. Explor. Eng. 2019, 8, 5704–5707. [Google Scholar] [CrossRef]
- Luechaphonthara, K.; Vijayalakshmi, A. IOT Based Application for Monitoring Electricity Power Consumption in Home Appliances. Int. J. Electr. Comput. Eng. 2019, 9, 4988–4992. [Google Scholar] [CrossRef]
- Guerrero-Rodríguez, J.-M.; Cobos-Sánchez, C.; González-de-la-Rosa, J.-J.; Sales-Lérida, D. An Embedded Sensor Node for the Surveillance of Power Quality. Energies 2019, 12, 1561. [Google Scholar] [CrossRef] [Green Version]


| Requirements | Description | Details |
|---|---|---|
| Electrical parameter sensors | Voltage | R: 120–240 V, Ac: 5% |
| Frequency | R: 50–60 Hz, Ac: 5% | |
| Current | R: 0–100 A, Ac: 5% | |
| Active power | R: 0–20 KW, Ac: 5% | |
| Power factor | R: 0–100 %, Ac: 5% | |
| Active energy | R: 0–1000 kWh, Ac: 5% | |
| Data acquisition and processing | Serial communication | Full duplex |
| Programmable | Structured language | |
| Local reading | LCD screen | IPS |
| Internet connectivity | Wireless connection | Wi-Fi |
| Local storage | Micro SD | 128–1024 MB |
| IoT Platform | Database | Online data visualization |
| Web server | ||
| Data access | API | |
| Mobile app | User interface | Option menu |
| Web access | Data reading and graphing |
| Feature | Details |
|---|---|
| ESP32-based | 240 MHz dual core, 600 DMIPS, 520 KB SRAM, Wi-Fi, Bluetooth |
| Connections | M-Bus socket and pins |
| TF card slot | 16 G maximum size |
| IPS LCD Screen | 2.0”@320x240 ILI9342C |
| Multi-platform development | UIFlow MicroPython Arduino .NET nanoFramework |
| Buttons | Virtual screen button × 3 |
| Operating temperature | 0 to 60 °C |
| Product size | 54 × 54 × 16 mm |
| Base screw specifications | Hexagon socket countersunk head M3 |
| Features | Details |
|---|---|
| Voltage | R: 80–260 V, Res: 0.1 V, Ac: 0.5% |
| Current | R: 0–100 A, Res: 0.001 A, Ac: 0.5% |
| Active power | R: 0–23 KW, Res: 0.1 W, Ac: 0.5% |
| Active energy | R: 0–9999.99 kWh, Res: 1 kWh, Ac: 0.5% |
| Frequency | R: 45–65 Hz, Res: 0.1 Hz, Ac: 0.5% |
| Power factor | R: 0–1, Res: 0.01, Ac: 1% |
| Measuring range 100 A | External transformer |
| Phase | Single phase |
| Physical protocol | UART to TTL communication interface, baud rate is 9600, 8 data bits, 1 stop bit, no parity |
| Application protocol | Modbus-RTU |
| Operating temperature | −10 to 60 °C |
| Features | Details |
|---|---|
| Input voltage | 100–240 V |
| Current | Max 200 A |
| 200 A sensor ports | 3 mm × 3.5 mm two-pole audio connector |
| Frequency | 50–60 Hz |
| Power consumption | Max 3 [W] |
| Phase | Single-phase up to 240 V line-neutralsingle, split-phase 120/240 Vthree-phase up to 415Y/240 V (no Delta) |
| Wi-Fi | 2.4 GHz 802.11b/g/n |
| Certification | UL/IEC/EN 62368-1 |
| Operating conditions | −40 to +50 °C|0 to 80% RH |
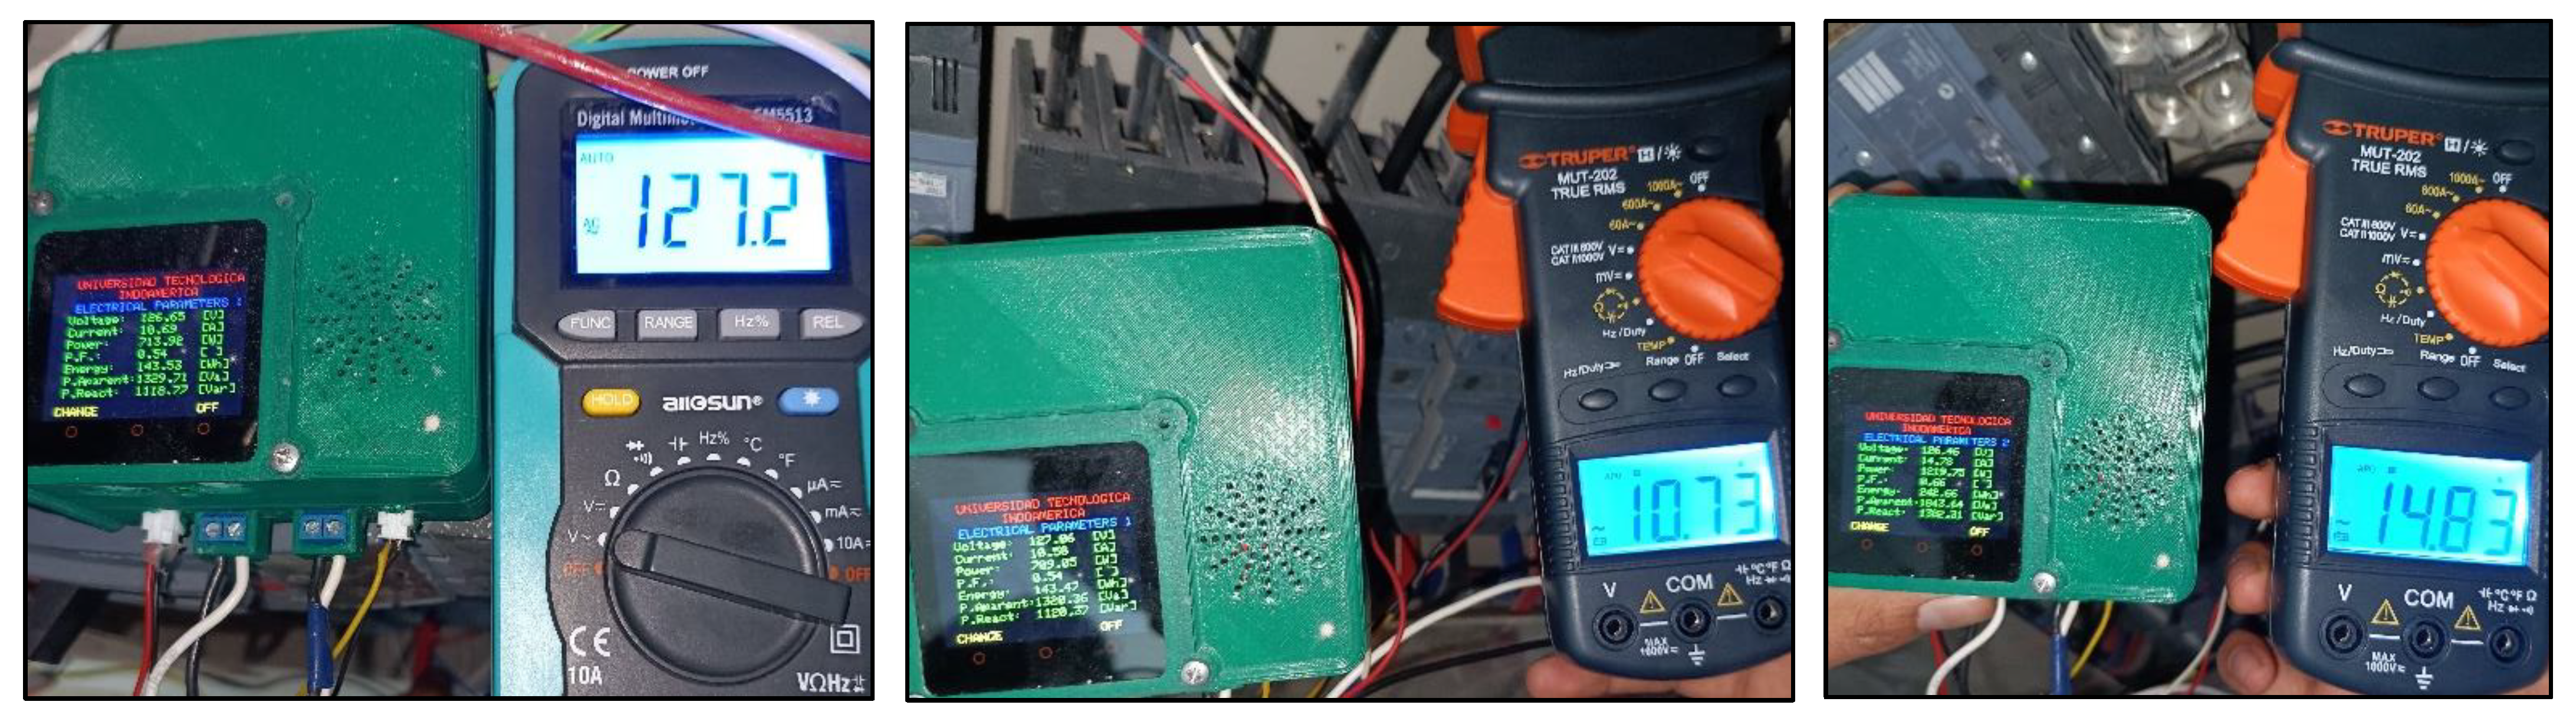
| Voltage | Current 1 | Current 2 | |
|---|---|---|---|
| Reference | 127.2 V | 10.73 A | 14.83 A |
| Proposed system | 126.65 V | 10.58 A | 14.78 A |
| Absolute error | 0.55 V | 0.15 A | 0.05 A |
| Relative error | 0.4324% | 1.3979% | 0.3372% |
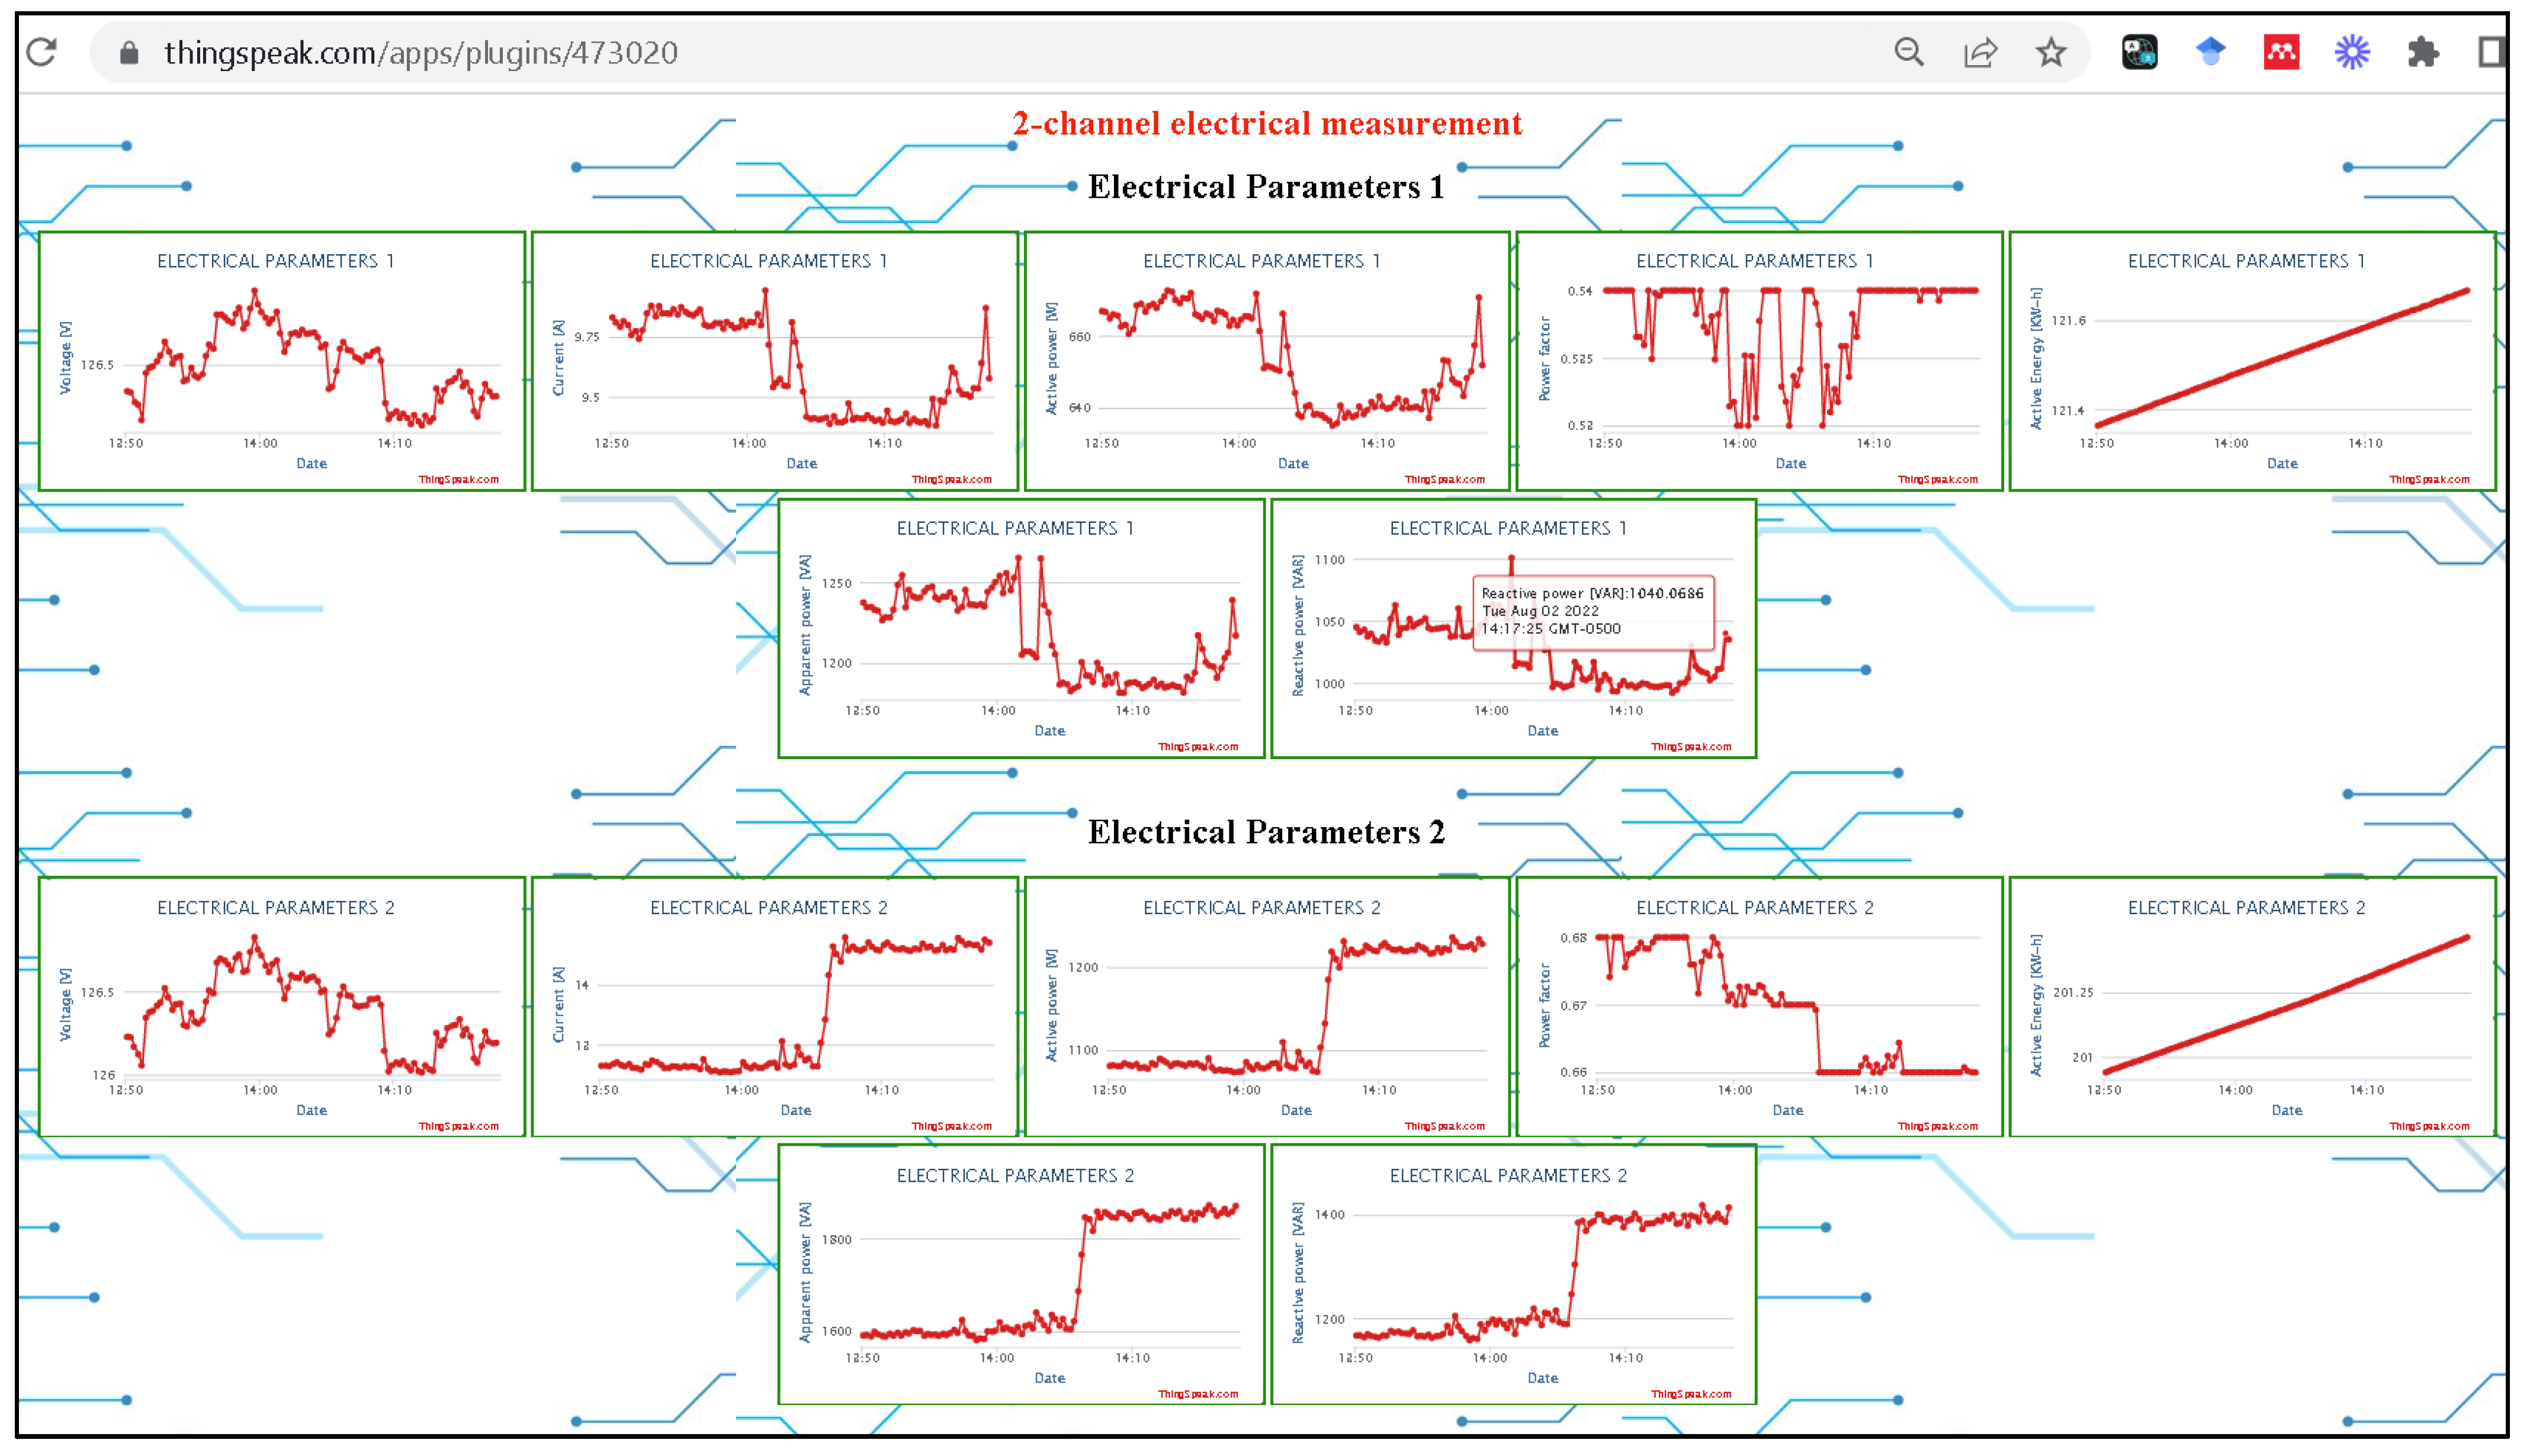
| Voltage (V) | Current (A) | Active Power (W) | Power Factor (%) | Active Energy (kWh) | Apparent Power (V.A.) | |
|---|---|---|---|---|---|---|
| Min | 121.8016 | 1.1571 | 27.6679 | 18 | 0 | 144.2786 |
| Max | 129.2377 | 26.1165 | 1842.1 | 58.09 | 55.297 | 3349.5 |
| Mean | 126.545 | 5.2574 | 327.2443 | 37.02 | 24.0888 | 662.0064 |
| SDe | 1.1541 | 6.1112 | 443.645 | 14.01 | 14.4145 | 766.4659 |
| Voltage (V) | Current (A) | Active Power (W) | Power Factor (%) | Active Energy (kWh) | Apparent Power (V.A.) | |
|---|---|---|---|---|---|---|
| Min | 121.69 | 3.1765 | 330.4159 | 55.15 | 0 | 396.078 |
| Max | 129.119 | 30.0675 | 2208.2 | 85 | 98.0120 | 3806.6 |
| Mean | 126.4349 | 6.3152 | 579.3522 | 76.78 | 44.1475 | 796.461 |
| SDe | 1.1523 | 4.3525 | 332.4549 | 6.32 | 27.6603 | 545.7108 |
| Proposed System | Gen 2 Vue | |
|---|---|---|
| Min | 23.6567 W | 26.7 W |
| Max | 1736.2 W | 1691.4 W |
| Mean | 383.3336 W | 378.1132 W |
| SDe | 456.1866 W | 445.3159 W |
| Mean absolute error | 7.654 W | |
| Mean relative error | 2.1059% | |
| Proposed System | Gen 2 Vue | |
|---|---|---|
| Min | 320.2310 W | 312.6 W |
| Max | 2108.2 W | 1982 W |
| Mean | 599.0149 W | 606.2047 W |
| SDe | 354.9327 W | 363.6557 W |
| Mean absolute error | 13.2544 W | |
| Mean relative error | 1.9487% | |
| Proposed System | Gen 2 Vue | |
|---|---|---|
| Max | 64.5230 kWh | 62.5183 kWh |
| Mean | 32.2543 kWh | 31.0064 kWh |
| SDe | 17.0677 kWh | 16.8887 kWh |
| Mean absolute error | 0.2625 kWh | |
| Mean relative error | 0.8137% | |
| Proposed System | Gen 2 Vue | |
|---|---|---|
| Max | 104.3190 kWh | 101.4658 kWh |
| Mean | 48.6651 kWh | 47.4118 kWh |
| SDe | 28.0198 kWh | 27.6273 kWh |
| Mean absolute error | 0.656 kWh | |
| Mean relative error | 1.3627% | |
Publisher’s Note: MDPI stays neutral with regard to jurisdictional claims in published maps and institutional affiliations. |
© 2022 by the authors. Licensee MDPI, Basel, Switzerland. This article is an open access article distributed under the terms and conditions of the Creative Commons Attribution (CC BY) license (https://creativecommons.org/licenses/by/4.0/).
Share and Cite
Varela-Aldás, J.; Silva, S.; Palacios-Navarro, G. IoT-Based Alternating Current Electrical Parameters Monitoring System. Energies 2022, 15, 6637. https://doi.org/10.3390/en15186637
Varela-Aldás J, Silva S, Palacios-Navarro G. IoT-Based Alternating Current Electrical Parameters Monitoring System. Energies. 2022; 15(18):6637. https://doi.org/10.3390/en15186637
Chicago/Turabian StyleVarela-Aldás, José, Steven Silva, and Guillermo Palacios-Navarro. 2022. "IoT-Based Alternating Current Electrical Parameters Monitoring System" Energies 15, no. 18: 6637. https://doi.org/10.3390/en15186637
APA StyleVarela-Aldás, J., Silva, S., & Palacios-Navarro, G. (2022). IoT-Based Alternating Current Electrical Parameters Monitoring System. Energies, 15(18), 6637. https://doi.org/10.3390/en15186637