Review

CO2 Emissions in Buildings: A Synopsis of Current Studies

by
Pedro J. Zarco-Periñán
1,*,
Fco Javier Zarco-Soto
1,
Irene M. Zarco-Soto
1,
José L. Martínez-Ramos
1 and
Rafael Sánchez-Durán
2
1
Departamento de Ingeniería Eléctrica, Escuela Superior de Ingeniería, Universidad de Sevilla, Camino de los Descubrimientos, s/n, 41092 Sevilla, Spain
2
Endesa, Avenida de la Borbolla, 5, 41004 Sevilla, Spain
*
Author to whom correspondence should be addressed.
Energies 2022, 15(18), 6635; https://doi.org/10.3390/en15186635
Submission received: 28 June 2022 / Revised: 25 August 2022 / Accepted: 8 September 2022 / Published: 10 September 2022

Abstract

:
CO2 is the most emitted greenhouse gas and is mainly produced by human activity. In fact, about 75% is emitted in cities and 40% of global carbon emissions is produced by the building sector. Therefore, buildings are very important in terms of CO2 emissions. This importance is also reflected in the works that have been developed on this subject. This manuscript reviews the research that has shown or calculated the amounts of CO2 emitted in buildings. For a better understanding of the scope of the investigations, a classification is presented. With this, it is intended to help researchers interested in this area by summarizing the studies carried out to date on the amounts of CO2 emitted depending on the type of building.

1. Introduction

1.1. Overview

The world population living in cities reaches 55% and this percentage is expected to reach 68% in 2050. However, that percentage has already been reached in some areas. Thus, the urban population in North America, Latin America and the Caribbean is already over 80%; in Europe, it reaches 75% and in Oceania 68% [1]. In addition, 75% of CO2 emissions are produced in cities and they consume between 60 and 80% of energy [2]. In particular, 36% of energy is consumed and 40% of emissions are produced in buildings [3]. However, in 2020, these values decreased by 1% and 10%, respectively, due to the COVID-19 pandemic [4]. The usual form of energy consumption in buildings is as electricity and as natural gas for thermal consumption [5].
Carbon dioxide (CO2), methane (CH4), nitrous oxide (N2O) and hydrofluorocarbons (HFCs) are the main greenhouse gases (GHG). CO2 is the GHG that is emitted the most, reaching 80% of the total. In addition, it is mainly produced by human activity. 77% of this pollutant comes from energy, of which transport accounts for about a third [6].
Energy consumption and gas emissions in cities are important; however, the area occupied by them is small. For example, in the European Union, it is only 4% [7]. Hence the importance of any action that is carried out in cities in general and in buildings in particular. This is reflected in the guidelines issued by the different organizations and that appear in the Sustainable Development Goals of the United Nations through Goals 7, 11, 12 and 13 [2]. They refer to energy, cities, sustainable and responsible consumption and production, and the reduction of emissions, respectively. At the European level, the European Green Deal aims to stop producing net greenhouse gas emissions by 2050 [8]. In this regard, 100 European cities have been selected to be climate-neutral and smart cities by 2030 [9]. With this, it is intended that they serve as experimentation and innovation hubs that make it easier for other cities to also achieve this goal by 2050.

1.2. Aim of the Research
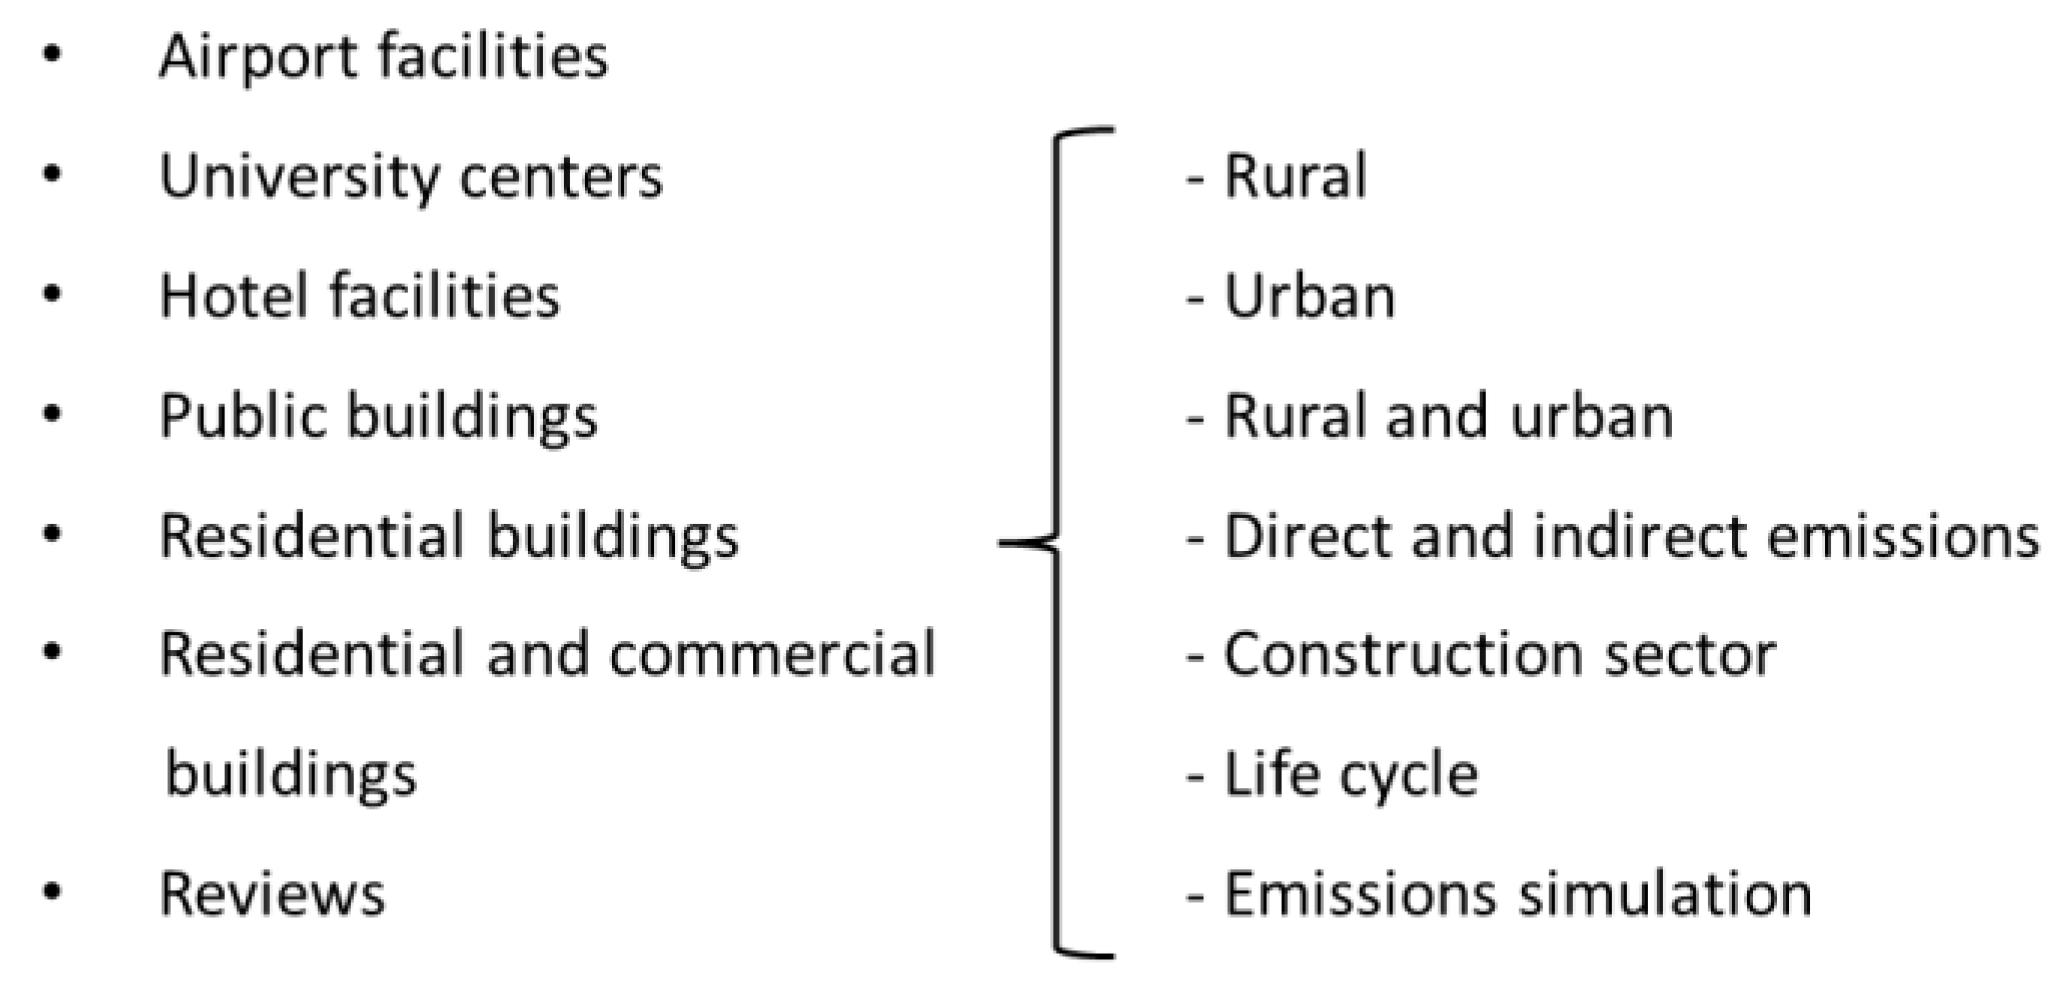
The importance that buildings have in the emission of GHG is clear. For this reason, this manuscript is focused on its emissions. A compilation and classification of publications that show or calculate CO2 emissions from buildings is presented. The sectors and groupings shown in the publications have been maintained. Thus, if one paper shows emissions from residential buildings and another from residential and commercial buildings, each one has been considered to belong to a different group. The classification has been made considering these groups. In this way, the researcher interested in analyzing the amounts of CO2 emitted in buildings has this information in an accessible and unified way. Thus, their studies have a clear starting point.

2. Classification

The search for studies that show or calculate CO2 emissions from buildings is carried out. The groupings used by researchers in their publications are considered. From this, a classification is proposed, and the papers are assigned to it.
Classifications with different approaches can be performed. Thus, it can be carried out taking into account the following: the type of building (residential, commercial, universities, etc.); its location (urban, rural, etc.); the characteristics of the resident (age, income level, size of the building, etc.); the origin of the emissions (heating, air conditioning, etc.); whether they are direct or indirect emissions; if the entire life cycle is considered; etc. Moreover, any of them with a greater or lesser breakdown or degree of aggregation may be taken into account. For example, if it is about residential buildings, then it is considered whether if it is a rural or urban environment or if it covers both together; if they are buildings of the tertiary sector, differentiating or unifying them; or even joining all the buildings without differentiating, whether they are residential or not. In other cases, the analyses of CO2 emissions have been carried out on a certain type of building or dwelling that has been taken as a sample, or with a certain geographical scope, which is usually a very broad region.
The goal of this work is to help researchers to know the state of the art and their bibliographic search. Therefore, it is necessary to consider the type of work that is usually carried out. From the point of view of the authors, a classification based on the type of building is the one that may be most useful for this purpose.
The grouping of the research works proposed in this manuscript is shown in Figure 1.

3. Airport Facilities

Today, airports are small cities through which billions of passengers pass each year. The energy consumption, the services they need, the waste they produce and the emissions they generate are like those of any city. Numerous manuscripts on aircraft emissions have been published. However, they have not been carried out on emissions from buildings. CO2 emissions from airport ground operations of 70 Chinese airports have been calculated. For this, fuel type consumed in on-ground airport operations and the CO2 emission factor were used. In addition, night light data from images obtained from satellites were used. It was concluded that the factors that have most effect are urbanization, direct foreign investment, tertiary industry, passenger turnover of civil aviation and passenger turnover of railways, the latter being negative [10].

4. University Centers

As in other buildings for tertiary use, university centers are active mostly in the day. They may consist of several buildings or just one. They include the academic zone, administrative zone and, in some cases, laboratories. Savings measures in university centers is one of the recurrent study topics. However, emissions of this type of building have been little studied. As is generally the case in buildings, natural gas and electricity are their main sources of energy. A prediction of daily consumption has been carried out from six explanatory variables [11]. Due to the cessation of academic activity on weekends, the day of the week is one of those variables considered. Five-year data and a multiple regression technique have been used to make the prediction. Data from a London university center have been used to test the forecast model and emissions, due to both electricity and natural gas having been calculated.

5. Hotel Facilities

The importance of hotels from the point of view of emissions is high, both because of the number of those that exist and because of the wide range of services that they offer to their clients. At the country level, Italy has been studied. Energy consumption has been evaluated to identify emissions. Subsequently, the potential energy savings and the possibility of implementing energy efficiency in them has been analyzed. The main saving measures are: substitutions of windows; substitution of current bulbs with LED bulbs; wall insulation; installation of condensing boilers; and installation of heat pumps [12]. Using a similar methodology at the city level, 28 hotels have been studied in Lagos (Nigeria) [13] and 17 in Hong Kong [14]. In the first case, the energy consumption per room was calculated, and in the second the consumption per m2. Based on that knowledge, their emissions were also evaluated, starting from the fuel emission coefficient in one case and from that of electricity in another. Another way of approaching these studies has been based on the characterization of the most common type of hotels in the United Kingdom. Studying only two hotels, 67% of the hotels were covered. One of them modern and specially designed, and another old and remodeled. With this, conclusions were obtained on the measures to be considered to reduce their emissions: ventilation heat recovery through a thermal wheel; wall insulation externally or internally through expanded polystyrene or mineral fiber; argon-filled triple glazing; efficiency improvements in lighting; electrical appliances and kitchen catering equipment; efficient motors for lifts; replacement of conventional gas heating by condensing boiler; and water heating using solar thermal collectors [15].
Benchmarking has also been done on the Singapore hotel industry. For this, 29 hotels have been studied, electricity being the main source of energy. As a relevant conclusion, It was obtained that the characteristic that serves to normalize hotels must be very well chosen because carbon intensity is very sensitive to it [16]. The complete life cycle of a hotel has also been studied. For this, 31 hotels in the Balearic Islands (Spain) were analyzed. Both CO2 emissions and generated waste were studied. The results show that the operation phase is the one with the greatest impact [17].

6. Public Buildings

CO2 emissions produced in public buildings have been analyzed in 119 buildings in China. Hospitals, office buildings and schools have been studied. The former are those that produce the greatest emissions and the latter those that produce the least, with a difference between them of more than 100%. Emissions are obtained from energy consumption. These have been compared with those of the United States, United Kingdom and Japan. Energy consumption per unit of construction area is lower in China than in the first two and close to the last [18].

7. Residential Buildings

CO2 emissions in the residential sector show sustained growth of 2% per year so far this century [19]. Studies of these buildings have been carried out from different points of view. In some cases, rural and urban areas are differentiated and, in others, they are studied together.

7.1. Rural Residential Buildings

Studies of emissions from residential buildings in rural areas are very scarce and limited to specific areas. Thus, the main source of energy in the province of Hubei (China) is biomass, coal and wood. A study of the emissions of the stoves used is carried out, showing which ones are better and calculating their emissions from field tests [20]. Furthermore, a study of the rural areas of Gansu, Qinghai and Ningxia provinces in China has been carried out. In this case, emissions were related to the type of agriculture developed, family income and family size. The following conclusions are reached: the highest proportion of emissions is due to the subsistence needs of families; emissions increase as income increases; and family size is inversely related to emissions [21]. Emissions in Wattwil (Switzerland) have also been shown from the statistical census. In this case, in addition to those due to residential buildings, those corresponding to land mobility have been included. In addition, the life cycle has been considered, identifying the factors that have the most influence on emissions [22].

7.2. Urban Residential Buildings

Studies that exclusively refer to urban residential buildings are few. The influence of one or several characteristics on the calculation of emissions is investigated. One of the most studied is income. The influence has been studied in China [23,24,25,26], India [27], Lebanon [28] and Melbourne [29]. In all cases, the higher the income, the higher the emissions. In the case of China, other characteristics were also included, such as the influence of urbanization, education, marital status and number of inhabitants per household. As for Indian cities, their emissions are like those of Chinese cities. For Lebanon, the number of residents was also considered. In addition, for the case of Melbourne, emissions due to automobiles were also included. In Japan, the influence that head-of-household age has on emissions was studied, being greater the older their age [30].
In urban areas, buildings are grouped into neighborhoods. In them, population density, accessibility to public transport [31], urban morphology and construction technologies influence emissions [32]. Furthermore, at the district and city level, calculation tools, emission assessment systems and efficiency measures at the urban level have been analyzed. These measures have been classified into urban morphology, buildings’ efficiency, systems’ efficiency and individual behaviors [33].

7.3. Rural and Urban Residential Buildings

Studies on emissions from residential buildings, without distinguishing between rural and urban or separating them, have been more numerous. They analyze the different factors that influence emissions. The income variable is once again recurrent in the studies. In addition to this, others that the researcher wants to highlight are included, such as, for example, the age of the residents [34], or the rural or urban location [35,36,37,38,39,40]. The conclusion reached with respect to the income level is that the higher it is, the higher the emissions. However, the emission intensities are the opposite in the Netherlands and United Kingdom [41].
Other factors have been analyzed individually. This is intended to improve emission-producing equipment and its environmental impact. This has been the case of air-conditioning equipment, whose use accounts for 33% of energy consumption in the homes analyzed [42], or the air or water adaptation systems inside the home [43], or the influence of the age of the dwelling [44]. Finally, the influence that government measures and the potential for emission reduction have in different countries has also been investigated [45,46,47,48].

7.4. Direct and Indirect Residential Emissions

CO2 emissions can have a direct or indirect origin. Those of direct origin come from the use of energy by consumers of residential origin. While those of indirect origin are a consequence of the purchase and use of products and services by consumers to satisfy their basic needs. These residential emissions are those that cause the greatest growth in direct and indirect CO2 emissions [49]. Thus, these two types of emissions represent more than 40% of carbon emissions in China [50], while estimates for the USA reach 80% [51].
Some studies have focused solely on the urban residential sector. Their conclusions are as follows: emissions are higher in cold regions and lower in larger cities [52]; depopulation of cities can generate higher emissions [53]; emissions increase with income [54]; the greater the number of people per household, the lower the emissions [55]. Regarding the region of study, in most of the investigations, no distinction has been made between rural and urban areas. The most studied country has been China, although Spain [56], USA [57], Ireland [58] and Denmark [59,60] have also been investigated. The conclusions obtained in all cases have been similar: indirect emissions increase more in urban areas, since there is a greater tendency towards tertiary industry products than in rural areas [61]; both total and direct and indirect emissions from urban households are greater than those from rural ones [62]; emissions due to indirect consumption in urban households are greater than those corresponding to direct consumption [63]; however, in rural households the opposite occurs [64]; the production and supply of electricity and hot water are the main factors that produce indirect emissions in both rural and urban households [65]; and household consumption has increased above the technological and efficiency improvements introduced [66].

7.5. Emissions in the Residential Construction Sector

The importance of CO2 emissions in the residential sector is also reflected in the construction of buildings. The containment or reduction of emissions must be achieved through different measures. Among them are not only the more efficient use of energy, the use of low-emission construction techniques or the design of buildings with low consumption, but also the establishment of government instructions that favor them [67].

7.6. Life Cycle Emissions of Residential Buildings

The life cycle of buildings encompasses the phases of materials manufacturing, transportation, construction, renovation, operational life, demolition and waste management. Embodied carbon includes all phases except the operational phase and accounts for 11% of emissions. Hence, the importance of reducing embodied carbon [68].
The life cycle in the residential sector has been studied, in particular, for Norway. The analysis of historical data from the residential sector [69] allows hypotheses to be made for the electricity needs in the building sector with different scenarios [70].

7.7. Simulation of Emissions in Households

An energy consumption and CO2 emission generation simulation game has been developed. The game allows the player to analyze how the changes made in the home and in consumption habits are effective. In addition, the costs of the measures implemented, and the savings achieved are detailed. In this way, it is possible to learn what the environmental habits to acquire and the technical measures to adopt should be [71].

8. Residential and Commercial Buildings

From the point of view of the emissions produced, residential and commercial buildings have a series of common characteristics. This makes them susceptible to being studied together. For this reason, numerous studies have analyzed them as if they were the same type of building. That is the reason why, in the classification, a different heading has been maintained from that of residential buildings: publications have been made with the sole scope of residential buildings and others join them with commercial ones. Residential and commercial buildings have been studied from different points of view: population density, reaching the conclusion that the greater the density, the greater the emissions [72]; economic income of the residents, eliminating the influence of the climate [73], without eliminating it [74], or analyzing only the effect of heating [75], observing in all cases that, the higher the income, the higher the CO2 emissions; size of the city, finding that the larger the city, the greater the emissions [76]; climate, obtaining as a result that the more extreme the climate, the greater the emissions [77]; heating and air conditioning, with a considerable increase expected due to the use of air conditioning [78]; or only heating, taking into account the forecast growth of gross domestic product (GDP) and population [79].
The life cycle has also been analyzed in Macau, concluding that around 66% of the total emissions are produced during the use stage, the rest being produced in the construction stage, since in the dismantling phase the emissions may even be negative [80].

9. Reviews

Some reviews about CO2 emissions in the residential sector have been made from different points of view. The lines of research carried out so far and their future trends have been reviewed [81]. It has been found that research in this field is interdisciplinary and more depth is needed at the city and individual level [82]. The review has also focused on quantification methods, influencing factors and measures to mitigate emissions [83].

10. Summary

A classification has been proposed. Publications showing or calculating CO2 emissions from buildings have been identified. In this way, they can be grouped according to classification. Table 1 shows the classification of the publications.
In addition, to achieve the environmental goals set by government authorities, it is necessary to reduce emissions from buildings. To apply measures that reduce them, it is necessary to know in advance what the sources are. Consequently, measures can be applied to reduce consumption and, therefore, emissions. Based on the publications analyzed in this work, the factors that most influence the production of emissions and the measures that can mitigate them are summarized.
The factors that most influence the production of emissions in the operation stage are: air conditioning; heating; ventilation; illumination; home appliances; and power motors. Analyzed publications that show these factors are shown in Table 2.
Regarding the measures that reduce emissions, the main ones are: wall insulation; substitutions of windows; efficiency improvements in lighting; efficient electrical appliances; installation of condensing boilers; installation of heat pumps; installation of efficient motors; and water heating using solar thermal collectors. Studied publications showing these measures are shown in Table 3.

11. Conclusions

CO2 is the most emitted gas among those that cause the greenhouse effect, accounting for up to 80%. In addition, human activity is the main producer, generating 75% in cities. In particular, 40% is produced in buildings. For this reason, any measure that affects the reduction of its emissions has a multiplier effect and will have a very favorable impact on the improvement of environmental quality. This is the reason why the study of CO2 emissions from buildings is so important.
The works published to date that have calculated or revealed the amounts of CO2 emitted by buildings have been reviewed in this work. A classification of these works has been carried out and they have been grouped by type of building. The sectors and groups presented in the publications have been maintained. These buildings can be dedicated to a tertiary purpose or be residential. In addition, they can be rural or urban. With the classification and review carried out in this paper, researchers have access to the state of the art according to the type of building they are studying.

Author Contributions

Conceptualization, P.J.Z.-P., F.J.Z.-S., I.M.Z.-S. and R.S.-D.; methodology, P.J.Z.-P. and F.J.Z.-S.; validation, P.J.Z.-P., I.M.Z.-S. and F.J.Z.-S.; formal analysis, P.J.Z.-P., F.J.Z.-S., I.M.Z.-S. and J.L.M.-R.; investigation, P.J.Z.-P., F.J.Z.-S. and I.M.Z.-S.; data curation, I.M.Z.-S. and F.J.Z.-S.; writing—original draft preparation, P.J.Z.-P., F.J.Z.-S. and I.M.Z.-S.; writing—review and editing, I.M.Z.-S., F.J.Z.-S. and P.J.Z.-P.; visualization, F.J.Z.-S. and I.M.Z.-S.; supervision, P.J.Z.-P., J.L.M.-R. and R.S.-D.; project administration, P.J.Z.-P.; funding acquisition, J.L.M.-R. All authors have read and agreed to the published version of the manuscript.

Funding

The authors would like to acknowledge the financial support of the Spanish State Research Agency: Project PID2020-116433RB-I00 funding by MCIN/AEI/10.13039/501100011033.

Institutional Review Board Statement

Not applicable.

Informed Consent Statement

Not applicable.

Data Availability Statement

Not applicable.

Acknowledgments

The authors are grateful to the reviewers for their valuable comments, since they undoubtedly allowed a better understanding of the work and served to improve it.

Conflicts of Interest

The authors declare no conflict of interest.

References

  1. Department of Economic and Social Affairs. World Urbanization Prospects: The 2018 Revision; United Nations: New York, NY, USA, 2019. [Google Scholar]
  2. United Nations, Sustainable Development Goals. Available online: https://www.un.org/sustainabledevelopment/ (accessed on 13 May 2020).
  3. International Energy Agency. 2018 Global Status Report: Towards a Zero-Emission, Efficient and Resilient Buildings and Construction Sector; United Nations Environment Programme: Nairobi, Kenya, 2018. [Google Scholar]
  4. International Energy Agency. 2021 Global Status Report for Buildings and Construction: Towards a Zero-Emissions, Efficient and Resilient Buildings and Construction Sector; United Nations Environment Programme: Nairobi, Kenya, 2021. [Google Scholar]
  5. Shahrokni, H.; Levihn, F.; Brandt, N. Big meter data analysis of the energy efficiency potential in Stockholm’s building stock. Energy Build. 2014, 78, 153–164. [Google Scholar] [CrossRef]
  6. European Parliament News. Available online: https://www.europarl.europa.eu/news/en/headlines/society/20180301STO98928/greenhouse-gas-emissions-bycountry-and-sector-infographic (accessed on 17 July 2020).
  7. Publications Office of the Europen Union. EU Missions: Climate-Neutral and Smart Cities; European Union: Luxembourg, 2021. [Google Scholar]
  8. COM(2019) 640 Final. In The European Green Deal; European Commission: Brussels, Belgium, 2019.
  9. COM(2021) 609 Final. In European Missions; European Commission: Brussels, Belgium, 2021.
  10. Zhang, W.; Jiang, L.; Cui, Y.; Xu, Y.; Wang, C.; Yu, J.; Streets, D.G.; Lin, B. Effects of urbanization on airport CO2 emissions: A geographically weighted approach using nighttime data in China. Resour. Conserv. Recycl. 2019, 150, 104454. [Google Scholar] [CrossRef]
  11. Amber, K.P.; Aslam, M.W.; Mahmood, A.; Kousar, A.; Younis, M.Y.; Akbar, B.; Chaudhary, G.Q.; Hussain, S.K. Energy consumption forecasting for university sector buildings. Energies 2017, 10, 1579. [Google Scholar] [CrossRef]
  12. Bianco, V.; Righi, D.; Scarpa, F.; Tagliafico, L.A. Modeling energy consumption and efficiency measures in the Italian hotel sector. Energy Build. 2017, 149, 329–338. [Google Scholar] [CrossRef]
  13. Oluseyi, P.O.; Babatunde, O.M.; Babatunde, O.A. Assessment of energy consumption and carbon footprint from the hotel sector within Lagos, Nigeria. Energy Build. 2016, 118, 106–113. [Google Scholar] [CrossRef]
  14. Chan, W.W.; Lam, J.C. Prediction of pollutant emission through electricity consumption by the hotel industry in Hong Kong. Hosp. Manag. 2002, 21, 381–391. [Google Scholar] [CrossRef]
  15. Taylor, S.; Peacok, A.; Banfill, P.; Shao, L. Reduction of greenhouse gas emissions from UK hotels in 2030. Build. Environ. 2010, 45, 1389–1400. [Google Scholar] [CrossRef]
  16. Xuchao, W.; Priyadarsini, R.; Eang, L.S. Benchmarking energy use greenhouse gas emissions in Singapore´s hotel industry. Energy Policy 2010, 38, 4520–4527. [Google Scholar] [CrossRef]
  17. Rosselló-Batle, B.; Moià, A.; Cladera, A.; Martínez, V. Energy use, CO2 emissions and waste throughout the life cycle of a sample of hotels in the Balearic Islands. Energy Build. 2010, 42, 547–558. [Google Scholar] [CrossRef]
  18. Ma, H.; Du, N.; Yu, S.; Lu, W.; Zhang, Z.; Deng, N.; Li, C. Analysis of typical public building energy consumption in northern China. Energy Build. 2017, 136, 139–150. [Google Scholar] [CrossRef]
  19. IEA. Transition to Sustainable Buildings: Strategies and Opportunities to 2050; International Energy Agency: Paris, France, 2013. [Google Scholar]
  20. Shen, G.; Chen, Y.; Xue, C.; Lin, N.; Huang, Y.; Shen, H.; Wang, Y.; Li, T.; Zhang, Y.; Su, S.; et al. Pollutant emissions from improved coal- and wood-fuelled cookstoves in rural households. Environ. Sci. Technol. 2015, 49, 6590–6598. [Google Scholar] [CrossRef] [PubMed]
  21. Qu, J.; Zeng, J.; Li, Y.; Wang, Q.; Maraseni, T.; Zhang, L.; Zhang, Z.; Clarke-Sather, A. Household carbon dioxide emissions from peasants and herdsmen in northwestern arid-alpine regions, China. Energy Policy 2013, 57, 133–140. [Google Scholar] [CrossRef]
  22. Saner, D.; Heeren, N.; Jäggin, B.; Waraich, R.A.; Hellweg, S. Housing and mobility demands of individual households and their life cycle assessment. Environ. Sci. Technol. 2013, 47, 5968–5997. [Google Scholar] [CrossRef] [PubMed]
  23. Huo, T.; Cao, R.; Du, H.; Zhang, J.; Cai, W.; Liu, B. Nonlinear influence of urbanization on China’s urban residential building carbon emissions: New evidence from panel threshold model. Sci. Total Environ. 2021, 772, 145058. [Google Scholar] [CrossRef] [PubMed]
  24. Golley, J.; Meng, X. Income inequality and carbon dioxide emissions: The case of Chinese urban households. Energy Econ. 2012, 34, 1864–1872. [Google Scholar] [CrossRef]
  25. Han, L.; Xu, X.; Han, L. Applying quantile regression and Shapley decomposition to analyzing the determinants of household embedded carbon emissions: Evidence from urban China. J. Clean Prod. 2015, 103, 219–230. [Google Scholar] [CrossRef]
  26. Liang, Y.; Cai, W.; Ma, M. Carbon dioxide intensity and income level in the Chinese megacities’ residential building sector: Decomposition and decoupling analyses. Sci. Total Environ. 2019, 677, 315–327. [Google Scholar] [CrossRef]
  27. Sohail, A.; Baiocchi, G.; Creutzig, F. CO2 emissions from direct energy use of urban households in India. Environ. Sci. Technol. 2015, 49, 11312–11320. [Google Scholar] [CrossRef]
  28. Houri, A.; Ibrahim-Korfali, S. Residential energy consumption patterns: The case of Lebanon. Int. J. Energy Res. 2005, 29, 755–766. [Google Scholar] [CrossRef]
  29. Stokes, D.; Lindsay, A.; Marinopoulos, J.; Treloar, A.; Wescott, G. Household carbon dioxide production in relation to the greenhouse effect. J. Environ. Manag. 1994, 40, 197–211. [Google Scholar] [CrossRef]
  30. Long, Y.; Yoshida, Y.; Meng, J.; Guan, D.; Yao, L.; Zhang, H. Unequal age-based household emission and its monthly variation embodied in energy consumption—A cases study of Tokyo, Japan. Appl. Energy 2019, 247, 350–362. [Google Scholar] [CrossRef]
  31. Qin, B.; Han, S.S. Planning parameters and household carbon emission: Evidence from high- and low-carbon neighborhoods in Beijing. Habitat. Int. 2013, 37, 52–60. [Google Scholar] [CrossRef]
  32. Salat, S. Energy loads, CO2 emissions and building stocks: Morphologies, typologies, energy systems and behaviour. Build. Res. Inf. 2009, 37, 5–6. [Google Scholar] [CrossRef]
  33. Bourdic, L.; Salat, S. Building energy models and assessment systems at the district and city scales: A review. Build. Res. Inf. 2012, 40, 518–526. [Google Scholar] [CrossRef]
  34. Chancel, L. Are younger generations higher carbon emitters than their elders? Inequalities, generations and CO2 emissions in France and in the USA. Ecol. Econ. 2014, 100, 195–207. [Google Scholar] [CrossRef]
  35. Duarte, R.; Mainar, A.; Sánchez-Chóliz, J. Social groups and CO2 emissions in Spanish households. Energy Policy 2012, 44, 441–450. [Google Scholar] [CrossRef]
  36. Li, J.; Zhang, D.; Su, B. The impact of social awareness and lifestyles on household carbon emissions in China. Ecol. Econ. 2019, 160, 145–155. [Google Scholar] [CrossRef]
  37. Büchs, M.; Schnepf, S.V. Who emits most? Associations between socio-economic factors and UK households’ home energy, transport, indirect and total CO2 emissions. Ecol. Econ. 2013, 90, 114–123. [Google Scholar] [CrossRef]
  38. Druckman, A.; Jackson, T. Household energy consumption in the UK: A highly geographically and socio-economically disaggregated model. Energy Policy 2008, 36, 3177–3192. [Google Scholar] [CrossRef]
  39. Donglan, Z.; Dequn, Z.; Peng, Z. Driving forces of residential CO2 emissions in urban and rural China: An index decomposition analysis. Energy Policy 2010, 38, 3377–3383. [Google Scholar] [CrossRef]
  40. Xing, R.; Hanaoka, T.; Kanamori, Y.; Masui, T. Greenhouse gas and air pollutant emissions of China’s residential sector: The importance of considering energy transition. Sustainability 2017, 9, 614. [Google Scholar] [CrossRef]
  41. Kerkhof, A.C.; Benders, R.M.J.; Moll, H.C. Determinants of variation in household CO2 emissions between and within countries. Energy Policy 2009, 37, 1509–1517. [Google Scholar] [CrossRef]
  42. Izquierdo, M.; Moreno-Rodríguez, A.; González-Gil, A.; García-Hernando, N. Air conditioning in the region of Madrid, Spain: An approach to electricity consumption, economics and CO2 emissions. Energy 2011, 36, 1630–1639. [Google Scholar] [CrossRef]
  43. Fan, J.; Liao, H.; Liang, Q.; Tatano, H.; Liu, C.; Wei, Y. Residential carbon emission evolutions in urban-rural divided China: An end-use and behavior analysis. Appl. Energy 2013, 101, 323–332. [Google Scholar] [CrossRef]
  44. Firth, S.K.; Lomas, K.J.; Wright, A.J. Targeting household energy-efficiency measures using sensitivity analysis. Build. Res. Inf. 2010, 38, 25–41. [Google Scholar] [CrossRef]
  45. Nejat, P.; Jomehzadeh, F.; Taheri, M.M.; Gohari, M.; Majid, M.Z.A. A global review of energy consumption, CO2 emissions and policy in the residential sector (with an overview of the top ten CO2 emitting countries. Renew. Sustain. Energy Rev. 2015, 43, 843–862. [Google Scholar] [CrossRef]
  46. Chitnis, M.; Sorrell, S.; Druckman, A.; Firth, S.K.; Jackson, T. Turning lights into flights: Estimating direct and indirect rebound effects for UK households. Energy Policy 2013, 55, 234–250. [Google Scholar] [CrossRef]
  47. Streimikiene, D.; Volochovic, A. The impact of household behavioral changes on GHG emission reduction in Lithuania. Renew. Sustain. Energy Rev. 2011, 5, 4118–4124. [Google Scholar] [CrossRef]
  48. Kadian, R.; Dahiya, R.P.; Garg, H.P. Energy-related emissions and mitigation opportunities from the household sector in Delhi. Energy Policy 2007, 35, 6195–6211. [Google Scholar] [CrossRef]
  49. Yan, Y.; Pan, A.; Wu, C.; Gui, S. Factors influencing indirect carbon emission of residential consumption in China: A case of Liaoning province. Sustainability 2019, 11, 4414. [Google Scholar] [CrossRef] [Green Version]
  50. Liu, L.; Wu, G.; Wang, J.; Wei, Y. China’s carbon emissions from urban and rural households during 1992–2007. J. Clean Prod. 2011, 19, 1754–1762. [Google Scholar] [CrossRef]
  51. Bin, S.; Dowlatabadi, H. Consumer lifestyle approach to US energy use and the related CO2 emissions. Energy Policy 2005, 33, 197–208. [Google Scholar] [CrossRef]
  52. Hirano, Y.; Ihara, T.; Hara, M.; Honjo, K. Estimation of direct and indirect household CO2 emissions in 49 Japanese cities with consideration of regional conditions. Sustainability 2020, 12, 4678. [Google Scholar] [CrossRef]
  53. Yin, L.; Liang, D.; Yoshikuni, Y.; Zhaoling, L. Evaluation of energy-related household carbon footprints in metropolitan areas of Japan. J. Ecol. Model. 2018, 377, 16–25. [Google Scholar] [CrossRef]
  54. Fan, J.; Guo, X.; Marinova, D.; Wu, Y.; Zhao, D. Embedded carbon footprint of Chinese urban households: Structure and changes. J. Clean Prod. 2012, 33, 50–59. [Google Scholar] [CrossRef]
  55. Lina, L.; Jiansheng, Q.; Zhiqiang, Z.; Jingjing, Z.; Jinping, W.; Liping, D.; Huijuan, P.; Qin, L. Assessment and determinantsof per capita household CO2 emissions (PHCEs) based on capital city level in China. J. Geogr. Sci. 2018, 28, 1467–1484. [Google Scholar] [CrossRef]
  56. Duarte, R.; Mainar, A.; Sánchez-Chóliz, J. The impact of household consumption patterns on emissions in Spain. Energy Econ. 2010, 32, 176–185. [Google Scholar] [CrossRef]
  57. Weber, C.L.; Matthews, H.S. Quantifying the global and distributional aspects of American household carbon footprint. Ecol. Econ. 2008, 66, 379–391. [Google Scholar] [CrossRef]
  58. Lyons, S.; Pentecost, A.; Tol, R.S.J. Socioeconomic distribution of emissions and resource use in Ireland. J. Environ. Manag. 2012, 112, 186–198. [Google Scholar] [CrossRef]
  59. Wier, M.; Lenzen, M.; Munksgaard, J.; Smed, S. Effects of household consumption patterns on CO2 requirements. Econ. Syst. Res. Inf. 2001, 13, 259–274. [Google Scholar] [CrossRef]
  60. Munksgaard, J.; Pedersen, K.A.; Wien, M. Impact of household consumption on CO2 emissions. Energy Econ. 2000, 22, 423–440. [Google Scholar] [CrossRef]
  61. Jin, X.; Li, Y.; Sun, D.; Zhang, J.; Zheng, J. Factors controlling urban and rural indirect carbon dioxide emissions in household consumption: A case study in Beijing. Sustainability 2019, 11, 6563. [Google Scholar] [CrossRef]
  62. Li, Y.; Zhao, R.; Liu, T.; Zhao, J. Does urbanization lead to more direct and indirect household carbon dioxide emissions? Evidence from China during 1996-2012. J. Clean Prod. 2015, 102, 103–114. [Google Scholar] [CrossRef]
  63. Feng, Z.; Zou, L.; Wei, Y. The impact of household consumption on energy use and CO2 emissions in China. Energy 2011, 36, 656–670. [Google Scholar] [CrossRef]
  64. Wei, Y.; Liu, L.; Fan, Y.; Wu, G. The impact of lifestyle on energy use and CO2 emission: An empirical analysis of China’s residents. Energy Policy 2007, 35, 247–257. [Google Scholar] [CrossRef]
  65. Huang, R.; Zhang, S.; Liu, C. Comparing urban and rural household CO2 emissions-Case from China’s four megacities: Beijing, Tianjin, Shanghai, and Chongqing. Energies 2018, 11, 1257. [Google Scholar] [CrossRef]
  66. Peters, G.P.; Weber, C.L.; Guan, D.; Klaus, H. China’s growing CO2 emissions—A race between increasing consumption and efficiency gains. Environ. Sci. Technol. 2007, 41, 5939–5944. [Google Scholar] [CrossRef]
  67. Ali, K.A.; Ahmad, M.I.; Yusup, Y. Issues, impacts, and mitigations of carbon dioxide emissions in the building sector. Sustainability 2020, 12, 7427. [Google Scholar] [CrossRef]
  68. Adams, M.; Burrows, V.; Richardson, S.; Drinkwater, J.; Gamboa, C.; Collin, C.; Den, X.L.; Riemann, L.O.; Porteron, S.; Secher, A.Q. Bringing Embodied Carbon Upfront. Coordinated Action for the Building and Construction Sector to Tackle Embodied Carbon; Green Building Council: London, UK, 2019. [Google Scholar]
  69. Sandberg, N.H.; Bergsdal, H.; Bratteno, H. Historical energy analysis of the Norwegian dwelling stock. Build. Res. Inf. 2011, 39, 1–15. [Google Scholar] [CrossRef]
  70. Sandberg, N.H.; Bratteno, H. Analysis of energy and carbon flows in the future Norwegian dwelling stock. Build. Res. Inf. 2012, 40, 123–139. [Google Scholar] [CrossRef]
  71. Gangolells, M.; Casals, M.; Macarulla, M.; Forcada, N. Exploring the potential of a gamified approach to reduce energy use and carbon emissions in the household sector. Sustainability 2021, 13, 3380. [Google Scholar] [CrossRef]
  72. Zarco-Periñán, P.J.; Zarco-Soto, I.M.; Zarco-Soto, F.J. Influence of population density on CO2 emissions eliminating the influence of climate. Atmosphere 2021, 12, 1193. [Google Scholar] [CrossRef]
  73. Zarco-Soto, F.J.; Zarco-Soto, I.M.; Zarco-Periñán, P.J. Influence of population income and climate on air pollution in cities due to buildings: The case of Spain. Atmosphere 2021, 12, 1051. [Google Scholar] [CrossRef]
  74. Zarco-Soto, I.M.; Zarco-Soto, F.J.; Zaro-Periñán, P.J. Influence of population in come on energy consumption and CO2 emissions in buildings of cities. Sustainability 2021, 13, 10230. [Google Scholar] [CrossRef]
  75. Zarco-Periñán, P.J.; Zarco-Soto, I.M.; Zarco-Soto, F.J.; Sánchez-Durán, R. Influence of population income on energy consumption for heating and its CO2 emissions in cities. Energies 2021, 14, 4531. [Google Scholar] [CrossRef]
  76. Zarco-Soto, I.M.; Zarco-Periñán, P.J.; Sánchez-Durán, R. Influence of cities population size on their energy consumption and CO2 emissions: The case of Spain. Environ. Sci. Pollut. Res. 2021, 28, 28146–28167. [Google Scholar] [CrossRef]
  77. Zarco-Soto, I.M.; Zarco-Periñán, P.J.; Sánchez-Durán, R. Influence of climate on energy consumption and CO2 emissions: The case of Spain. Environ. Sci. Pollut. Res. 2020, 27, 15645–15662. [Google Scholar] [CrossRef]
  78. Isaac, M.; Vuuren, D.P. Modeling global residential sector energy demand for heating and air conditioning in the context of climate change. Energy Policy 2009, 37, 507–521. [Google Scholar] [CrossRef]
  79. Tian, C.; Feng, G.; Li, S.; Xu, F. Scenario analysis on energy consumption and CO2 emissions reduction potential in building heating sector at community level. Sustainability 2019, 11, 5392. [Google Scholar] [CrossRef]
  80. Zhao, S.; Song, Q.; Duan, H.; Wen, Z.; Wang, C. Uncovering the lifecycle GHG emissions and its reduction opportunities from the urban buildings: A case study of Macau. Resour. Conserv. Recycl. 2019, 147, 214–226. [Google Scholar] [CrossRef]
  81. Geng, Y.; Chen, W.; Liu, Z.; Chiu, A.S.F.; Han, W.; Liu, Z.; Zhong, S.; Qian, Y.; You, W.; Cui, X. A bibliometric review: Energy consumption and greenhouse gas emissions in the residential sector. J. Clean Prod. 2017, 159, 301–316. [Google Scholar] [CrossRef]
  82. Liu, L.; Qu, J.; Maraseni, T.N.; Niu, Y.; Zeng, J.; Zhang, L.; Xu, L. Household CO2 emissions Current status and future perspectives. Int. J. Environ. Res. Public Health 2020, 17, 7077. [Google Scholar] [CrossRef] [PubMed]
  83. Zhang, X.; Luo, L.; Skitmore, M. Household carbon emission research: An analytical review of measurement, influencing factors and mitigation prospects. J. Clean Prod. 2015, 103, 873–883. [Google Scholar] [CrossRef] [Green Version]
Figure 1. Grouping of research papers according to publications.
Energies 15 06635 g001
Table 1. Classification of papers.
GroupPaper
Airport facilities[10]
University centers[11]
Hotel facilities[12,13,14,15,16,17]
Public buildings[18]
Residential buildings
Rural[20,21,22]
Urban[23,24,25,26,27,28,29,30,31,32,33]
Rural and urban[34,35,36,37,38,39,40,41,42,43,44,45,46,47,48]
Direct and indirect emissions[49,50,51,52,53,54,55,56,57,58,59,60,61,62,63,64,65,66]
Construction sector[67]
Life cycle[69,70]
Emissions simulation[71]
Residential and commercial buildings[72,73,74,75,76,77,78,79,80]
Reviews[81,82,83]
Table 2. Papers that reference factors that most influence the production of emissions.
GroupPaper
Air conditioning[10,13,16,18,33,42,43,45,47,67,78,80]
Heating[10,13,16,22,33,43,44,45,47,49,65,67,78,80]
Ventilation[10,13,22,45,47,67]
Illumination[10,16,18,33,44,47,49,65,67]
Home appliances[43,44,47,49,66]
Power motors[10,15]
Table 3. Papers that point out measures that reduce emissions.
GroupPaper
Wall insulation[12,15,18,44,45,67,71]
Substitutions of windows[12,15,18,33,45,71,79]
Efficiency improvements in lighting[12,14,15,18,44,67,71]
Efficient electrical appliances[15,43,44,45,47,48,71]
Installation of condensing boilers[12,15,33,44,45,67,79]
Installation of heat pumps[12,14,45,48,79]
Installation of efficient motors[14,15,48]
Water heating using solar thermal collectors[14,15,45,48,67,79]
Publisher’s Note: MDPI stays neutral with regard to jurisdictional claims in published maps and institutional affiliations.

