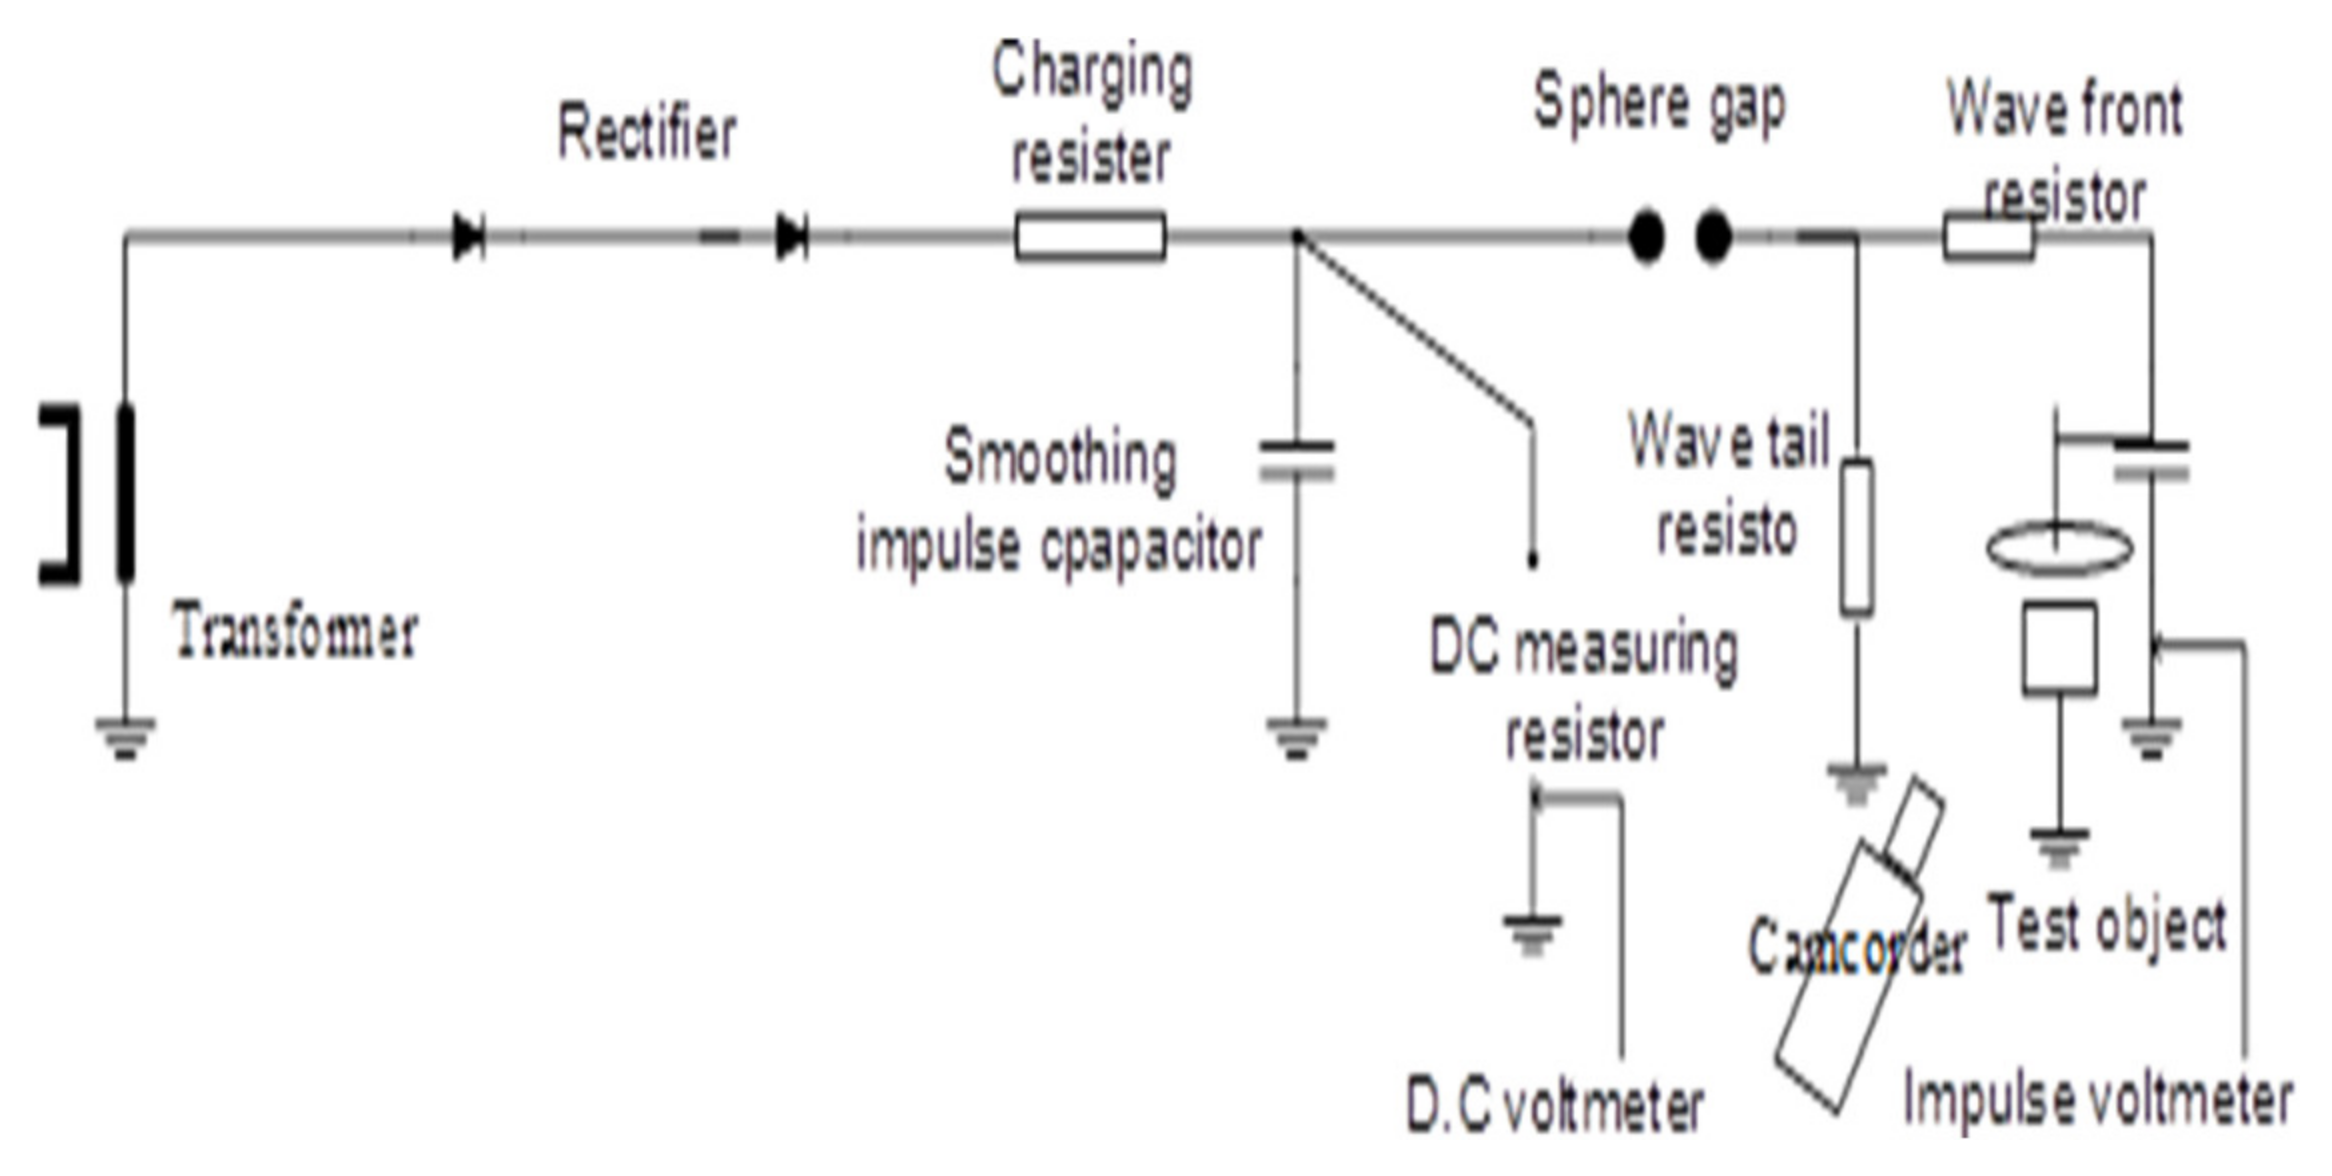
Article

An Experimental Study of Electromagnetic Field Propagation Due to Lightning Upward Leaders and Its Probability on Different Small-Scale Structures

by
Irshad Ullah
1,*,
Mohd Nor Ramdon Bin Bahrom
2,
Muhammad Adeel Khan
1 and
Azhar Qazi
1
1
Department of Electrical Engineering, CECOS University, Peshawar 25000, Pakistan
2
Department of Electrical Power Engineering, University Tun Hussein Onn of Malaysia, Batu Pahat 86400, Malaysia
*
Author to whom correspondence should be addressed.
Energies 2022, 15(18), 6597; https://doi.org/10.3390/en15186597
Submission received: 29 March 2022 / Revised: 27 June 2022 / Accepted: 28 June 2022 / Published: 9 September 2022
(This article belongs to the Topic New Perspectives on Lighting)

Abstract

:
In this paper, upward leader initiation and the probability of lightning flashes on different air terminal were analyzed in detail. With the growing global warming, lightning flash density has increased abruptly, especially in tropical countries. Upward leaders are the critical elements to be considered for defining comprehensive protective measures against lightning during thunderstorms. This article presents the lightning flashover phenomenon on scaled buildings with installed lightning rods. Moreover, the electric field and initialization of upward leaders from Lightning Air Terminals (LATs) were analyzed in detail using Ansys Maxwell as a simulation tool. For the experimental work, a high-voltage impulse generator was used. The air gap between the lightning rods and the top electrode was kept constant in all scaled structures. The purpose of using an identical air gap was to study the upward leader and its electric field for all structures. The effects of the upward leaders on the electric field plots are explained in detail and allowed the determination of the electric field’s intensity around each air terminal for the provided air gap between the tip of the rod and the top electrode. A low-cost lightning protection system was taken into account, as the economic crisis is worsening with time. A Franklin rod was used as the primary protection device for the initiation of the upward streamer. The experimental results were obtained in Malaysian weather conditions based on standard values of temperature and pressure. The study presented in this article shows that based on the experimental work, field plots were obtained for both the air insulation scenario and the condition when the upward leader was incepted. The simulation results showed a firm agreement with the measured values. Similarly, by upward leader inception, the strikes could be predicted accurately on every installed air terminal.

1. Introduction

It is not easy to accurately recognize lightning origination and its direct effects because they are always hidden in clouds having lightning stroke. Thus, various researchers have worked extremely hard to understand the direct lightning effects, electric field and initialization of upward leaders [1]. Although continuous efforts are taking place to know more about the process of lightning reaching grounded structures, still this process is only partly understood [2]. Franklin and his colleagues brought the first breakthrough about the lightning concept, showing that lightning is static electricity and moves form clouds to ground with electrostatic charges [3]. Many researchers studied the same phenomena of charges developed by the subsequent leaders and streamers produced by lightning flashes. Geometry of lightning rods, electric field propagation and streamer potential were also studied in detail. A lightning protection system works on the principle that a lightning stroke can hit anything on earth while traveling form the clouds toward ground structures. When lightning hits anything on the ground, it may affect them with its direct or indirect effect in the form of induced effect. Thus, to protect all grounded objects, Lightning Protection Systems (LPS) have been designed [4,5,6,7,8,9,10].
Lightning has four common types, e.g., (1) Cloud to Cloud, (2) Cloud to Air, (3) Intra Cloud, and (4) Cloud to Ground. Among them, Cloud to Ground lightning reaches the ground with the charged with negative charges. Since the ground provides positive charges, a very bright luminosity takes place, known as the real lightning stroke that is further divided into positive and negative lightning [11,12]. The lightning flash, initiating in Cloud to Ground lightning, consists of one or more strokes or subsequent leaders including the return stroke [13,14].

2. Upward Leader Initiation

Due to climate changes, building protection has become a vital issue to be addressed by researcher according to new technological approaches, based, e.g., on lightning mechanism, lightning detection systems and the development of lightning leaders. The Franklin rod is an element of great attention in LPS. It is installed on a geometrical structure provided with earth wire and a ground electrode. The Franklin rod receives the lightning flashes directly or indirectly by induced effect and it discharges them to the ground so the building is safe [15,16,17].
The upward leader initiation takes place in reverse direction, as it travels form the ground level upwards to the approaching flashes. A study about the upward leaders concept was published, and the upward leader propagation from the ground to upcoming leaders has been discussed in [18,19]. The nature of electric field changes is related to negative atmospheric lightning and to spreading of the lightning leader in reverse direction, i.e., from the ground to the atmosphere. Furthermore, lightning upward leaders for tall structures have been analytically modeled in [20] in five different models. The upward leaders have been initiated, and it was found that structures more than 168 m tall are less model-dependent; an electric filed has been produced in all models by the upward leaders.

2.1. Lightning Rods and Building Structures

As the technology develops and building protection becomes smarter, the buildings’ traditional protection systems change. To ensure safety, the position of the air terminal is the most significant [21].

2.2. Lightning Strike Probability

The ability of lightning rods to receive lightning flashes has been discussed for a very long time. It has been proved that blunt rods are more effective in receiving lightning flashes. Moreover, sharp rods produce a corona around them, reducing their lightning receiving ability [22,23]. Monte Carlo techniques have proven that the probability of lightning striking is higher at the corners and the edges [24]. During lightning rod installation, lightning rods, smaller in size at the corners, have more probability of lightning attraction than bigger rods installed in the center of a building [25,26,27].

3. Methodology of the Proposed Work

The overall experimental work was carried out based on the number of lightning flashes in two consecutive years, considering that in tropical regions, the number of strikes in a single year is 15 strikes per square kilometer. The experimental work was conducted using a high-voltage and low-current impulse generator. An air gap of 3 cm was maintained between the top electrode and the LATs. It was identical for all shapes, while the height of the LATs was 1 cm, with a proportion of 1:10 with respect to the height of the structure. The schematic diagram of the high-voltage and low-current generator is presented in Figure 1.
Similarly, the ANSYS/MAXWELL was used as a simulation tool for the upward leader inception in pre-breakdown scenarios. The simulation of upward leader inception was performed based on the number of strikes on every air terminal during the H.V. laboratory’s experimental work.
The building structures used for experiments and simulation were scaled down and were tested in Malaysian ambient weather conditions. The Lightning Air Terminals (LATs) were installed on selected shapes according to American standard NFPA 780 [15]. Scaling of the building structures was performed according to [28,29,30,31]. The equation used to scale different geometrical structures is
MeasureScale   Mi = Mp   prototype Mm   Modeltype
Note that Mp is the characteristic height in the real-world prototype, and MM is the corresponding height in the model. If the scale factor is 1:30, from the given Equation (1), the height of a single-story building is 10 cm.
During the experimental work, the top electrode represented the cloud, while every shape was triggered with 30 flashes representing the number of strikes in two consecutive years. This means that in tropical areas, e.g., Malaysia, Indonesia and Singapore, the lightning flash density per year, per square kilometer of area is 15. The air gap between the top electrode and the tip of the rod was 3 cm, for 3 m.
Similarly, the height of the lightning rod was kept at 1 cm throughout the experiments. The environmental conditions were average STP conditions. In the experimental work, for an impulse voltage of 86.5 kV, the average parameters of the weather conditions were such that temperature was selected as 30.70 °C, pressure was 1.025 Pa, and humidity level was 70.7%.

4. Results

This section presents the experimental and simulation results related to lightning flash distribution, electric field simulation, and upward leader inception based on electric field plots. During the indoor experimental process in the High-Voltage (H.V.) laboratory, different scaled models were tested, having different rooftops and a different number of installed Lightning Air Terminals (LATs). Similarly, for the simulation process for the given specifications (100 kV) of the H.V. impulse generator, a short air gap and the same atmospheric condition were selected [32].
I = I 0 e a d 1 γ e a d 1  
Equation (2) represents the initial current development before a breakdown occurs. When the voltage grows further, α and γ also increase and become equal to 1, therefore, I become infinity at the breakdown point. Hence, (2) becomes
I γ e a d 1 = 0  
I = γ e a d 1  
As the electric field is the ratio between voltage and gap distance [32]:
E = V d
Similarly, α and γ are the electric field’s functions and the pressure of gas P. Therefore
α = F 1 E p
γ = F 2 E D
Keeping in consideration this, (4) becomes
F 2 E p [   exp ( p d F 1 ,     V p d ) 1 = 1 F 2 v p d [   exp ( p d F 1 ,     V p d ) 1 = 1
Equation (8) indicates the breakdown in terms of air gap d and pressure p and it is implemented for a short air gap when the E field is maximum. Since Paschen’s law considers a short air gap breakdown, a short air gap was considered to calculate the strikes on different air terminals. Similarly, to calculate the lightning strikes on any air terminal, the highest number of strikes during the experimental process was considered as a reference point of lightning strikes. Therefore, the risk assessment for any system was considered, which could be calculated by [33,34]
Risk   Assessment = L × S  
where L = Likelihood, which is equal to probability, and S = Severity. By replacing risk assessment with strike prediction and severity with number of strikes on any installed air terminal, (9) becomes
Strike prediction = Likelihood × Number of strikes on Tn
Likelihood = (Electric Field on Tn)/(Maximum Electric Field)
Strike prediction = (Electric Field on Tn)/(Maximum Electric Field) × Number of strikes on Tn.
Similarly, the electric field was calculated using the equation.
The electric field on Tn is the electric field value on any air terminal, and Emax is the maximum value of the electric field among all measured values. Tn represents any air terminal. When the likelihood of lightning strikes was calculated, the electric field’s highest value was taken as the standard value obtained from the electric field by the inception of upward leaders. Based on the electric field value obtained by introducing an upward leader for the pre-breakdown condition and the electric field when the condition was similar to the air insulation breakdown, the likelihood of lightning strikes for all the installed air terminals was calculated.
Similarly, the electric field was calculated using the equation [35]:
E = V / d  
where E represents the electric field, V is the applied voltage, and “d” is the air gap between the top electrode and the tested model.
For the electric field, the tips of the rods were selected; therefore, a homogenous field was considered, as the edges were not directly struck by lightning flashes furthermore. We used the equation to calculate the electric field for the given air gap of 3 cm. However, the field distribution was different on different air terminals, because the charge distribution was different on different air terminals.
In the experimental as well simulation set up, the upward leader initiation and electric field due to these leaders were analyzed in detail, as shown Figure 2 and Figure 3.
In Figure 2, the distribution of positive and negative charges and their propagation towards ground structures were elaborated. It can be seen how the negative and positive charges at the top of the structures attracted each other. Similarly, in Figure 2 and Figure 3, the reception of lightning on the tip of the rods is presented. In Figure 3c, it can be clearly seen that an upward leader was also initiated when the lightning flashes were attracted by grounded objects. The field during upward leader initiation can be homogenous as well as non-homogenous. Similarly, in Figure 2d, the positive and negative charges for a homogenous field are shown. The field in a real scenario can also be non-homogenous. For The scenario here presented was chosen to show how the upward leaders are initiated.

4.1. Upward Leader Inception and Probability of Lightning Strikes on Gable-Shape Building

During the experiment, all tested objects received 30 flashes using a high-voltage impulse generator. A scaled model of the gable shape was equipped with three LATs, and the same number of flashes was applied. During the experimental process, the lightning flashes produced a particular lightning pattern on different air terminals. The number of strikes on every LAT was counted. The number of strikes on LAT1 was 14, on LAT2, the strikes were 2, and on LAT3, the strikes were 13. The lightning flashes distribution on a gable shape is shown in Figure 4. Figure 4a shows the strikes on LAT1, while Figure 4b,c indicates the strike distribution on LAT2 and LAT3, respectively.
T represents the LAT installed on different geometrical shapes; the strike distribution generated an electric field on the installed air terminal. Thus, the electric field was simulated by considering the LAT as conducting material, and the upward leader inception by considering the LAT as a semiconductor material in the pre-breakdown condition. The simulation was performed for both scenarios based on the number of strikes on the LATs. Figure 5 shows the electric field generated in the case of normal conduction through the LAT and upward leader inception.
The effect of electric field on the LATs of the gable shape was observed and it was found that with upward leader inception, the electric field intensity increased. The value of the electric field in different points is shown in Figure 6.
Based on the results obtained Figure 5 and Figure 6 the electric field value and the number of strikes on every LAT are reported in Table 1.

Probability of Lightning Strikes on a Gable-Shape Building

To calculate the likelihood of a lightning strike on every LAT, a short air gap was considered based on Paschen’s law to calculate the short air gap’s pre-breakdown electric field. Based on the electric field value on every LAT, the likelihood of lightning strikes was calculated using Equation (10), as shown in Table 2. Table 2 shows that when the upward leaders were applied, the likelihood of lightning strikes on every air terminal increased, reaching a value comparable with the measured values.

4.2. Upward Leader Inception and Probability of Lightning Strikes on an L-Shape Building

Some building structures have an L shape. Thus, an L-shape building was considered and scaled down, with LATs installed on the corners. The triggered flashes during the measured process inside the laboratory produced a pattern. According to the pattern, LAT1 received 9 strikes, LAT2 received 11 strikes, and LAT3 captured 10 strikes. The lightning flashes on the different LATs of the L-shape geometrical structure are shown in Figure 7.
The triggered flashes on the L-shape building generated an electric field on the struck LATs. Moreover, the electric field on every LAT was simulated in normal pre-breakdown conditions and the upward leader inception by applying the LAT tip’s semiconductor material. The simulation for both scenarios is shown in Figure 8 and Figure 9, indicates that the value of the simulated electric field did not increase during the normal pre-breakdown conditions. However, by applying the upward leader inception, the electric field value increased. The field plot on all points in both scenarios is shown in Figure 9.
Figure 9 illustrates that the electric field was distributed on all installed air terminals. The electric field value was higher on the rods’ tip; moving away from the rods’ tip, the intensity decreased. The electric field value and the number of strikes on every LAT shown in Figure 9 are reported in Table 3.

Probability of Lightning Strikes on an L-Shape Geometrical Structure

Considering the electric field values on every LAT of the L-shape structure shown in Table 3 and using Equation (10), the probability of lightning strikes can be calculated. The values are shown in Table 4.
Table 4 suggests that by applying the upward leader’s inception condition, the likelihood of lightning strikes improved. These improved results show a firm agreement with the value of the probability of lightning strikes measured during the testing process.

4.3. Upward Leader Inception and Probability of Lightning Strikes on a Square-Shape Building

Square-shape building structures with a flat rooftop can be found anywhere globally; therefore, for square-shape flat roofs, the upward leader’s inception and the likelihood of lightning strikes were determined. The square shape was provided four LATs on each corner, and the same number of triggered flashes was applied as for the previous shapes. The distributed lightning flashes pattern showed that LAT1 captured 10 flashes, LAT2 received 8, and LAT3 and LAT4 received 7 and 5 flashes, respectively. The strike distribution obtained during the experimental process is shown in Figure 10.
The lightning flashover on every LAT of the square shape is evident in Figure 10. Due to the lightning flash, an electric field was generated and simulated on every air terminal. The field plot was simulated when all the LATs received many lightning flashes on every LAT, and the upward leaders were incepted. The field plot for both scenarios is presented in Figure 11. It can be seen that the electric field’s effect changed considerably at the inception of the upward leader. Furthermore, the value was high in this scenario. Under the normal pre-breakdown, the value on every point of the rooftop is shown in graphical form in Figure 12.
The field plot on every point is shown in Figure 12. It is clear that with upward leader inception, the field intensity was higher on every point of the rooftop. Similarly, when the LAT captured the lightning flash, the intensity was higher at the tip and lower at the far end. Considering Figure 12, the electric field’s values on every air terminal following several strikes are reported in Table 5.

Probability of Lightning Strikes on a Square Shape

The likelihood of lightning strikes on every air terminal can be calculated using Equation (10). The likelihood of lightning strikes is shown in Table 6. The table shows that with the upward leader inception, the number of predicted strikes was in close agreement with the measured values, and thus the upward leader inception improved the strike prediction.

4.4. Upward Leader Inception and Likelihood of Lightning Strikes on a Cylindrical Building

The cylindrical shape is also a standard shape used for water tanks, atomic plants, oil refineries, and many other geometrical structures. A cylindrical model was scaled to analyze the electric field intensity based on the field plot, and the upward leader was incepted to improve the likelihood of lightning strikes on different points of the cylindrical shape. The number of lightning strikes during the experimental work was eight on LAT1 and seven on LAT2. Similarly, LAT3 received nine strikes, and LAT4 captured six strikes. The flashover breakdown on every LAT of the given shape is shown in Figue14.
Figure 13 presents the strike distribution on every LAT of the cylindrical shape. These strikes produced an electric field on every air terminal. The electric field on every air terminal was simulated based on the number of strikes on each given LAT. The electric field was simulated when the pre-breakdown condition occurred in the standard conducting material. Similarly, when the upward leaders were incepted, the semiconductor material was considered at the tip of the LATs in each shape. The simulation of both scenarios is presented in Figure 14.
Figure 15 shows the electric field values on different points of a cylindrical shape in the x-axis and y-axis. From the figure, it is clear that by the inception of the upward leaders, the electric field plot values increased; these values were used to calculate the likelihood of lightning strikes. Based on Figure 15, the electric field intensity on every LAT is shown in Table 7.

Probability of Lightning Strikes on a Cylindrical Shape

Based on the field plot on every air terminal, the probability of lightning strikes was calculated using Equation (10). Using this Equation, it is clear that the determination of the probability lightning strikes could be improved by introducing the upward leader concept. The improvement in the likelihood of lightning strikes indicates that the measured values of lightning strikes on every LAT during the indoor testing process in the High-Voltage Laboratory were in firm agreement with the calculated values of lightning strikes with upward leader inception. Therefore, it can predict the number of strikes on any LAT installed on any geometrical shape could be predicted as shown in Table 8.

4.5. Upward Leader Inception and Probability of Lightning Strikes on a Pyramid-Shape Building

Building structures with pyramid rooftops can be seen anywhere in the world. High-rise buildings and buildings with low height, e.g., residential houses and the bus stops, are also provided with pyramid-shape rooftops. Considering high and low building heights, the pyramid shape was scaled down, and strike distribution was observed. The mentioned geometrical shape was provided with five LATs on every corner. LAT1 was in the middle and higher position. Therefore, by applying the triggered flashes, all flashes were attracted by LAT1. The strikes on the pyramid shape are shown in Figure 14.
Figure 16 shows that LAT1 captured all 30 triggered flashes. Similarly, as the remaining LATs were lower in height than LAT1, they did not receive any flash. Based on the number of strikes received by LAT1, the electric field effect was simulated on LAT1. The electric field plot on LAT1 is shown in Figure 15. It appeared that the electric field was concentrated on LAT1 following the flashes captured by LAT1 on the pyramid-shape structure.
From Figure 17, it can be seen that by introducing the upward leaders inception, the electric field intensity increased. The electric field value at every point of the pyramid shape is shown in Figure 18.
The electric field values with and without upward leader inception are shown in Table 9.

Probability of Lightning Strike on a Pyramid Shape

The likelihood of a lightning strike on a pyramid shape and the electric field values were calculated considering the presence and absence of the upward leaders. The likelihood of a lightning is shown in Table 10 and was calculated using Equation (10).
Table 10 indicates that by introducing the upward leaders, the likelihood of lightning strikes increased, and was in close agreement with the measured experimental values.

5. Discussion

Building structures are commonly vulnerable to lightning flashes. When a lightning flash takes place on a LAT or the building structure’s surface, it generates an electric field in the surroundings. This electric field, as a result, can affect the building structure and its electronics equipment and can cause human injuries and causalities. Thus, it is essential to study the electromagnetic radiation due to lightning. It is very important to analyze electric field upward leader initiation due to lightning. Therefore, in this article, scaled building structures were used to observe lightning strike patterns using a simulation approach. The models tested during indoor allowed determining the electric field intensity with and without upward leader inception. The selection of the scaled models was based on standard building structures commonly used in different parts of the world
LAT installation was different in the various models, as the number of LATs varies with the building structures’ geometry. The pattern of lightning strikes on different LATs was obtained, and the electric field was simulated accordingly to the number of strikes on the air terminals. It means that for the LAT which received the highest number of strikes, the electric field was higher, and the electric field was lower for the minimum number of strikes. We introduced a minor increase in the height of the tip of the rod. Similarly, for upward leader inception, the rod’s tip was elongated, and its material was a semiconductor material. By applying a semiconductor, a pre-breakdown condition was simulated. Thus, upward leader inception can improve and modify the likelihood of lightning strikes on the LATs on different geometrical shapes.

6. Conclusions

In this paper, the upward leader initiation along and related electric field were analyzed in detail. The work was carried out based on experiments and simulations. It was found that due to the upward leaders, the electric filed propagation became more intense and its probability increased. The building structures were scaled down using analytical equations. In order to perform the laboratory work and using simulation, a lightning flash density of 30 flashes was selected. This number corresponds to the lightning flashes density per square kilometer per year. The mentioned number of flashes was tested in all selected building structures. The chosen pattern of lightning strike was that of two convective years in a tropical area. As lightning is an uncertain natural phenomenon, using the simulation tool, the lightning strikes were simulated to obtain the electric field of the upward leader on every LAT and study its probability and propagation. The upward leader was considered the pre-breakdown scenario, and therefore one of LAT was elongated, and a semiconductor material was assigned to the tip of the rod. This inception resulted in a higher electric field intensity on the tip of the rod. With the upward leader, the highest value of the electric field was been considered the standard value, and the obtained values of the electric field were used as normalized data. The normalized data were found to be in good agreement with the values measured in the laboratory. Thus, the upward leader inception can improve the probability of lightning strikes on every air terminal. Considering the field plot when the upward leader is incepted, the prediction of the number of strikes on any building structure can be improved. Our work can contribute to improving strike prediction.

Author Contributions

Conceptualization, I.U.; Data curation, I.U.; Funding acquisition, M.N.R.B.B.; Investigation, I.U.; Methodology, I.U.; Supervision, M.N.R.B.B.; Validation, A.Q.; Writing—original draft, M.A.K.; Writing—review & editing, M.A.K. All authors have read and agreed to the published version of the manuscript.

Funding

The research worked carried out in this article is supported by FRGS Grant University Tun Hussein Onn Malaysia under Vote number K367.

Institutional Review Board Statement

Not applicable.

Informed Consent Statement

Not applicable.

Data Availability Statement

Not applicable.

Acknowledgments

This work was sponsored by the grant FRGS of University Tun Hussein Onn Malaysia. The authors are really thankful for the support provided by the High-Voltage Lab of University Tun Hussein Onn Malaysia.

Conflicts of Interest

The authors declare no conflict of interest.

References

  1. Lyu, F.; Cummer, S.A.; Qin, Z.; Chen, M. Lightning Initiation Processes Imaged with Very High Frequency Broadband Interferometry. Adv. Earth Space Sci. 2019, 124, 2994–3006. [Google Scholar] [CrossRef]
  2. Kostinskiy, A.Y.; Marshall, T.C.; Stolzenburg, M. Stolzenburg, The Mechanism of the Origin and Development of Lightning from Initiating Event to Initial Breakdown Pulses. JGR Atmos. 2020, 125, 1–13. [Google Scholar]
  3. D’alessandro, F.; Gumley, J. A Collection Volume Method for the Placement of Air Terminals for the Protection of Structures against Lightning. J. Electrost. 2001, 50, 279–302. [Google Scholar] [CrossRef]
  4. Shostak, V.; Petrenko, T.; Janischewskyj, W.; Rachidi, F. Electric Field within Lightning Protection Volume in Presence of a Descending Leader. Electr. Power Syst. Res. 2012, 85, 82–89. [Google Scholar] [CrossRef]
  5. Bazelyan, E.M.; Raizer, Y.P. Lightning Physics and Lightning Protection; Taylor & Francis, Inc.: Abingdon, UK, 2000. [Google Scholar]
  6. Mazur, V.; Ruhnke, H. Determining the Striking Distance of Lightning through Its Relationship to Leader Potential. J. Geophys. Res. 2003, 108, 4409. [Google Scholar] [CrossRef]
  7. Kumar, U.; Bokka, P.K.; Padhi, J. A Macroscopic Inception Criterion for the Upward Leaders of Natural Lightning. IEEE Trans. PWRD 2005, 20, 904–911. [Google Scholar] [CrossRef]
  8. Cooray, V.; Rakov, V.; Theethayi, N. The Lightning Striking Distance—Revisited. J. Electrost. 2007, 65, 296–306. [Google Scholar] [CrossRef]
  9. Petrov, N.; Waters, R. Determination of The Striking Distance of Lightning to Earthed Structures. Proc. R. Soc. London. Ser. A Math. Phys. Sci. 1995, 450, 589–601. [Google Scholar]
  10. D’Alessandro, F. The Use of Field Intensification Factors in Calculations for Lightning Protection of Structures. J. Electrost. 2003, 58, 17–43. [Google Scholar] [CrossRef]
  11. Szczerbieski, M. A Discussion of Faraday Cage Lightning Protection and Application to Real Building Structures. J. Electrost. 2000, 48, 145–154. [Google Scholar] [CrossRef]
  12. Krider, E.P. Benjamin Franklin and the First Lightning Conductors. Hist. Meteorol. 2004, 1, 1–13. [Google Scholar]
  13. Lee, R.H. Lightning Protection of Buildings. IEEE Trans. Ind. Appl. 1979, 3, 236–240. [Google Scholar] [CrossRef]
  14. Turns, B.F. Benjamin Franklin and lightning Rods. Phys. Today 2006, 59, 42. [Google Scholar]
  15. Krider, E.P.; Uman, M.A. Lightning Protection and Test Standards. In Wiley Encyclopedia of Electrical and Electronics Engineering; PTSG: Castleford, UK, 2001. [Google Scholar]
  16. Mousa, A.M. The Applicability of Lightning Elimination Devices to Substations and Power Lines. IEEE Trans. Power Deliv. 1998, 13, 1120–1127. [Google Scholar] [CrossRef] [Green Version]
  17. Zipse, D.W. Lightning Protection Systems: Advantages and Disadvantages. IEEE Trans. Ind. Appl. 1994, 30, 1351–1361. [Google Scholar] [CrossRef]
  18. Baharin, S.A.S.; Ahmad, M.R. Electric Field Waveforms of Very Close Negative Cloud to Ground Flashes. J. Eng. Sci. 2020, 2, 115–120. [Google Scholar]
  19. Haziq, M.; Sabri, M.; Riduan, M.; Ahmad, M.; Villiams, H.; Lu, S.B.S.; Hani, E.C.V. Farah A Study of Cloud-To-Ground Lightning Flashes Initiated By Fast Positive Breakdown. Atmos. Res. 2022, 206, 106–119. [Google Scholar]
  20. Zipse, D. Lightning Protection Systems: An Update And A Discredited Method Vindicated. In Proceedings of the Industry Applications Society 46th Annual Petroleum and Chemical Technical Conference, San Diego, CA, USA, 13–15 September 1999; pp. 37–51. [Google Scholar]
  21. Zipse, D.W. Lightning Protection Methods: An Update and A Discredited System Vindicated. In Proceedings of the IEEE Industrial and Commercial Power Systems Technical Conference. Conference Record, Clearwater, FL, USA, 7–11 May 2000; pp. 155–170. [Google Scholar]
  22. Baharudin, Z.A.; Ahmad, N.A.; Fernando, J.M.; Cooray, V. Negative Cloud-To-Ground Lightning Flashes in Malaysia. J. Atmos. Sol.-Terr. Phys. 2014, 108, 61–67. [Google Scholar] [CrossRef]
  23. Baharudin, Z.A.; Ahmad, N.A.; Fernando, M.; Cooray, V.; Mkel, J. Comparative Study on Preliminary Breakdown Pulse Trains Observed in Johor, Malaysia and Florida, USA. Atmos. Res. 2012, 117, 111–121. [Google Scholar] [CrossRef]
  24. Hartono, Z.; Robiah, I. Conventional and Un-Conventional Lightning Air Terminals: An Overview. In Forum on Lightning Protection; Hilton Petaling Jaya: Selangor, Malaysia, 2004. [Google Scholar]
  25. Hartono, Z.; Robiah, I. Death at the Stadium: Report on the Fatal Use of an Early Streamer Emission Lightning Rod in Malaysia. In Proceedings of the 2006 4th Student Conference on Research and Development, Shah Alam, Malaysia, 27–28 June 2012. [Google Scholar]
  26. Abu, M.; Ahmad, H. An Overview of Lightning Air Terminal: Past, Present, and Future. In Proceedings of the Student Conference on Research and Development (SCOReD), Shah Alam, Malaysia, 27–28 June 2006; pp. 27–28. [Google Scholar]
  27. Belik, M. PV panels under lightning conditions. In Proceedings of the 2014 15th International Scientific Conference on Electric Power Engineering (EPE), Brno-Bystrc, Czech Republic, 12–14 May 2014; pp. 367–370. [Google Scholar]
  28. Fallah, N.; Gomes, C.; Kadir, M.Z.A.A.; Nourirad, G.; Baojahmadi, M. Lightning Protection Techniques for Roof-Top PV Systems. In Proceedings of the IEEE 7th International Power Engineering and Optimization Conference (PEOCO), Langkawi, Malaysia, 3–4 June 2013; pp. 417–421. [Google Scholar]
  29. Mikropoulos, P.N.; Tsovilis, T.E. Interception Probability and Shielding against Lightning. IEEE Trans. Power Deliv. 2009, 24, 863–873. [Google Scholar] [CrossRef]
  30. Alessandro, F.D. On the Optimum Rod Geometry for Practical Lightning Protection Systems. J. Electrost. 2007, 65, 113–121. [Google Scholar] [CrossRef]
  31. Ait-Amar, S.; Berger, G. A Model of Protection of Earthed Structures by Means of Lightning Rod Conductors. In Proceedings of the IEEE Russia Power Tec, St. Petersburg, Russia, 27–30 June 2005; pp. 1–6. [Google Scholar]
  32. Srivastava, A.; Mishra, M. Positioning Of Lightning Rods Using Monte Carlo Technique. J. Electrost. 2015, 76, 201–207. [Google Scholar] [CrossRef]
  33. Kern, A.; Schelthoff, C.; Mathieu, M. Probability of Lightning Strikes to Air-Terminations of Structures Using the Electro-Geometrical Model Theory and the Statistics of Lightning Current Parameters. In Proceedings of the 30th International Conference on Lightning Protection (ICLP), Cagliari, Italy, 13–17 September 2010; pp. 1–8. [Google Scholar]
  34. Kern, J.S. Spatial Patterns of Soil Organic Carbon in the Contiguous United States. Soil Sci. Soc. Am. J. 1994, 58, 439–455. [Google Scholar] [CrossRef]
  35. Zaengl, W.; Kuffel, E.; Kuffel, J. High Voltage Engineering Fundamentals, 2nd ed.; Newnes: Ben Bullen, Australia, 2018. [Google Scholar]
Figure 1. Schematic diagram of the experimental work.
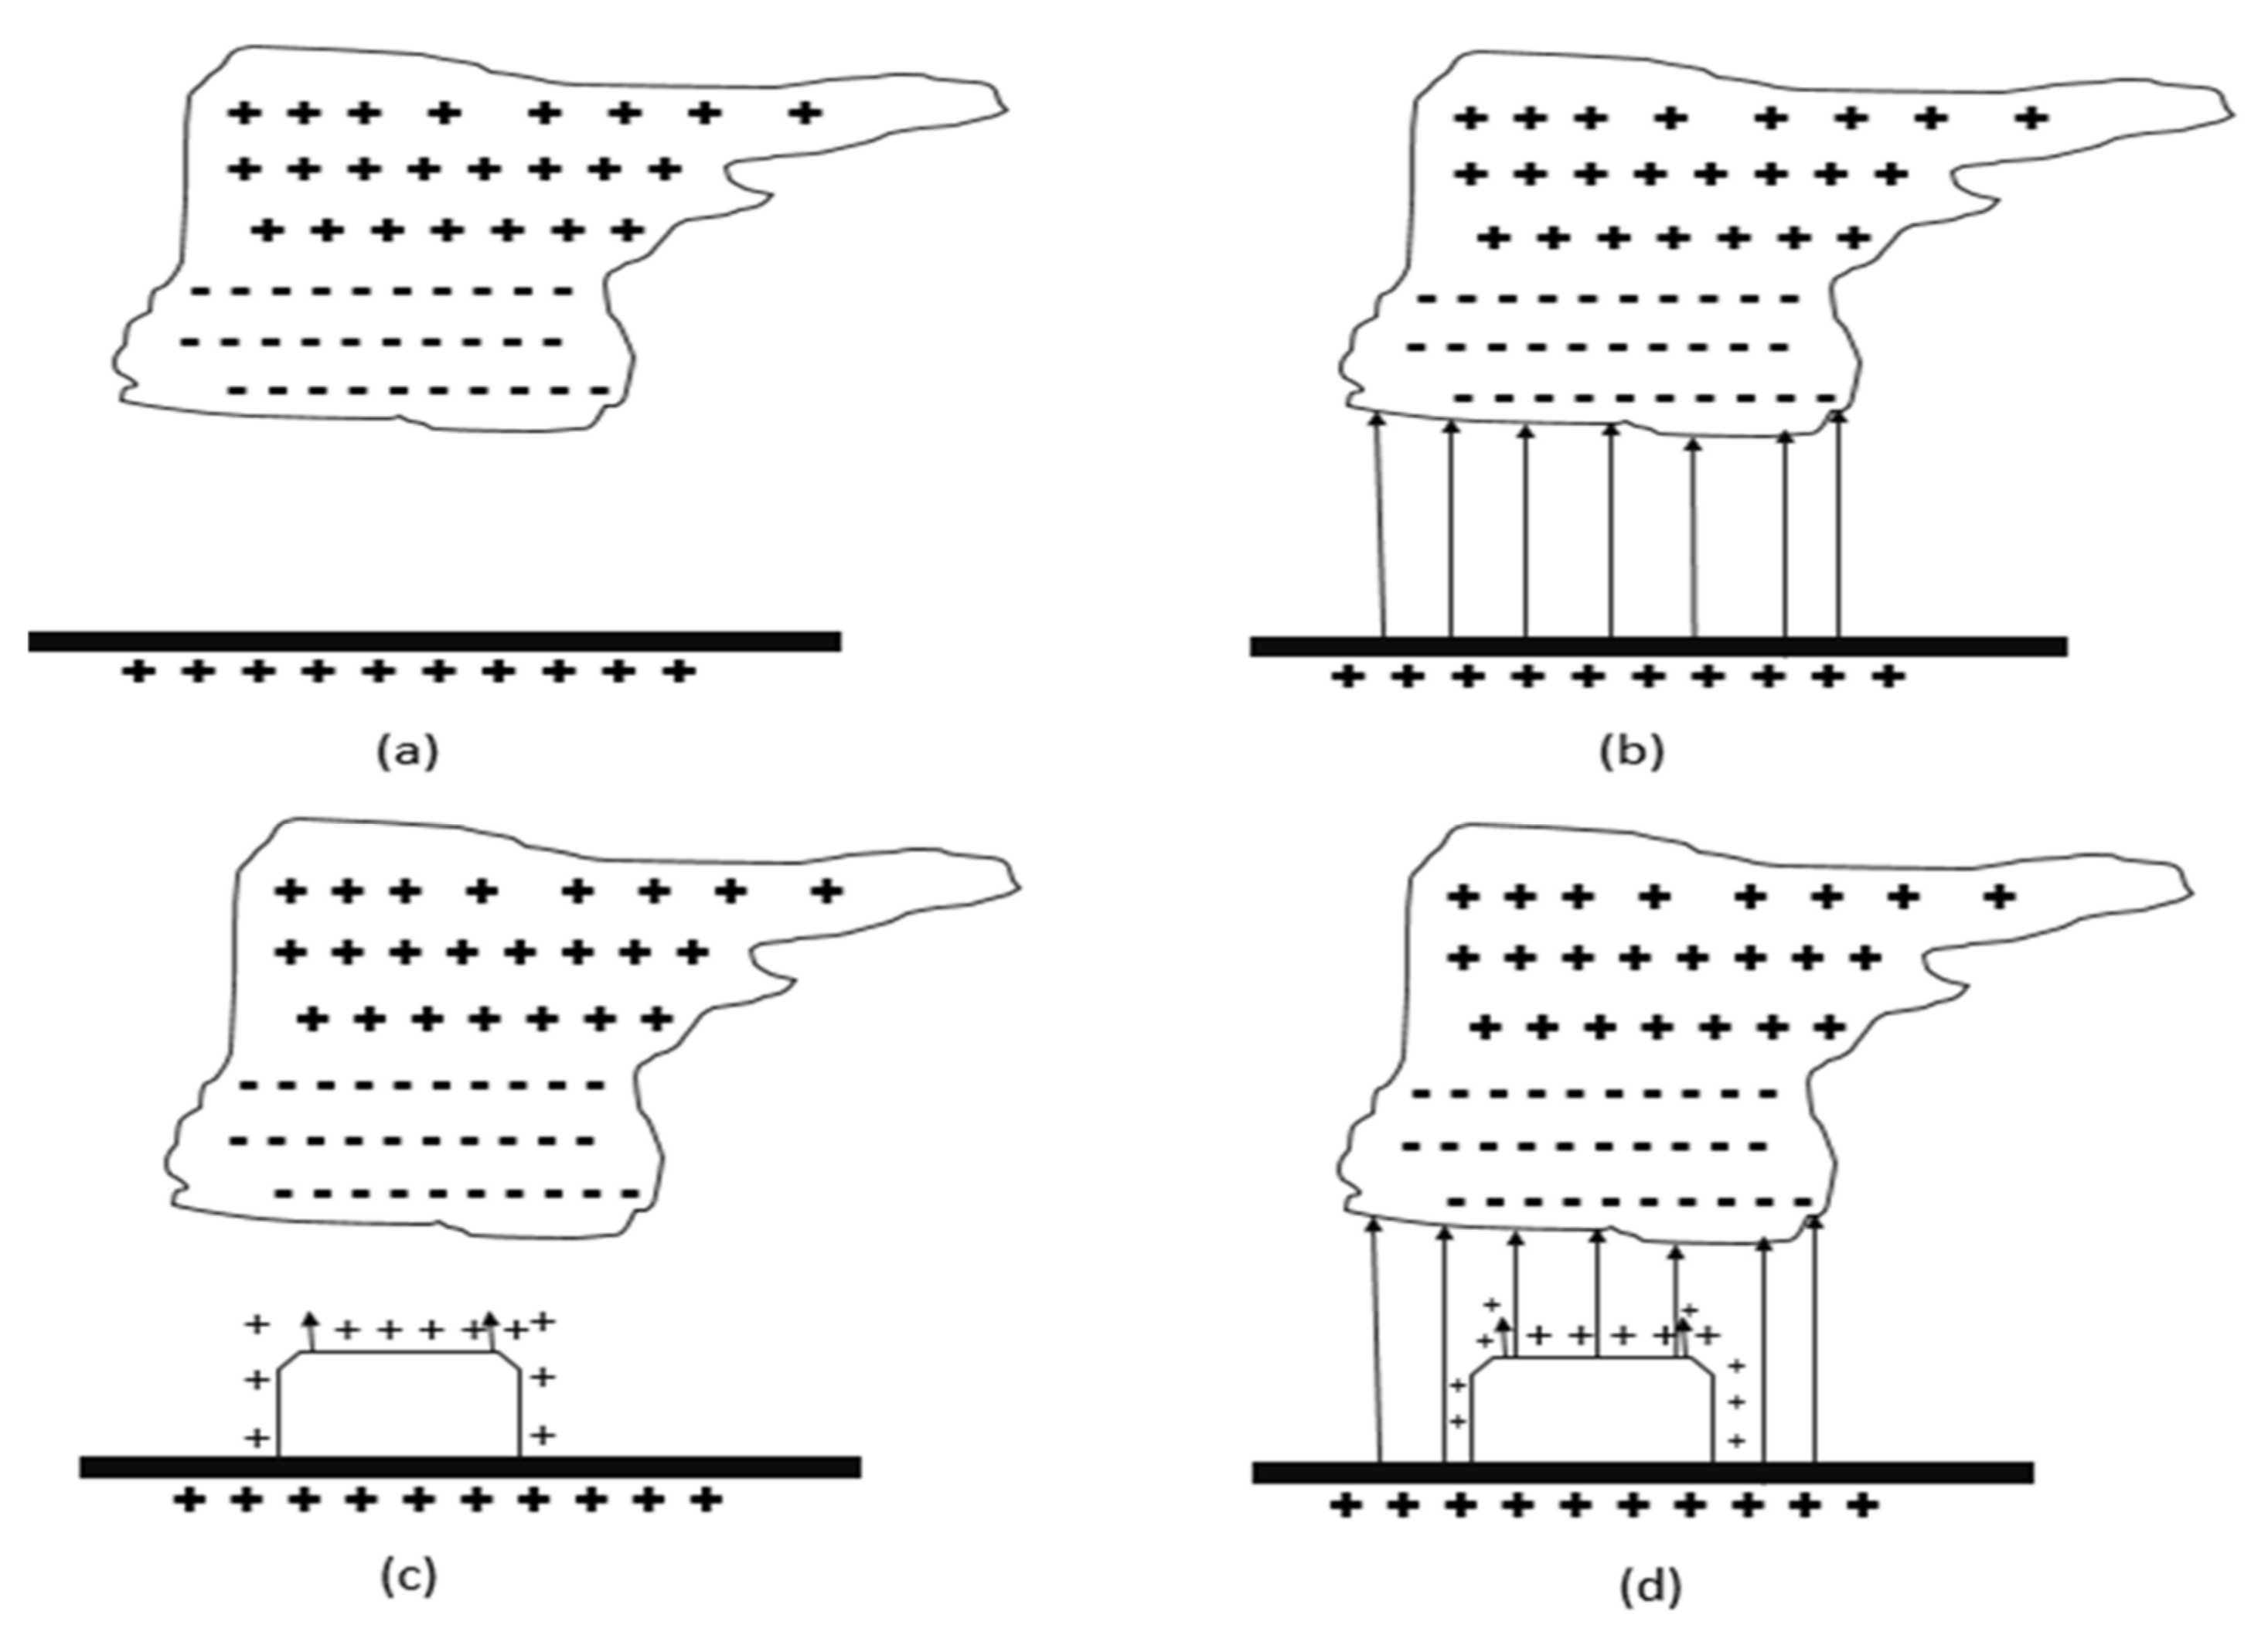
Energies 15 06597 g001
Figure 2. Electrification of grounded building structures with installed LAT during a thunderstorm; (a) matured cumulonimbus cloud, (b) cloud-to-ground electric field concentration, (c) mirror-image positive charges due to cloud base negative charges; the grounded structure is covered with positive charges, (d) electric field lines linking the ground and building with electric fields connected to the cloud.
Energies 15 06597 g002
Figure 3. Electrification of grounded building structures with installed LAT during a thunderstorm (a) Upper part of the building with distribution of positive charges, (b) upper building sectionalized for electric field analysis, (c) electric field lines linking the ground and building with ground-to-cloud electric fields (symmetrical consideration), with upward and downward leaders involved.
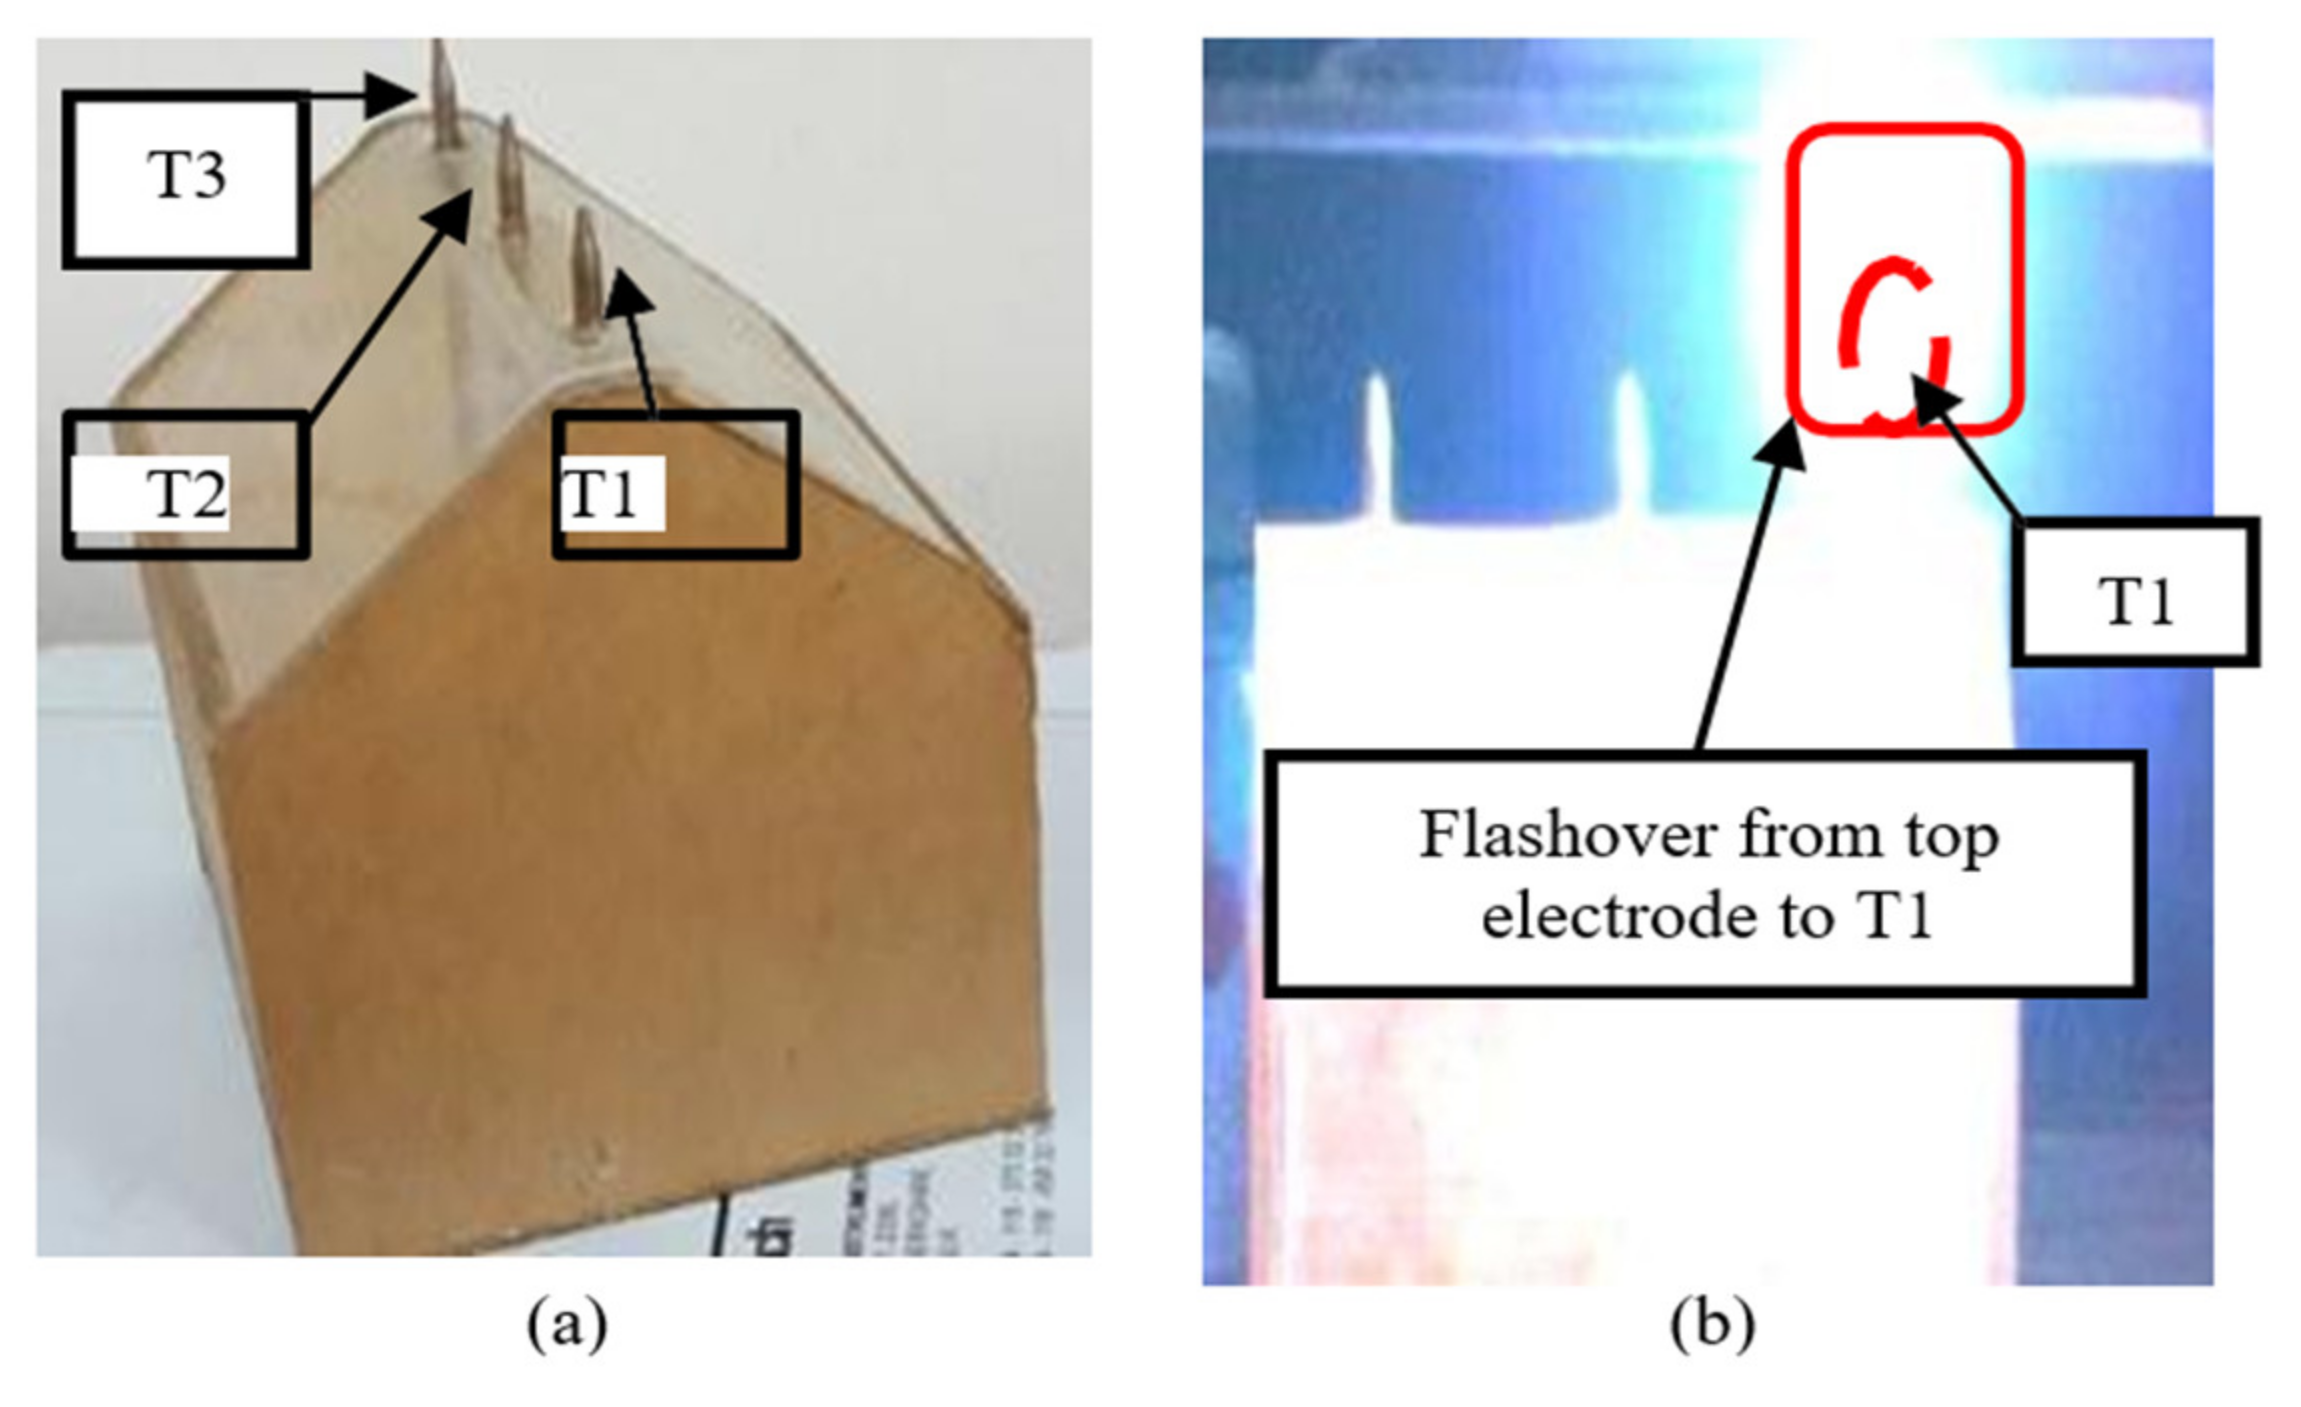
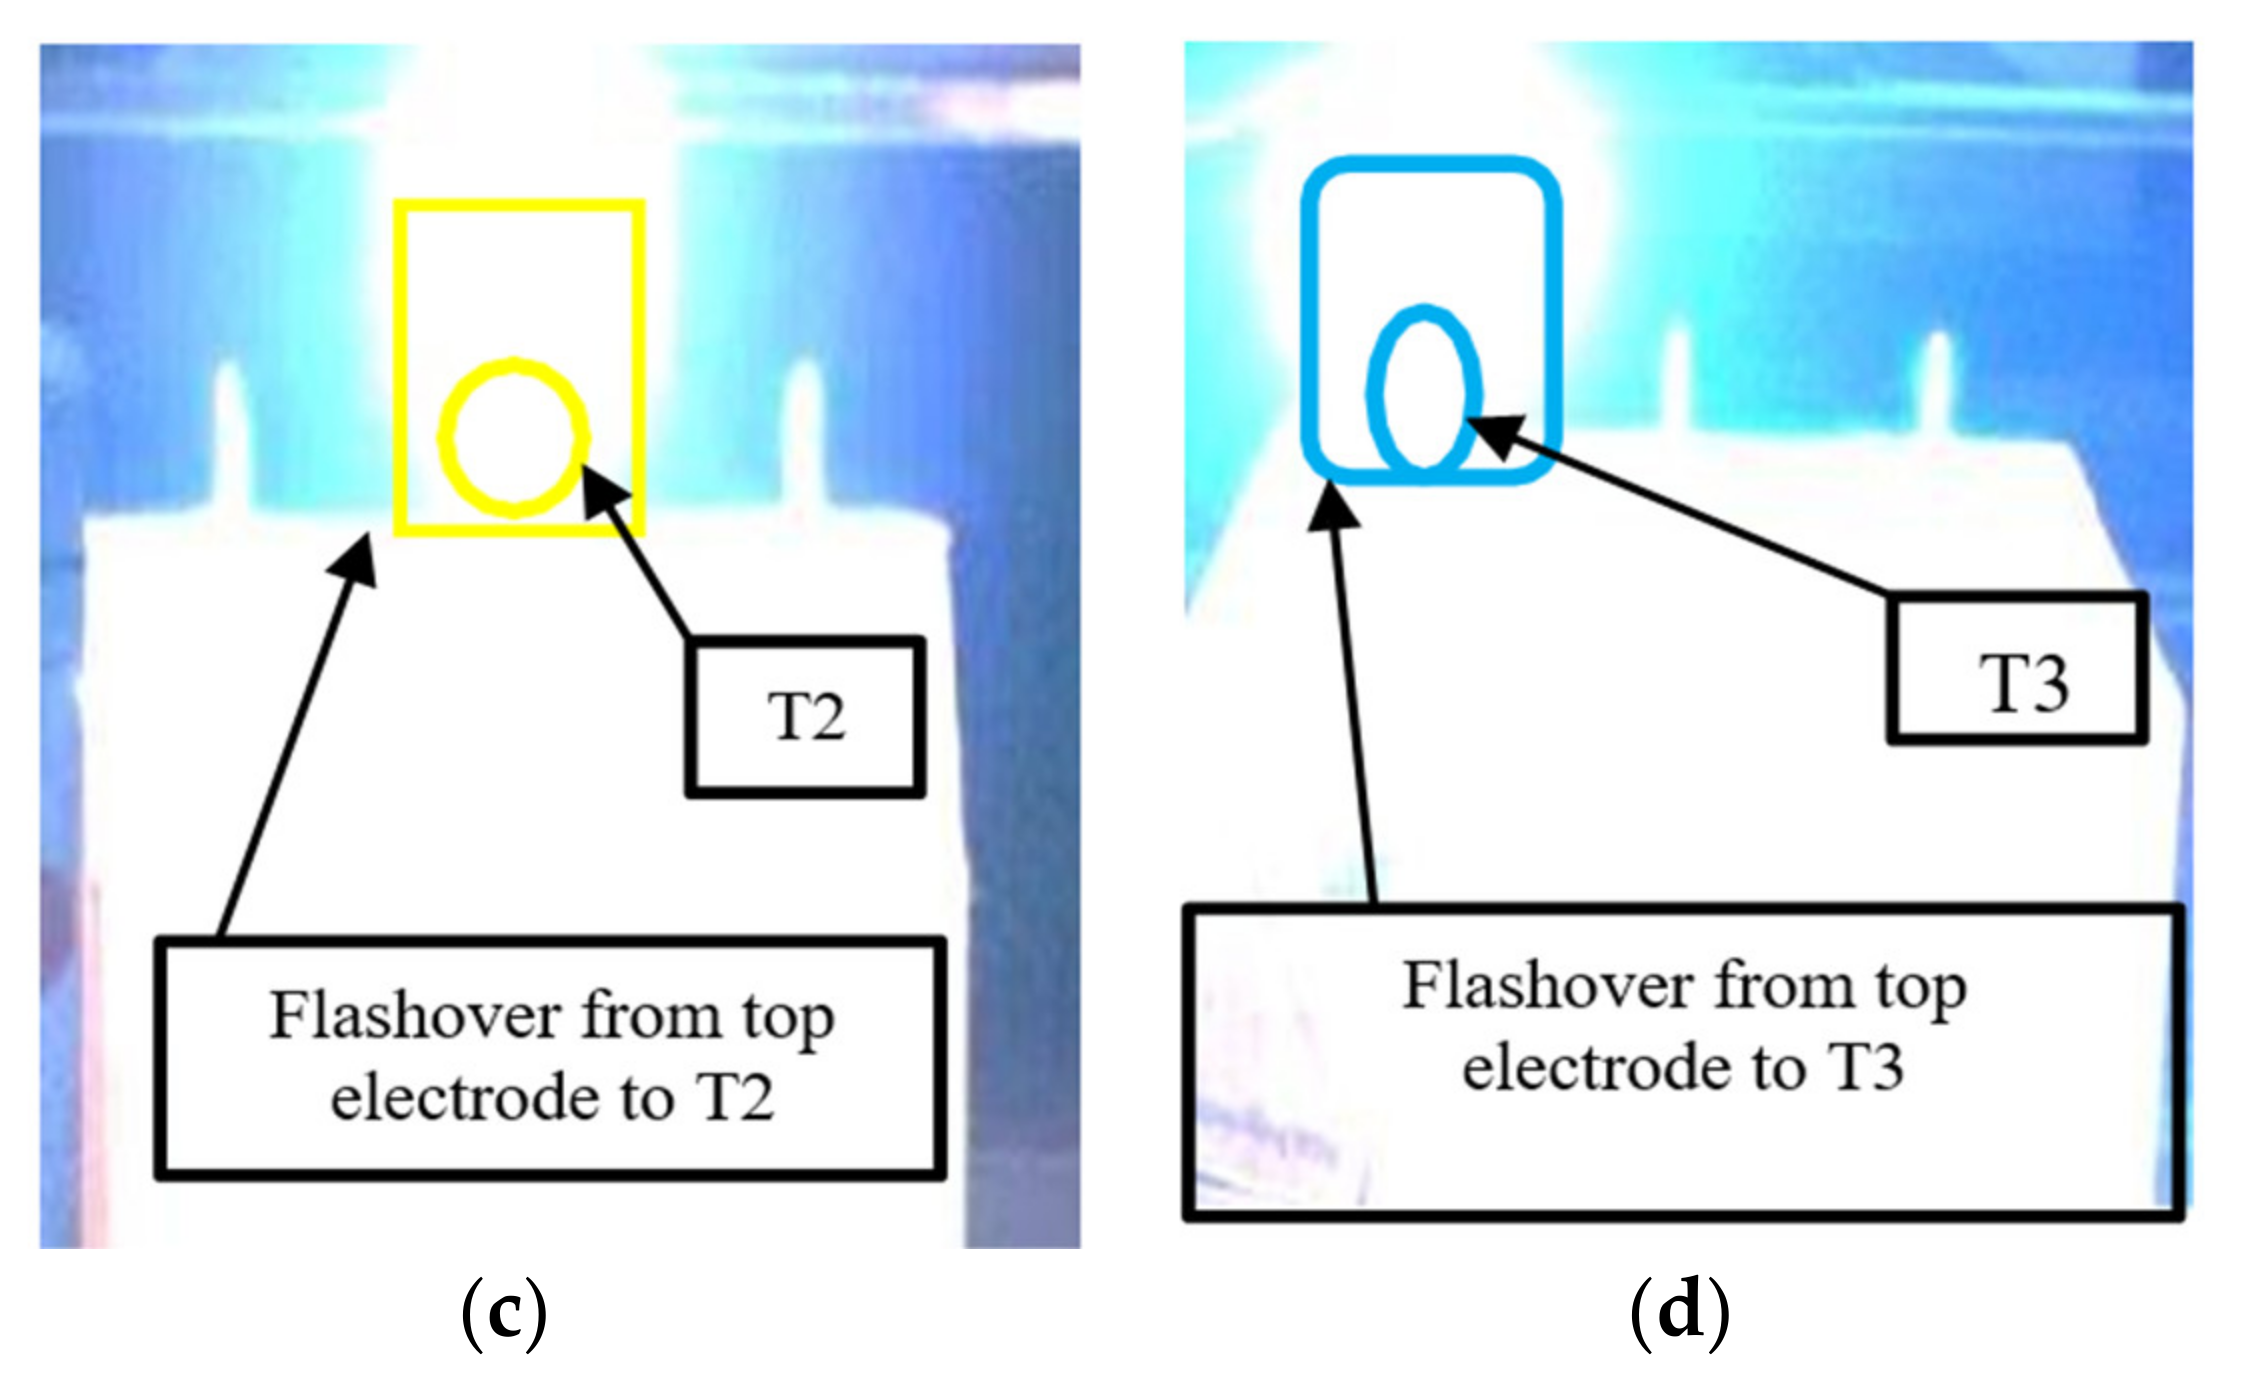
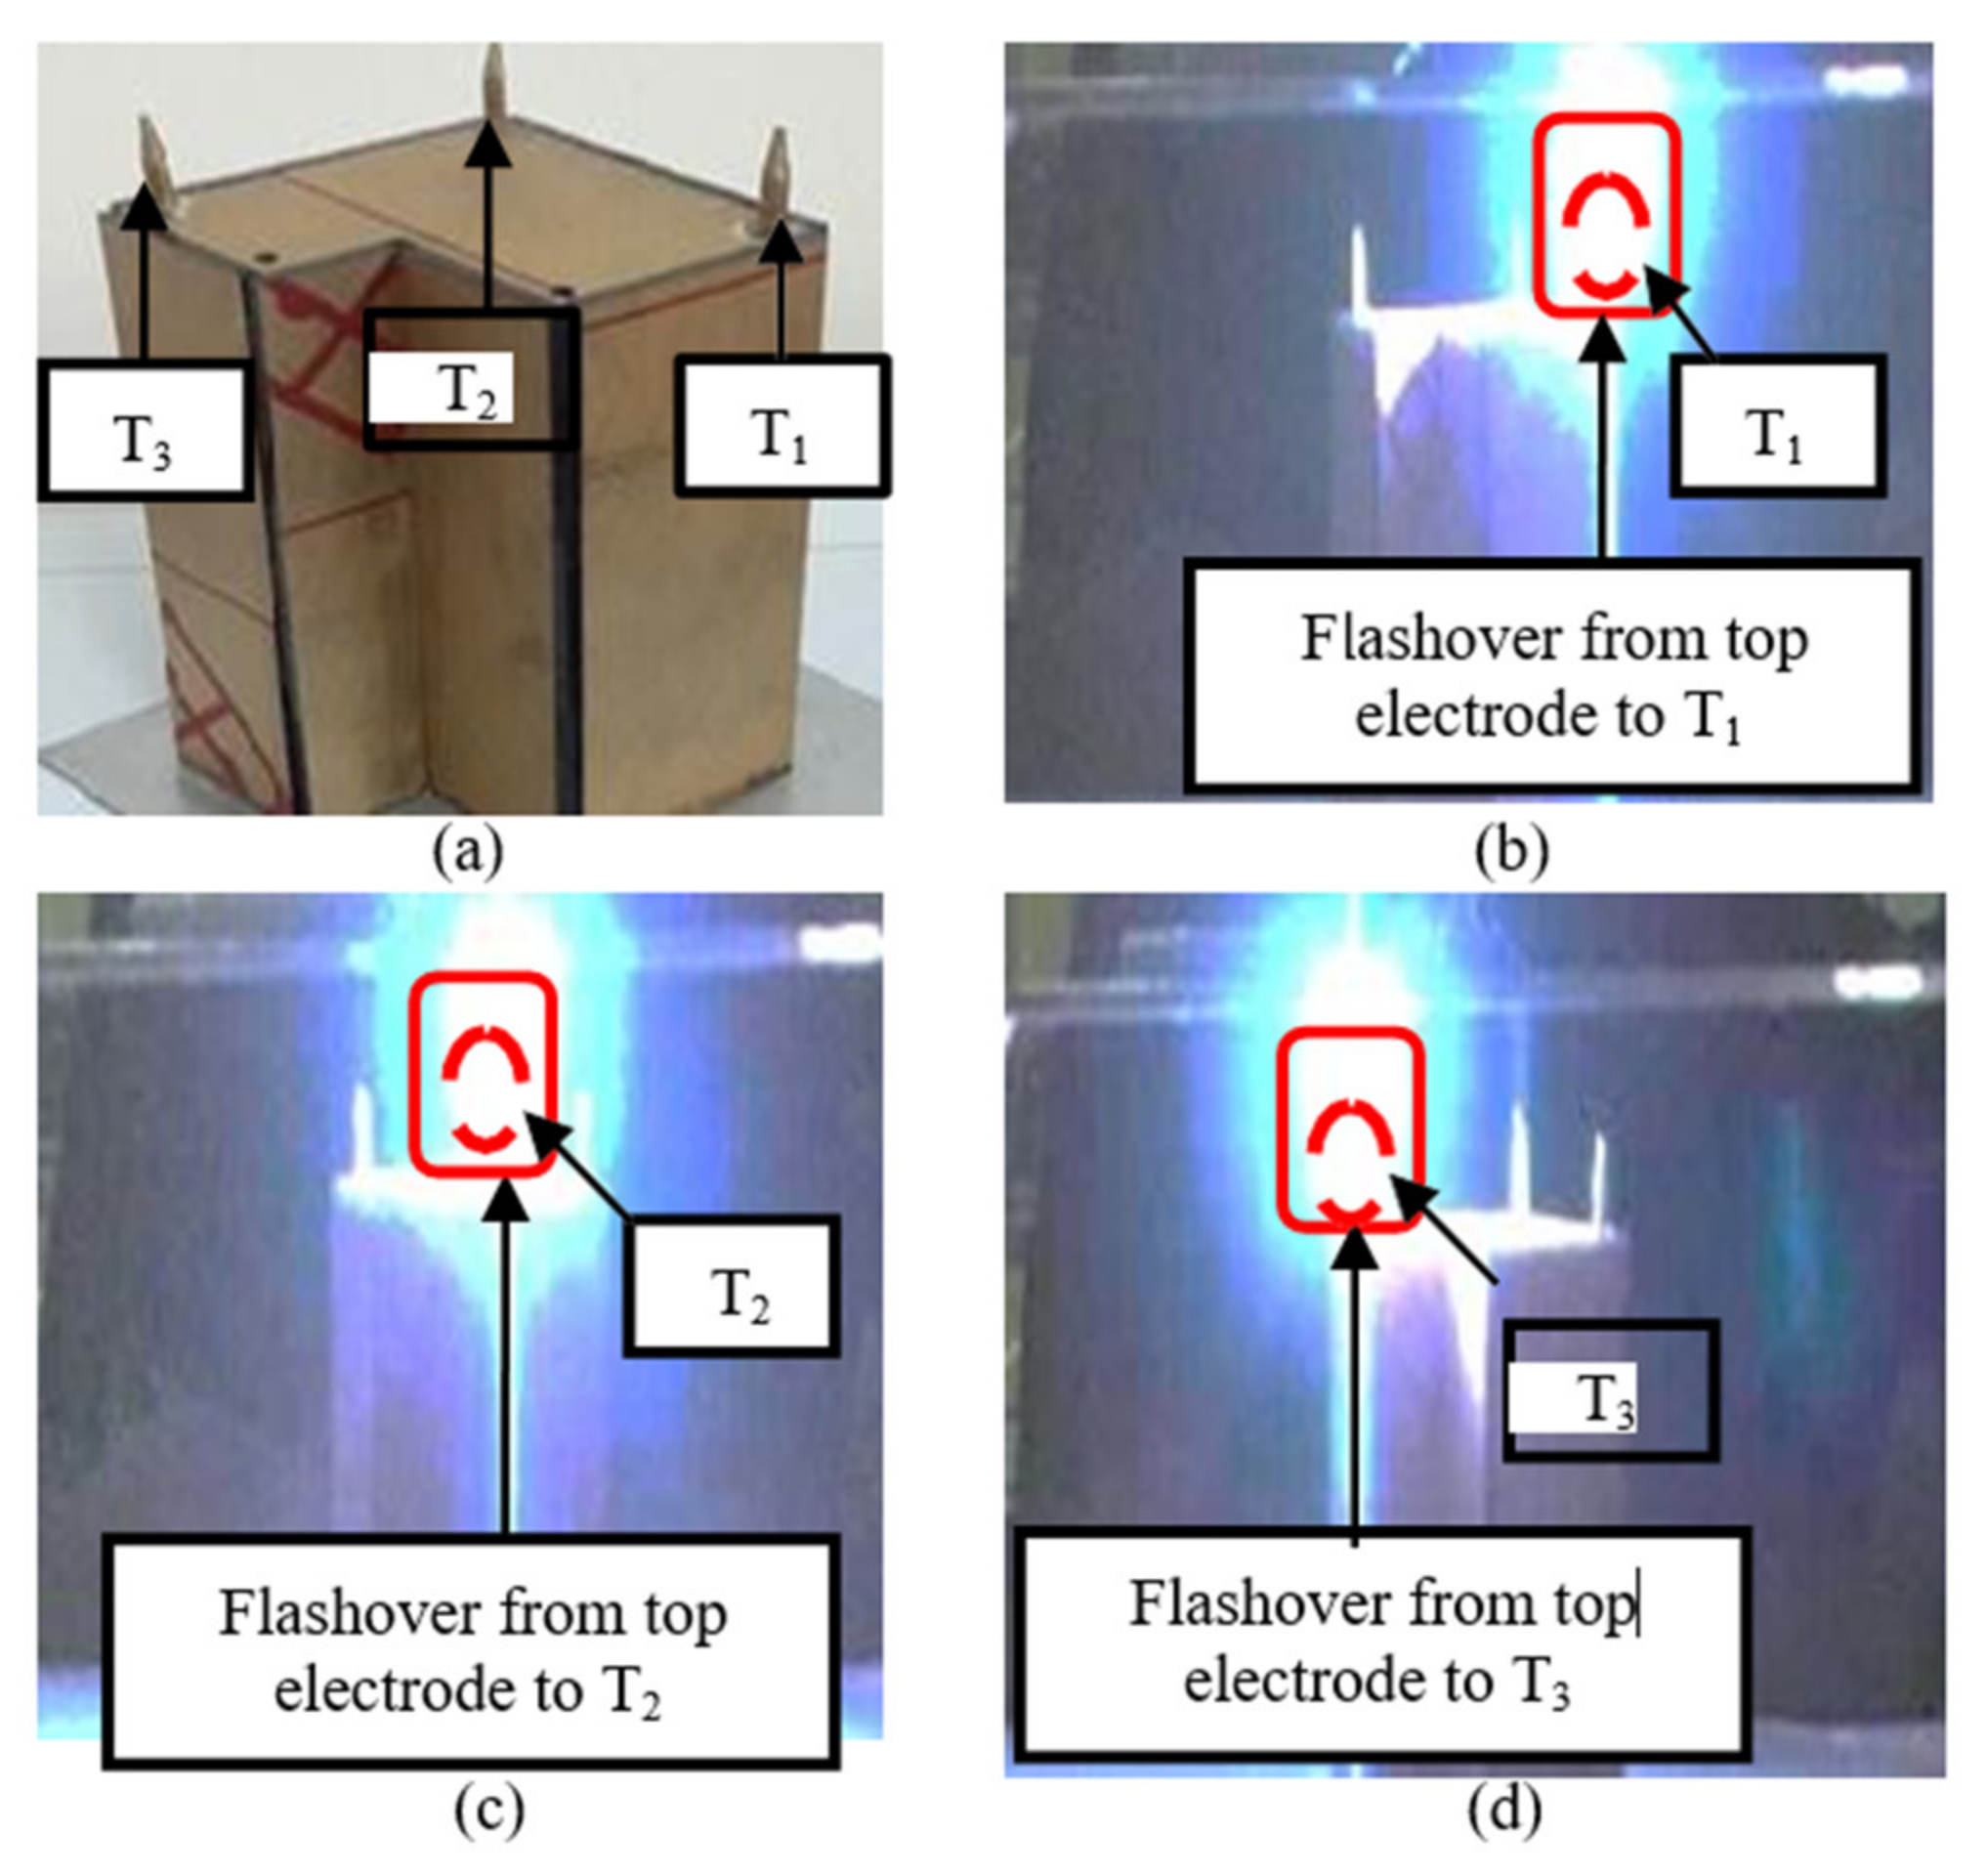
Energies 15 06597 g003
Figure 4. Lightning strike distribution on the Gable scaled model: (a) scaled gable shape (b) strike on LAT1, (c) strike on LAT2, (d) strike on LAT3.
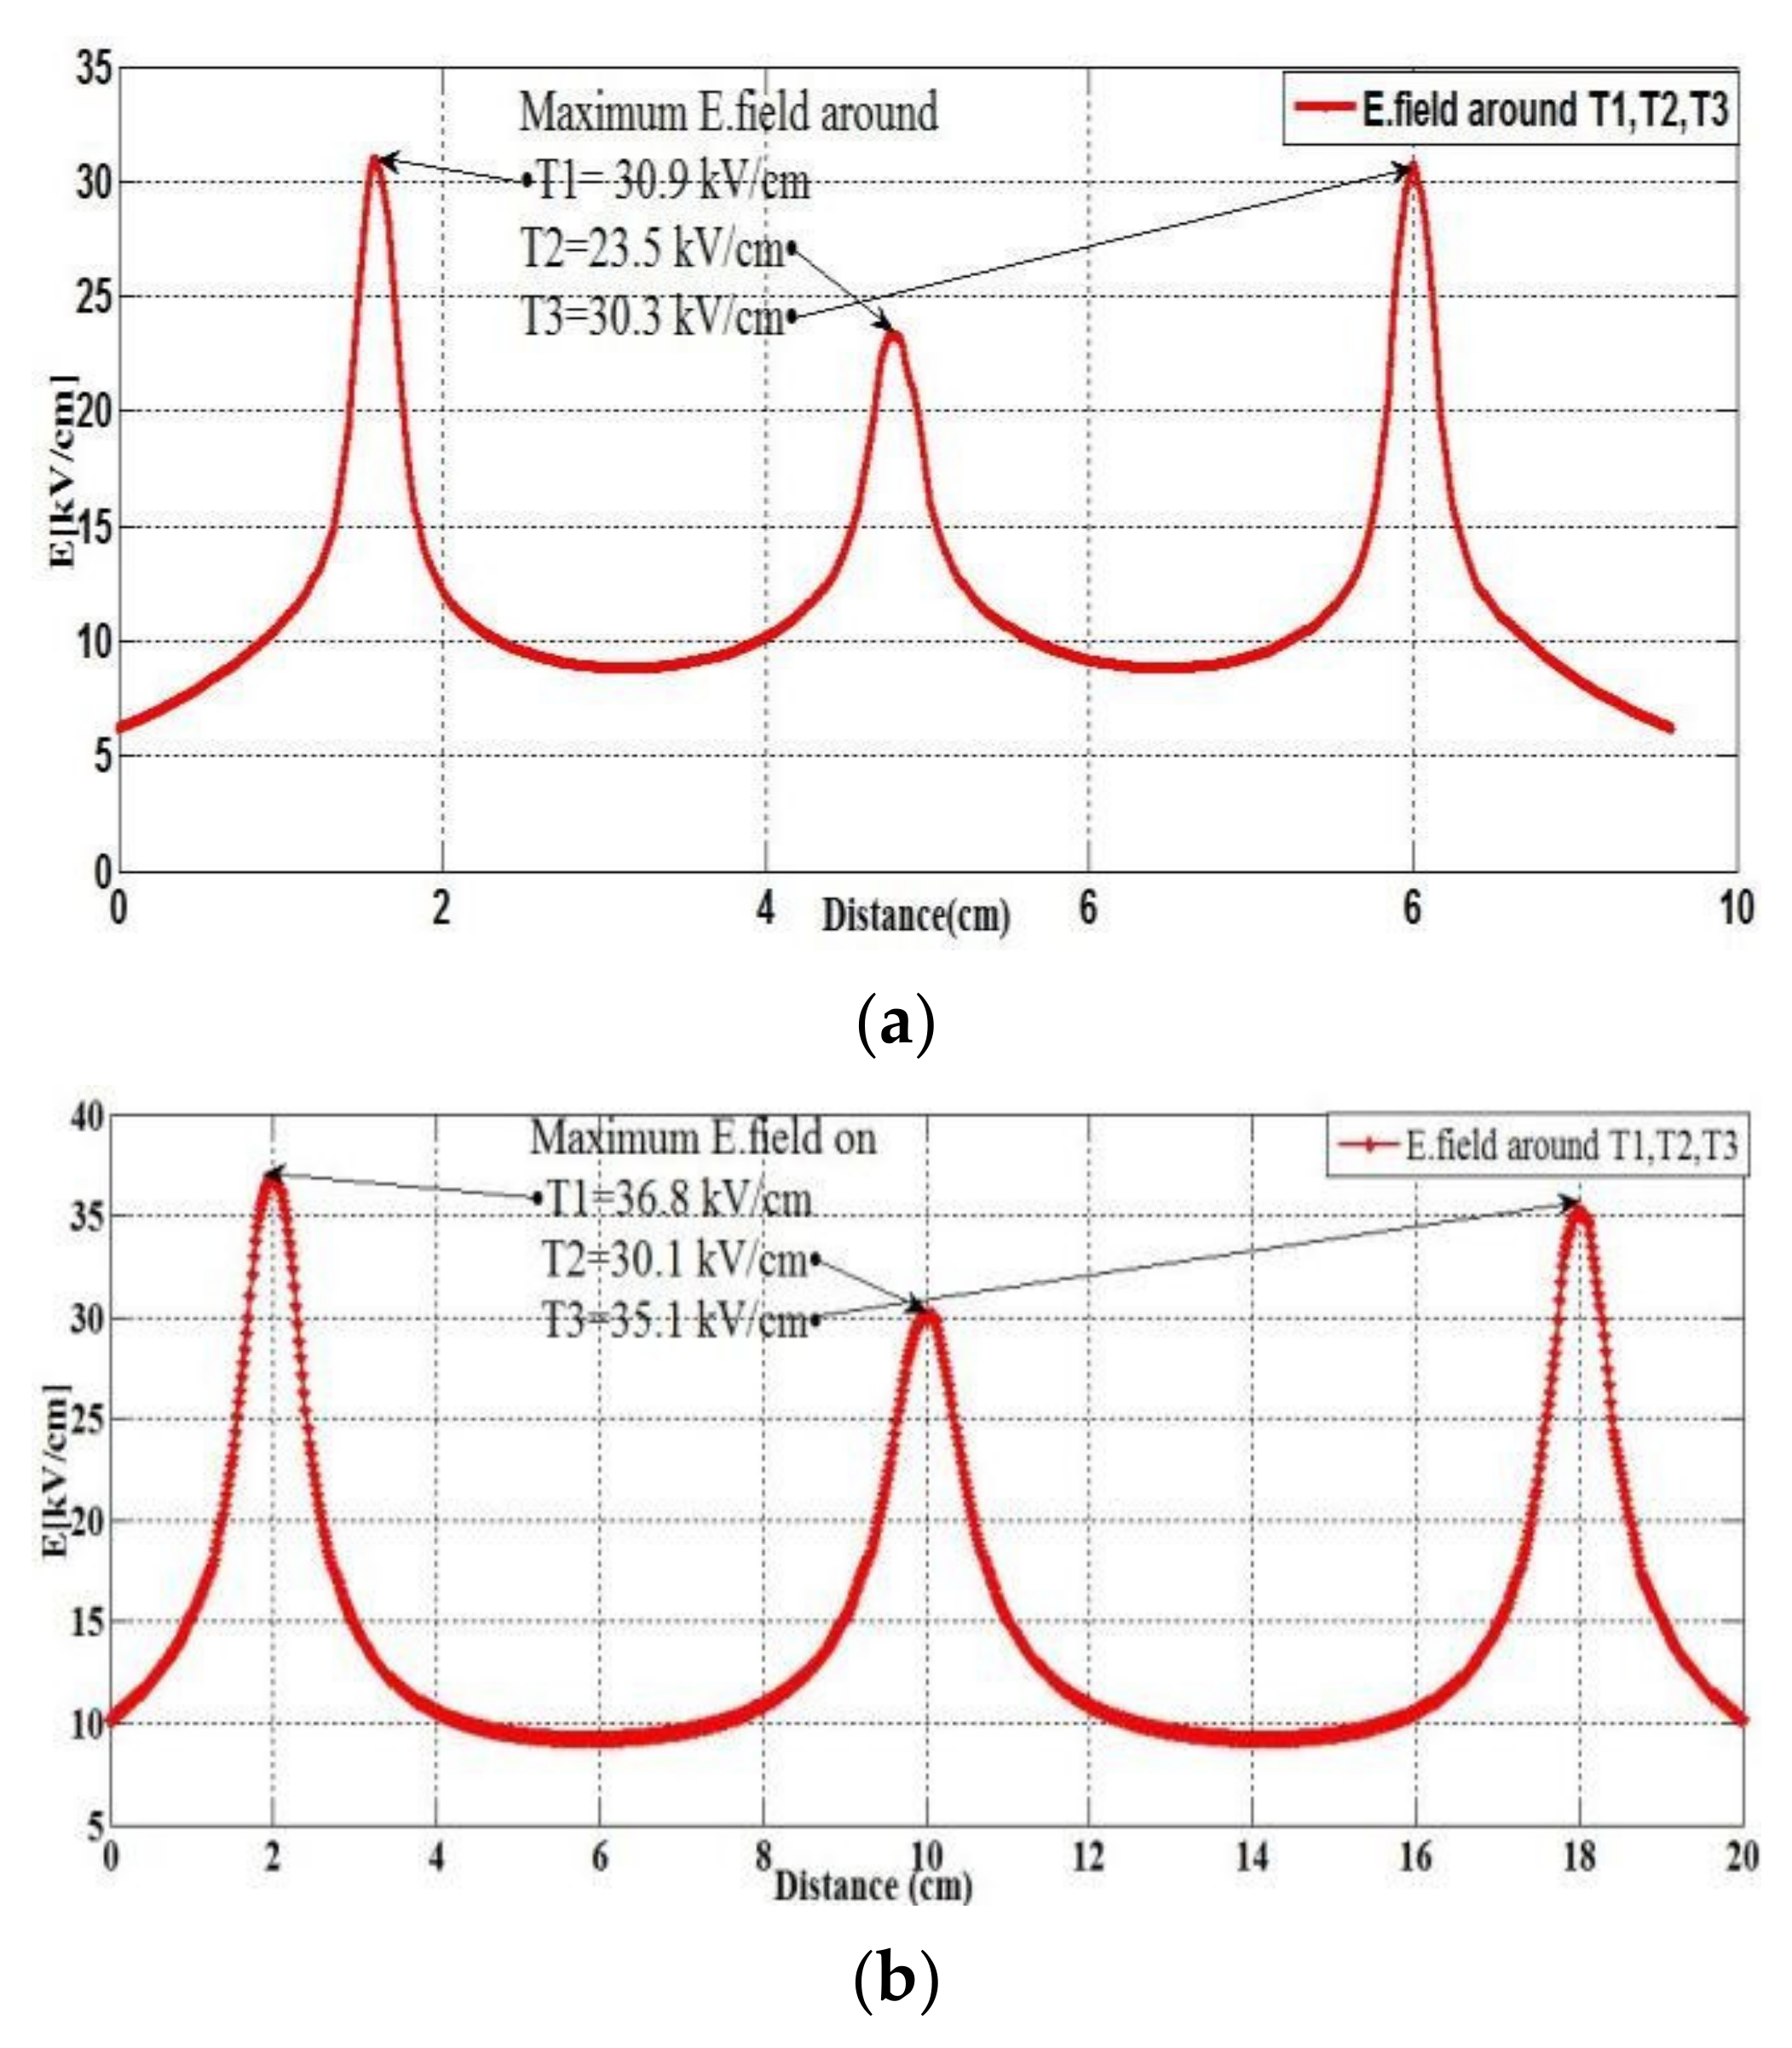
Energies 15 06597 g004aEnergies 15 06597 g004b
Figure 5. Probability of lightning strikes on a gable-shape scaled model: (a) 3D scaled gable shape, (b) electric field plot without upward leaders, (c) electric field plot with upward leaders.
Energies 15 06597 g005
Figure 6. Electric field distribution with (a) and without upward leader inception (b).
Energies 15 06597 g006
Figure 7. Lightning strike distribution on an L-shape scaled model: (a) scaled L-shape model, (b) strike on LAT1, (c) strike on LAT2, (d) strike on LAT3.
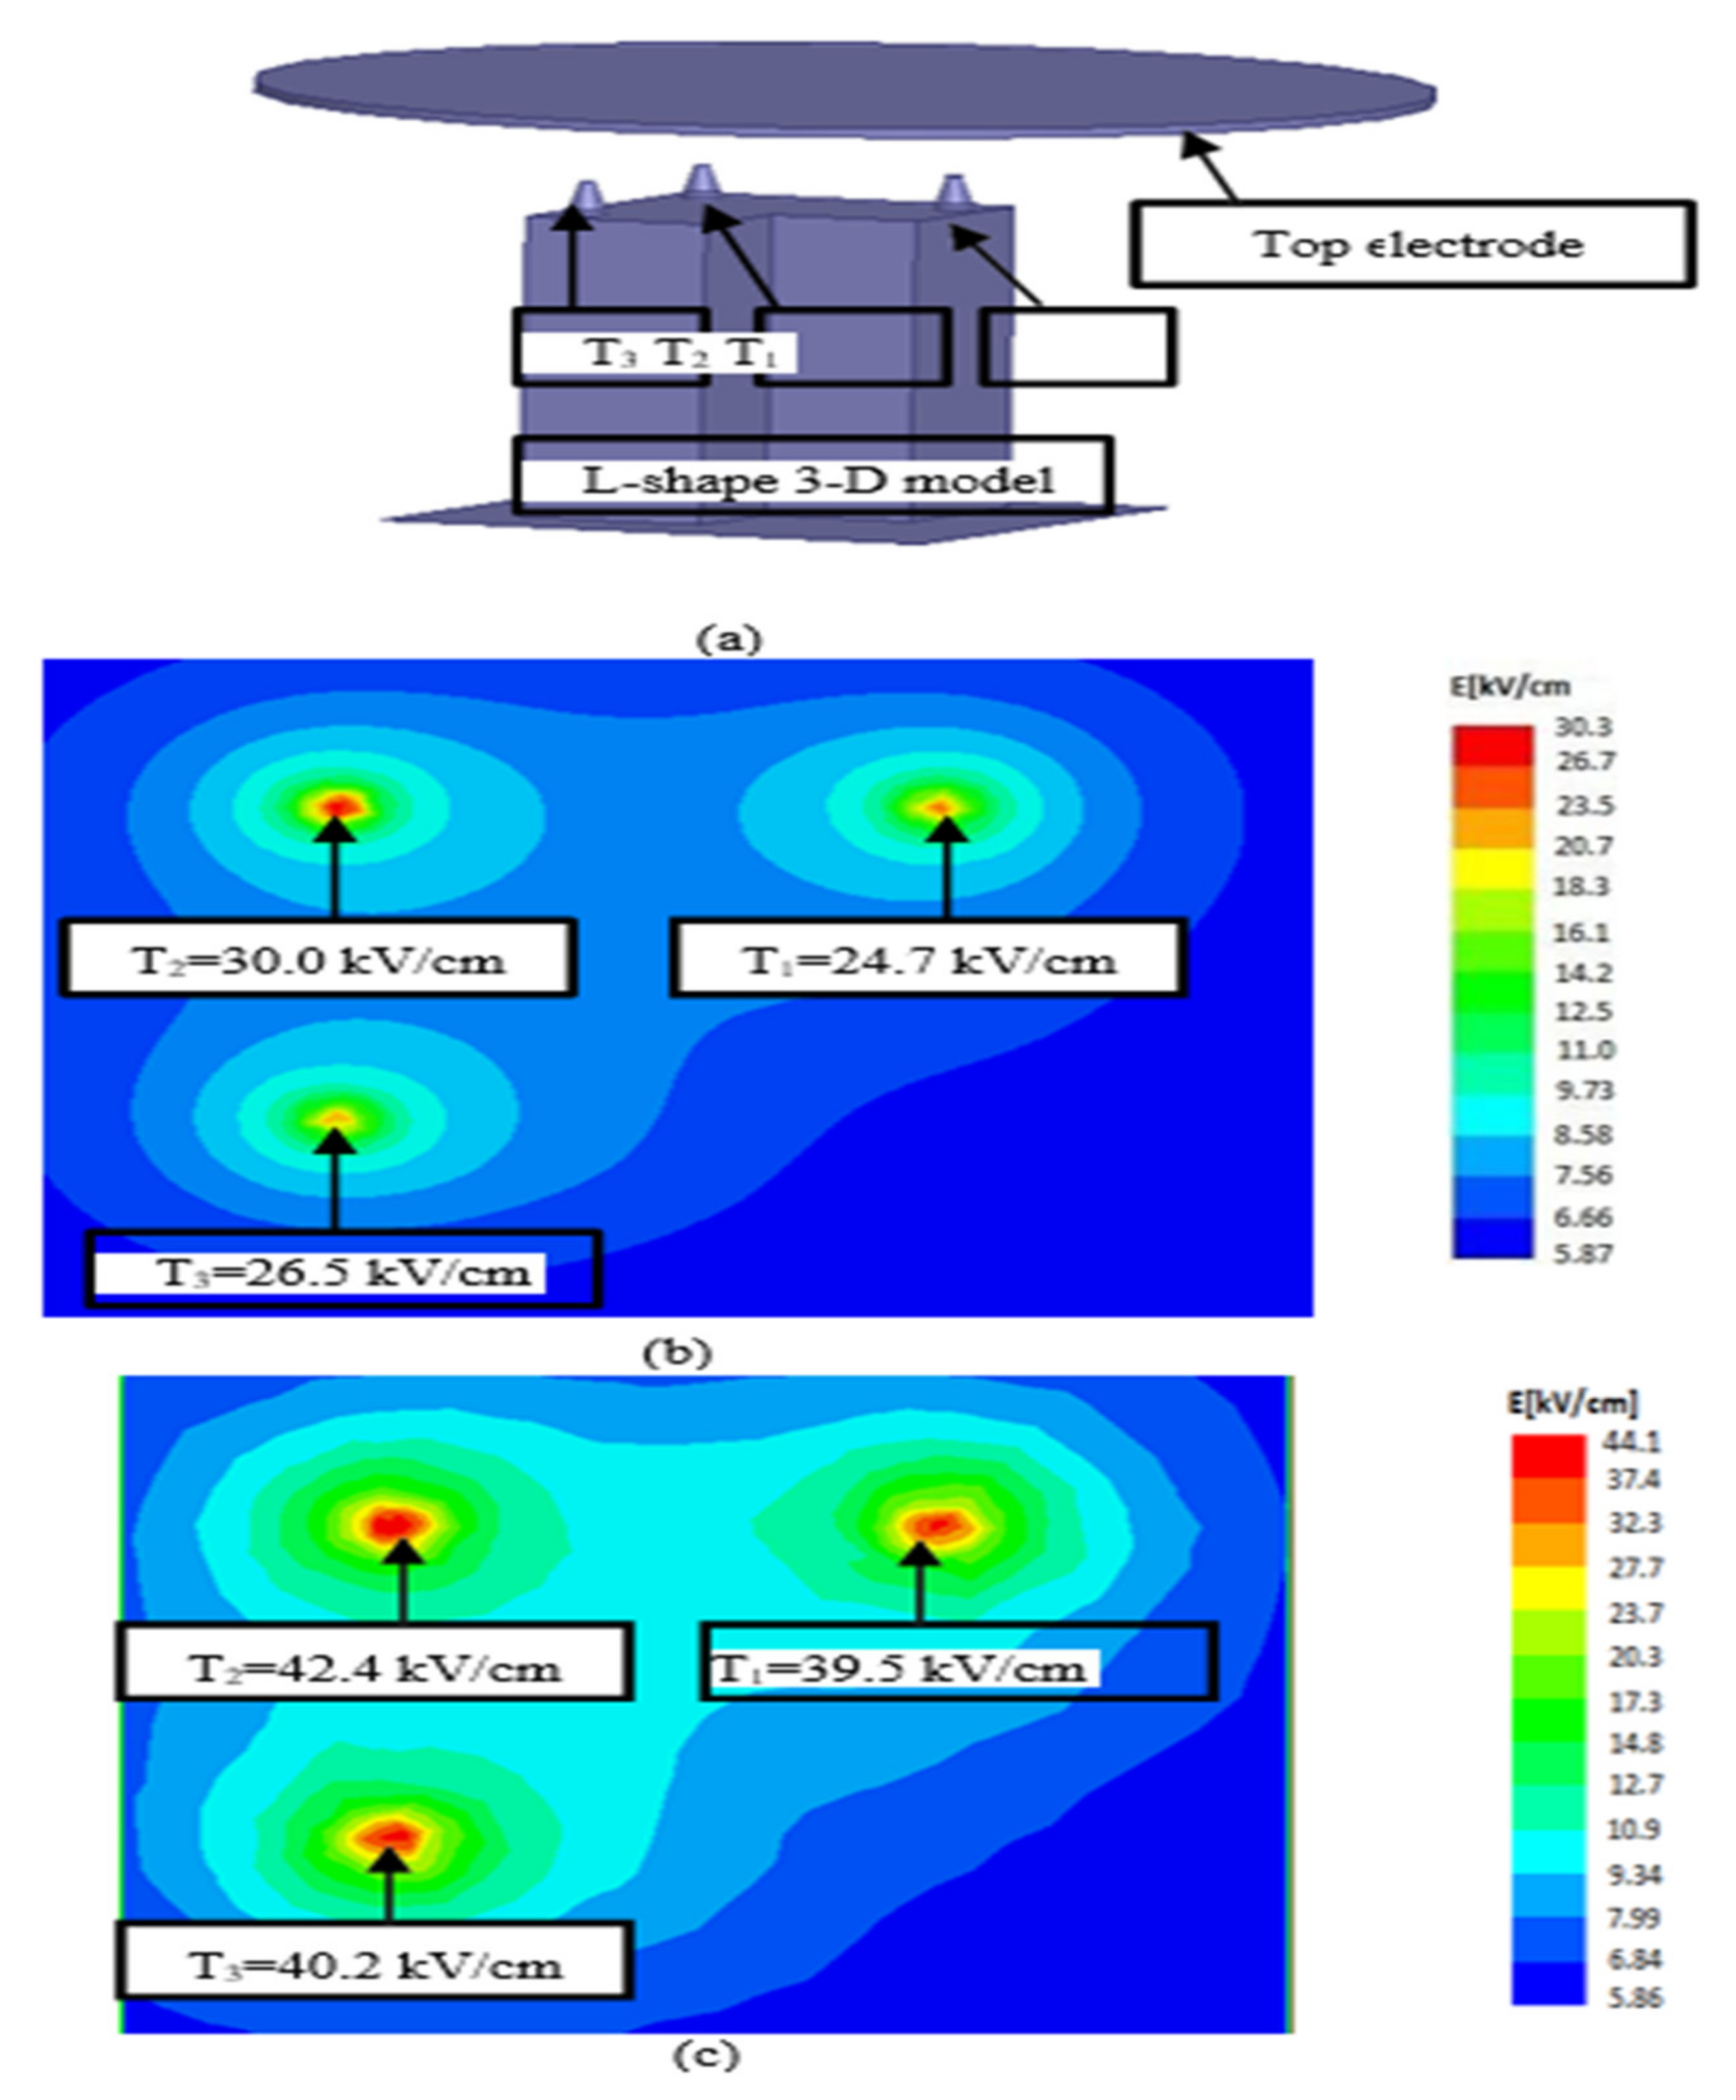
Energies 15 06597 g007
Figure 8. 3-D model-Shape building structure (a) Probability of lightning on an L-shape structure: (b) field plot without upward leaders, (c) field plot with upward leaders.
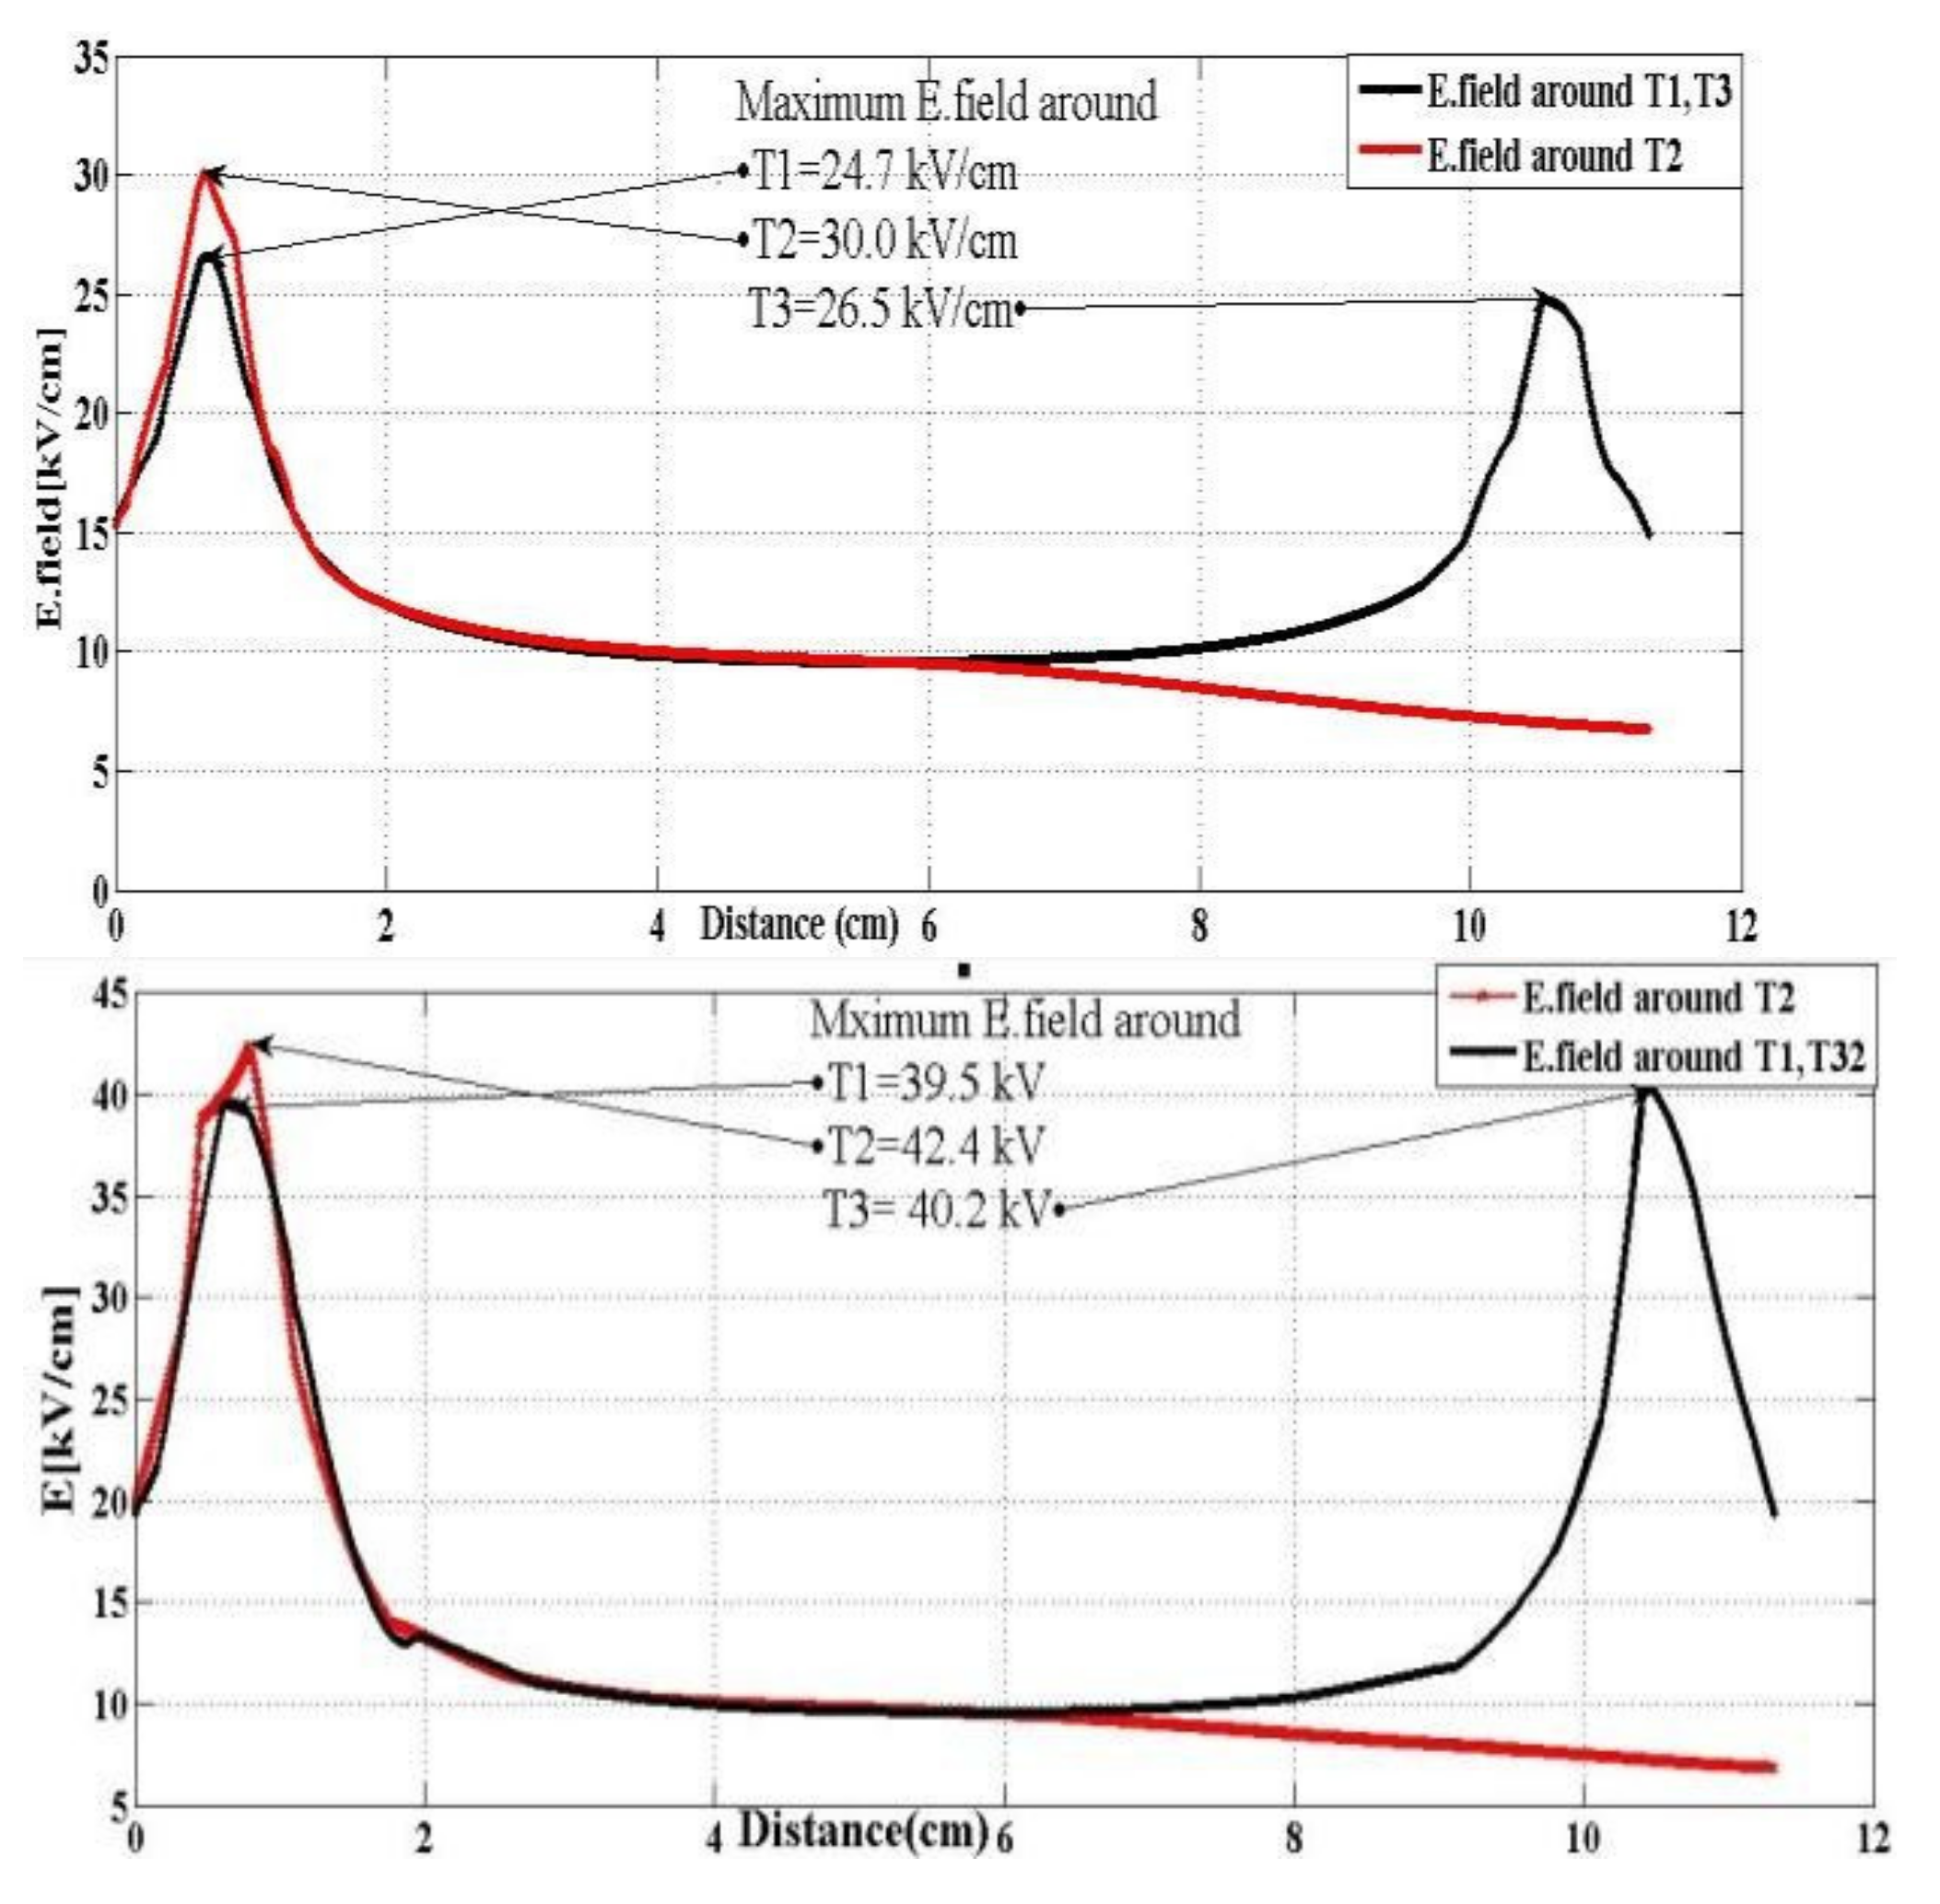
Energies 15 06597 g008
Figure 9. Electric field plot on an L-shape geometrical structure with and without upward leaders’ inception.
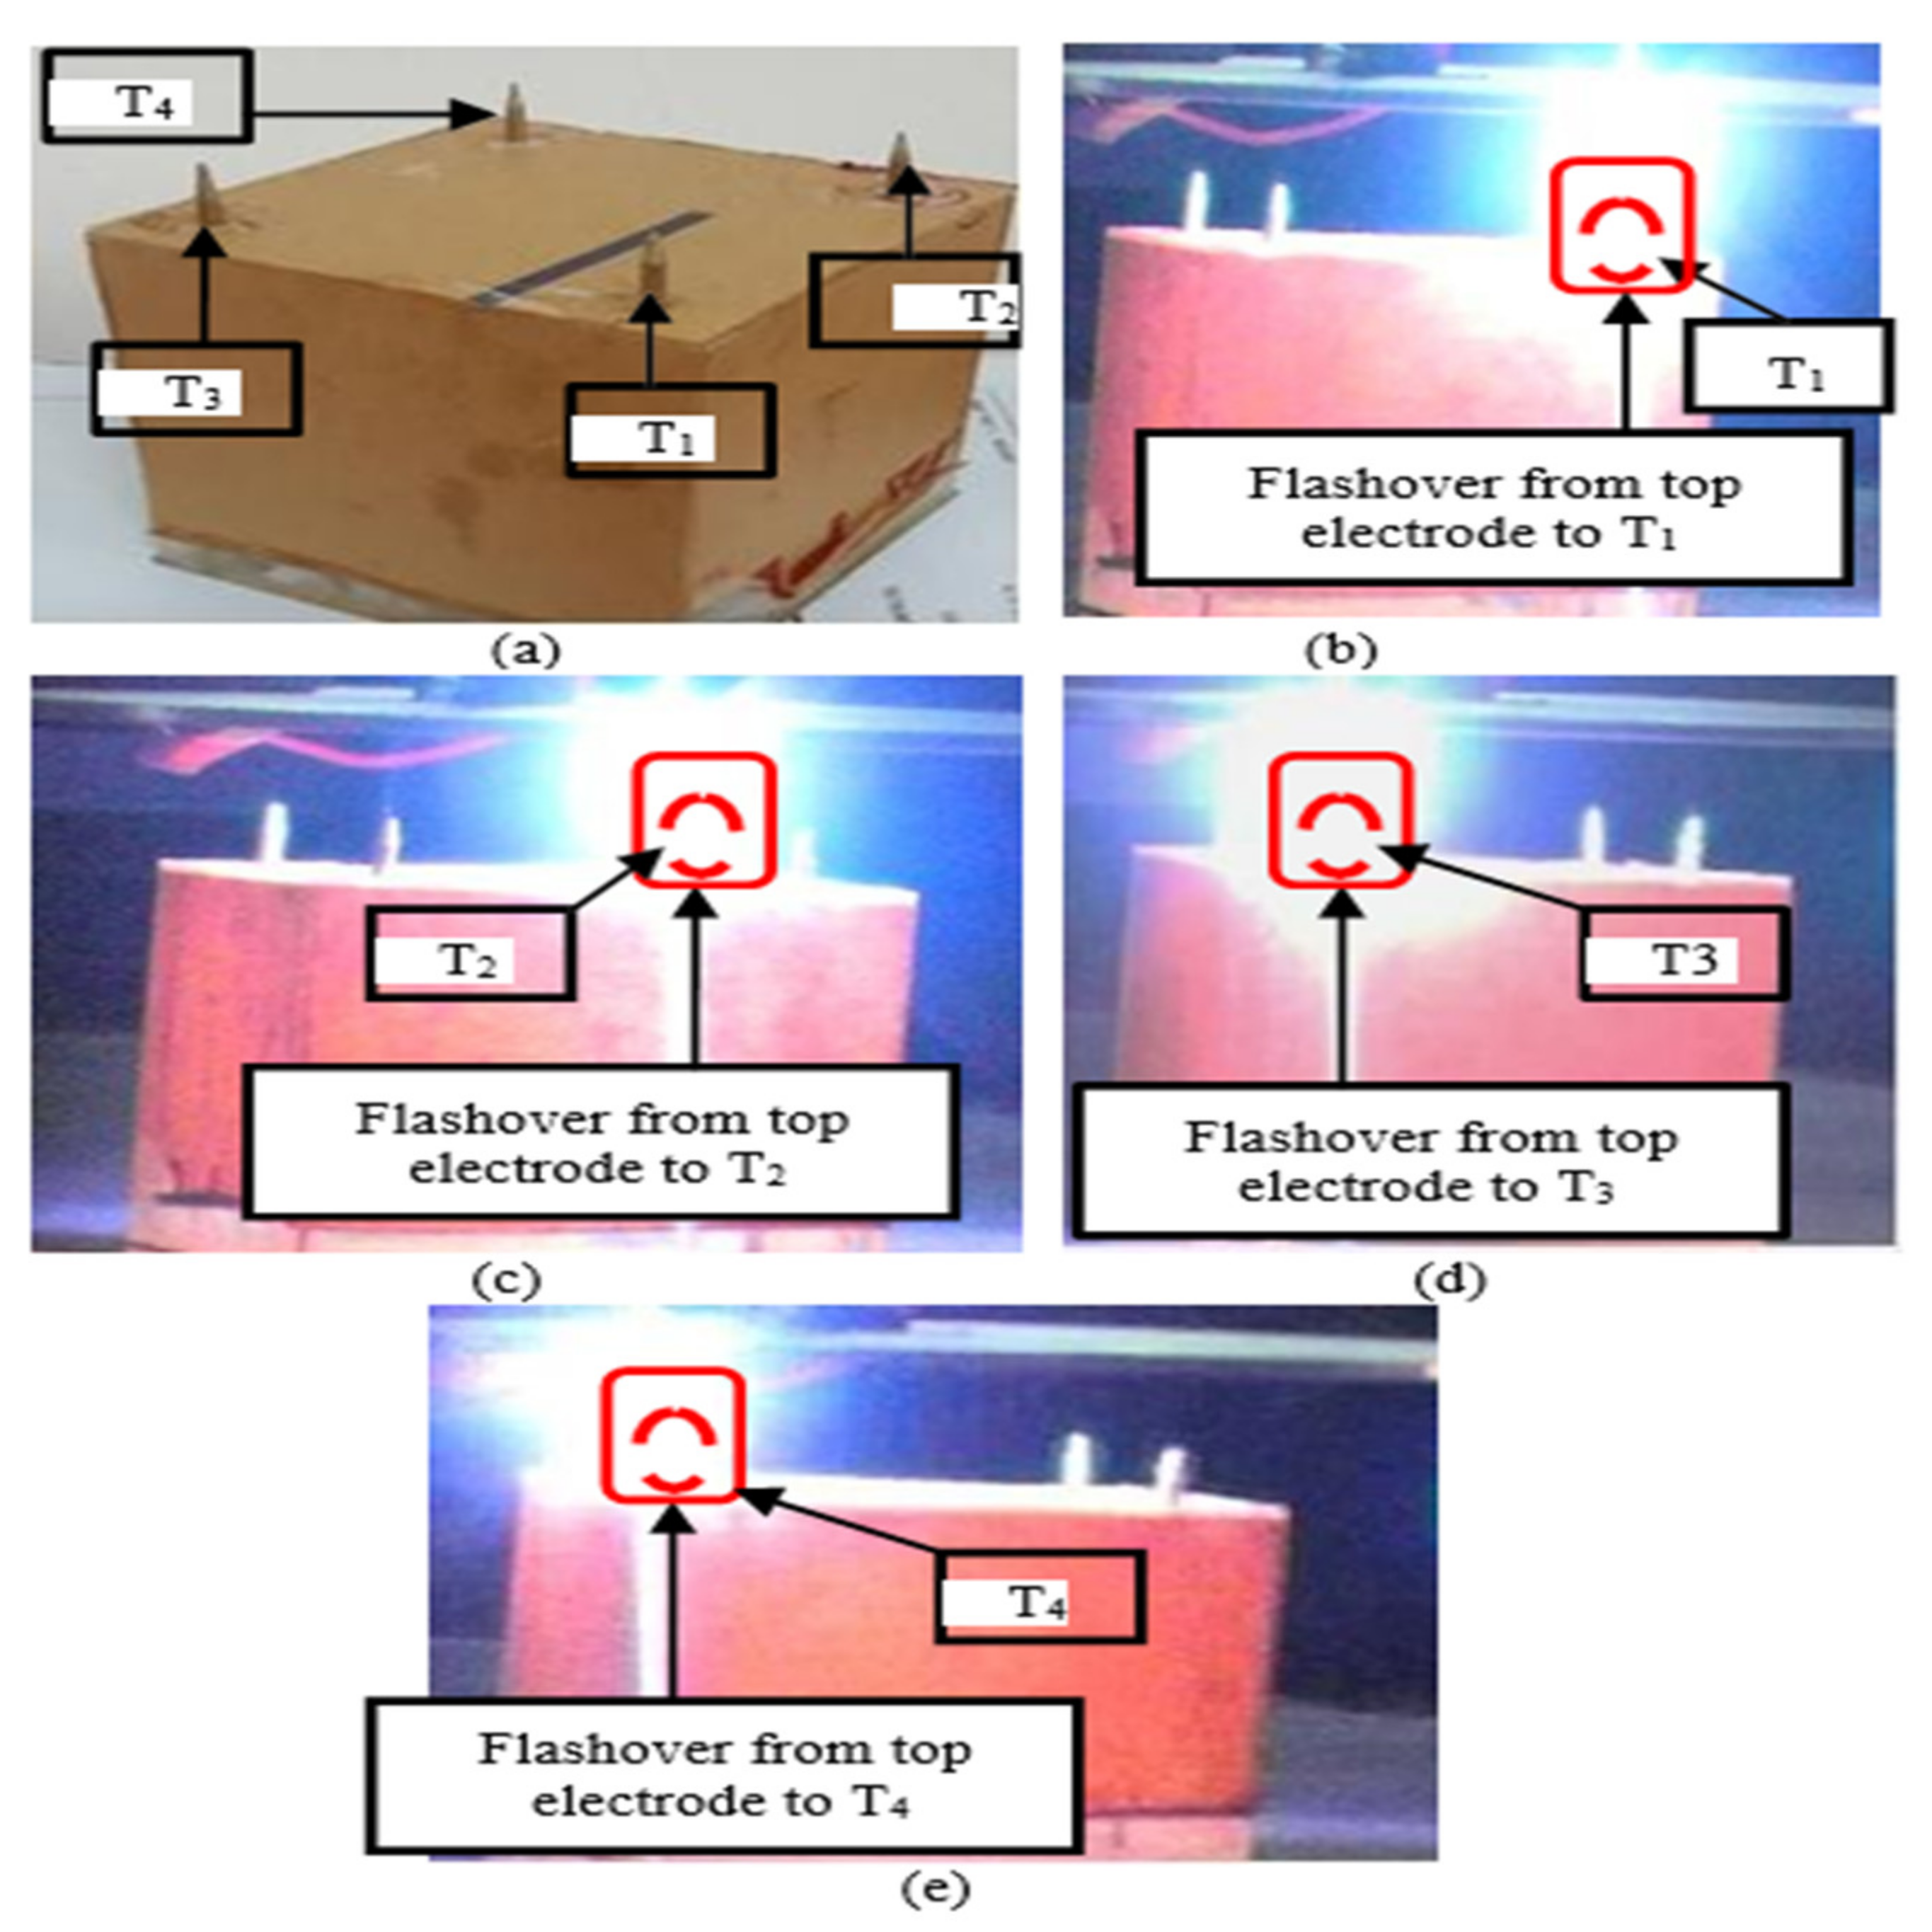
Energies 15 06597 g009
Figure 10. Lightning strike distribution on a square-shape model: (a) scaled square shape, (b) strike on LAT1, (c) strike on LAT2, (d) strike on LAT3, (e) strike on LAT4.
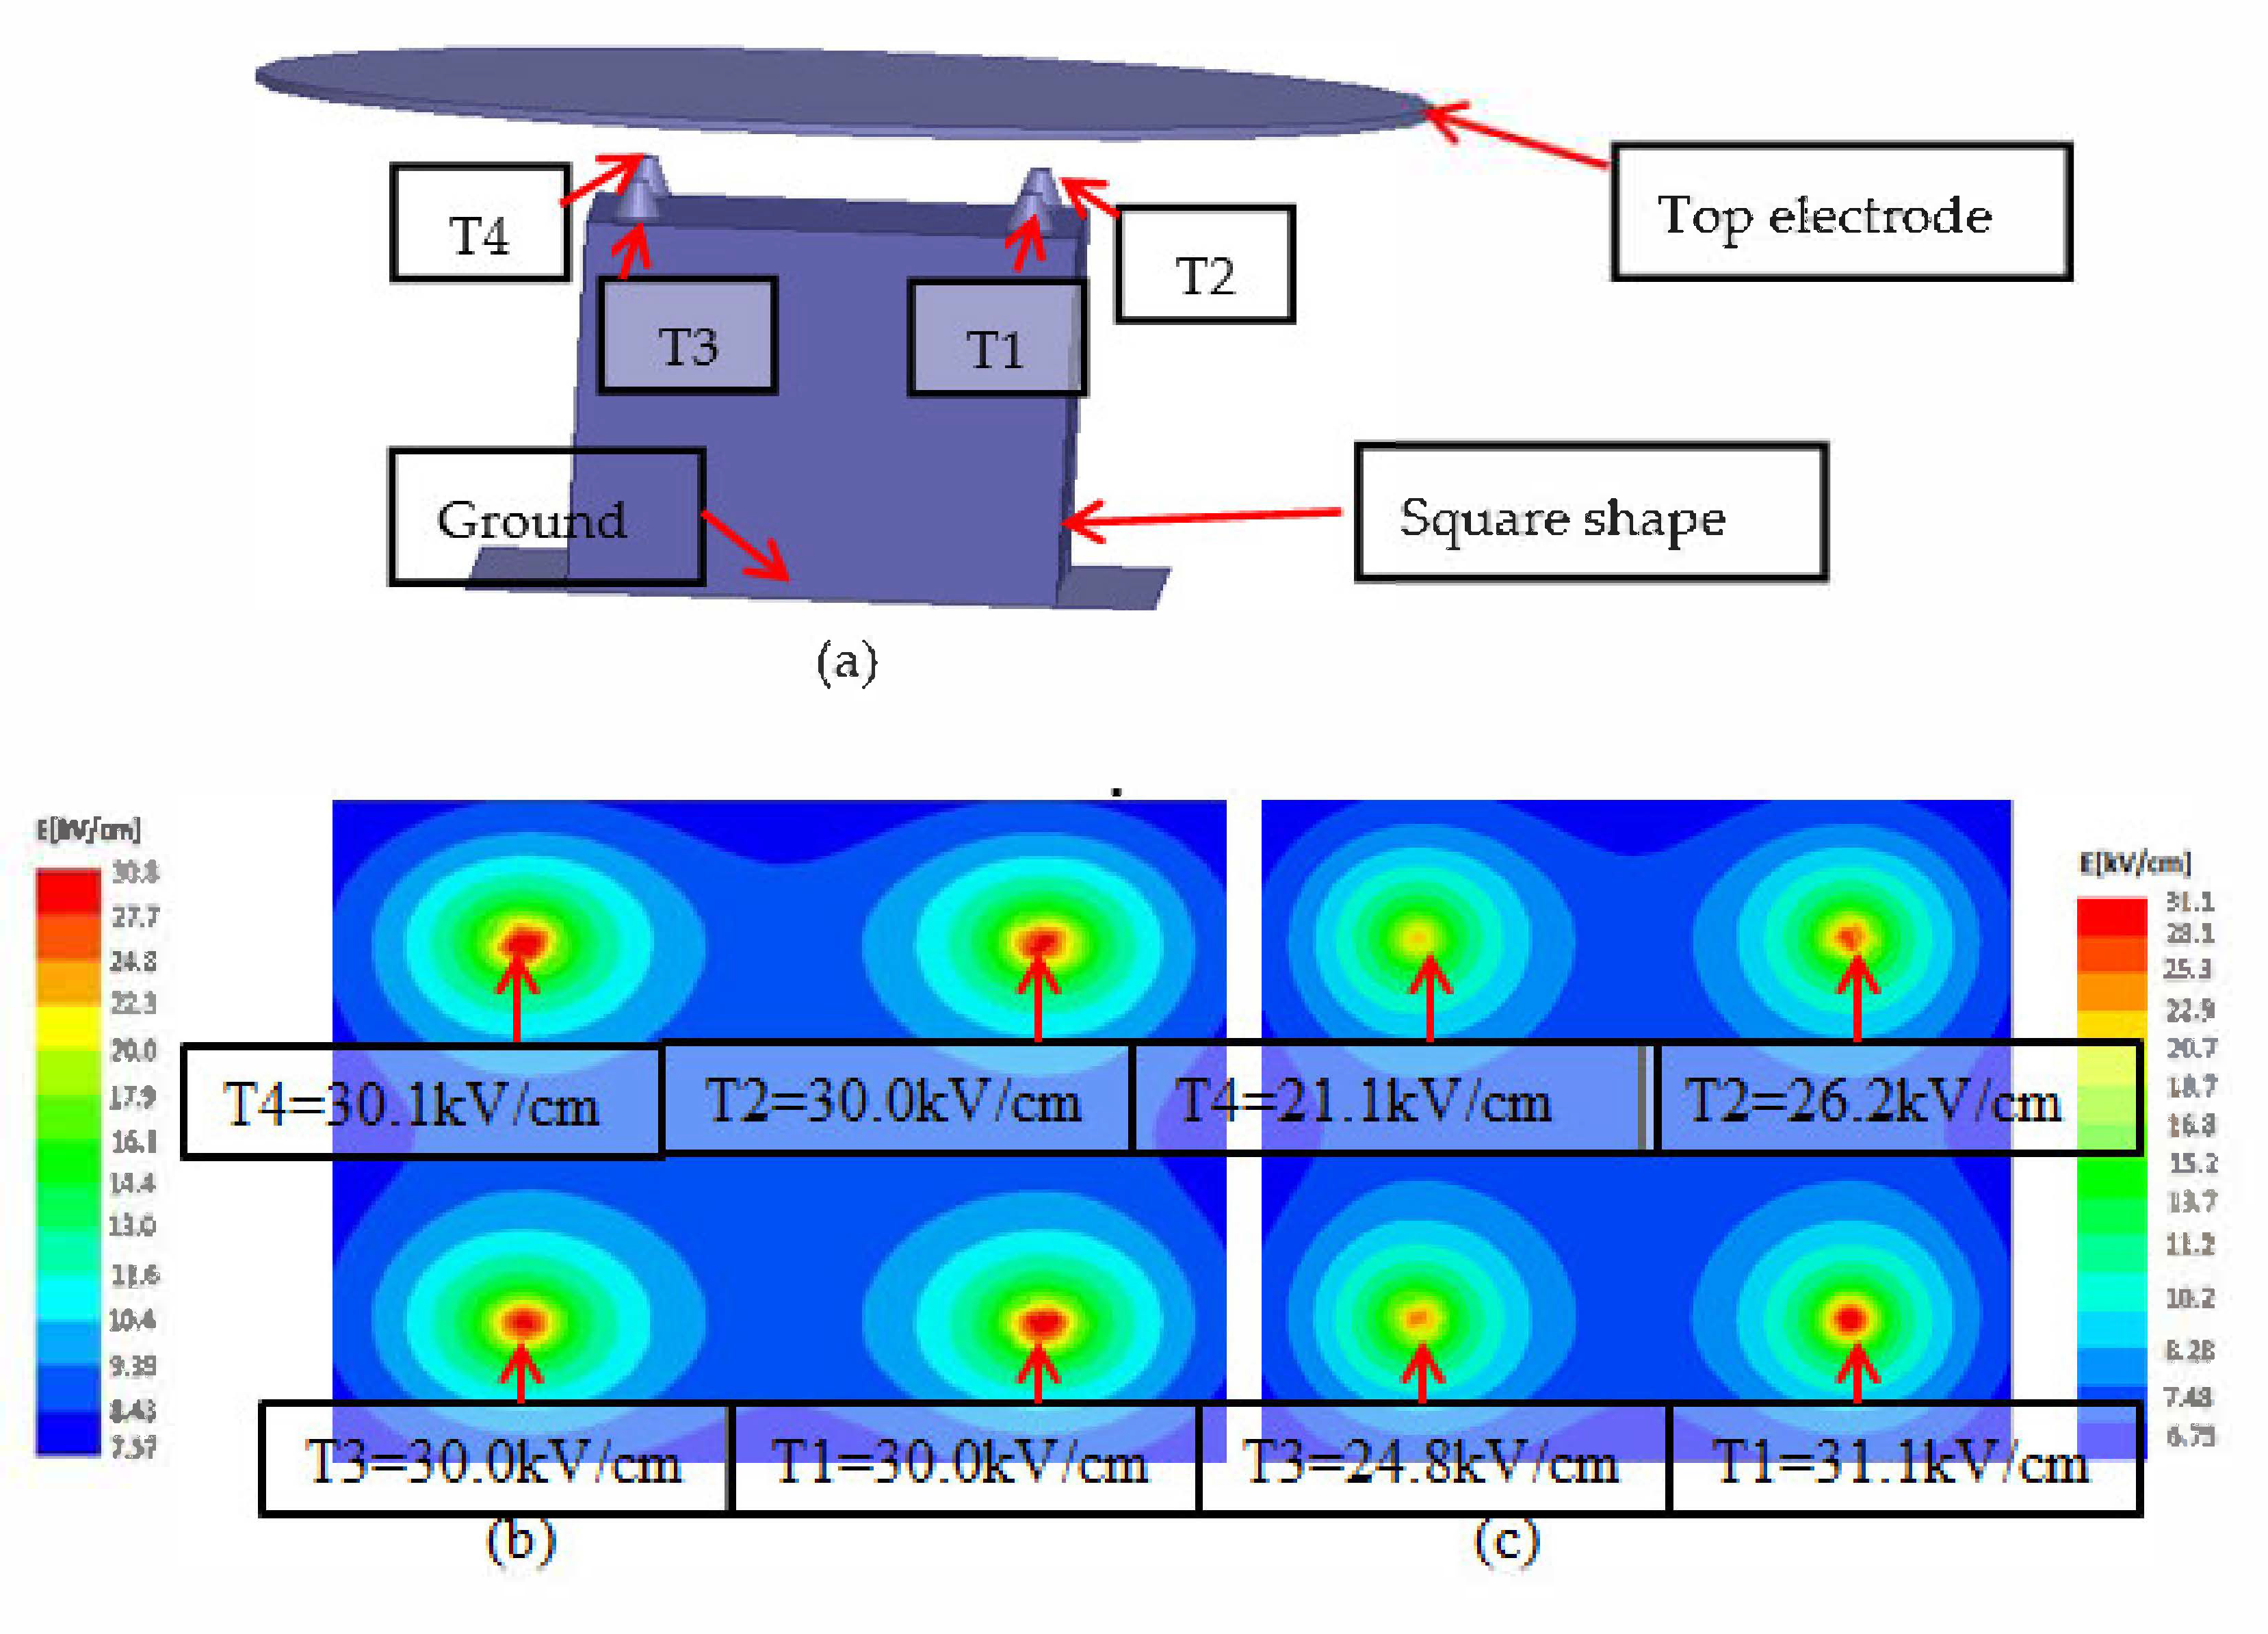
Energies 15 06597 g010
Figure 11. Probability of lightning on a square shape model: (a) square shape, (b) field plot without upward leaders, (c) field plot with upward leaders.
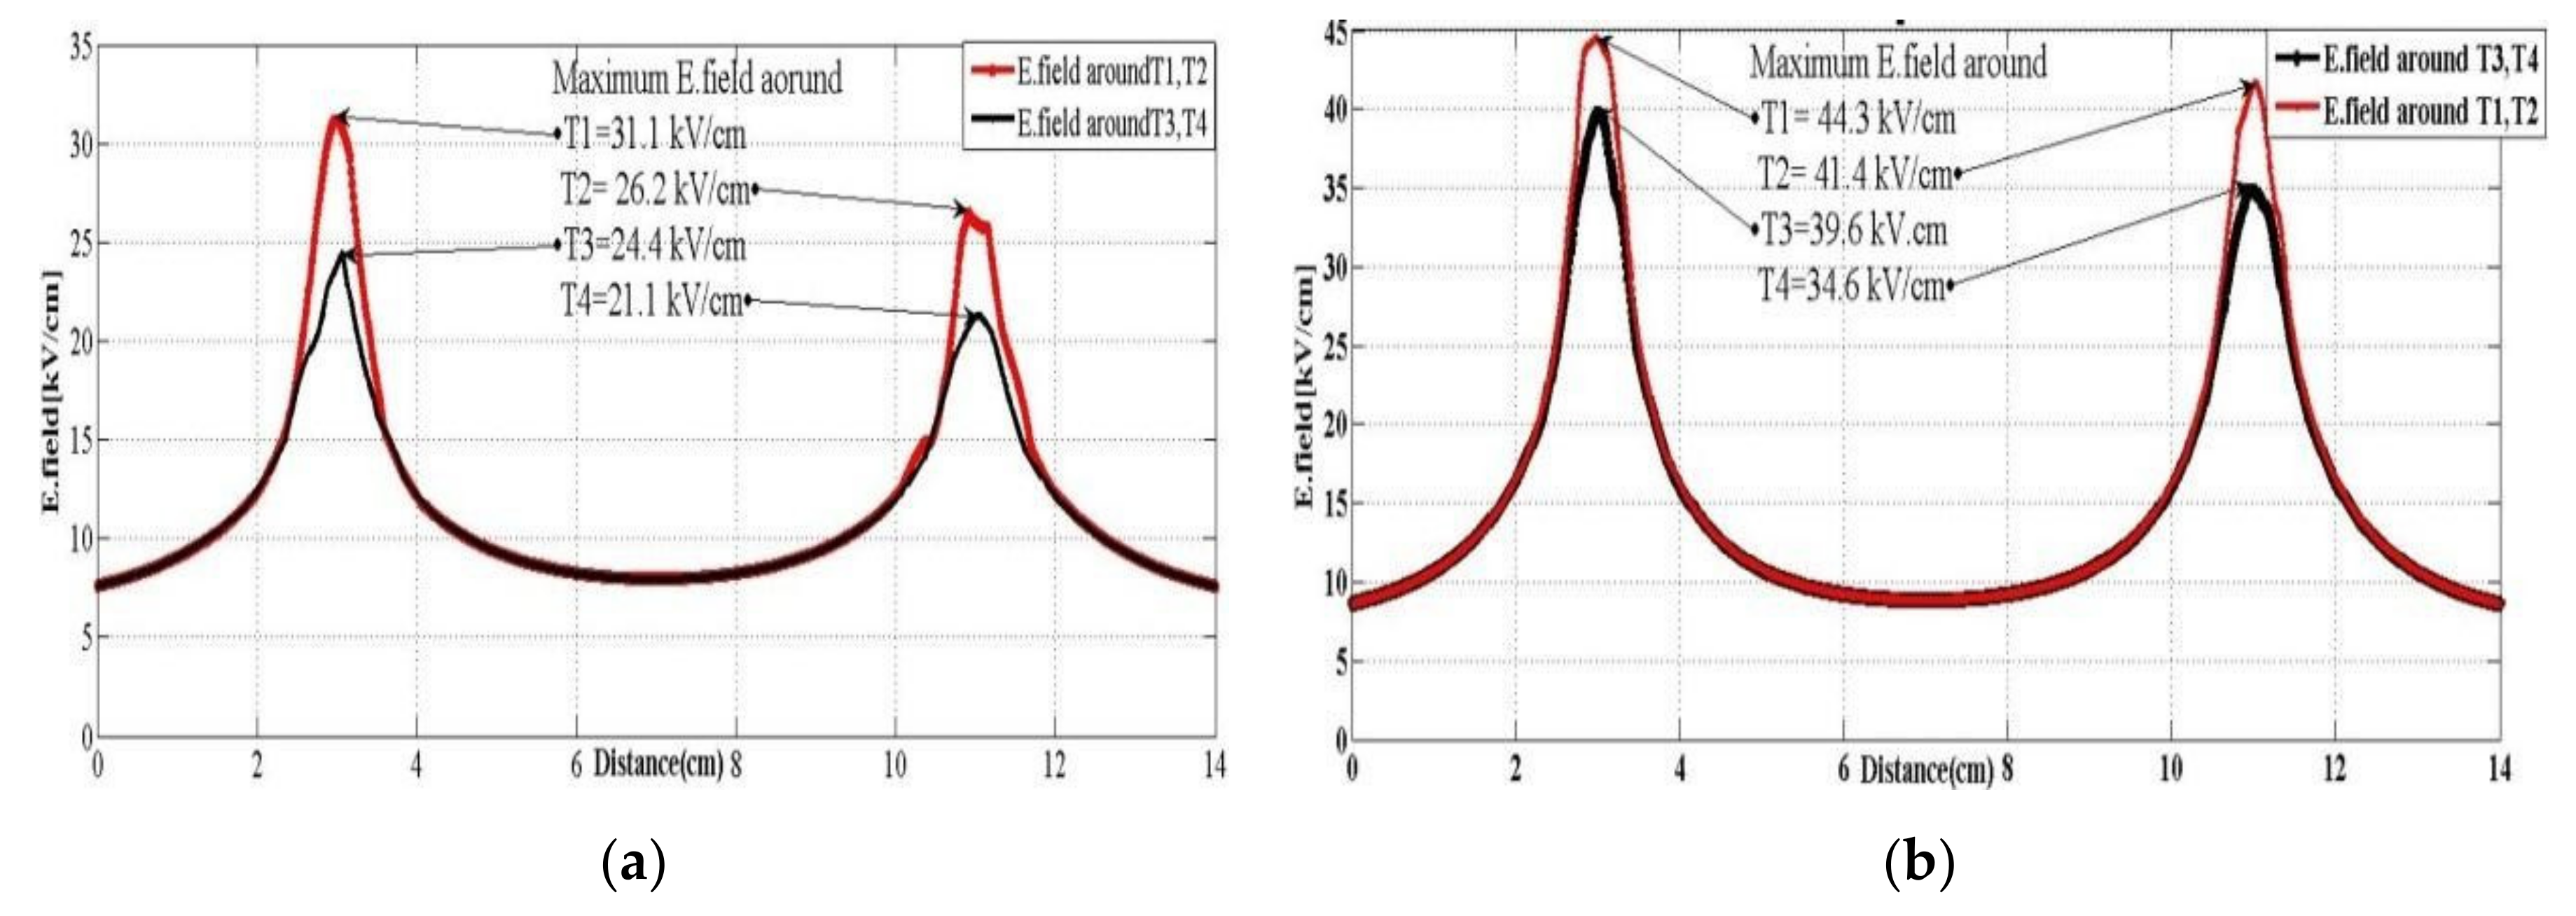
Energies 15 06597 g011
Figure 12. Electric field plot on an Square-shape geometrical structure with upward leader (a) and without upward leaders’ inception (b).
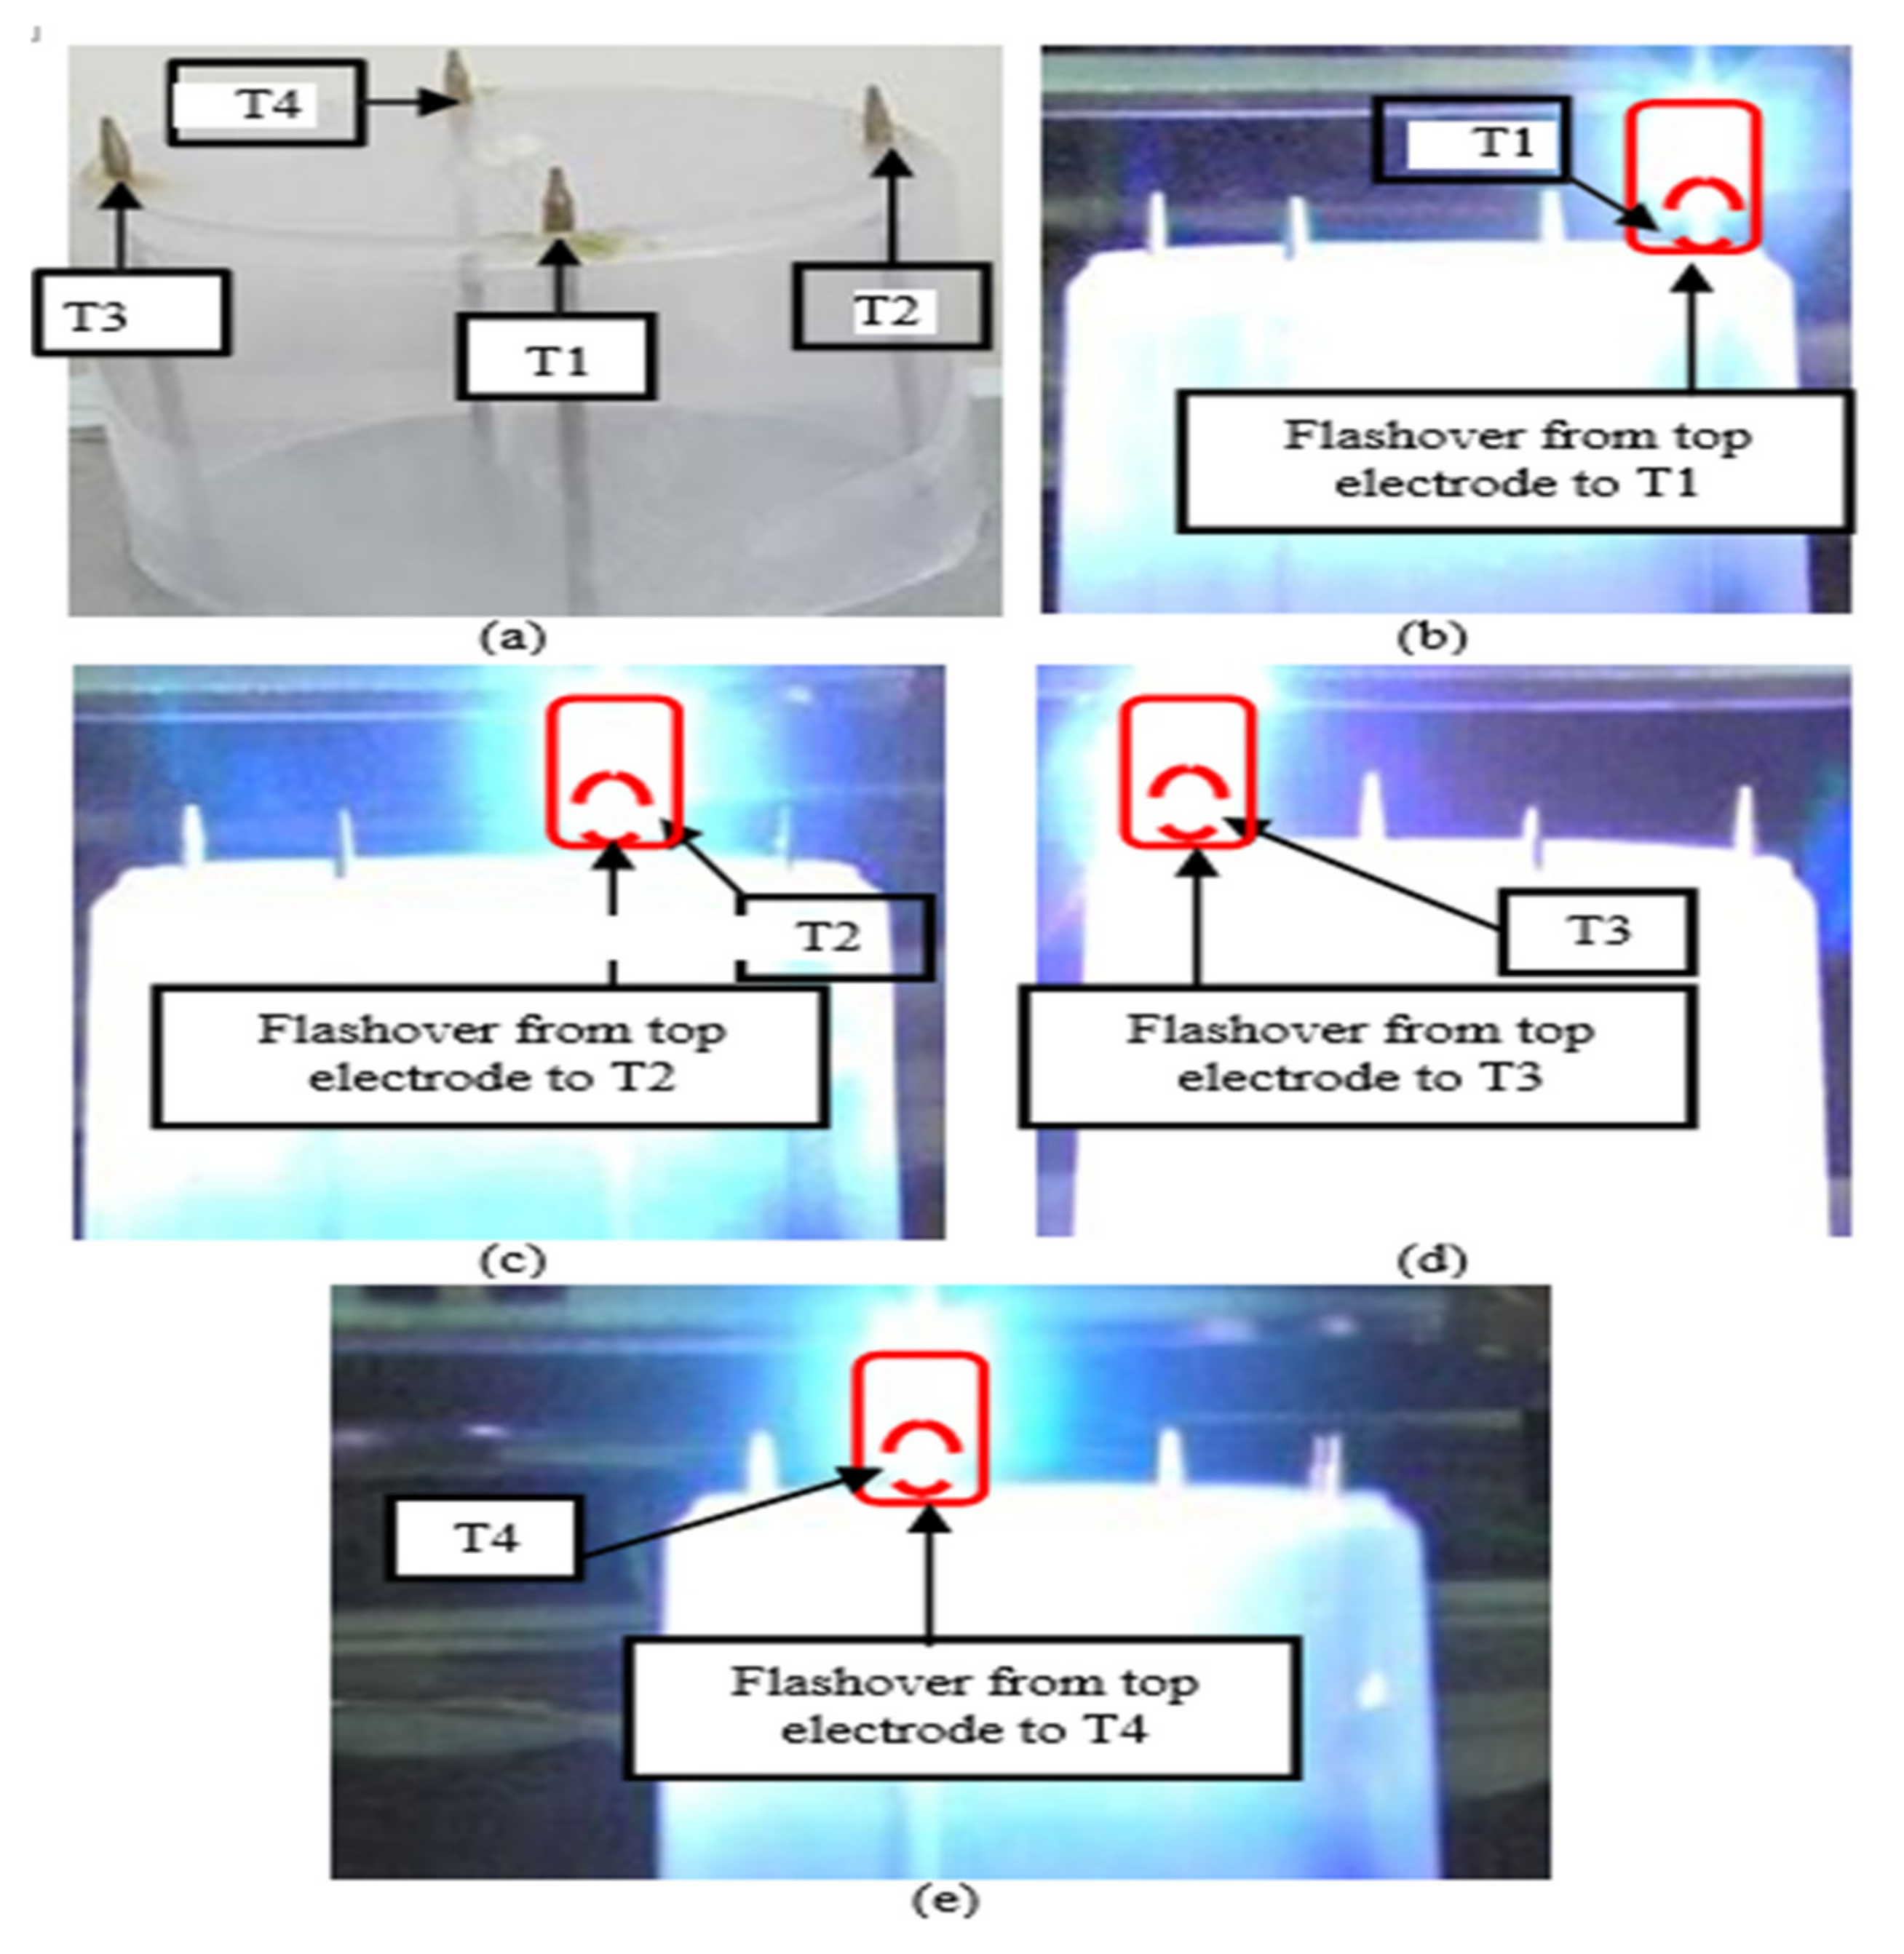
Energies 15 06597 g012
Figure 13. Lightning strike distribution on a cylindrical model: (a) scaled cylindrical shape, (b) strike on LAT1, (c) strike on LAT2, (d) strike on LAT3, (e) strike on LAT4.
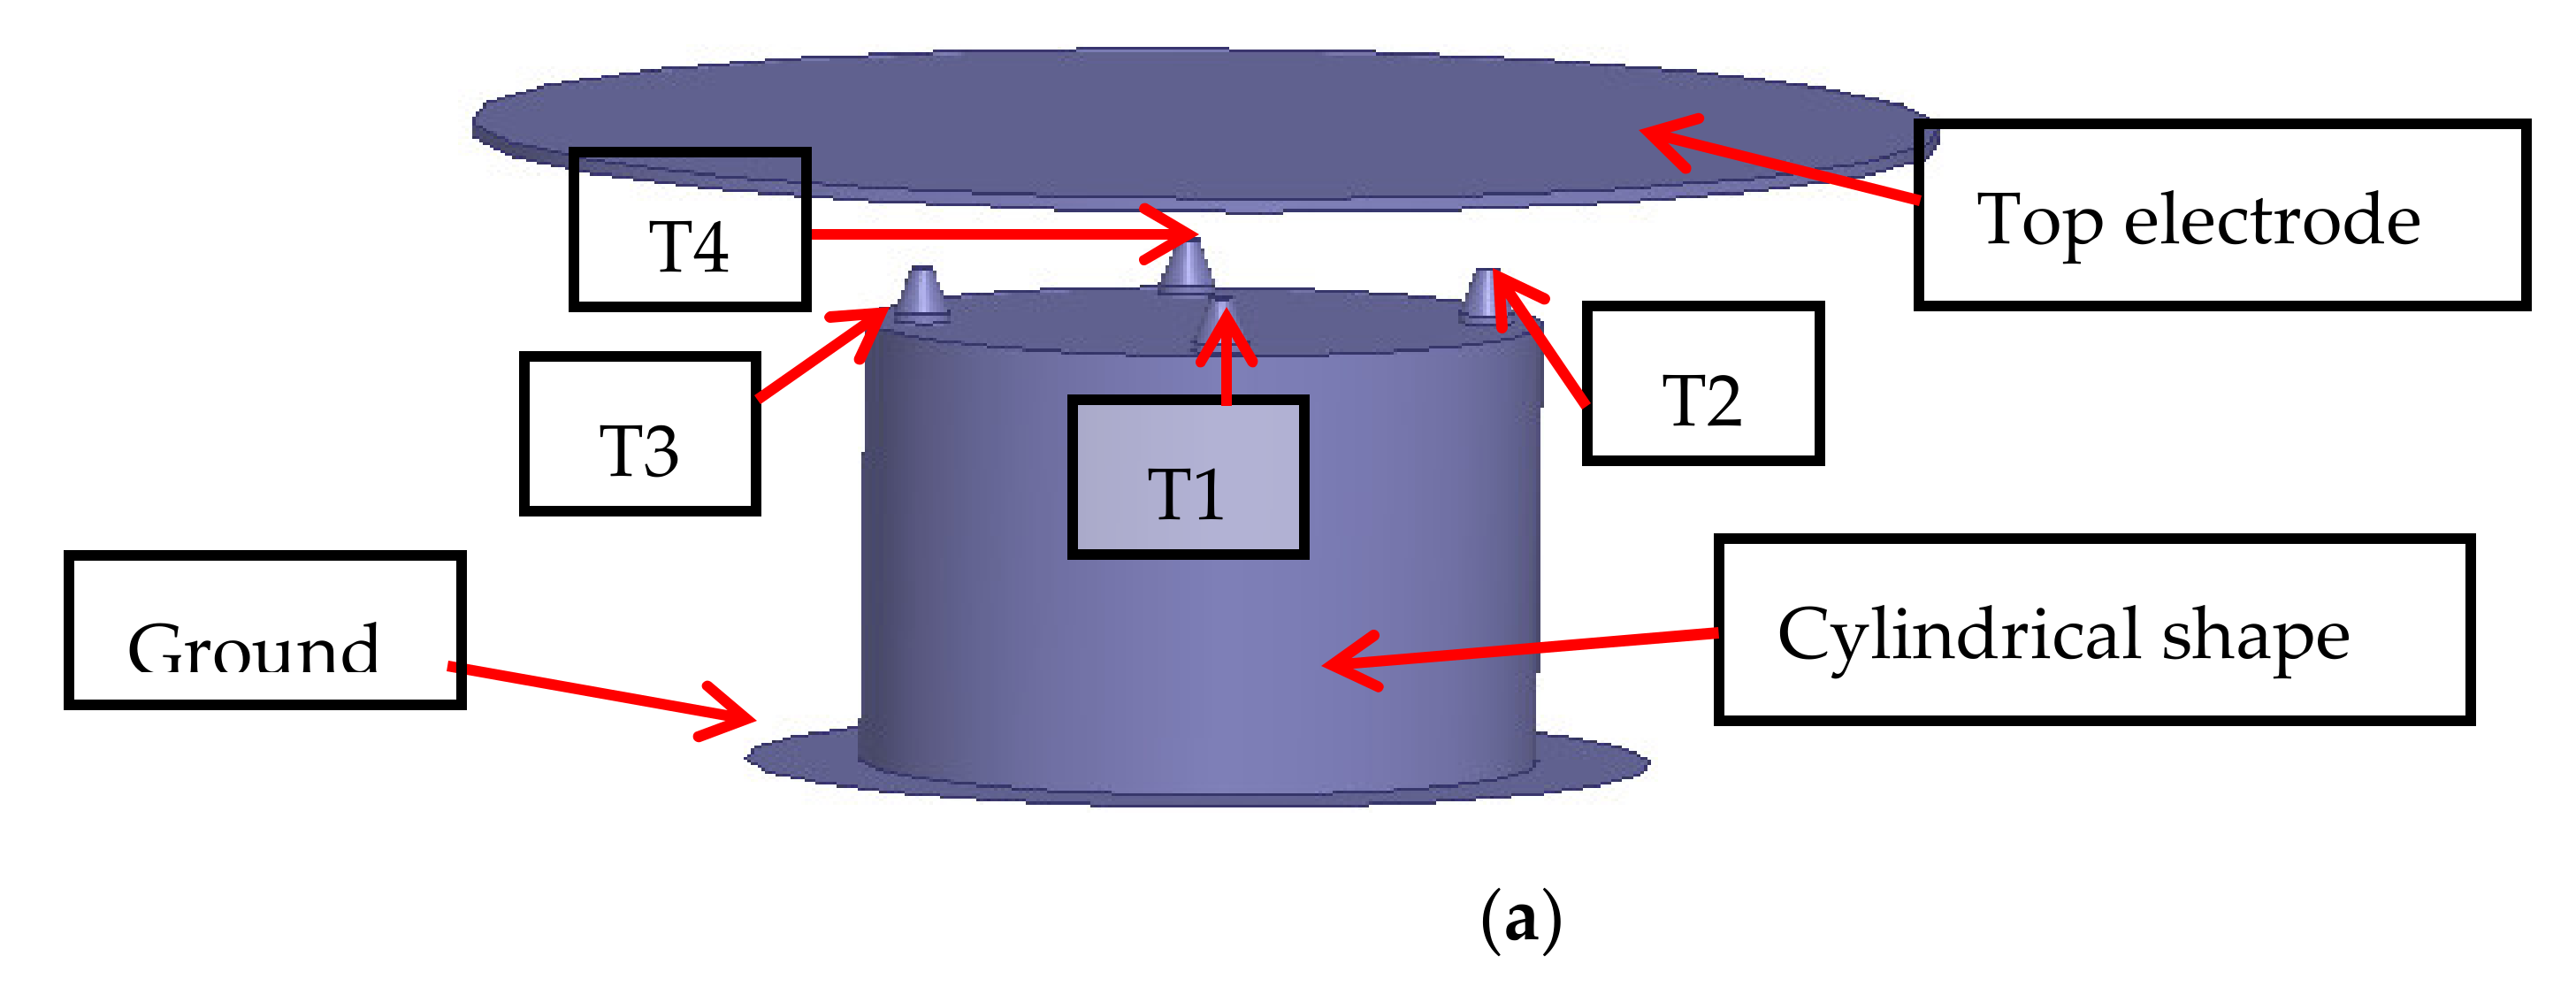
Energies 15 06597 g013
Figure 14. Probability of lightning on a cylindrical model: (a) circular shape, (b) field plot without upward leaders, (c) field plot with upward leaders.
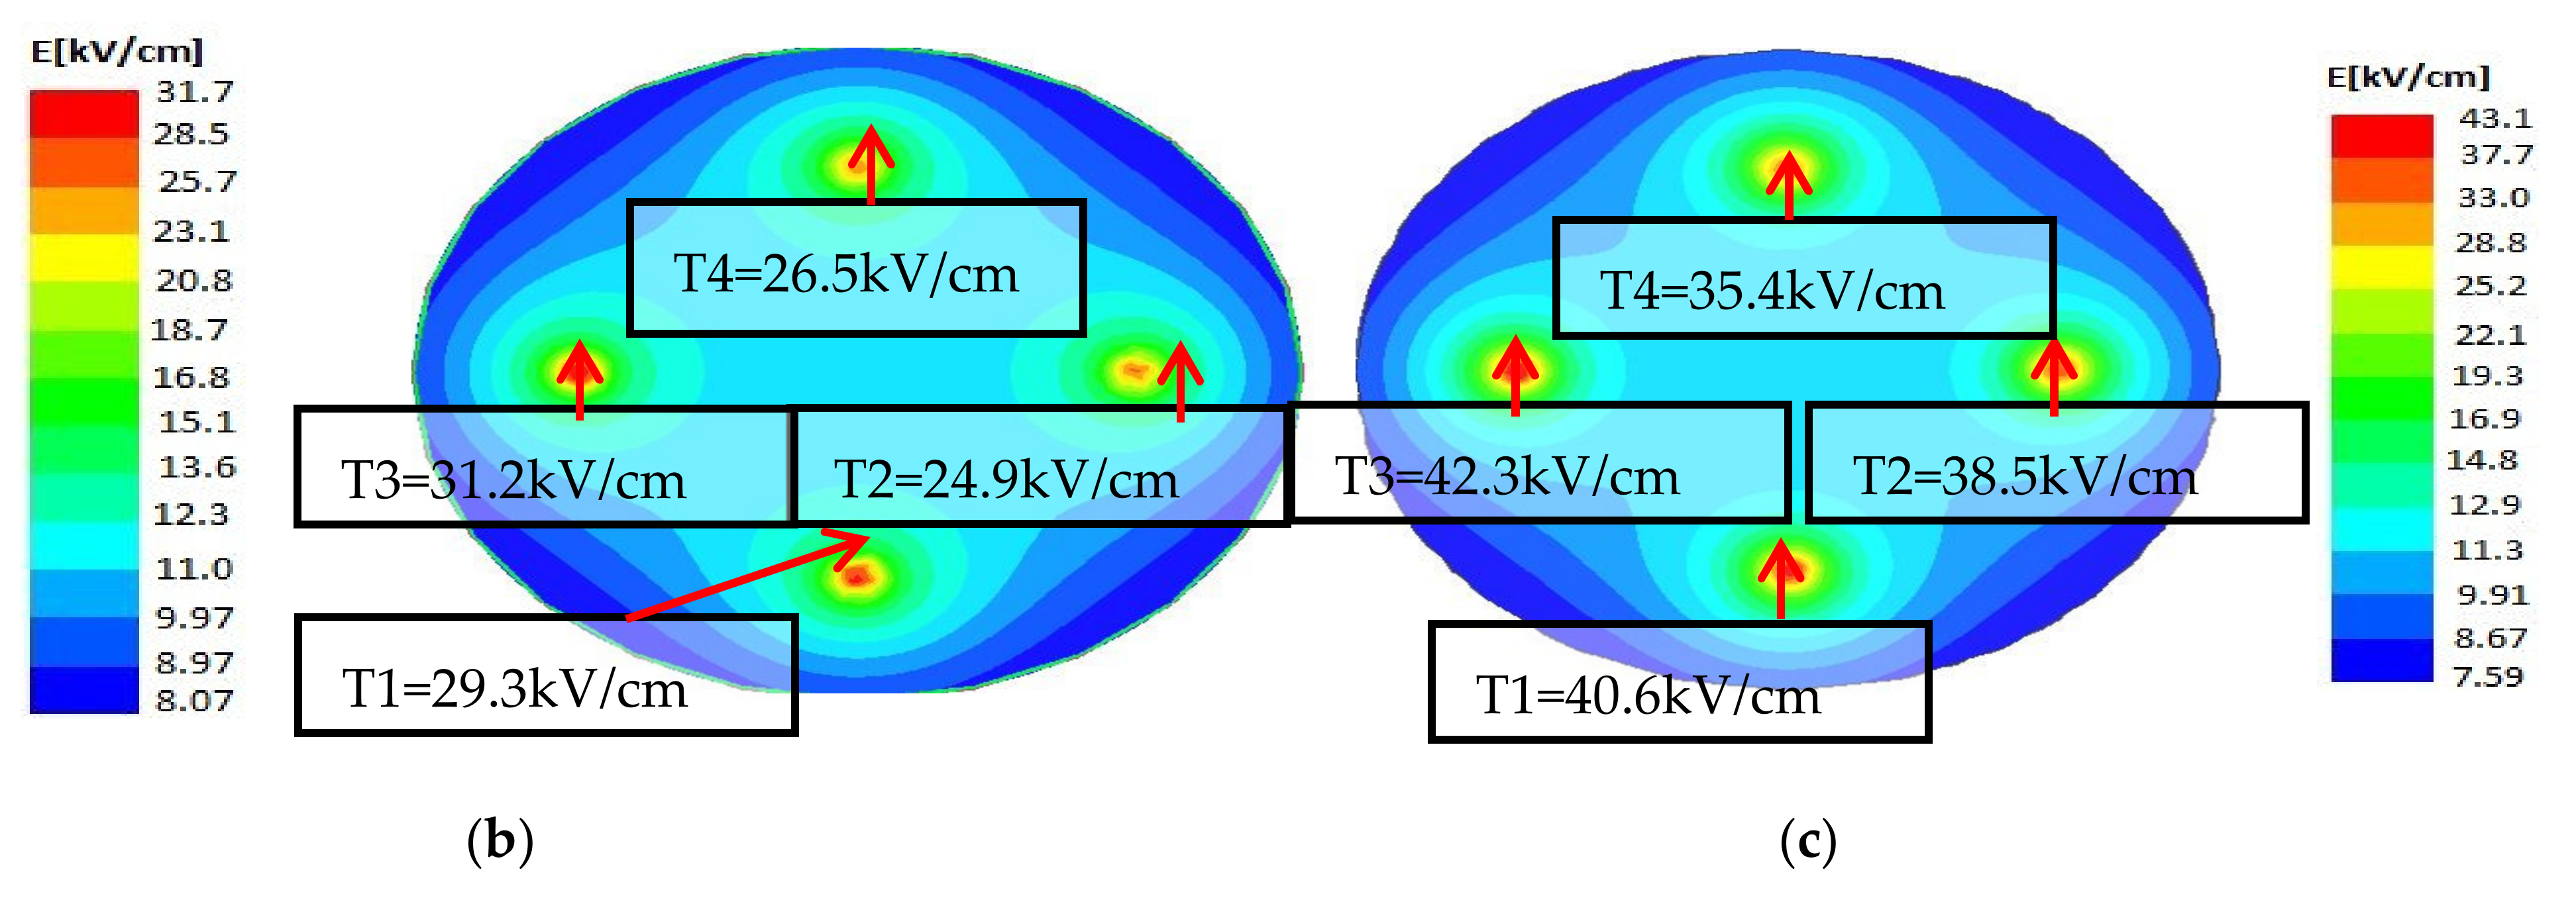
Energies 15 06597 g014aEnergies 15 06597 g014b
Figure 15. Probability of lightning strike on different points of a cylindrical structure (a) field value for normal pre-breakdown conditions, (b) field value for upward leader inception.
Energies 15 06597 g015
Figure 16. Lightning strike distribution on a pyramid-shape model: (a) scaled pyramid shape, (b) flashover on LAT1.
Energies 15 06597 g016
Figure 17. Probability of lightning on a pyramid-shape model: (a) 3D model of a pyramid shape (b) field plot without upward leaders, (c) field plot with upward leaders.
Energies 15 06597 g017
Figure 18. Probability of lightning strike on different points in a pyramid shape (a) field value for normal pre-breakdown conditions, (b) field value for upward leader inception.
Energies 15 06597 g018
Table 1. Number of strikes and electric field on LATs of a gable shape.
Installed Air TerminalsT1T2T3
Measured value of Lightning Strikes14313
Electric Field in normal conditions (kV/cm)30.923.530.3
Electric Field in the presence of upward leaders (kV/cm)36.830.135.1
Table 2. Probability of lightning strikes on gable shape.
Installed Air TerminalsT1T2T3
The number of Lightning Strikes14313
Electric field in normal condition (kV/cm)30.923.530.3
Probability of strikes without upward leaders11211
Electric field in the presence of upward leaders (kV/cm)36.830.135.1
Probability of strikes with upward leaders14212
Table 3. Number of strikes and electric field on the LATs of an L-shape building.
Installed Air TerminalsT1T2T3
Number of Lightning Strikes91110
Electric field in normal conditions (kV/cm)24.730.026.5
Electric Field in the presence of upward leaders (kV/cm)35.542.240.2
Table 4. Probability of lightning strikes on an L-shape building.
Installed Air TerminalsT1T2T3
Number of lightning strikes91110
Electric Field in normal conditions (kV/cm)24.730.026.5
Probability of strikes without upward leaders586
Electric field with the introduction of upward leaders (kV/cm)39.542.440.2
Probability of strikes with upward leaders8119
Table 5. Number of strikes and electric field on the LATs of a square-shape building.
Installed Air TerminalsT1T2T3T4
Number of lightning strikes10875
Electric field in normal condition (kV/cm)31.126.224.124.1
Electric field with the introduction of upward leaders (kV/cm)44.441.339.634.6
Table 6. Probability of lightning strikes on a square-shape building.
Installed Air TerminalsT1T2T3T4
Number of lightning strikes10875
Electric field in normal condition (kV/cm)31.126.224.121.4
Probability of strikes without upward leaders7442
Electric field with the introduction of upward leaders (kV/cm)44.441.339.634.6
Probability of strikes with upward leaders10764
Table 7. Number of strikes and electric field on the LATs of a cylindrical building.
Installed Air TerminalsT1T2T3T4
Number of lightning strikes8796
Electric field in normal conditions (kV/cm)29.324.931.226.5
Electric field with the introduction of upward leaders (kV/cm)44.441.339.634.6
Table 8. Probability of lightning strikes on a cylindrical building.
Installed Air TerminalsT1T2T3T4
Number of lightning strikes8796
Electric field in normal condition (kV/cm)29.324.931.226.5
Probability of strikes without upward leaders6474
Electric field with the introduction of upward leaders (kV/cm)40.638.542.335.4
Probability of strikes with upward leaders8695
Table 9. Number of strikes and electric field on a pyramid-shape building.
Installed Air TerminalsT1T2–T5
Number of lightning strikes30.0NIL
Electric field in normal conditions (kV/cm)28.5
Electric field with the introduction of upward leaders (kV/cm)44.0
Table 10. Probability of lightning strikes on a pyramid-shape building.
Installed Air TerminalsT1T2–T5
Number of lightning strikes30.0NIL
Electric Field in normal conditions (kV/cm)28.5
Probability of strikes without upward leaders19NIL
Electric field with the introduction of upward leaders (kV/cm)44.0
Probability of strikes with upward leaders30
Publisher’s Note: MDPI stays neutral with regard to jurisdictional claims in published maps and institutional affiliations.

