Article

An Optimized Solution for Fault Detection and Location in Underground Cables Based on Traveling Waves

1
Electrical Engineering Section, British Malaysian Institute, Universiti Kuala Lumpur, Bt. 8, Jalan Sungai Pusu, Gombak 53100, Selangor, Malaysia
2
Department of Electrical Engineering, Government College University, Lahore 54000, Pakistan
3
Faculty of Engineering and Technology, Future University in Egypt, New Cairo 11835, Egypt
4
Department of Information and Communication Engineering, Yeungnam University, Gyeongsan 38541, Korea
5
Fuculty of Computers and Artificial intelligene, Cairo University, Giza 3750010, Egypt
6
Faculty of Engineering, University de Moncton, Moncton, NB E1A3E9, Canada
7
International Institute of Technology and Management, Commune d’Akanda, Libreville BP 1989, Gabon
8
Spectrum of Knowledge Production & Skills Development, Sfax 3027, Tunisia
9
Department of Electrical and Electronic Engineering Science, School of Electrical Engineering, University of Johannesburg, Johannesburg 2006, South Africa
*
Authors to whom correspondence should be addressed.
Energies 2022, 15(17), 6468; https://doi.org/10.3390/en15176468
Submission received: 2 August 2022 / Revised: 28 August 2022 / Accepted: 2 September 2022 / Published: 5 September 2022

Abstract

:
Faults in the power system affect the reliability, safety, and stability. Power-distribution systems are familiar with the different faults that can damage the overall performance of the entire system, from which they need to be effectively cleared. Underground power systems are more complex and require extra accuracy in fault detection and location for optimum fault management. Slow processing and the unavailability of a protection zone for relay coordination are concerns in fault detection and location, as these reduce the performance of power-protection systems. In this regard, this article proposes an optimized solution for a fault detection and location framework for underground cables based on a discrete wavelet transform (DWT). The proposed model supports area detection, the identification of faulty sections, and fault location. To overcome the abovementioned facts, we optimize the relay coordination for the overcurrent and timing relays. The proposed protection zone has two sequential stages for the current and time at which it optimizes the current and time settings of the connected relays through Newton–Raphson analysis (NRA). Moreover, the traveling times for the DWT are modeled, which relate to the protection zone provided by the relay coordination, and the faulty line that is identified as the relay protection is not overlapped. The model was tested for 132   kV / 11 kV and 16-node networks for underground cables, and the obtained results show that the proposed model can detect and locate the cable’s faults speedily, as it detects the fault in 0.01 s, and at the accurate location. MATLAB/Simulink (DigSILENT Toolbox) is used to establish the underground network for fault location and detection.

1. Introduction

Faults detection in underground cables has a critical linkages in the electricity system, which is dependent on their protection scheme [1]. The faults in underground cables cause significant economic losses. The effective way to limit the economic damage produced by these failures is a quick recovery and fault detection and location [2,3]. Speedy fault recovery can overcome customer complaints, the downtime duration, revenue loss, and crew repair costs. Some methods for locating faults in cable systems are harmful and not user friendly. There are two methods (i.e., offline and online) for locating the faults in underground cables, while there are two types of offline approaches: the terminal and tracer methods [4]. The online approach calculates the unknown fault distance using recorded fault current and voltage data [5]. The latest trends are related to the online approach. A variety of factors influence the performance of underground cables: the response time, the aging factor, no protection for the faulty zone, and no relay coordination [6]. The impact of these factors on the system performance is high. For example, old cables can change the capacitance in three-phase systems. This change can further affect the accuracy of fault-location processes that depend on cable-manufacturing factors [7]. The latest trends are based on digitized fault detectors for amassing the information to discover the defects in this investigation. These devices record the voltage and current samples for postdisruption analysis during a power-system disturbance. Many digital fault recorders are now available at a reasonable price, which has allowed them to be employed at critical substations [8]. Similarly, the wavelet-transform (WT) method is practiced for detecting and locating the faulty component with a high-frequency approach [9]. The required information regarding the faulty zone is obtained by synchronized model voltage signals from both ends of the cable lines. High-frequency signals are systematized in the WT to detect the changes connected to the discontinuity spots on the lines.
The alternative-transients-program (ATP) approach is proposed in [10] for digitized fault detectors, whereas the suggested technique finds the exact fault location in older cables. It is also notable that factors such as the fault type, fault resistance, fault-inception angle, and system configurations did not affect the performance of ATP simulations [11]. High-voltage direct current (HVDC) transmission technologies are viable alternatives to HVAC transmission systems in overhead lines, but for environmental and safety reasons, underground cables are preferable to overhead lines in built-up places. In fault detection, the high capacitance of overhead lines in the high-voltage alternating current (HVAC) operation can be challenging [12].
Moreover, the WT needs an effective communication link to gather accessibility and data-quantity information. It is also difficult to detect and differentiate the reflecting waves, and especially for faults near the surface. A WT methodology for fault location is presented in [12], where reflecting waves are completely segregated across a large area of the cables. At the same time, a communication link is provided for traveling wave information. A fault-location approach for a large distribution network needs transient current data that are collected at a few line terminals. The protective zone needs proper relay coordination for accurate fault detection. It collects the measurements of the current and voltage in the presence of circuit breakers (CBs) on all lines, as shown in Figure 1. Furthermore, power will probably not be available to all line terminals for measuring instruments because a method for identifying the faults on transmission lines is connected in a star configuration [13]. WT technology is being observed in the latest research for fault detection [14], and this research work provides a novel solution for fault detection and location in underground cables using a discrete wavelet transform (DWT).
The main contributions of this work are summarized as follows:
  • A novel fault detection and location framework for underground cables based on a DWT is developed;
  • The proposed model efficiently identifies the faulty sections and fault locations where coordination schemes optimize the overcurrent-relay and timing-relay coordination;
  • The DWT approach for the objectives mentioned above is modeled to facilitate the protective zone, analyzed by Newton–Raphson analysis (NRA), more accurately;
  • The model is tested for 132   kV / 11 kV and 16-node networks for underground cables, and it obtained a remarkable improvement in accurately detecting and locating the cable’s faults.
The paper is organized as follows. Section 2 summarizes the related work in fault-detection location for underground cable networks. The modeling of a DWT for fault location is accomplished in Section 3. Section 4 presents the research methodology in which the protective-zone coordination and faulty-section detection are carried out. Section 5 describes the MATLAB setup used for the proposed model. The results, discussion, and conclusion of the article are described in Section 6 and Section 7.

2. Literature Review

Researchers have shown an interest in underground fault detection since the late 1980s. As mentioned above, different methodologies have been developed for identifying the faults in underground cables that have a huge impact on transmission lines. The first thing related to a WT is a multiresolution analysis (MRA) or DWT, as it is required for detecting the fault. An online WT algorithm evaluates the line currents with two terminal approaches, where the MRA identifies the fault. The scale of spikes related to the wavelet coefficients is also used for the detection of faults, as well as the process of classification [15]. A smooth and efficient coefficient evaluation of a neutral current separates the key faults in different phases. With a mixture of impedance design and calculation, and the continuous-wavelet-transforms (CWT) method, Reddy’s designed model is used to identify the disturbances and the fault’s occurrence [16].
Different schemes are used to identify specific faulty phases for protecting the power system from the accident of transmission-line faults. The method uses WTs, neural networks (NNs), or sometimes both for dealing with the issue. The artificial neural network (ANN) determines a large difference between the associated and measured signals [17,18,19], and the transmission lines are then used to distribute the electric power at the main destination. Several issues are addressed using traveling waves for voltage and current signals in the transmission-line network. Determining the frequency components with the fault signal is one of them, and Fourier Transform is modeled to overcome this issue. Wavelet MRA, or DWT, plays an important role in signal analysis and is considered a consistent approach for the traveling of wave signals [20]. An underground cable fault-detection model is presented in [21]. It uses the global system for mobile communication (GSM) as a communication link in WT technology using a microcontroller. The method determines the fault in the underground line from the base stations in terms of kilometers [22]. Underground cable fault detection with the help of Raspberry Pi and Arduino to identify the fault’s location for underground cables is presented in [23]. It works on the simple and basic concept of relay coordination. In case of any fault (e.g., short circuit), the voltage drop depends on the length of the faulty cable, while the current due to the faulty cable varies. This fact operates the current transformer (CT) for calculating the difference or variance, and the signal conditioner deals with the change in the voltage [24]. A microcontroller is further used to make the necessary arithmetical calculations [25,26]. The Murray loop method is used for fault exposure, and this approach is quite straightforward for the direction and observation of short circuits in underground cables. The two loop tests are carried out to identify the faults in the underground cables depending on the Wheatstone-bridge law [27]. With this experiment, the fault with the underground cable is identified by the arrangement of a Wheatstone bridge. In this model, a sound cable with the same length as a faulty cable is connected where the sound cable decides whether it is faulty or not. A galvanometer is also attached at the beginning of both the faulty and sound lines [28]. After the connection, two different variable resistors are connected to the faulty and sound cables. Synchronized testing techniques, the investigation of the wavelet, and the standard of a voyaging wave also relate to CWT [29]. The hypothesis related to the peculiarity identification is used as a handling device for dealing with the issue associated with the multiend-matured-cable model. A model based on a DWT for fault detection in the DC microgrid is presented in [15], and MRA with a DWT has been used for developing the relationship between the WT and fault location. It also includes the support-vector machine and Gaussian process regression for the estimation of faults. DWT-based fault detection in a very short time for the HVDC network was tested, where the different faults were created for the various line locations using MATLAB/Simulink [30]. A single-line transmission network has been proposed for fault location using EMTP/ATP Draw software [31]. Artificial-intelligence-based approaches have also been used to identify faults [17,32]. A DWT-and-ZigBee model as a communication link was developed for underground cables for fault detection and relay coordination. The proper arrangement of relay algorithms has also been discussed, where different line parameters are taken into account [33]. Some classified methods are being approached for fault detection, in which the Lissajous figure is very common. These approaches record the three-phase voltages and the current of one terminal of the line, while the Lissajous figure is considered for the phase measurement of each phase [34,35,36]. A fault-detection locator based on a DWT was analyzed, in which the ANN approach was proposed for the estimation of the fault performances. The system model was designed for a 13-bus and 16-line network, and the delay time and location for the fault in kilometers were observed [37]. Different algorithms have also been proposed, such as the Stockwell transform, alienation coefficient, Wigner distribution function, and combined-fault index. In most cases, a DWT is used for the given algorithms [38,39,40]. The latest studies are focused on the DWT for fault detection [41], and different algorithms for the protection zone optimize the relay coordination [42]. A comparative analysis of the wavelet-transform methods for fault location is given in Table 1, in which the critical analysis of the literature review is performed.

3. Modeling of Wavelet Transform for Fault Location

CWT is a process that convolves the signal with the wavelet basis function, as shown in Figure 2, and the signal is further distinguished into different timeframes and frequency bands [44,45]. W f ( x , y ) is the expression for CWT, as follows:
W f ( x , y ) = f , ψ x , y ( t ) = 1 x + f ( t ) ψ ¯ ( t y x ) d t
where f , ψ x , y ( t ) is a CWT function, and x , y are used for the scaling and translation parameters, respectively. ψ x , y ( t ) defines the mother wavelet, filtered into various regions, such as high-frequency regions, with high frequency and high resolution [46]. The system understands the DWT, and the inputs are taken into account in the timeframe and frequency band for the high frequency and high resolution separately. The discretized function of Equation (1) is written as the following formula:
ψ x , y ( t ) = 1 x x 0 ( a / 2 ) ψ ( t k x o y o x o )
where x o , y 0 are used for the scaling and translation parameters, and ψ x , y ( t ) defines the mother wavelet of the discretized function, similar to the expression for the CWT in Equation (1).
A DWT was used in [47] and is modified as follows:
C a , b = f , ψ x , y ( t ) = x 0 ( a / 2 ) + f ( t ) ψ ¯ ( x 0 a t k y 0 ) d t
The discrete wavelet coefficient is C a , b . The DWT expression used in Equation (3) did not have enough of a spectrum as the actual project required, and decomposition was needed for expansion, as given by:
f , ψ x , y ( t ) = N c a , b ( 1 H P φ a + 1 ( t ) ) + k d a , b ( 1 L P φ j + 1 , l ( t ) )
where ( 1 H P φ a + 1 ( t ) ) a n d   1 L P φ j + 1 , l ( t ) are the decomposition items of the discrete wavelet coefficient ( C a , b ).
According to the two-terminal traveling-wavelet-location principle, when the fault occurs, the transient traveling wave plays a role in the wave propagation to both sides of the transmission line. Meanwhile, the phenomenon of refraction and reflection affect the impedance discontinuously [48]. There are two lines ( L 1   and   L 2 ) in which the distance of the fault point from F to L 1 is L 1 F , and the distance of the fault point from F to L 2 is L 2 F , as shown in Figure 3. The total length becomes L 12 , and the traveling-wavelet-propagation speed is v and is formulated as:
{ L 1 F = t L 1 v , L 2 F = t L 2 v , L 12 = L 1 F + L 2 F }
In this fault-locating algorithm, the DWT detects the transient-traveling-wavelet head, which is further used to locate the fault point and is written as:
L 12 = L 12 + v ( t L 1 t L 2 ) 2
A three-phase system was taken into account in which the electromagnetic coupling of each phase can affect the accuracy of the fault location. There is a need for such a transformation, in which three-phase nonindependent components are converted into mutually independent mode components, as per Clarke-transformation matrices [49]. The proposed model transformation is formulated as:
V α V β V γ = 1 3 [ 2 1 1 1 1 1 0 3 3 ] [ V a V b V c ]
I α I β I γ = 1 3 [ 2 1 1 1 1 1 0 3 3 ] [ I a I b I c ]
where V α , V β , and V γ are mutually independent mode components of three-phase voltages ( V a , V b , and V c ). Similarly, I α , I β , and I c are mutually independent mode components of three-phase currents ( I a , I b , and I c ). As earlier discussed, there is a need for different timeframes and frequency bands for the high frequency and high resolution. In this regard, I a , I b , and I c are separately differentiated to 3 I cos ( t ) , 3 I sin ( t ) , and 0, respectively. Similarly, V a , V b , and V c are separately differentiated to 3 I cos ( t ) , 3 I sin ( t ) , and 0, respectively.
The mathematical transformation of Equation (4) enables the frequency bands and the MRA as modeled in this section to capture all the fault locations in underground cables. In Figure 2a, the DWT has two discrete-level filters called high pass (HP) and low pass (LP). This transformation needs the input signals to transform into low-frequency components, and the output signals to transform into high-frequency components. Figure 2b shows the frequency bands of different bandwidths of a DWT. The frequency-band ranges, shown in Figure 3, are considered in rad/sec, and these are the responses of the scaling and wavelet functions for the DWT.

4. Research Methodology

The faults in underground cables disturb the stability and reliability of the power system. The modeling of a DWT is not enough to determine the location of the fault and speed up the necessary action. In this regard, a novel method is proposed that consists of the current relay and timing coordination as the protection coordination, and DWT methodology for the faulty-section detection.

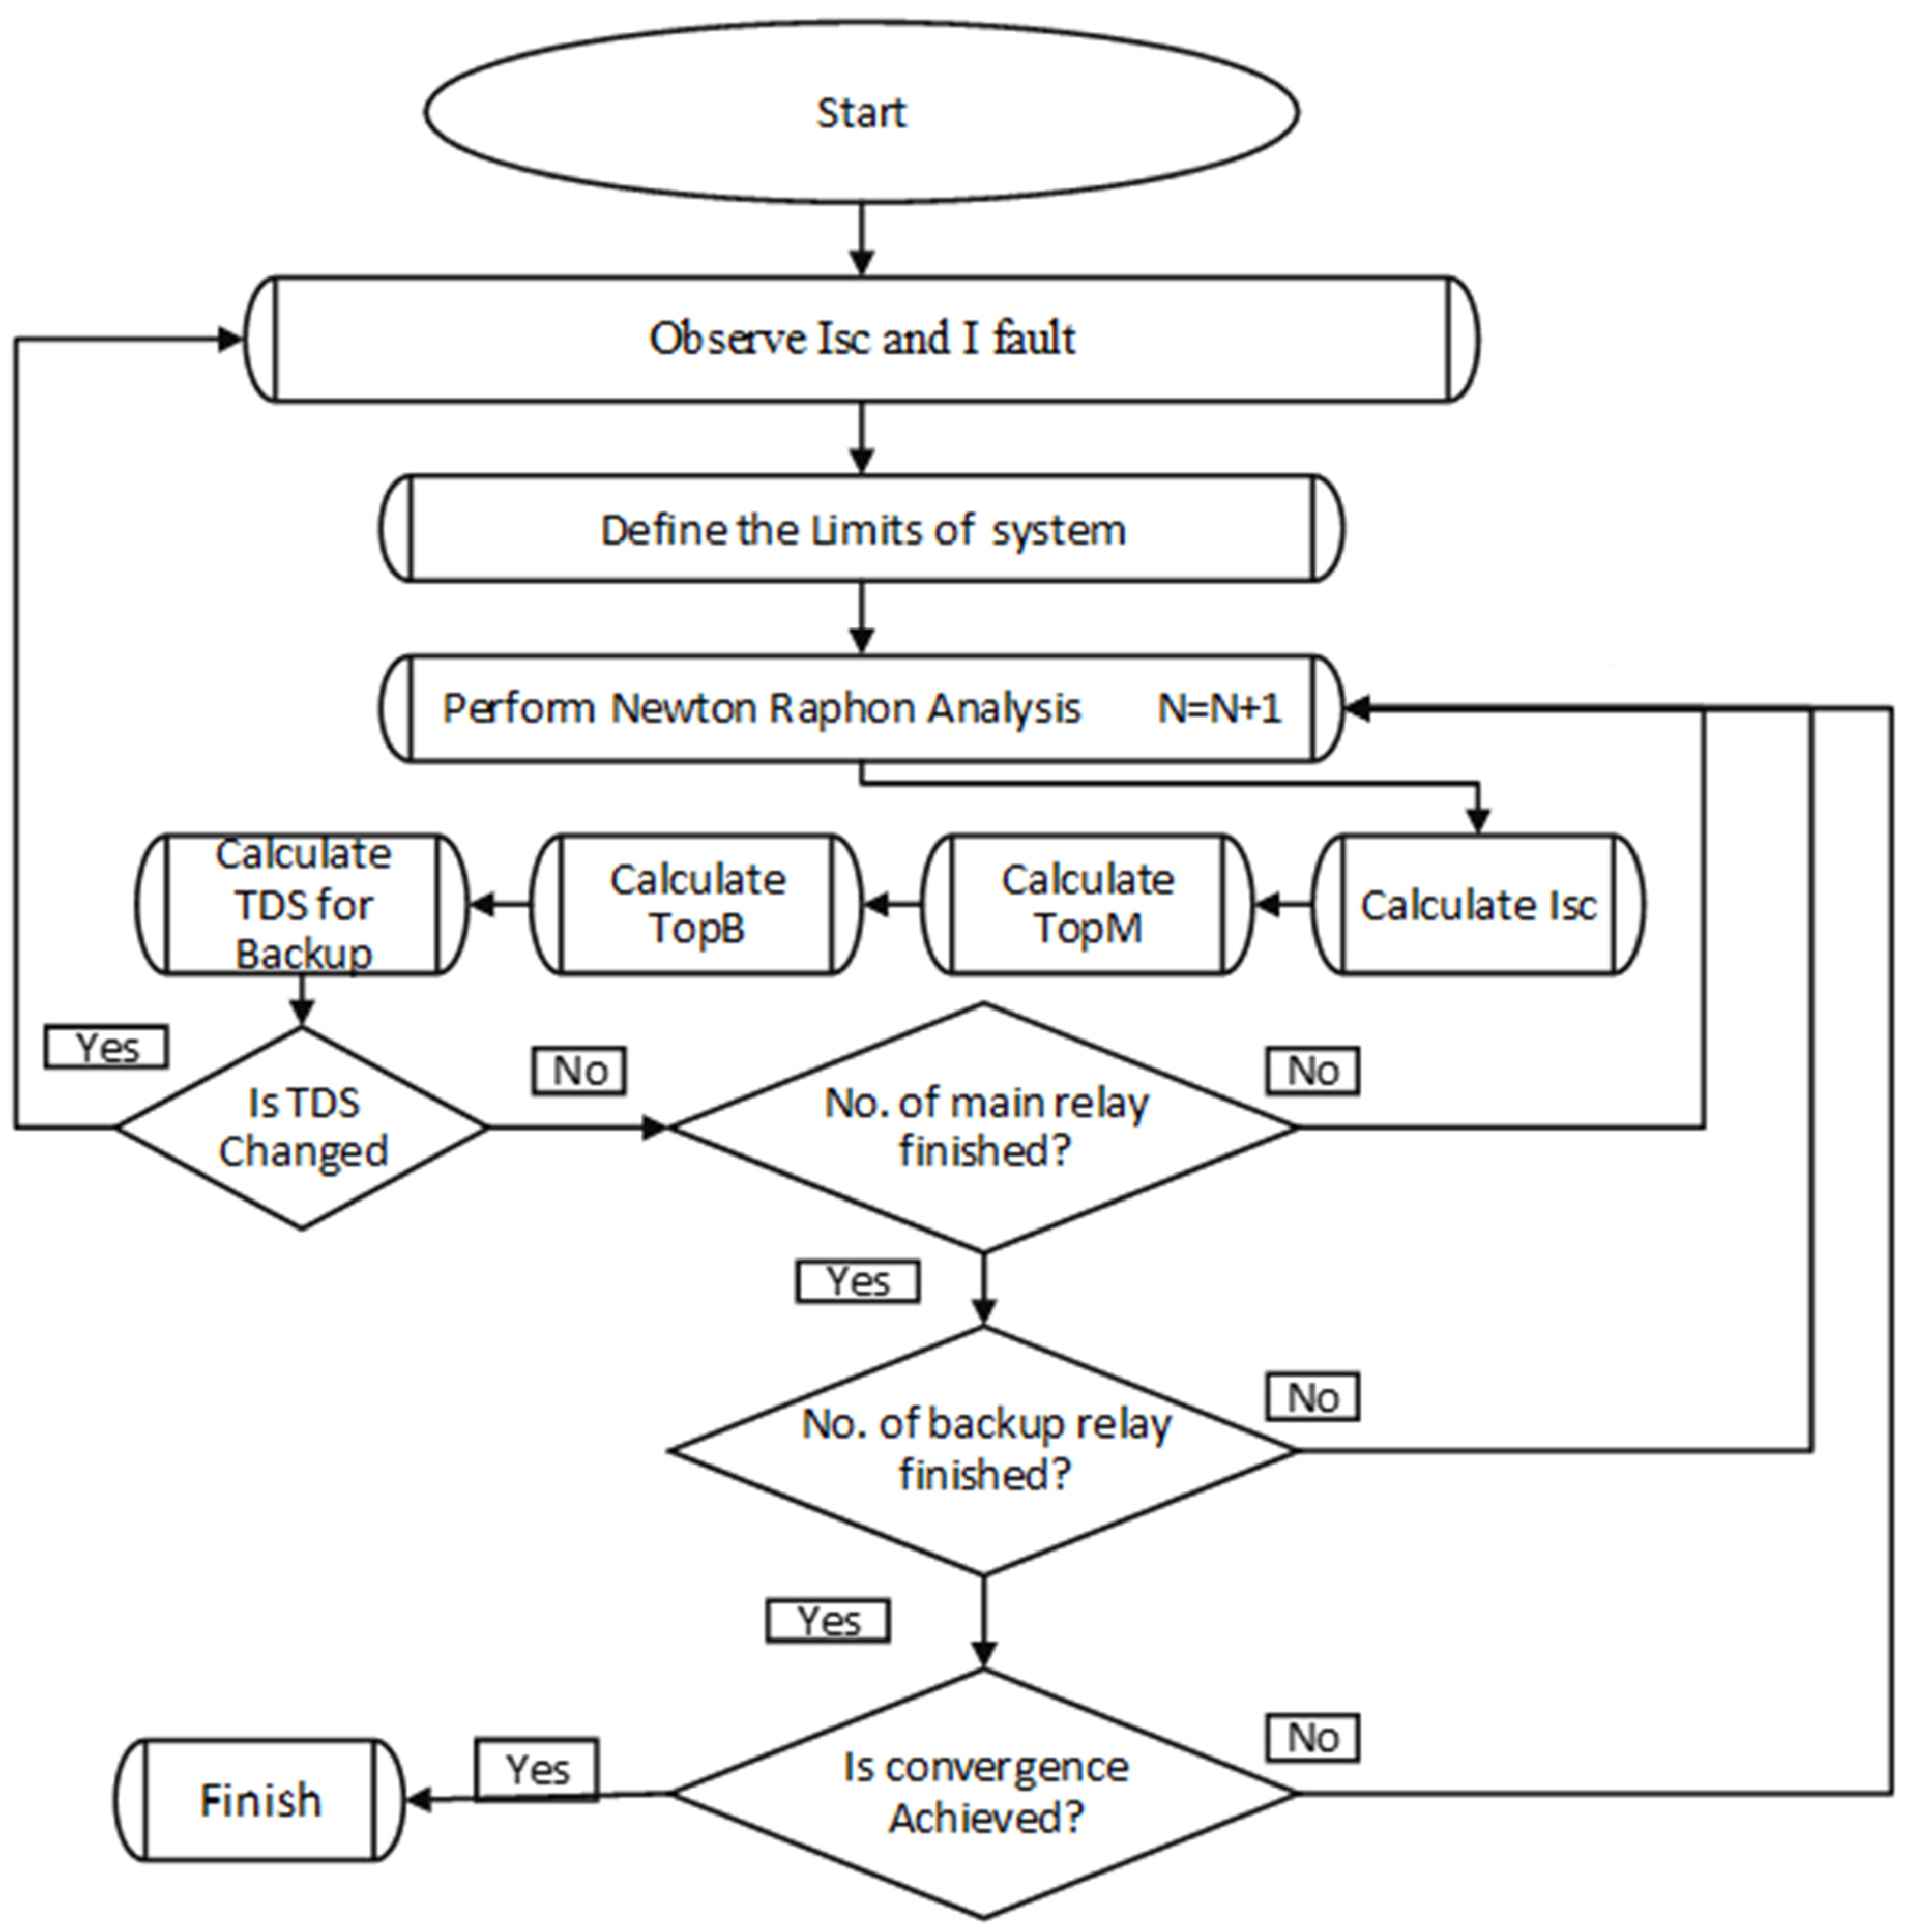
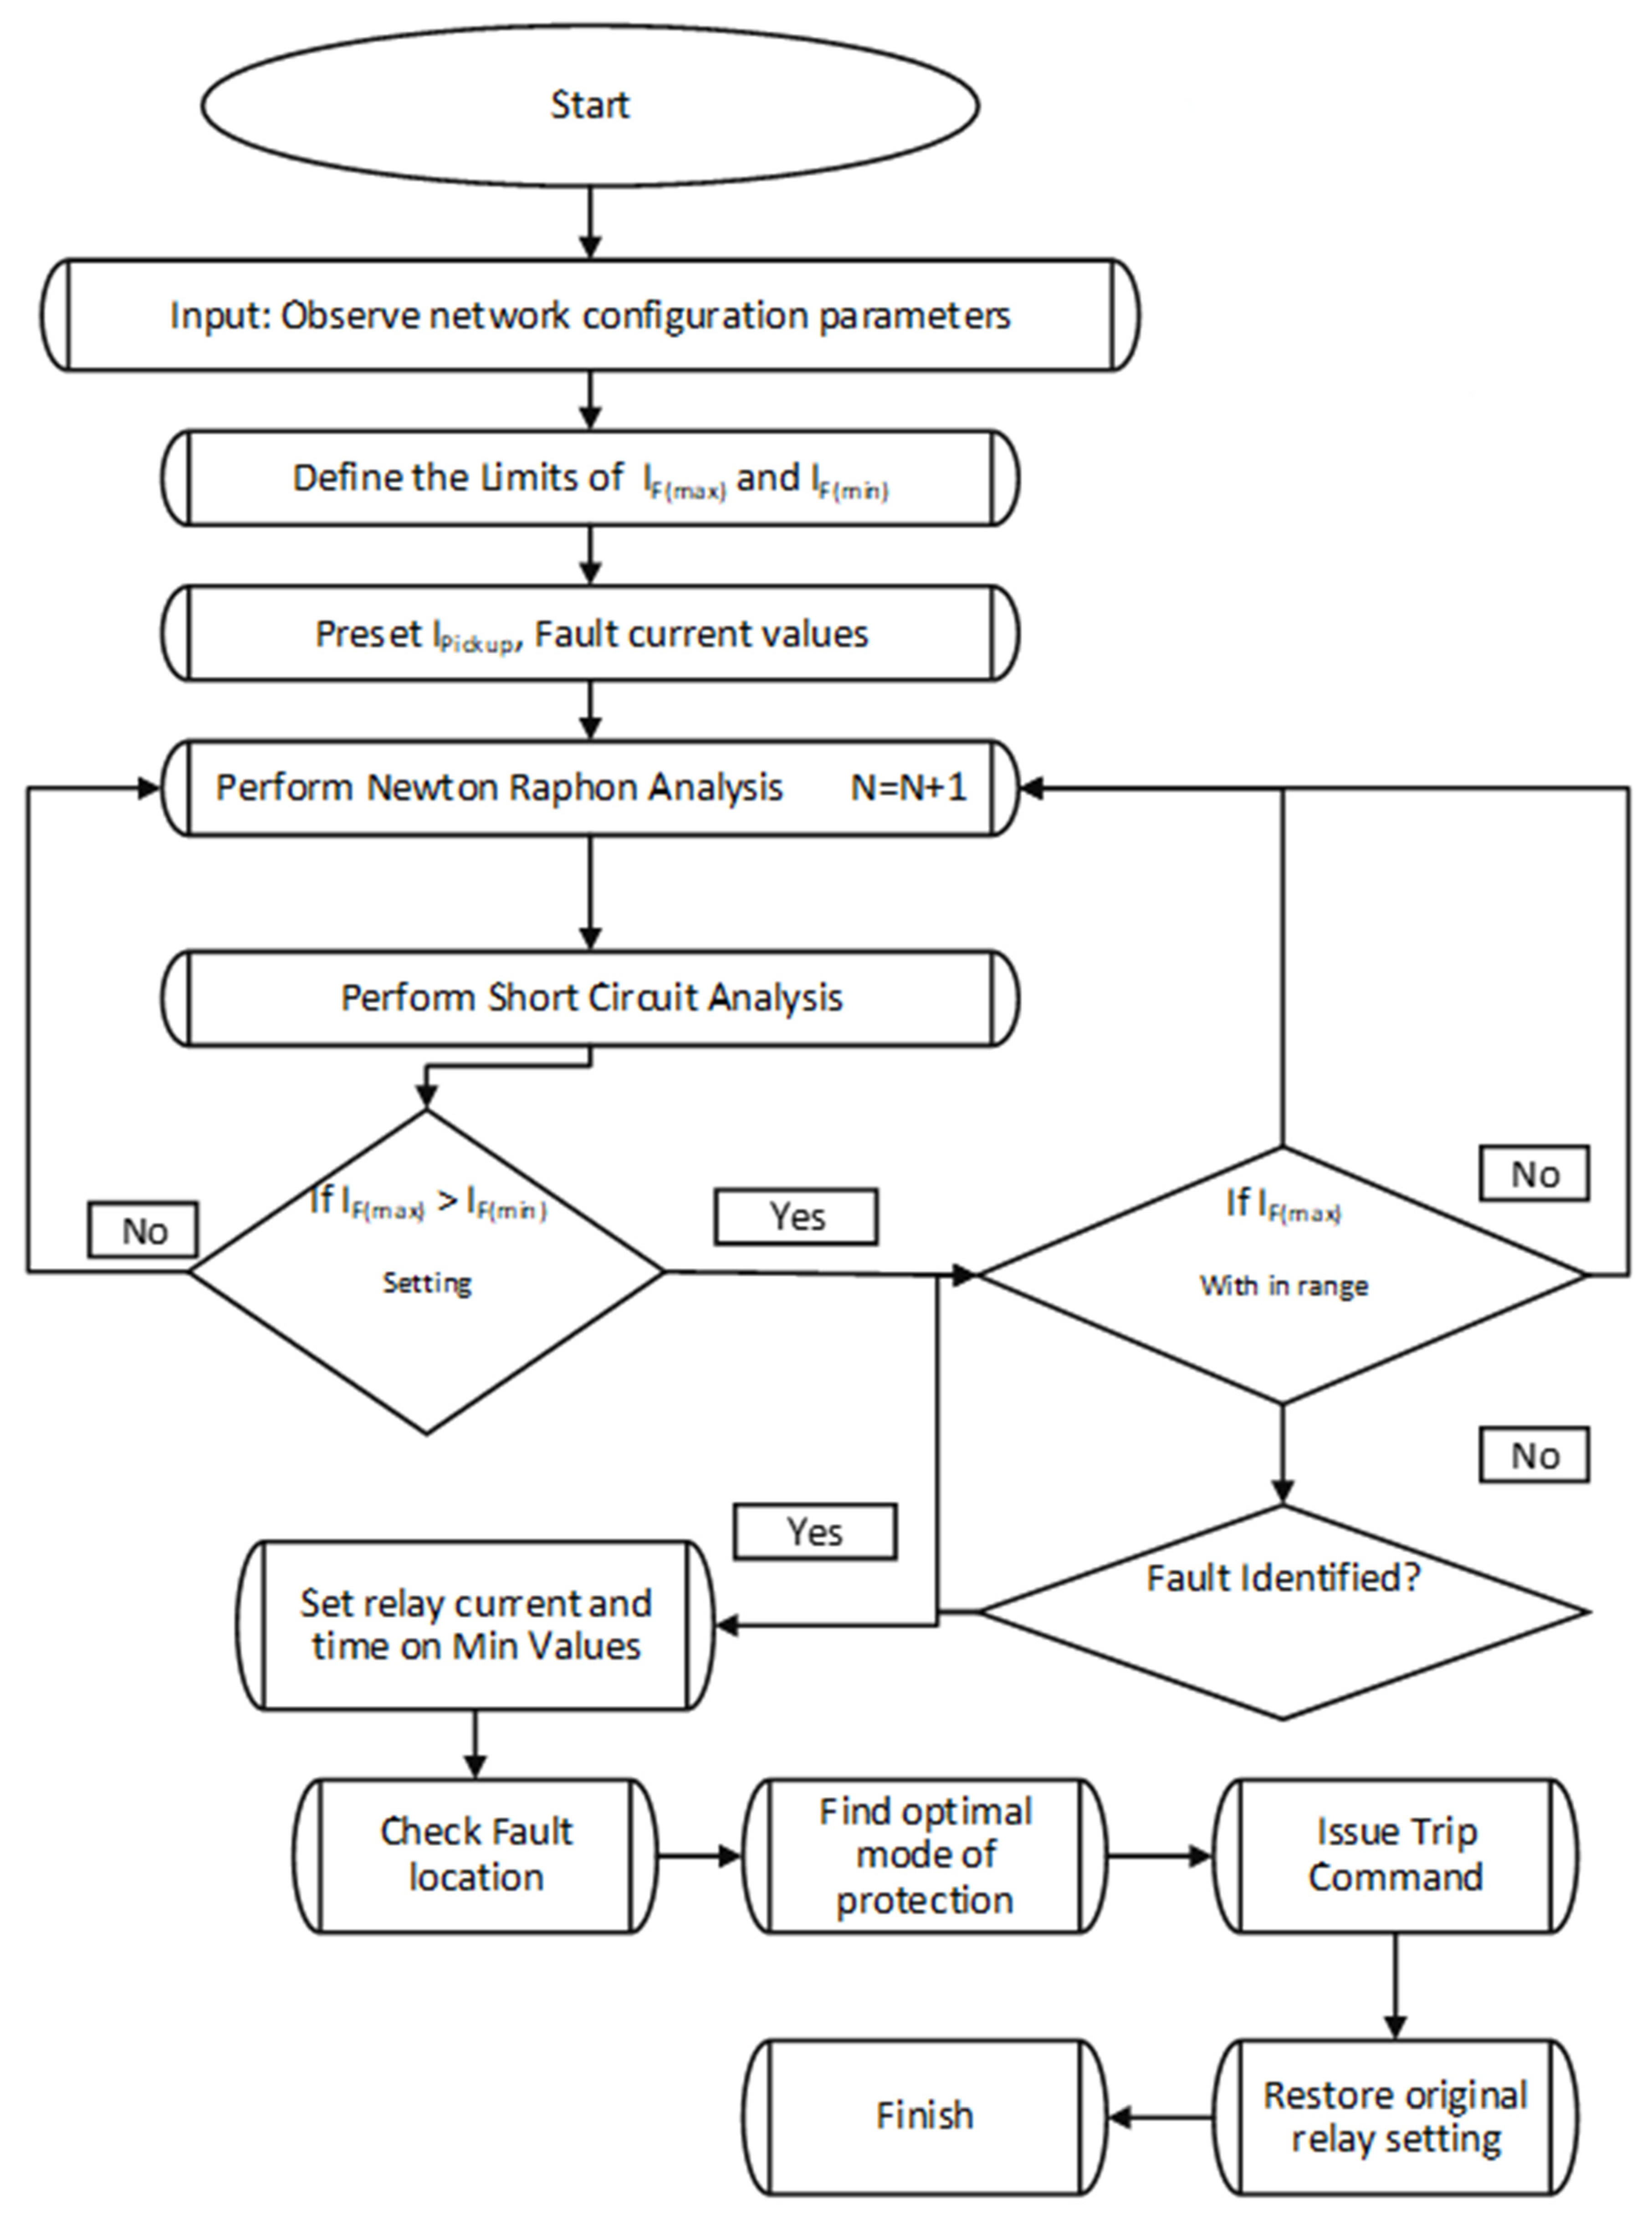
4.1. Protection Coordination

This section is based on the design of the relay-protection zone, in which the protection needs to not be overlapped. The coordinated time interval (CTI) in [49] is considered, where it is assumed to be 0.35 s. First of all, the relay setting is performed. The coordination flowcharts of the overcurrent relay and timing are shown in Figure 4 and Figure 5. The proposed protection zone has two sequential stages for the current and time. The flowchart in Figure 4, as the first stage for the overcurrent-relay coordination, is stated as follows:
  • Observe the network limits and record the required parameters. These are recorded by voltage and current measurements;
  • Define the limits of the maximum fault current ( I F m a x ) and minimum fault current ( I F m i n ), depending on the design procedure of the circuit breaker;
  • Preset the value of I P i c k u p and the fault current of any value for each relay. This depends on the plug setting and time setting of the relay;
  • After entering the protection mode, perform an NRA based on short-circuit faults and load conditions. This step is essential for issuing the trip command and restore command (after clearing the fault). It is a continuous process for each iteration at N = N + 1 ;
  • Observe the setting I F m a x > I F m i n . If it is false, then there is no need for further processing (perform NRA again). If it is true, then observe the I F m i n range set in the first step;
  • If the I F m i n range exceeds, then look at the fault occurring; otherwise, perform an NRA. If the fault exists, then set the relay current and time on min values;
  • Check the fault location and find the optimal mode of protection. This selects the only faulty portion, which is a good attribute of any fault-management system;
  • Issue the trip command and restore the original setting.
The flowchart in Figure 5, as the second stage for the timing of the relay coordination, is stated as follows:
  • After obtaining the overcurrent-relay-coordination values of the fault current and short-circuit currents ( I S c ), it starts. It only operates after a fault occurs;
  • Perform NRA as per the limits decided for the proposed model. This step starts the loop operation for the optimal operation;
  • Calculate I S c , the operational time of the main relay ( T O P M   ), the operation time of the backup relay ( T O P B ), and at the end, calculate the TDS (time dial setting). These parameters are needed for the relay coordination;
  • If the TDS changes, return to the first step; otherwise, look at the main relay. If the main relays are finished, observe the backup relay; otherwise, perform NRA;
  • See that the backup relays are finished. If YES, perform NRA. If NO, then end the protection zone.

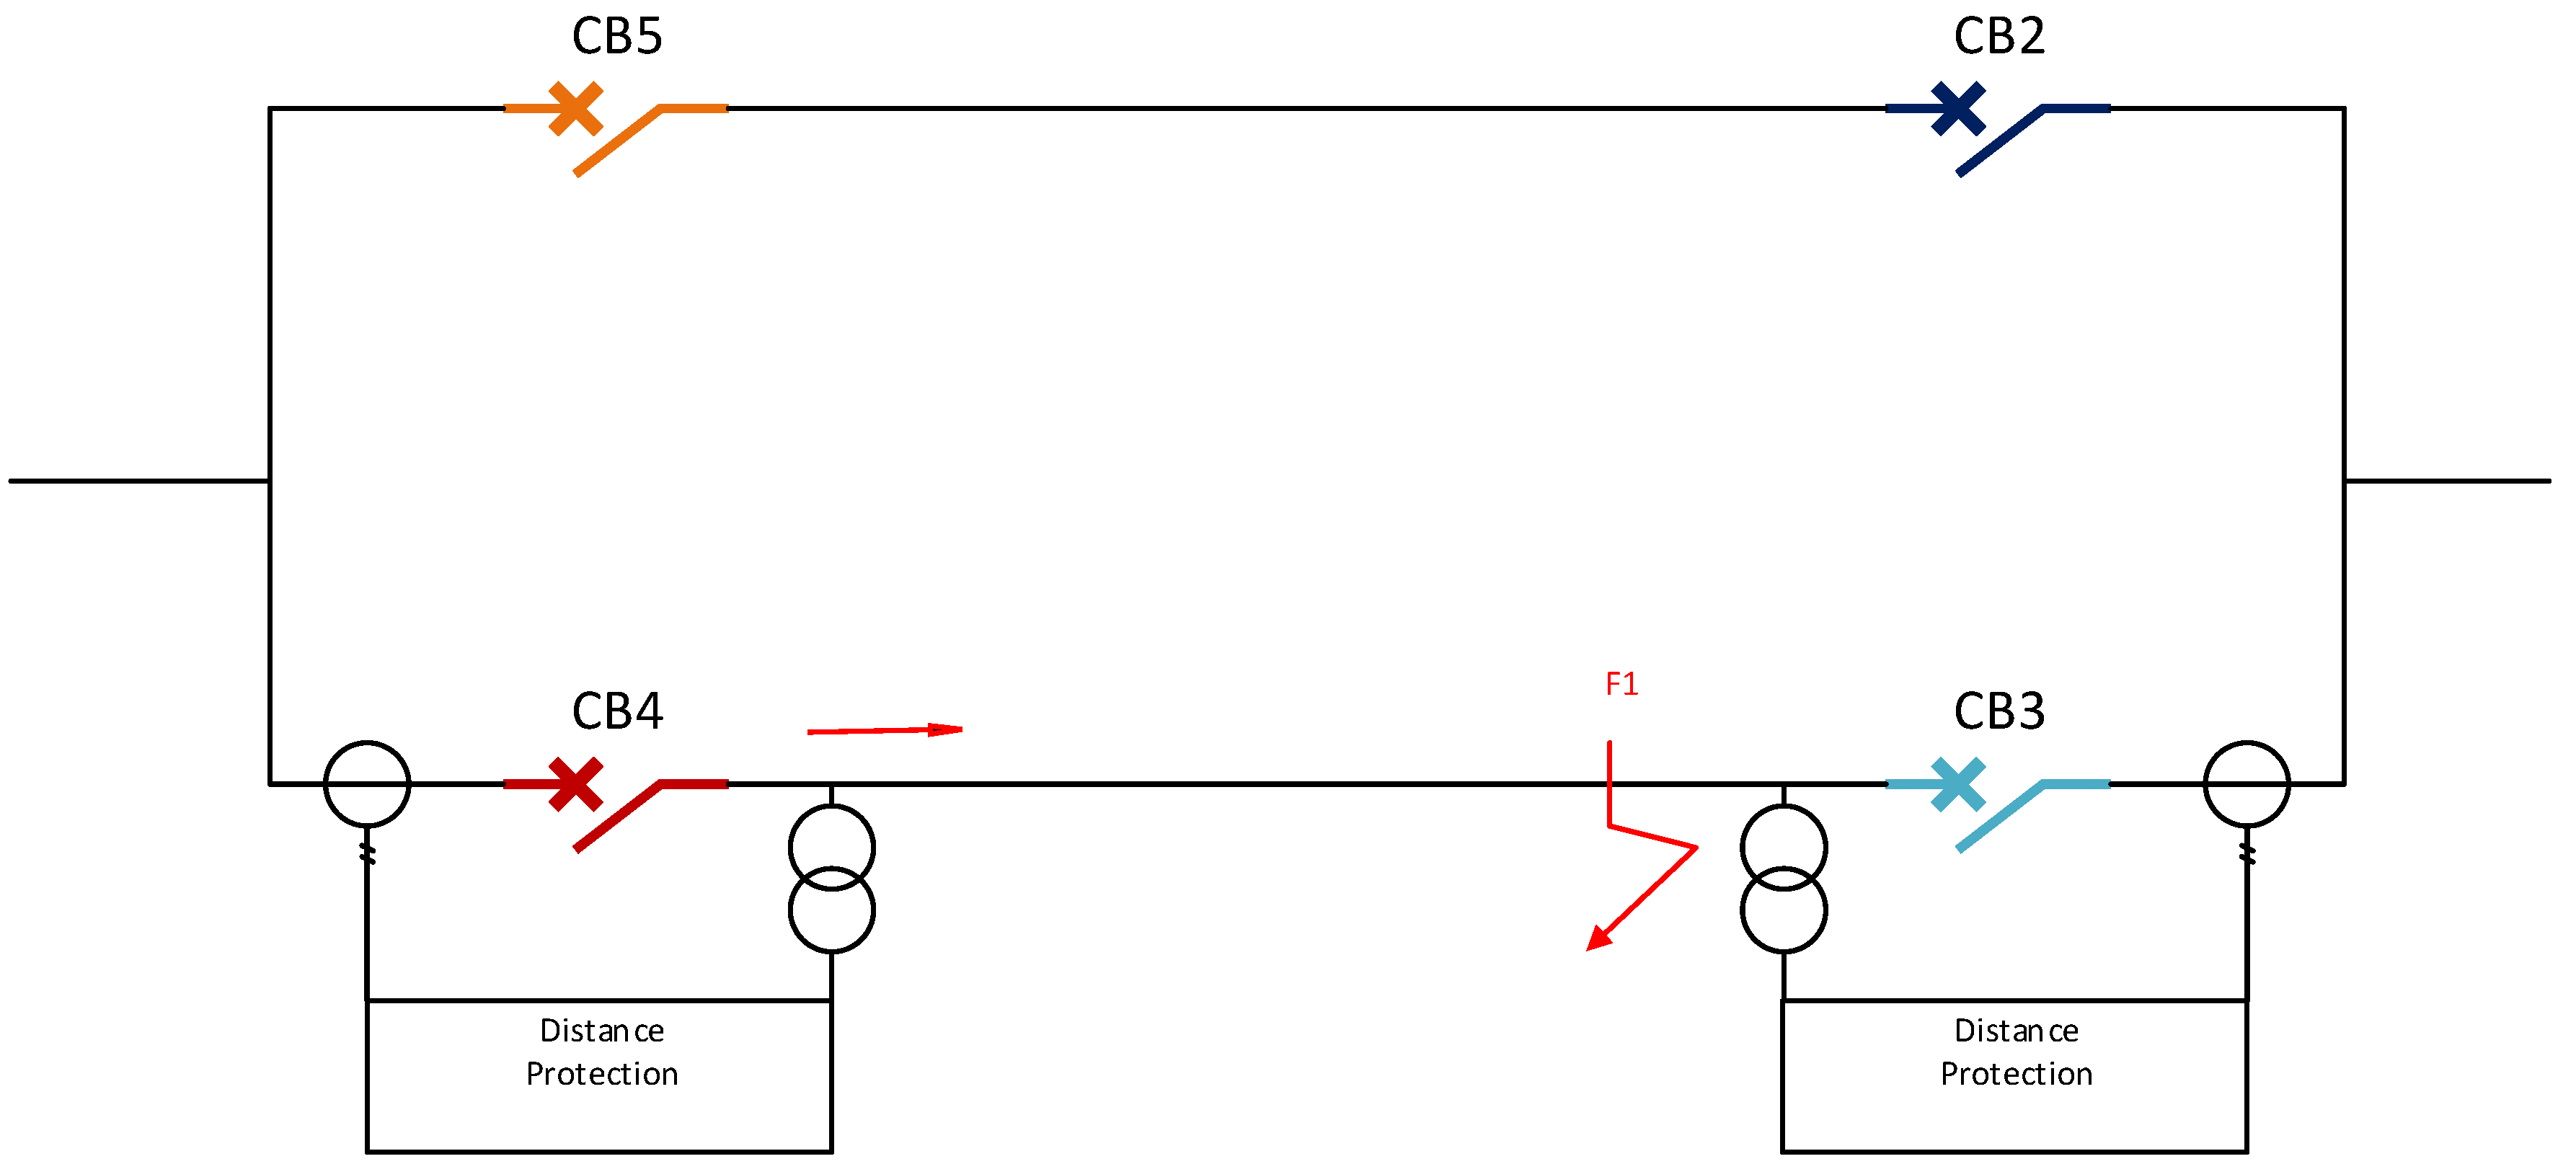
4.2. Protection Coordination for Faulty-Section Detection

This section defines the fault location after the operation performed by the overcurrent- and timing-relay coordination. Fault detection is considered one of the central parts of fault location. Usually, the distance between the first two spikes of the current is measured for the fault location [49]. In this regard, the proposed method uses the communication system for sending the wavelet information to the fault locators (FLs), as shown in Figure 6.
The steps involved in the proposed models are:
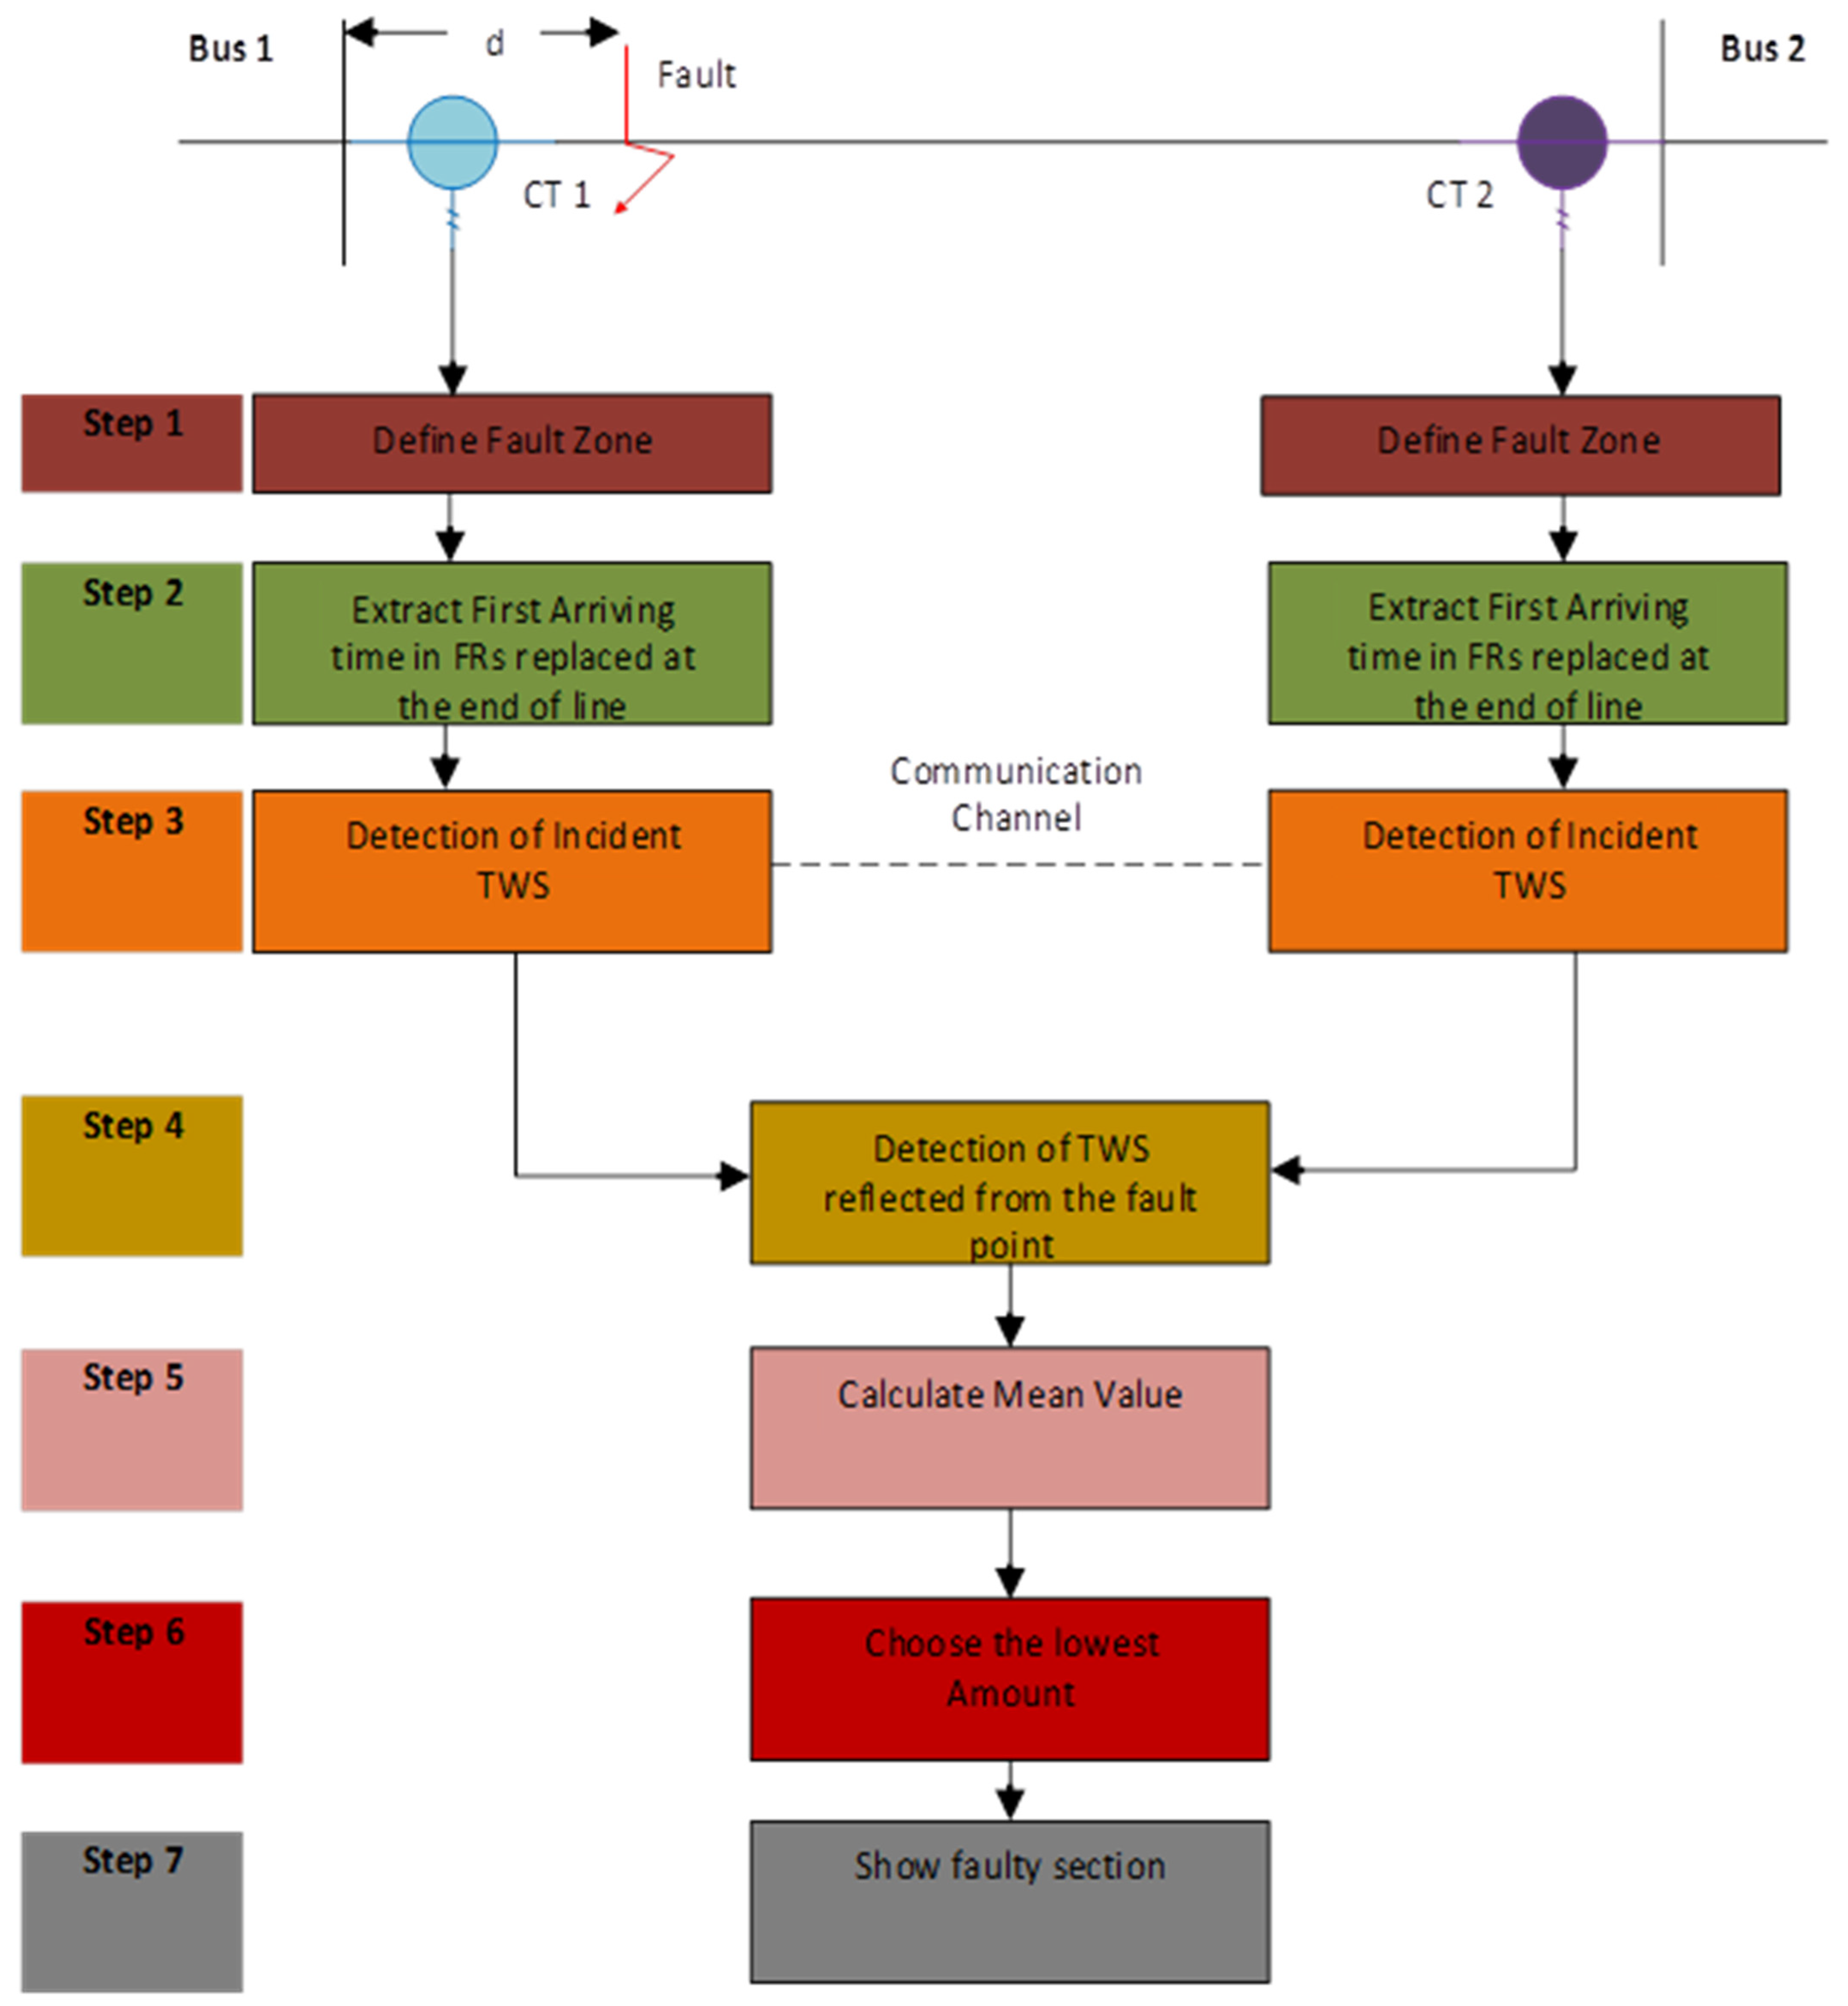
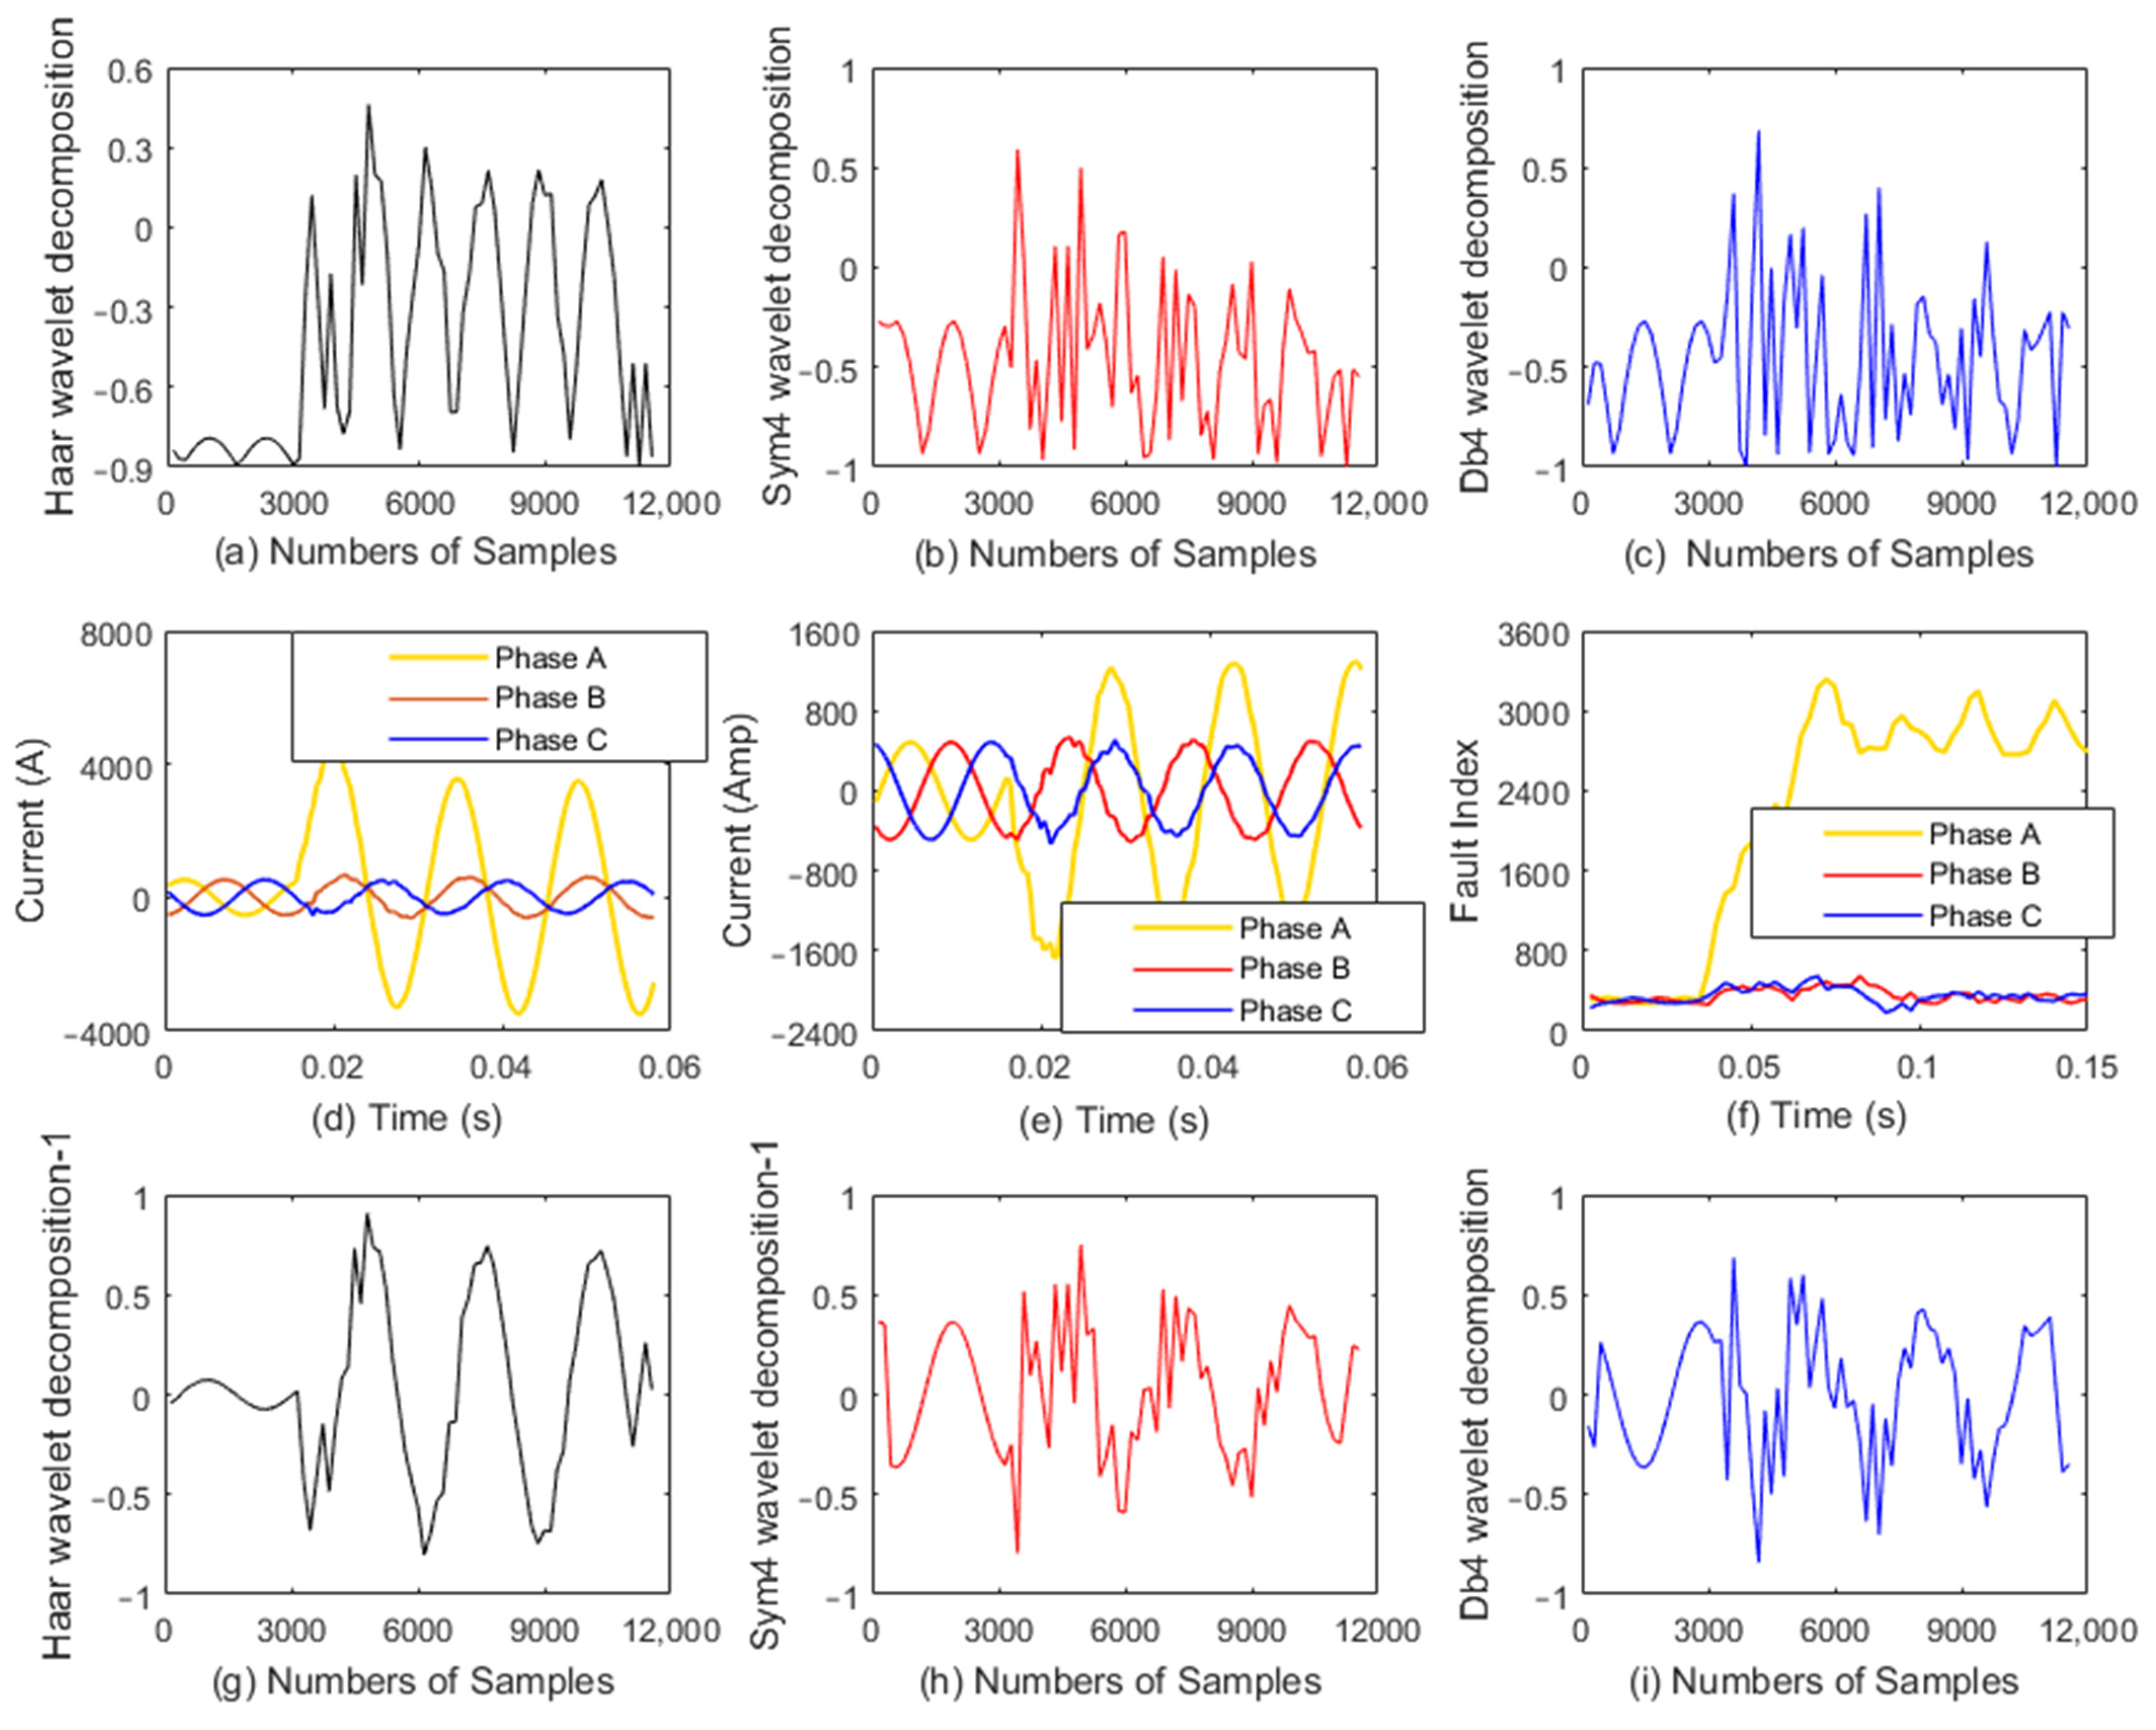
  • Define the fault zone and observe the distance. This is performed by the communication channel provided in the proposed DWT methodology. Before sending the information to the FLs, the CWT process is started, which convolves the signal with the wavelet basis function, as shown in the Figure 2a. By extracting the first arriving time of both ends with fault resistance, the communication system sends the wavelet information to the FLs. Filter the signals and compare them with the threshold for detecting the DWT. Equation (1) defines the CWT process. Then, the system understands the DWT, and the inputs are considered in the timeframe and frequency band for high frequency and high resolution separately, as shown in Figure 2b. This is defined by Equations (2) and (3). Equation (3) does not have enough of a spectrum as the actual project required, and decomposition was needed for expansion. This is completed in Equation (4);
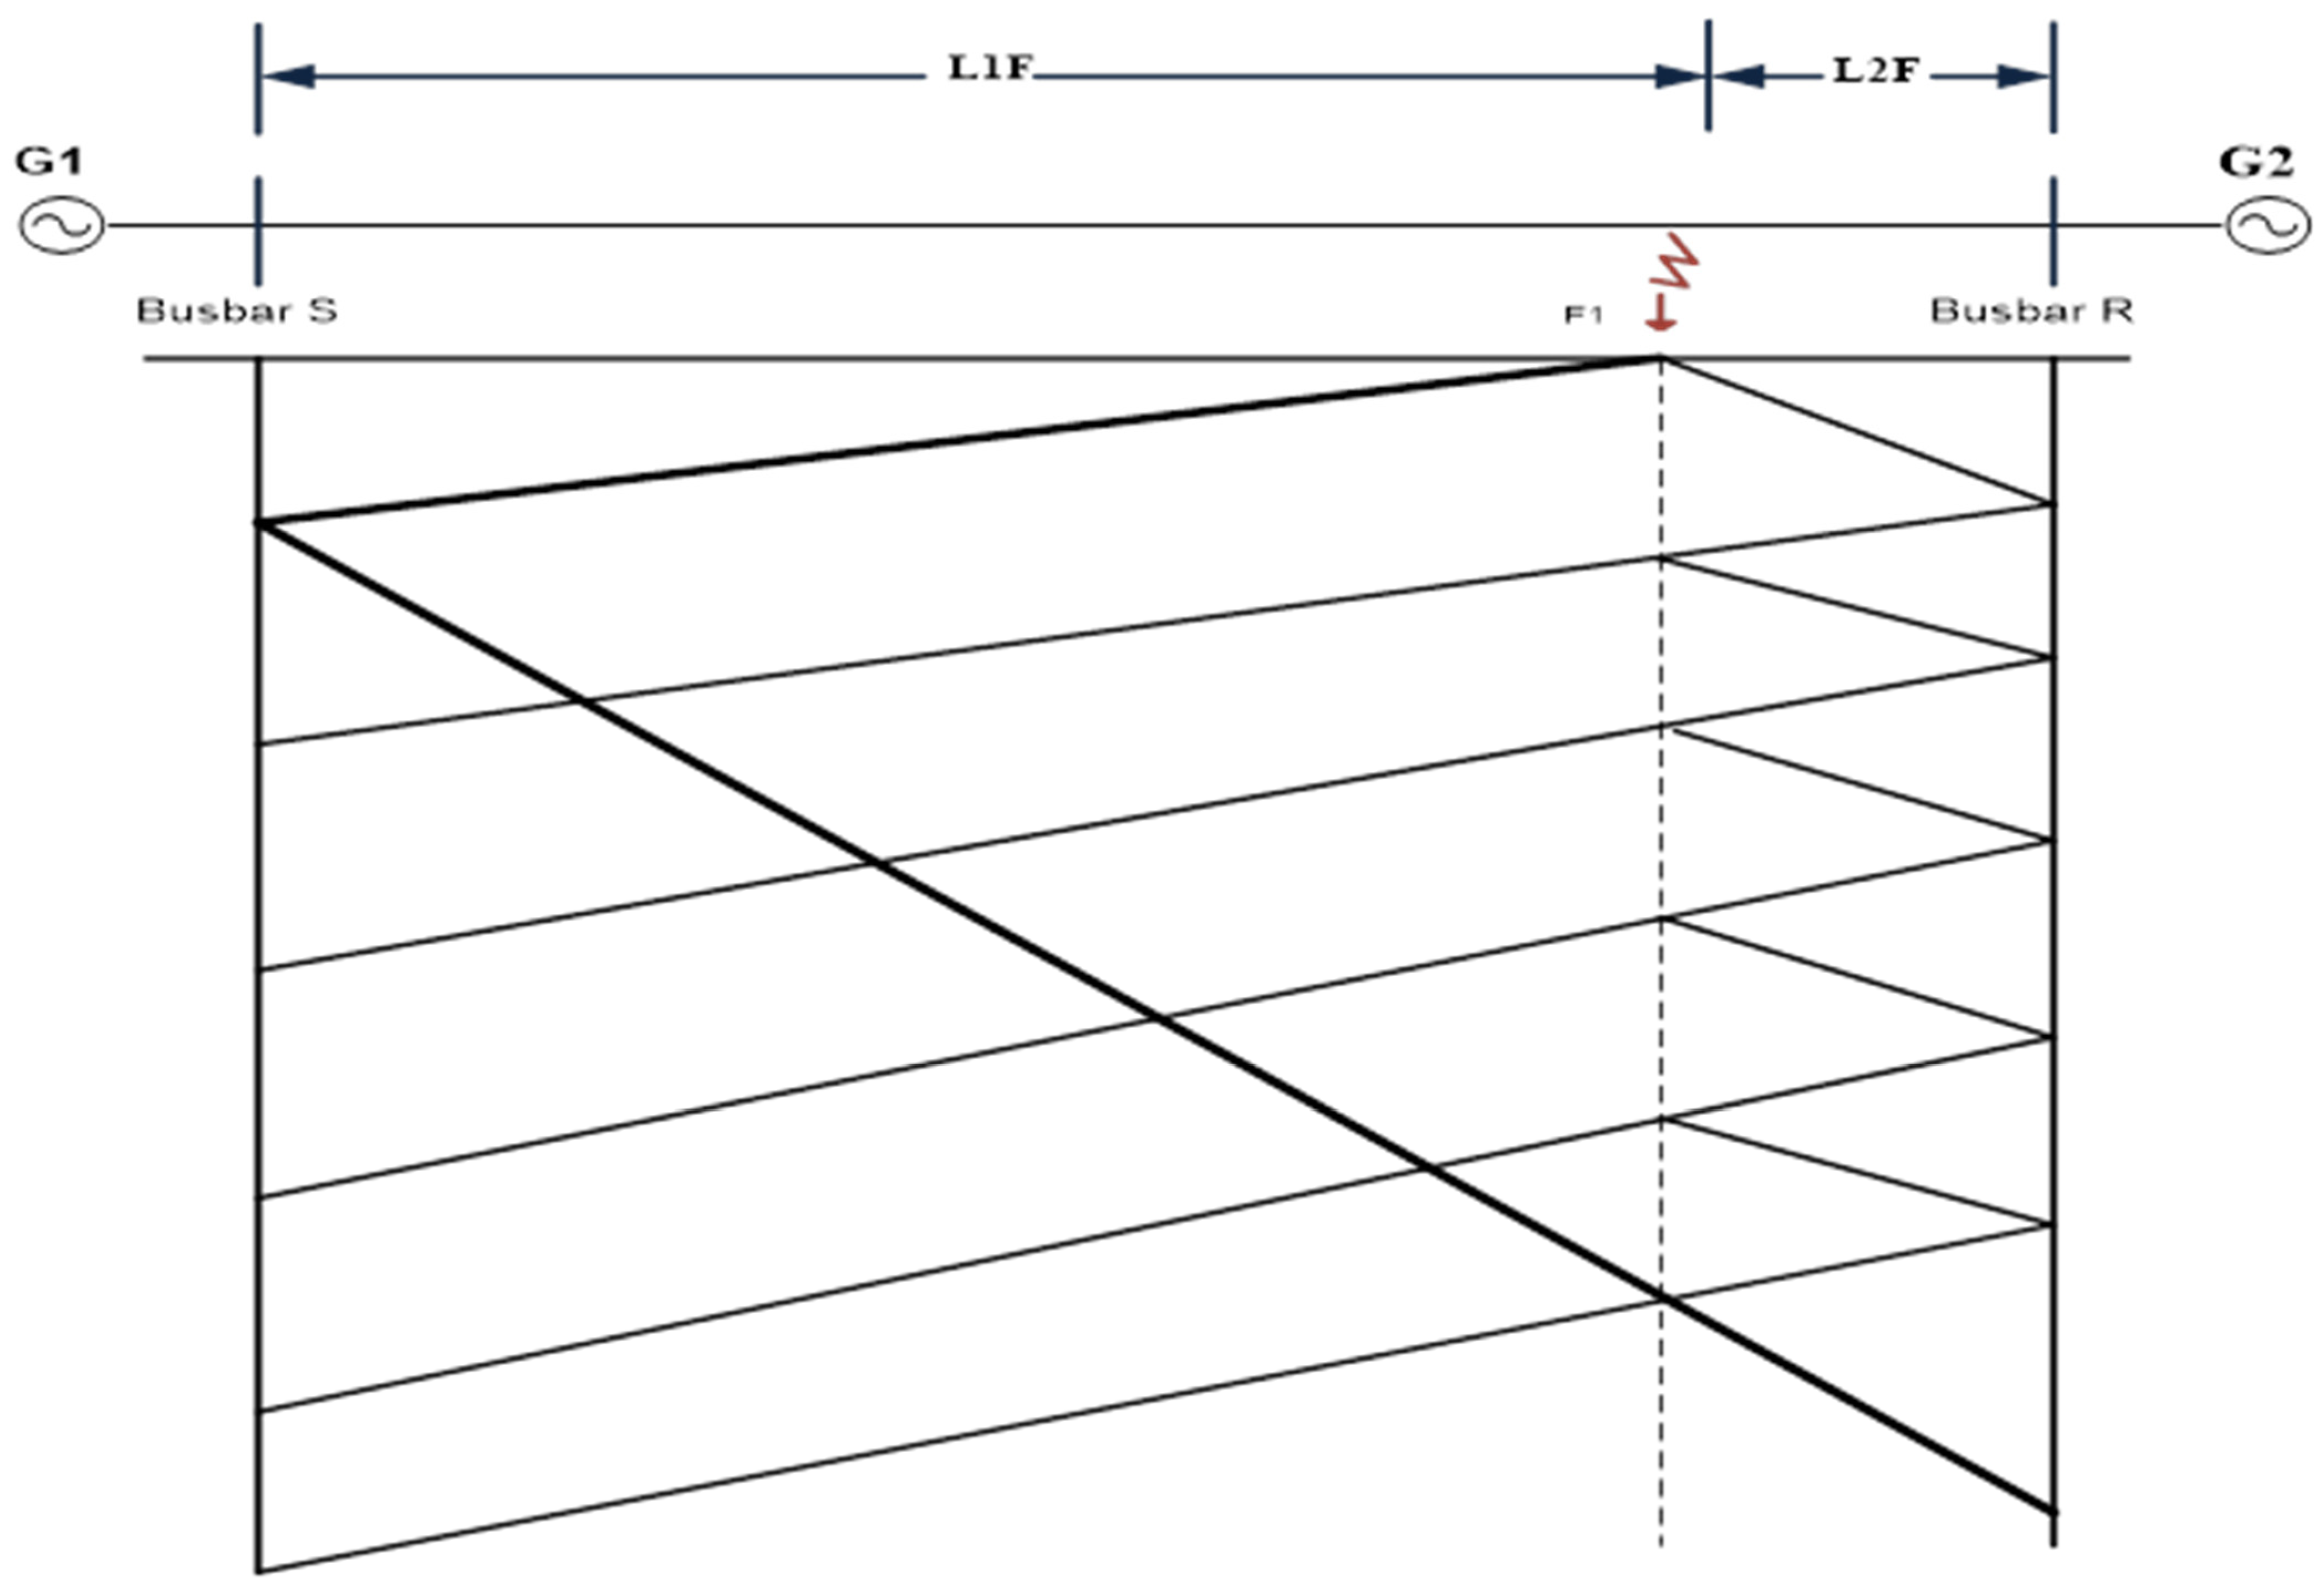
  • Compute the fault distance from the fault point where the TWs are reflected. In this step, there are two lines at CT1 and CT2 that compute the distance, as shown in Figure 6. The traveling-wavelet-propagation speed is v, as per the two-line theory given in Figure 3, and the expressions are solved in Equations (5) and (6);
  • After computing the fault distance from the fault point at which the TWs are reflected and the fault distance, compensate the latency effect by the communication system;
  • Compute the Clarke-transformation matrices, as discussed in Equations (7) and (8), to reduce the electromagnetic coupling effect;
  • Take measurements of the two ends as a time instant at the peak of the absolute value in the filtered signals;
  • Perform the operations of the relays associated with the CTs, as defined in the protection zone in the flowchart of Figure 4 and Figure 5, as the DWT method only is not enough to determine the location of the fault with high speed;
  • Calculate the mean value of Step 5;
  • Choose the lowest amount;
  • Show the faulty location.
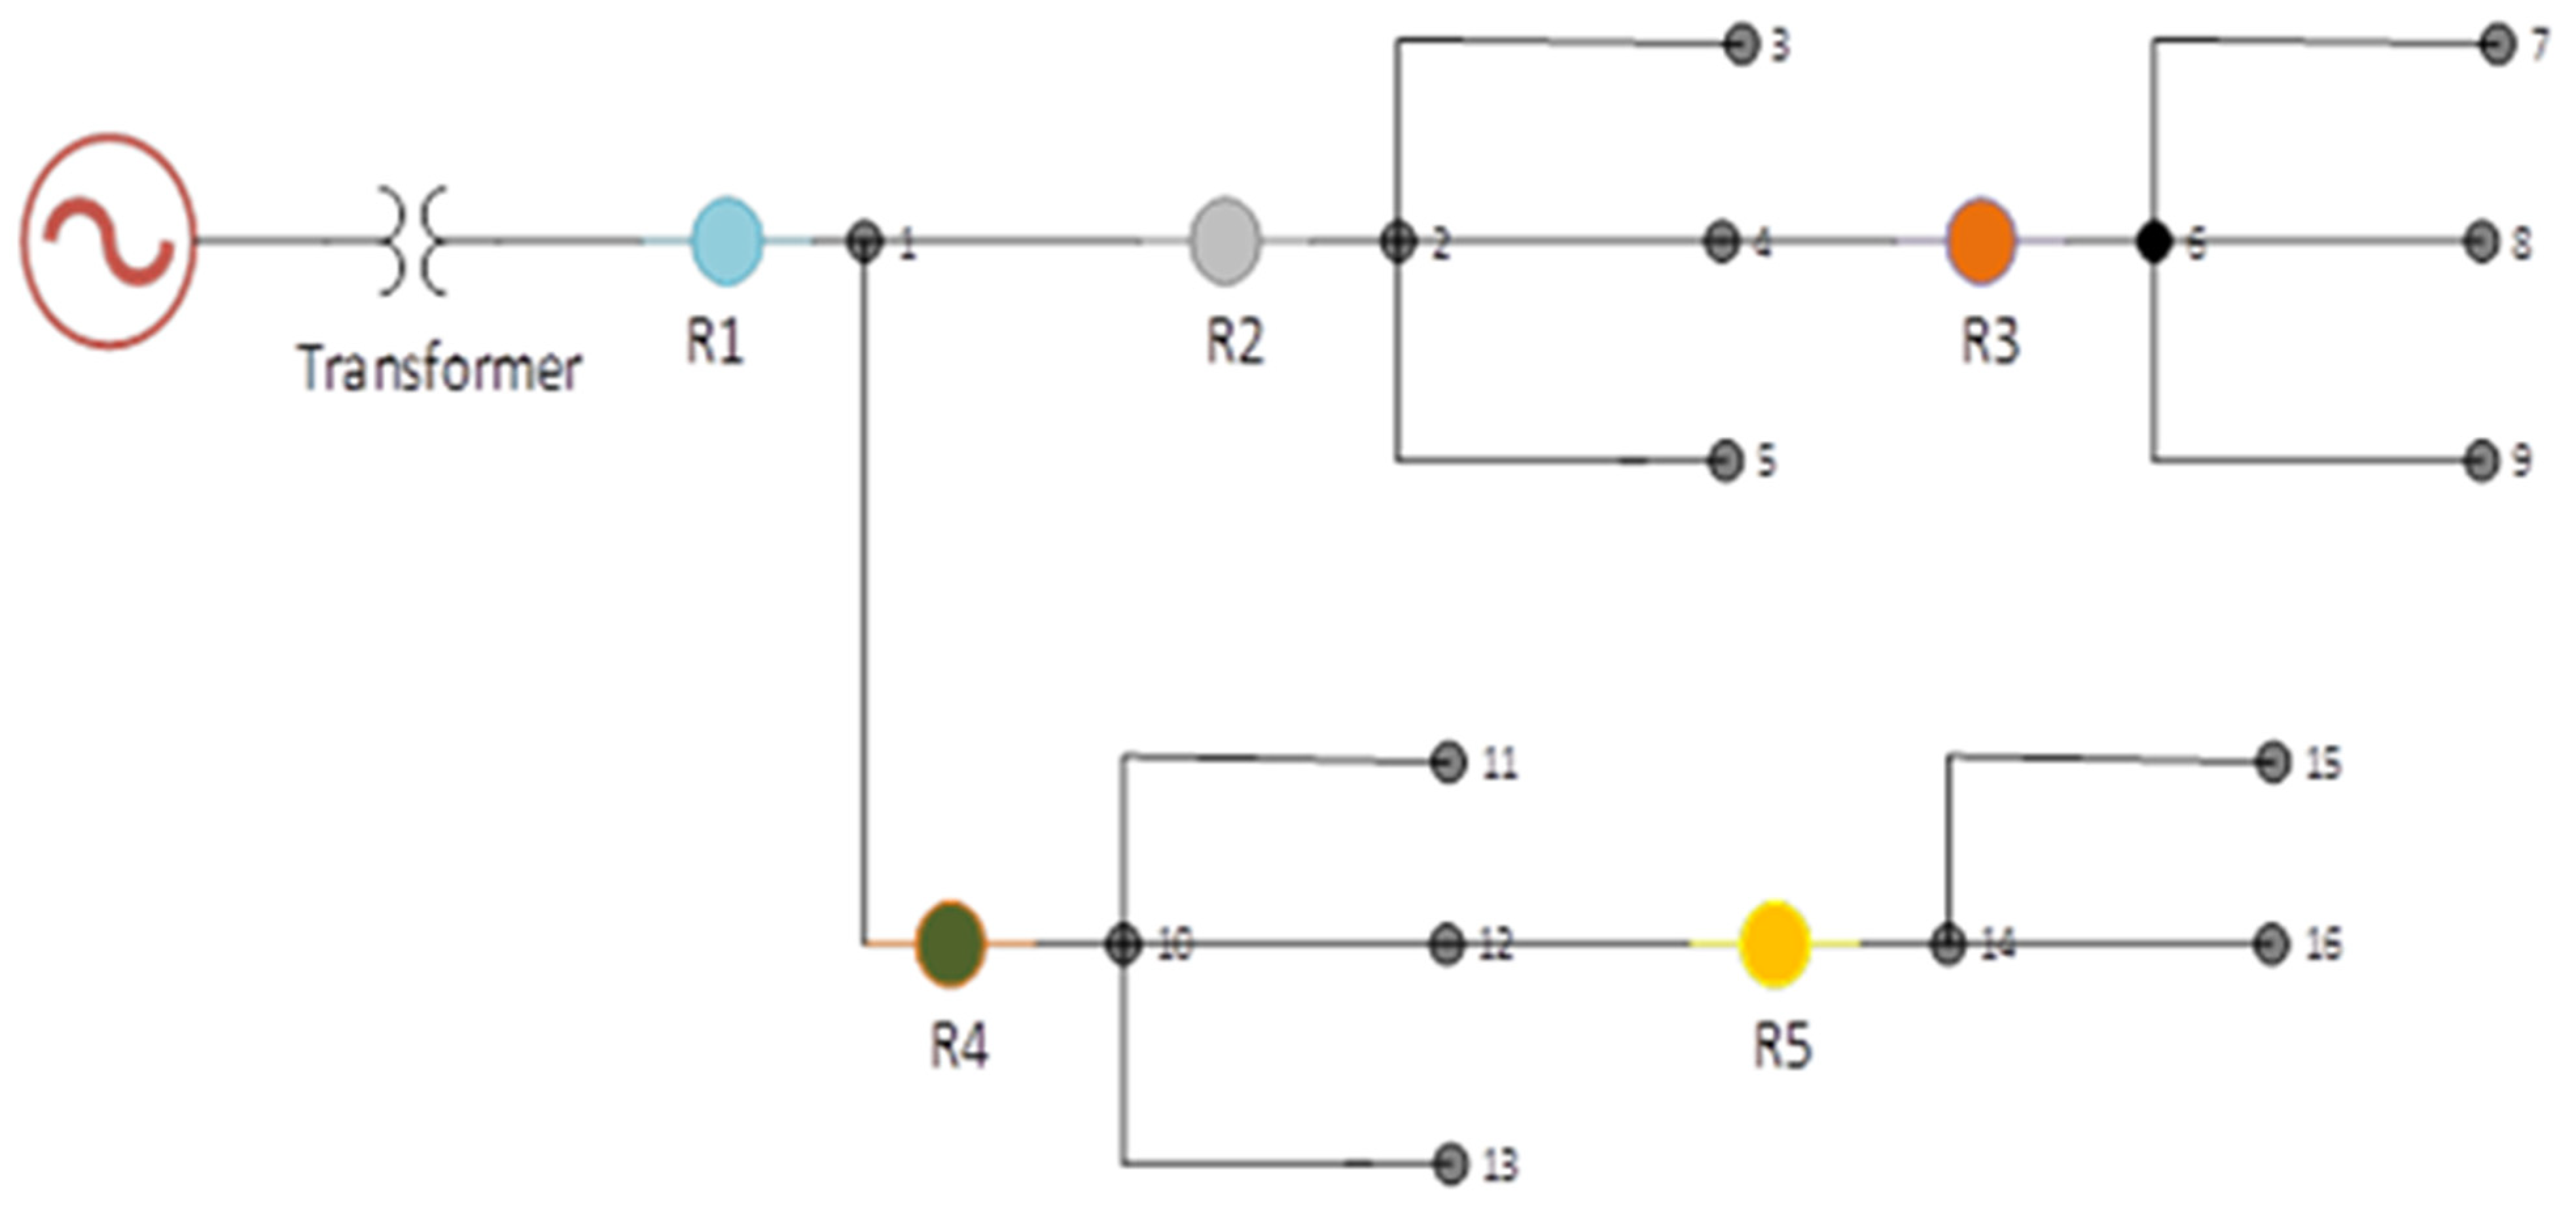
5. Proposed Setup

In this proposed system, a sixteen-node network was designed for the underground-cable scenario, as shown in Figure 7. A similar type of case study is reported in [49]. The MATLAB software R2017a (Natick, MA, USA) simulation environment is interfaced with the toolbox DiGSILENT on a research workstation with an Intel Core i5-4300CU, 8 GB RAM, 64-bit operating system and 2.50 GHz Processor to find the location of the fault in both balanced and unbalanced conditions. In the simulation process, different loads are connected to all the nodes with the rating of the 11   kV level, as this system has a 132   kV / 11 kV approach. Table 2 shows the load values and the distribution in both balanced and unbalanced conditions. The line parameters are given in Table 3, where R 1 , C 1 , and L 1 denote the input impedances, and R o , C o , and L o denote the output impedances.

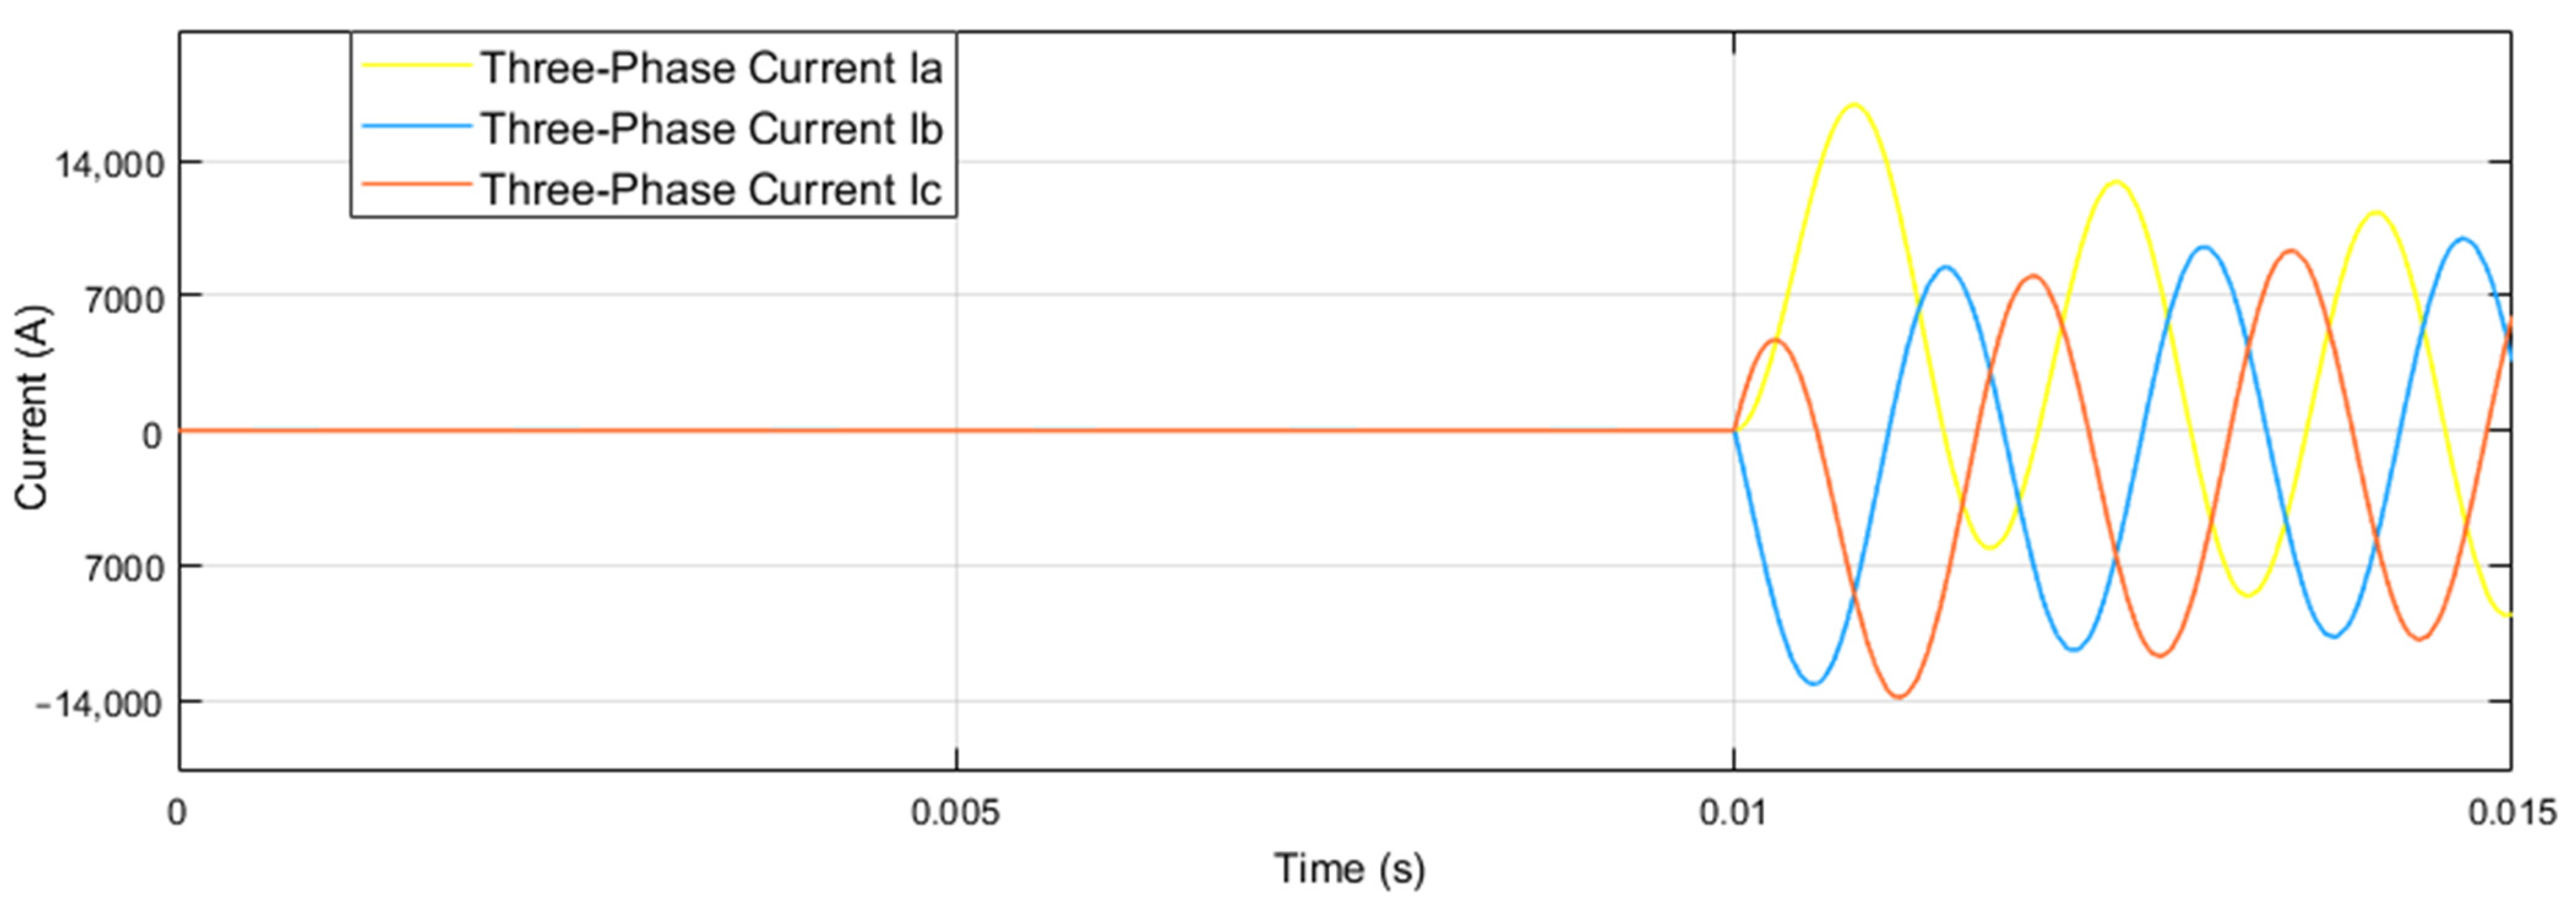
6. Result Discussion

As the proposed model is based on a two-terminal DWT for locating the faults, there is a need to detect the initial wave in which the reflection and refraction of the WT are not essential. Figure 8a shows the waveform of Haar-wavelet decomposition, Figure 8b shows the waveform of Sym4-wavelet decomposition, and Figure 8c shows the waveform of Db4-wavelet decomposition at one end of the cable. In this regard, the different WT characteristics of different wavelet functions, such as the Haar wavelet, Sym4 wavelet, and Db4 wavelet, observed in Figure 8a–c, are distinguished as desired to find the accuracy in the results. Similarly, Figure 8g shows the waveform of Haar-wavelet decomposition, Figure 8h shows the waveform of Sym4-wavelet decomposition, and Figure 8i shows the waveform of Db4-wavelet decomposition at end of the cable. It can be observed in Figure 8g–i that all the wavelet functions are different, while the Db4 wavelet is more suitable for locating the fault. In terms of the fault-detection results, Figure 8d shows the waveform of a three-phase fault current (from single line to ground) recorded after interval-1 for a low-impedance fault of 8.1   kA , and Figure 8e shows the waveform of a three-phase fault current (from single line to ground) recorded after interval-2 for a high-impedance fault of 8.1   kA . Figure 8f shows the waveform of the three-phase fault index, which is detected in those phases where a fault is detected.
Figure 8d–f, as described earlier, depicts the fault currents of the different indexes at two different intervals of high- and low-impedance faults as 4.2   kA and 8.1   kA , respectively. The fault accrued in phase-a, as shown in Figure 8d,e, and phase-b and phase-c, were found not faulty at both intervals. The results shown in Figure 8f validate the proposed system results, as there is a near-to-zero fault index for phases a and c. Moreover, there is a spike of a faulty index in the case of a faulty phase-a.
Table 4 represents the different fault-location results, of which the balanced loads and unbalanced loads are taken into account. As earlier discussed, the simulation parameters are tested for different real-time conditions to estimate faults. In addition, these results also evaluated the network as an underground distribution unit, as shown in Figure 7, where two-terminal information is carried out. Figure 9 and Figure 10 are the three-phase voltages and current waveforms that ensure that the fault has been detected after 0.01 s. Further verification of the zone detection, section identification, and fault location is as follows:
  • If faults accrue at bus-9, then R3 has to operate and R2 and R1 are the backup relay, as both have slower operating times than R1;
  • If faults accrue in bus-10, then R4 has to operate and R1 is the backup relay, as it has a slower operating time than R4;
  • If faults accrue in bus-11, then R4 has to operate and R5 and R1 are the backup relays, as both have slower operating times than R4;
  • If faults accrue in bus-3, then R2 has to operate and R1 is the backup relay, as it has a slower operating time than R2;
  • If faults accrue in bus-6, then R3 has to operate and R2 and R1 are the backup relays, as they both have slower operating times than R3.
To detect and locate the fault locations, this approach uses a DWT from both ends of the cable. Figure 7 depicts the system configuration. The load distribution is displayed in Table 2. The DWT is modeled to detect the fault. However, traveling signals suffer from distortions as a result of the attenuation and dispersion as they travel towards the two ends of the cable. As a result, the approaches deployed at both ends of the cable may be very different. This approach has the benefit of being conducted online, without the need for any high-voltage test sources. As mentioned, these results were obtained for a distribution network (Figure 7) using two-terminal information. The high-impedance faults considered for a fully loaded distribution network are also notable, and the fault recorders (FRs) of each scenario are described in Table 5. The results show that this system detects the fault, and that it provides a protection zone before detecting the fault. The fast fault identification within 0.01 s, and the quick response of the overcurrent relay with the DWT scheme, provided the fault location. This is comparatively better than [47], and the speedy fault detection and accuracy in the fault location are the key contributions of this work.

7. Conclusions and Future Studies

This study aimed to enhance the reliability, safety, and stability of distribution networks of underground cables. A beneficial method of using traveling waves for finding faults is considered. In this method, the wave-transmission time is compared on a particular node, and the magnitude of the distance is determined. This model also provides extra accuracy in fault detection and location for optimum fault management. A novel fault detection and location framework for underground cables based on a DWT were tested on a 132   kV / 11   kV distribution scheme of 16 nodes. The results show fast area detection, the identification of faulty sections, and fault location with the coordination schemes of the overcurrent-relay and timing-relay coordination. By optimizing the settings of the relays, coordination through NRA completes the model. Regarding the protection zone provided by the relay coordination, the faulty line is identified. The obtained results show that the proposed model can detect and locate the cable’s faults within 0.01 s at an accurate location. WT models have been used in previous work, but they require a high assessment rate. Future work can be further rectified by adding alternative energy resources and false tripping, and by altering the relay coordination and protection topology.

Author Contributions

Writing—original draft preparation, methodology, validation, R.T., I.A., A.U.R., E.T.E., M.S., N.A.G. and H.H.; conceptualization, data curation, and visualization, R.T. and I.A.; formal analysis, A.U.R., M.S. and H.H.; investigation, I.A. and E.T.E.; funding acquisition, E.T.E. and N.A.G.; project administration, I.A., M.S., E.T.E. and A.U.R.; supervision, I.A., H.H. and E.T.E.; writing—review and editing, R.T., I.A., A.U.R., E.T.E., M.S., N.A.G. and H.H. All authors have read and agreed to the published version of the manuscript.

Funding

This research was supported by the Future University Researchers Supporting Project Number FUESP-2020/48 at Future University in Egypt, New Cairo 11845, Egypt.

Institutional Review Board Statement

Not applicable.

Informed Consent Statement

Not applicable.

Data Availability Statement

Not applicable.

Conflicts of Interest

The authors declare no conflict of interest.

References

  1. He, X.; Zhao, L.; Xie, X.; Yao, Z. High-Precision Relocation and Event Discrimination for the 3 September 2017 Underground Nuclear Explosion and Subsequent Seismic Events at the North Korean Test Site. Seismol. Res. Lett. 2018, 89, 2042–2048. [Google Scholar] [CrossRef]
  2. Booske, J.H.; Converse, M.C.; Gallagher, D.A.; Kreischer, K.E.; Heinen, V.O.; Kory, C.L.; Chevalier, C.T. Parametric modeling of folded waveguide circuits for millimeter-wave traveling wave tubes. In Proceedings of the Third IEEE International Vacuum Electronics Conference, Monterey, CA, USA, 25 April 2002; Volume 52, p. 47. [Google Scholar] [CrossRef]
  3. Milioudis, A.; Andreou, G.; Labridis, D. On-line partial discharge monitoring system for underground MV cables—Part II: Detection and location. Int. J. Electr. Power Energy Syst. 2019, 109, 395–402. [Google Scholar] [CrossRef]
  4. Santos, M.R.; Costa, B.S.J.; Bezerra, C.G.; Andonovski, G.; Guedes, L.A. An evolving approach for fault diagnosis of dynamic systems. Expert Syst. Appl. 2022, 189, 115983. [Google Scholar] [CrossRef]
  5. Raj, R.; Althaf, J.; Imthiaz, M. Underground Cable Fault Detection Using Robot. Int. J. Electr. Comput. Eng. 2013, 3, 145–151. [Google Scholar] [CrossRef]
  6. Furse, C.M.; Kafal, M.; Razzaghi, R.; Shin, Y.J. Fault Diagnosis for Electrical Systems and Power Networks: A Review. IEEE Sens.J. Inst. Electr. Electron. Eng. 2021, 201, 888–906. [Google Scholar] [CrossRef]
  7. Li, X.; Dyśko, A.; Burt, G.M. Traveling wave-based protection scheme for inverter-dominated microgrid using mathematical morphology. IEEE Trans. Smart Grid 2014, 5, 2211–2218. [Google Scholar] [CrossRef]
  8. Rong, X.; Shek, J.K.H.; Macpherson, D.E.; Mawby, P. The Effects of Filter Capacitors on Cable Ripple at Different Sections of the Wind Farm Based Multi-Terminal DC System. Energies 2021, 14, 7000. [Google Scholar] [CrossRef]
  9. Borghetti, A.; Corsi, S.; Nucci, C.A.; Paolone, M.; Peretto, L.; Tinarelli, R. On the use of continuous-wavelet transform for fault location in distribution power systems. Int. J. Electr. Power Energy Syst. 2006, 28, 608–617. [Google Scholar] [CrossRef]
  10. Joye, C.D.; Cook, A.M.; Calame, J.P.; Abe, D.K.; Vlasov, A.N.; Chernyavskiy, I.A.; Nguyen, K.T.; Wright, E.L.; Pershing, D.E.; Kimura, T.; et al. Demonstration of a high power, wideband 220-GHz traveling wave amplifier fabricated by UV-LIGA. IEEE Trans. Electron Devices 2014, 61, 1672–1678. [Google Scholar] [CrossRef]
  11. Abu-Siada, A.; Mir, S. A new on-line technique to identify fault location within long transmission lines. Eng. Fail. Anal. 2019, 105, 52–64. [Google Scholar] [CrossRef]
  12. Wang, Y.; Liu, J.; Chen, Y.; Gruteser, M.; Yang, J.; Liu, H. E-eyes: Device-free location-oriented activity identification using fine-grained wifi signatures. In Proceedings of the 20th Annual International Conference on Mobile Computing and Networking, Maui, HI, USA, 7–11 September 2014; pp. 617–628. [Google Scholar]
  13. Sabug, L.; Musa, A.; Costa, F.; Monti, A. Real-time boundary wavelet transform-based DC fault protection system for MTDC grids. Int. J. Electr. Power Energy Syst. 2020, 115, 105475. [Google Scholar] [CrossRef]
  14. Arita Torres, J.; dos Santos, R.C.; Yang, Q.; Li, J. Analyses of different approaches for detecting, classifying and locating faults in a three-terminal VSC-HVDC system. Int. J. Electr. Power Energy Syst. 2022, 135, 107514. [Google Scholar] [CrossRef]
  15. Montoya, R.; Poudel, B.P.; Bidram, A.; Reno, M.J. DC microgrid fault detection using multiresolution analysis of traveling waves. Int. J. Electr. Power Energy Syst. 2022, 135, 107590. [Google Scholar] [CrossRef]
  16. Manarikkal, I.; Elasha, F.; Mba, D. Diagnostics and prognostics of planetary gearbox using CWT, auto regression (AR) and K-means algorithm. Appl. Acoust. 2021, 184, 108314. [Google Scholar] [CrossRef]
  17. Naidu, K.; Ali, M.S.; Abu Bakar, A.H.; Tan, C.K.; Arof, H.; Mokhlis, H. Optimized artificial neural network to improve the accuracy of estimated fault impedances and distances for underground distribution system. PLoS ONE 2020, 15, e0227494. [Google Scholar] [CrossRef]
  18. Amiruddin, A.A.A.M.; Zabiri, H.; Taqvi, S.A.A.; Tufa, L.D. Neural network applications in fault diagnosis and detection: An overview of implementations in engineering-related systems. Neural Comput. Appl. 2020, 32, 447–472. [Google Scholar] [CrossRef]
  19. Ahmad, I.; Mabuchi, H.; Kano, M.; Hasebe, S.; Inoue, Y.; Uegaki, H. Data-Based Fault Diagnosis of Power Cable System: Comparative Study of k-NN, ANN, Random Forest, and CART. IFAC Proc. Vol. 2011, 44, 12880–12885. [Google Scholar] [CrossRef]
  20. Elmitwally, A.; Mahmoud, S.; Abdel-Rahman, M.H. Fault Detection and Identification of Three Phase Overhead Transmission Lines Ended with Underground Cables (Dept. E). MEJ. Mansoura Eng. J. 2020, 35, 129–137. [Google Scholar] [CrossRef]
  21. Guo, Y.; Li, B.-Z.; Yang, L.-D. Novel fractional wavelet transform: Principles, MRA and application. Digit. Signal Processing 2021, 110, 102937. [Google Scholar] [CrossRef]
  22. Dutta, A.; Noor, M.N.F.; Khan, M.R.A.; Shuva, S.K.S.; Razzak, M.A. Identification and Tracking of Underground Cable Fault Using GSM and GPS Modules. In Proceedings of the 2021 Innovations in Power and Advanced Computing Technologies (i-PACT), Kuala Lumpur, Malaysia, 27–29 November 2021; pp. 1–5. [Google Scholar]
  23. Mansingh, R.K.R.; Rajesh, R.; Ramasubramani, S.; Ramkumar, G. Underground Cable Fault Detection using Raspberry Pi and Arduino. Int. J. Emerg. Technol. Eng. Res. 2017, 5, 1–5. [Google Scholar]
  24. Asif, R.M.; Hassan, S.R.; Rehman, A.U.; Rehman, A.U.; Masood, B.; Sher, Z.A. Smart underground wireless cable fault detection and monitoring system. In Proceedings of the 2020 International Conference on Engineering and Emerging Technologies (ICEET), Lahore, Pakistan, 27–28 October 2020; pp. 1–5. [Google Scholar]
  25. Jabbar, W.A.; Wei, C.W.; Azmi, N.A.A.M.; Haironnazli, N.A. An IoT Raspberry Pi-based parking management system for smart campus. Internet Things 2021, 14, 100387. [Google Scholar] [CrossRef]
  26. Samuel, I.A.; Olajube, A.; Awelewa, A.A.; Utibe, B. Arduino microcontroller based underground cable fault distance locator. Int. J. Mech. Eng. Technol. 2019, 10, 890–902. [Google Scholar]
  27. Quilty, J.; Adamowski, J. Addressing the incorrect usage of wavelet-based hydrological and water resources forecasting models for real-world applications with best practices and a new forecasting framework. J. Hydrol. 2018, 563, 336–353. [Google Scholar] [CrossRef]
  28. Shaikh, M.S.; Ansari, M.M.; Jatoi, M.A.; Arain, Z.A.; Qader, A.A. Analysis of underground cable fault techniques using MATLAB simulation. Sukkur IBA J. Comput. Math. Sci. 2020, 4, 1–10. [Google Scholar]
  29. Dashti, R.; Daisy, M.; Mirshekali, H.; Shaker, H.R.; Hosseini Aliabadi, M. A survey of fault prediction and location methods in electrical energy distribution networks. Measurement 2021, 184, 109947. [Google Scholar] [CrossRef]
  30. Saleem, U.; Arshad, U.; Masood, B.; Gul, T.; Khan, W.A.; Ellahi, M. Faults detection and classification of HVDC transmission lines of using discrete wavelet transform. In Proceedings of the 2018 International Conference on Engineering and Emerging Technologies (ICEET), Lahore, Pakistan, 22–23 February 2018; pp. 1–6. [Google Scholar]
  31. Kapoor, G. Evaluation of fault location in three phase transmission lines based on discrete wavelet transform. ICTACT J. Microelectr. 2020, 6, 890–897. [Google Scholar]
  32. Ali, M.S. Investigate the Effect of Artificial Neural Network Parameters to Improve Fault Distance and Impedance Accuracy. In Proceedings of the IOP Conference Series: Materials Science and Engineering, Sanya, China, 12–14 November 2021; Volume 1127, p. 12037. [Google Scholar]
  33. Rajpoot, S.C.; Pandey, C.; Rajpoot, P.S.; Singhai, S.K.; Sethy, P.K. A Dynamic-SUGPDS Model for Faults Detection and Isolation of Underground Power Cable Based on Detection and Isolation Algorithm and Smart Sensors. J. Electr. Eng. Technol. 2021, 16, 1799–1819. [Google Scholar] [CrossRef]
  34. Das, S.; Mondal, A.; Patel, B. Detection and Classification of Faults on the Transmission Line Using Lissajous Figure. In Computational Advancement in Communication Circuits and Systems; Springer: Berlin/Heidelberg, Germany, 2020; pp. 81–88. [Google Scholar]
  35. Swaminathan, R.; Mishra, S.; Routray, A.; Swain, S.C. A CNN-LSTM-based fault classifier and locator for underground cables. Neural Comput. Appl. 2021, 33, 15293–15304. [Google Scholar] [CrossRef]
  36. Paul, D.; Mohanty, S.K.; Panigrahi, C.K. Classification of Power Swing using Wavelet and Convolution Neural Network. In Proceedings of the 2019 IEEE 5th International Conference for Convergence in Technology (I2CT), Pune, India, 29–31 March 2019; pp. 1–6. [Google Scholar]
  37. Ahmad, N.; Hanafi, D. Modelling and Simulation of Fault Distance Locator for Underground Cable Detection. Evol. Electr. Electron. Eng. 2021, 2, 876–884. [Google Scholar]
  38. Kulshrestha, A.; Mahela, O.P.; Gupta, M.K.; Gupta, N.; Patel, N.; Senjyu, T.; Danish, M.S.S.; Khosravy, M. A hybrid fault recognition algorithm using stockwell transform and wigner distribution function for power system network with solar energy penetration. Energies 2020, 13, 3519. [Google Scholar] [CrossRef]
  39. Mahela, O.P.; Khan, B.; Alhelou, H.H.; Siano, P. Power quality assessment and event detection in distribution network with wind energy penetration using stockwell transform and fuzzy clustering. IEEE Trans. Ind. Inform. 2020, 16, 6922–6932. [Google Scholar] [CrossRef]
  40. Ram Ola, S.; Saraswat, A.; Goyal, S.K.; Sharma, V.; Khan, B.; Mahela, O.P.; Haes Alhelou, H.; Siano, P. Alienation coefficient and wigner distribution function based protection scheme for hybrid power system network with renewable energy penetration. Energies 2020, 13, 1120. [Google Scholar] [CrossRef]
  41. Reda, A.; Al Kurdi, I.; Noun, Z.; Koubyssi, A.; Arnaout, M.; Rammal, R. Online Detection of Faults in Transmission Lines. In Proceedings of the 2021 IEEE 3rd International Multidisciplinary Conference on Engineering Technology (IMCET), Beirut, Lebanon, 8–10 December 2021; pp. 37–42. [Google Scholar]
  42. Aftab, M.A.; Hussain, S.M.S.; Ali, I.; Ustun, T.S. Dynamic protection of power systems with high penetration of renewables: A review of the traveling wave based fault location techniques. Int. J. Electr. Power Energy Syst. 2020, 114, 105410. [Google Scholar] [CrossRef]
  43. Dashtdar, M.; Dashti, R.; Shaker, H.R. Distribution network fault section identification and fault location using artificial neural network. In Proceedings of the 2018 5th International Conference on Electrical and Electronic Engineering (ICEEE), Istanbul, Turkey, 3–5 May 2018; pp. 273–278. [Google Scholar]
  44. Gowrishankar, M.; Nagaveni, P.; Balakrishnan, P. Transmission line fault detection and classification using discrete wavelet transform and artificial neural network. Middle-East J. Sci. Res. 2016, 24, 1112–1121. [Google Scholar]
  45. Wang, Z.; Xu, L. Fault Detection of the Power System Based on the Chaotic Neural Network and Wavelet Transform. Complexity 2020, 2020, 8884786. [Google Scholar] [CrossRef]
  46. Gashteroodkhani, O.A.; Majidi, M.; Etezadi-Amoli, M.; Nematollahi, A.F.; Vahidi, B. A hybrid SVM-TT transform-based method for fault location in hybrid transmission lines with underground cables. Electr. Power Syst. Res. 2019, 170, 205–214. [Google Scholar] [CrossRef]
  47. Masood, B.; Khan, M.A.; Baig, S.; Song, G.; Rehman, A.U.; Rehman, S.U.; Asif, R.M.; Rasheed, M.B. Investigation of Deterministic, Statistical and Parametric NB-PLC Channel Modeling Techniques for Advanced Metering Infrastructure. Energies 2020, 13, 3098. [Google Scholar] [CrossRef]
  48. Zhang, S.; Zou, G.; Huang, Q.; Gao, H. A Traveling-Wave-Based Fault Location Scheme for MMC-Based Multi-Terminal DC Grids. Energies 2018, 11, 401. [Google Scholar] [CrossRef]
  49. Khavari, S.; Dashti, R.; Shaker, H.R.; Santos, A. High impedance fault detection and location in combined overhead line and underground cable distribution networks equipped with data loggers. Energies 2020, 13, 2331. [Google Scholar] [CrossRef]
Figure 1. Presence of CBs on all lines in proper relay coordination for accurate fault detection.
Energies 15 06468 g001
Figure 2. Proposed discrete wavelet transform (DWT): (a) HP and LP signal decomposition; (b) frequency bands of different bandwidths of a DWT.
Energies 15 06468 g002
Figure 3. Bewley’s lattice diagram for two-terminal traveling-wavelet-based fault-location principle.
Energies 15 06468 g003
Figure 4. Flowchart of current relay for coordination in the protection zone.
Energies 15 06468 g004
Figure 5. Flowchart of timing relay for coordination in the protection zone.
Energies 15 06468 g005
Figure 6. Flowchart of the proposed DWT methodology.
Energies 15 06468 g006
Figure 7. Simulation setup of proposed work (a case study).
Energies 15 06468 g007
Figure 8. (ac) Different wavelet detections at one end of the cable; (df) current effects; (gi) different wavelet detections at the second end of the cable.
Energies 15 06468 g008
Figure 9. Three-phase voltage waveforms that ensure that the fault has been detected after 0.01 s.
Energies 15 06468 g009
Figure 10. Three-phase current waveforms that ensure that the fault has been detected after 0.01 s.
Energies 15 06468 g010
Table 1. Comparative analysis of wavelet-transform methods for fault location.
WorkKey ContributionApproachLimitations
[15]Fault detection. DWTThere are deficiencies, including complexity and nonflexibility.
[16]Identifies the disturbances and the fault’s occurrence.CWTSlow processing.
[18,19,43]Fault detection.WT, neural network (NN),No protection zone for relay coordination.
[22]Locates the fault from the base stations in terms of kilometers.GSM as a communication link in WT technologyThe response time is slow.
[23]Fault detection.Raspberry Pi and ArduinoLess reliable.
[25,26]Observation of short circuits in underground cables.Murray loop methodOnly for short-circuit faults.
[27]Fault detection.CWTOnly for short-circuit faults.
[30]Fault detection and location.DWTNo protection zone for relay coordination.
[17,32]Fault detection and location.Artificial intelligence (AI)Only identifies the nature of the fault.
[33] Fault detection and relay coordination. DWT-and-ZigBee modelLess accuracy in fault location.
[34,35,36]Detects phase-to-phase faults.Lissajous figureOnly detects phase-to-phase faults.
[38,39,40]Fault detection and location.Wigner distribution function and DWTNo protection zone for relay coordination.
[41,42]Fault detection and optimization of the relay coordination.DWTNot suitable in cases of fault occurrence in remote locations.
[44,45]Fault detection and classification. Using DWTOnly detects and classifies the faults. The fault-location approach is not presented.
[46,47]Fault detection in power system.Using DWTNo protection zone for relay coordination
[48,49]Fault detection.Traveling-wave-based fault-location schemeMore suitable for high-impedance faults.
Table 2. Balanced and unbalanced load distributions of all phases.
NodePhase 1Phase 2Phase 3
9:11 P   ( k W ) Q   ( k W ) P   ( M W ) Q   ( k W ) P   ( M W ) Q   ( k W )
506065706555
NodeBalancedUnbalancedBalanced
3:6 P   ( k W ) Q   ( k W ) P ( k W ) Q ( k W ) P ( k W ) Q ( k W )
135.134.244.154.145.135.1
236.632.444.454.446.436.6
333.831.847.457.441.431.3
432.931.141.351.347.337.7
533.332.246.656.643.633.1
634.537.543.853.848.838.2
736.639.645.355.343.333.8
837.531.447.557.548.538.3
938.636.448.658.642.642.6
1031.134.141.751.747.737.8
1132.039.442.852.844.834.6
1235.931.645.655.648.638.2
1337.731.147.657.647.637.1
1439.833.349.459.449.439.9
1540.137.650.560.550.530.0
1643.333.853.363.655.837.8
Table 3. Transmission-line parameters of the underground cable.
ParameterCable
R 1 0.001 Ω/km
R 0 0.087 Ω/km
L 1 2.13 × 10⁻⁵ H/km
L 0 0.0003 H/km
C 1 7.22 × 10⁻⁶ F/km
C 0 10−6 F/km
Table 4. Functional times of the overcurrent relays at different fault conditions.
Overcurrent-Relay Functional Time (s)
Fault LocationRelay
1
Relay
2
Relay
3
Relay
4
Relay
5
Relay to Be Operated
9-80.090.060.03R3
10-G0.06 0.03R4
11-120.09 0.030.06R4
3-40.060.03R2
6-G0.090.060.03 R3
Table 5. Results of the different fault locations in km.
Fault TypeFault SectionActual FL (km)FR
Balanced Load
L-L9-8888
L-G10-G445
L-L11-12665
L-L3-4776
L-G6-G7.583
Unbalanced Load
AB9-8848
ABCG10-G424
AG11-12630
ABG3-4738
CG6-G7.542
Publisher’s Note: MDPI stays neutral with regard to jurisdictional claims in published maps and institutional affiliations.

