Article

Evaluation of the Economic Potential of Photovoltaic Power Generation in Road Spaces

1
Economic and Technological Research Institute of State Grid Hebei Electric Power Co., Ltd., Shijiazhuang 050021, China
2
Institute of Acoustics, Chinese Academy of Sciences, Beijing 100190, China
3
School of Geographic Sciences, East China Normal University, Shanghai 200241, China
4
State Key Laboratory of Resources and Environmental Information System, Institute of Geographic Sciences and Natural Resources Research, Chinese Academy of Sciences, Beijing 100101, China
5
College of Resource and Environment, University of Chinese Academy of Sciences, Beijing 100049, China
*
Author to whom correspondence should be addressed.
Energies 2022, 15(17), 6408; https://doi.org/10.3390/en15176408
Submission received: 6 August 2022 / Revised: 28 August 2022 / Accepted: 30 August 2022 / Published: 2 September 2022
(This article belongs to the Section A2: Solar Energy and Photovoltaic Systems)

Abstract

:
Photovoltaic (PV) power generation has become an important clean energy generation source. In the context of transportation development and its very large energy demand, scholars have begun to use PV power generation technology on roads and their surrounding road spaces. Current research on PV power generation in road spaces has mostly focused on its feasibility and technical potential, but there have been few studies on its economic potential. For this reason, this paper used the Zhengding County of Hebei Province, China, to study the evaluation method of the technical and economic potential of PV power generation in road spaces and to analyze the development potential of PV power generation in road spaces. The results show that Zhengding County has a very high amount of road space available for PV power generation, with an effective PV installation area of 20.98 km2 and an annual theoretical power generation capacity of 1.5 billion kWh. If the PV road space project is fully operational in 2021, it could be profitable by 2026, and the net profit (NP) could reach $705 million in 2030. The application of photovoltaic power generation in road spaces is a very promising method of sustainable energy supply.

1. Introduction

Currently, traditional fossil fuels are facing resource depletion, which also has a larger impact on the environment. Therefore, accelerating the transition from fossil energy to renewable energy is of great significance to maintaining long-term energy security. As a new and renewable energy source, solar energy has the advantages of being clean, sustainable, unlimited, cheap, and widely distributed. Since the 1990s, the amount of photovoltaic power generation has increased significantly, and photovoltaic power generation has become the main source of electricity in clean energy power generation. From the perspective of global PV installation capacity, the installed capacity of the United States, China, Japan, and India has continuously increased and maintained a strong momentum of development. PV utilization has very good prospects for development.
Photovoltaic equipment has been applied in a variety of different scenarios, such as building rooftops, bare land, and water bodies. Bodis et al. combined satellite imagery data and statistical data sources with machine learning to quantitatively evaluate rooftop photovoltaic potential with a spatial resolution of 100 m across the European Union. The results showed that approximately 680 TWh of solar electricity could be potentially generated annually [1]. Mainzer et al. improved the evaluation accuracy of roof-mounted photovoltaic technology potential with irradiance simulation and complex algorithms for power generation [2]. Sahu et al. detailed the installation methods and design schemes of surface floating photovoltaic power plants [3]; Mittal et al. reviewed the floating PV plants installed in India and proved the feasibility of installing 1 MW of floating PV plants at both Kota barrage and Kishore Sagar Lake in Kota, Rajasthan [4]. Xiao et al. and Wang verified the feasibility of desert photovoltaic power generation and proved that large-scale desert photovoltaics have high economic benefits [5,6]. At present, installation space has become a limiting factor for large-scale PV construction. To overcome this problem and promote PV development and utilization, scholars are constantly studying new PV utilization scenarios.
Similar to common PV installation scenarios such as rooftops and bare land, PVs installed in road space also have great application potential. The International Energy Agency’s (IEA) report shows that total energy consumption for transportation in 2020 was approximately 105 EJ, and transportation emissions account for approximately 27% of the total global energy-related emissions [7]. Compared to industry and construction, the transportation sector has a greater potential for reducing its energy demand. With the growth of traffic demands, the service quality and safety of road traffic have also continuously improved, which allows for more intelligent and multifunctional developments in road traffic. Subsequently, road lights, traffic signal lights, electronic display screens, charging stations, and other road auxiliary equipment consume a large amount of energy, which further increases the overall energy consumption of transportation [8]. Therefore, in addition to the traditional traffic and transportation functions, other additional functions of traffic facilities and roads have been studied. With a goal to not consume additional energy, power generation can be achieved through transportation land resources, such as roads, railways, and airports, which allows for the conversion of energy that would otherwise be dissipated and wasted into usable electricity; thus, transportation systems can be transformed from an energy consumer to an energy supplier [9]. This method also avoids the large amount of loss in the transmission and distribution of electric energy caused by remote power supplies, and, to a certain extent, can supplement the electricity needed by urban and rural residents for production and living.
The update of photovoltaic cell materials has promoted the progress of photovoltaic technology. Photovoltaic cells have been developed into three generations thus far: wafer-based (1st generation), thin film (2nd generation), and organic materials (3rd generation) [10]. The first-generation wafer-type battery has high stability and conversion efficiency, but the manufacturing process is relatively complex. The process of the second-generation thin-film battery is relatively simple, and the cost is significantly reduced. However, the commercialization efficiency is not high, and some raw materials are rare elements that are difficult to obtain, such as CdTe and CIGS. The third-generation organic-material battery has the advantages of high efficiency, environmental protection, and easy industrial production. It is still in the research and development stage and has great potential [11]. With the continuous development of disciplines such as energy science and materials science, scholars have begun to apply photovoltaic (PV) power generation technology to roads and their surrounding road space. Many scholars have studied the feasibility of road PVs. One installation method of road photovoltaics is to attach PV panels to the support structure and install them within the road area. For example, SR Wadhawan et al. provided a method to quantify the potential of large-scale deployment of photovoltaic noise barrier (PVNB) systems in the country, analyzed the radiation levels and noise barrier positions, and calculated the potential and energy output of PV modules at specific positions [12]. T Zhong et al. estimated the potential PV capacity brought by noise barriers based on the existing and planned noise barriers in Nanjing [13]. Jaehoon Jung et al. proposed a method for estimating the solar energy potential of highway fill slopes using publicly available digital maps to determine the installation location of solar photovoltaic panels [14]. SS Deshmukh et al. discussed the profits as a result of the development of solar photovoltaic (PV) roofs on parking lot infrastructure for electric vehicle charging stations [15]. Another installation method of road photovoltaics is to integrate PV modules into the road and become an integral part of the road structure. For example, T Ma et al. studied the feasibility of PV pavement, and the results showed that PV floors can achieve satisfactory performance in terms of conversion performance and compression resistance and can be used as a substitute for pavement [16]. Zi and Liu et al. used Google Street View images and solar radiation models to analyze the PV distribution of roads in Boston, and proved that it can provide sufficient electricity for all electric vehicles in the city [17]. Therefore, PV power generation technology has broad prospects in road spaces [18,19].
Furthermore, some studies have evaluated the potential of PV projects. According to the estimated complexity, the evaluation method of PV potential can be divided into four areas: theoretical potential, geographical potential, technical potential, and economic potential. The theoretical potential is the solar radiation at a certain surface location, which is composed of the direct, diffuse, and reflected radiation of the real-sky global irradiation [20]. The geographical potential considers and quantifies the impact of the underlying surface state on PV installation. The geographic information system (GIS)-based method can use a computer to automatically calculate the PV potential at a specific area [21]. The results of land classification or ground object identification are used to obtain specific areas, and different ground surface characteristics are considered to simulate the received solar radiation on the underlying surface to estimate the potential of PV power generation [22,23]. The technical potential is the most common evaluation aspect, and it primarily considers the installation area and the power generation efficiency of the PV modules to calculate the theoretical power generation [24,25,26]. The last area is economic potential, and the assessment of economic potential is closely related to cost and policy support. The economic potential brought about by PV directly affects decision makers and investors, is important in the development of PV, and cannot be ignored. Recent studies only include economic potential as a portion of PV potential [27,28,29]. In the energy sector, the levelized cost of energy (LCOE) is an important quantitative indicator to measure the economic benefits of energy power generation and is often used to compare and evaluate the comprehensive economic benefits of renewable energy generation methods (e.g., PV, wind, bioenergy, and geothermal) with conventional generation methods (e.g., coal, natural gas, and large hydroelectric plants) [30]. By calculating the cost of power generation (i.e., LCOE) and the amount of electricity consumption, the economic benefits of PV installations can be evaluated [27,28]. There have also been studies that have performed more detailed calculations of economic potential. In general, calculations of net profit (NP) and the net present value (NPV) of a project after investment both consider the return on investment, net profit, and payback period [31]. This method can be adjusted based on the policies and electricity prices of different countries, thus it has a strong universality.
However, in previous studies, scholars mainly focused on the photovoltaic potential evaluation of roads with one photovoltaic installation mode, and further studies are needed to fully evaluate the photovoltaic potential of all road spaces [32]. Furthermore, most studies were limited to the quantitative analysis of geographical potential and technical potential, and the analysis of economic potential is mostly qualitative. Consequently, establishing a photovoltaic economic potential evaluation method that comprehensively considers various road spaces is of great significance.
In this paper, a quantitative assessment method of photovoltaic economic potential based on road space was proposed, with the aim of resolving the aforementioned issues. This paper conducted a comprehensive analysis of all road types in the road space, conducted a comprehensive analysis and simulation of different PV installation methods according to different types of road elements, and calculated the technical potential of PV. Based on this, the economic benefits of PV installations were quantitatively assessed using NP as the main economic indicator, with an aim to promote the scientific development and application of PV-based energy-harvesting technology for transport facilities.

2. Materials and Methods

2.1. Introduction of Data Sources
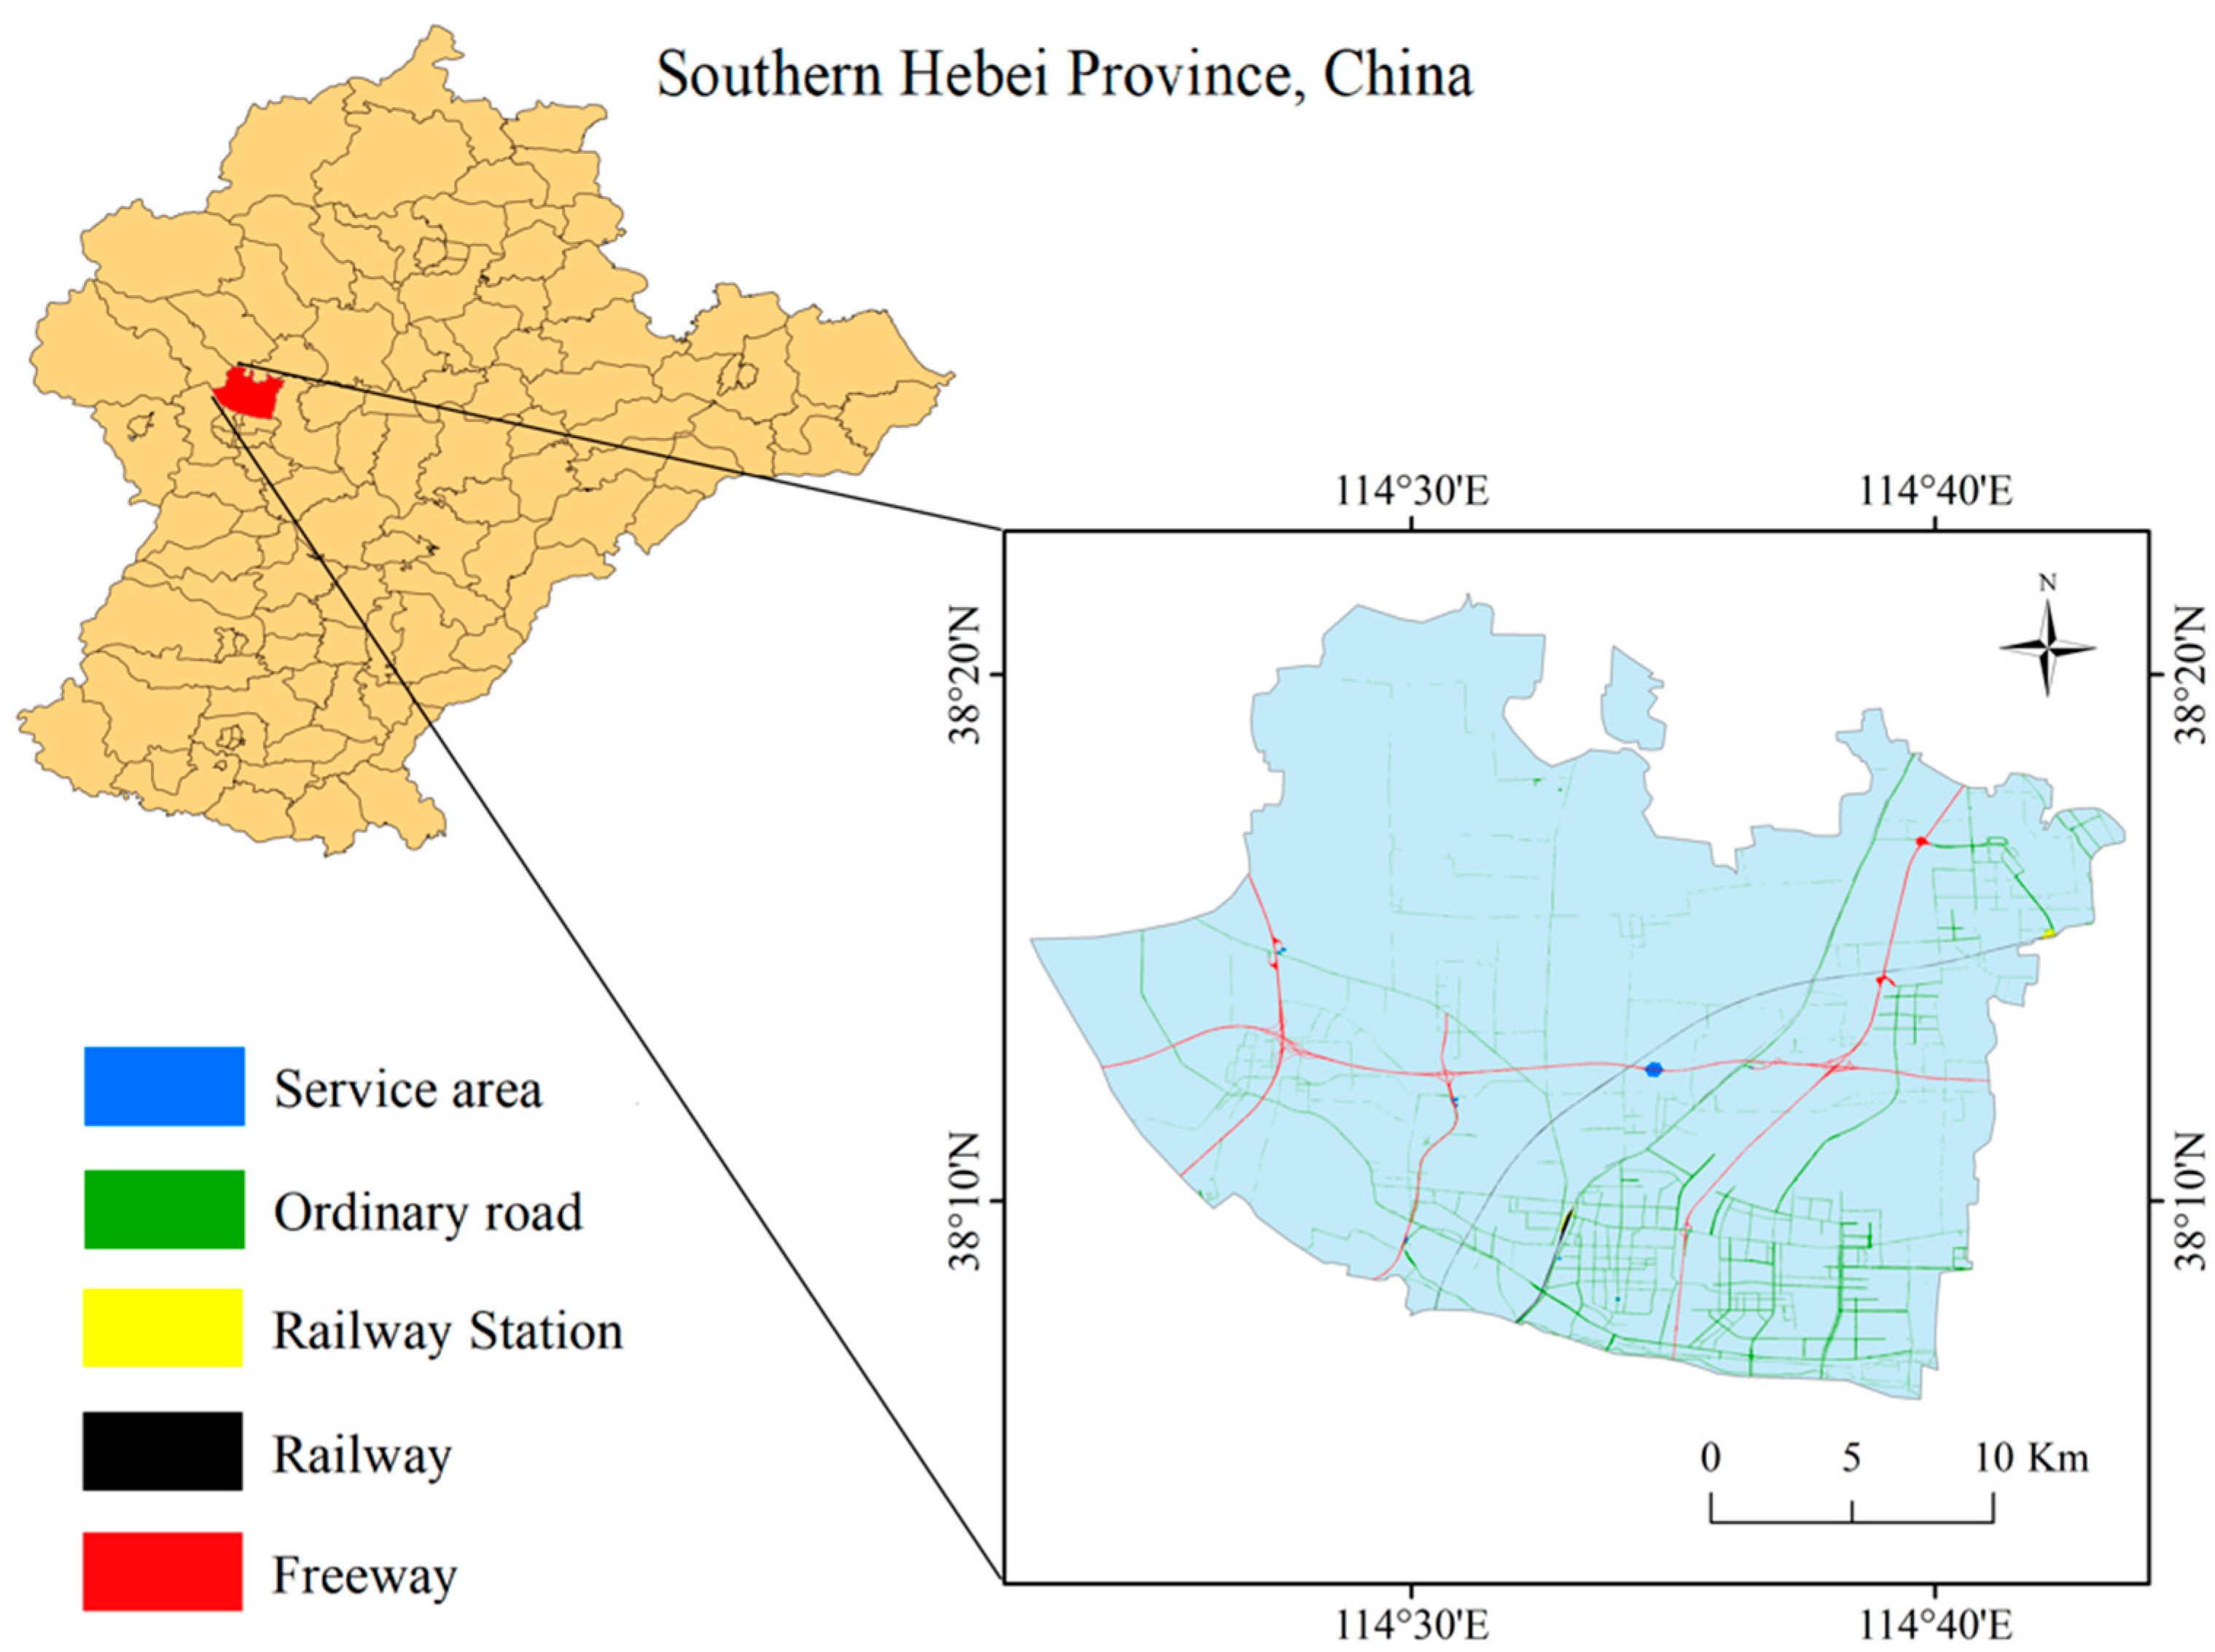
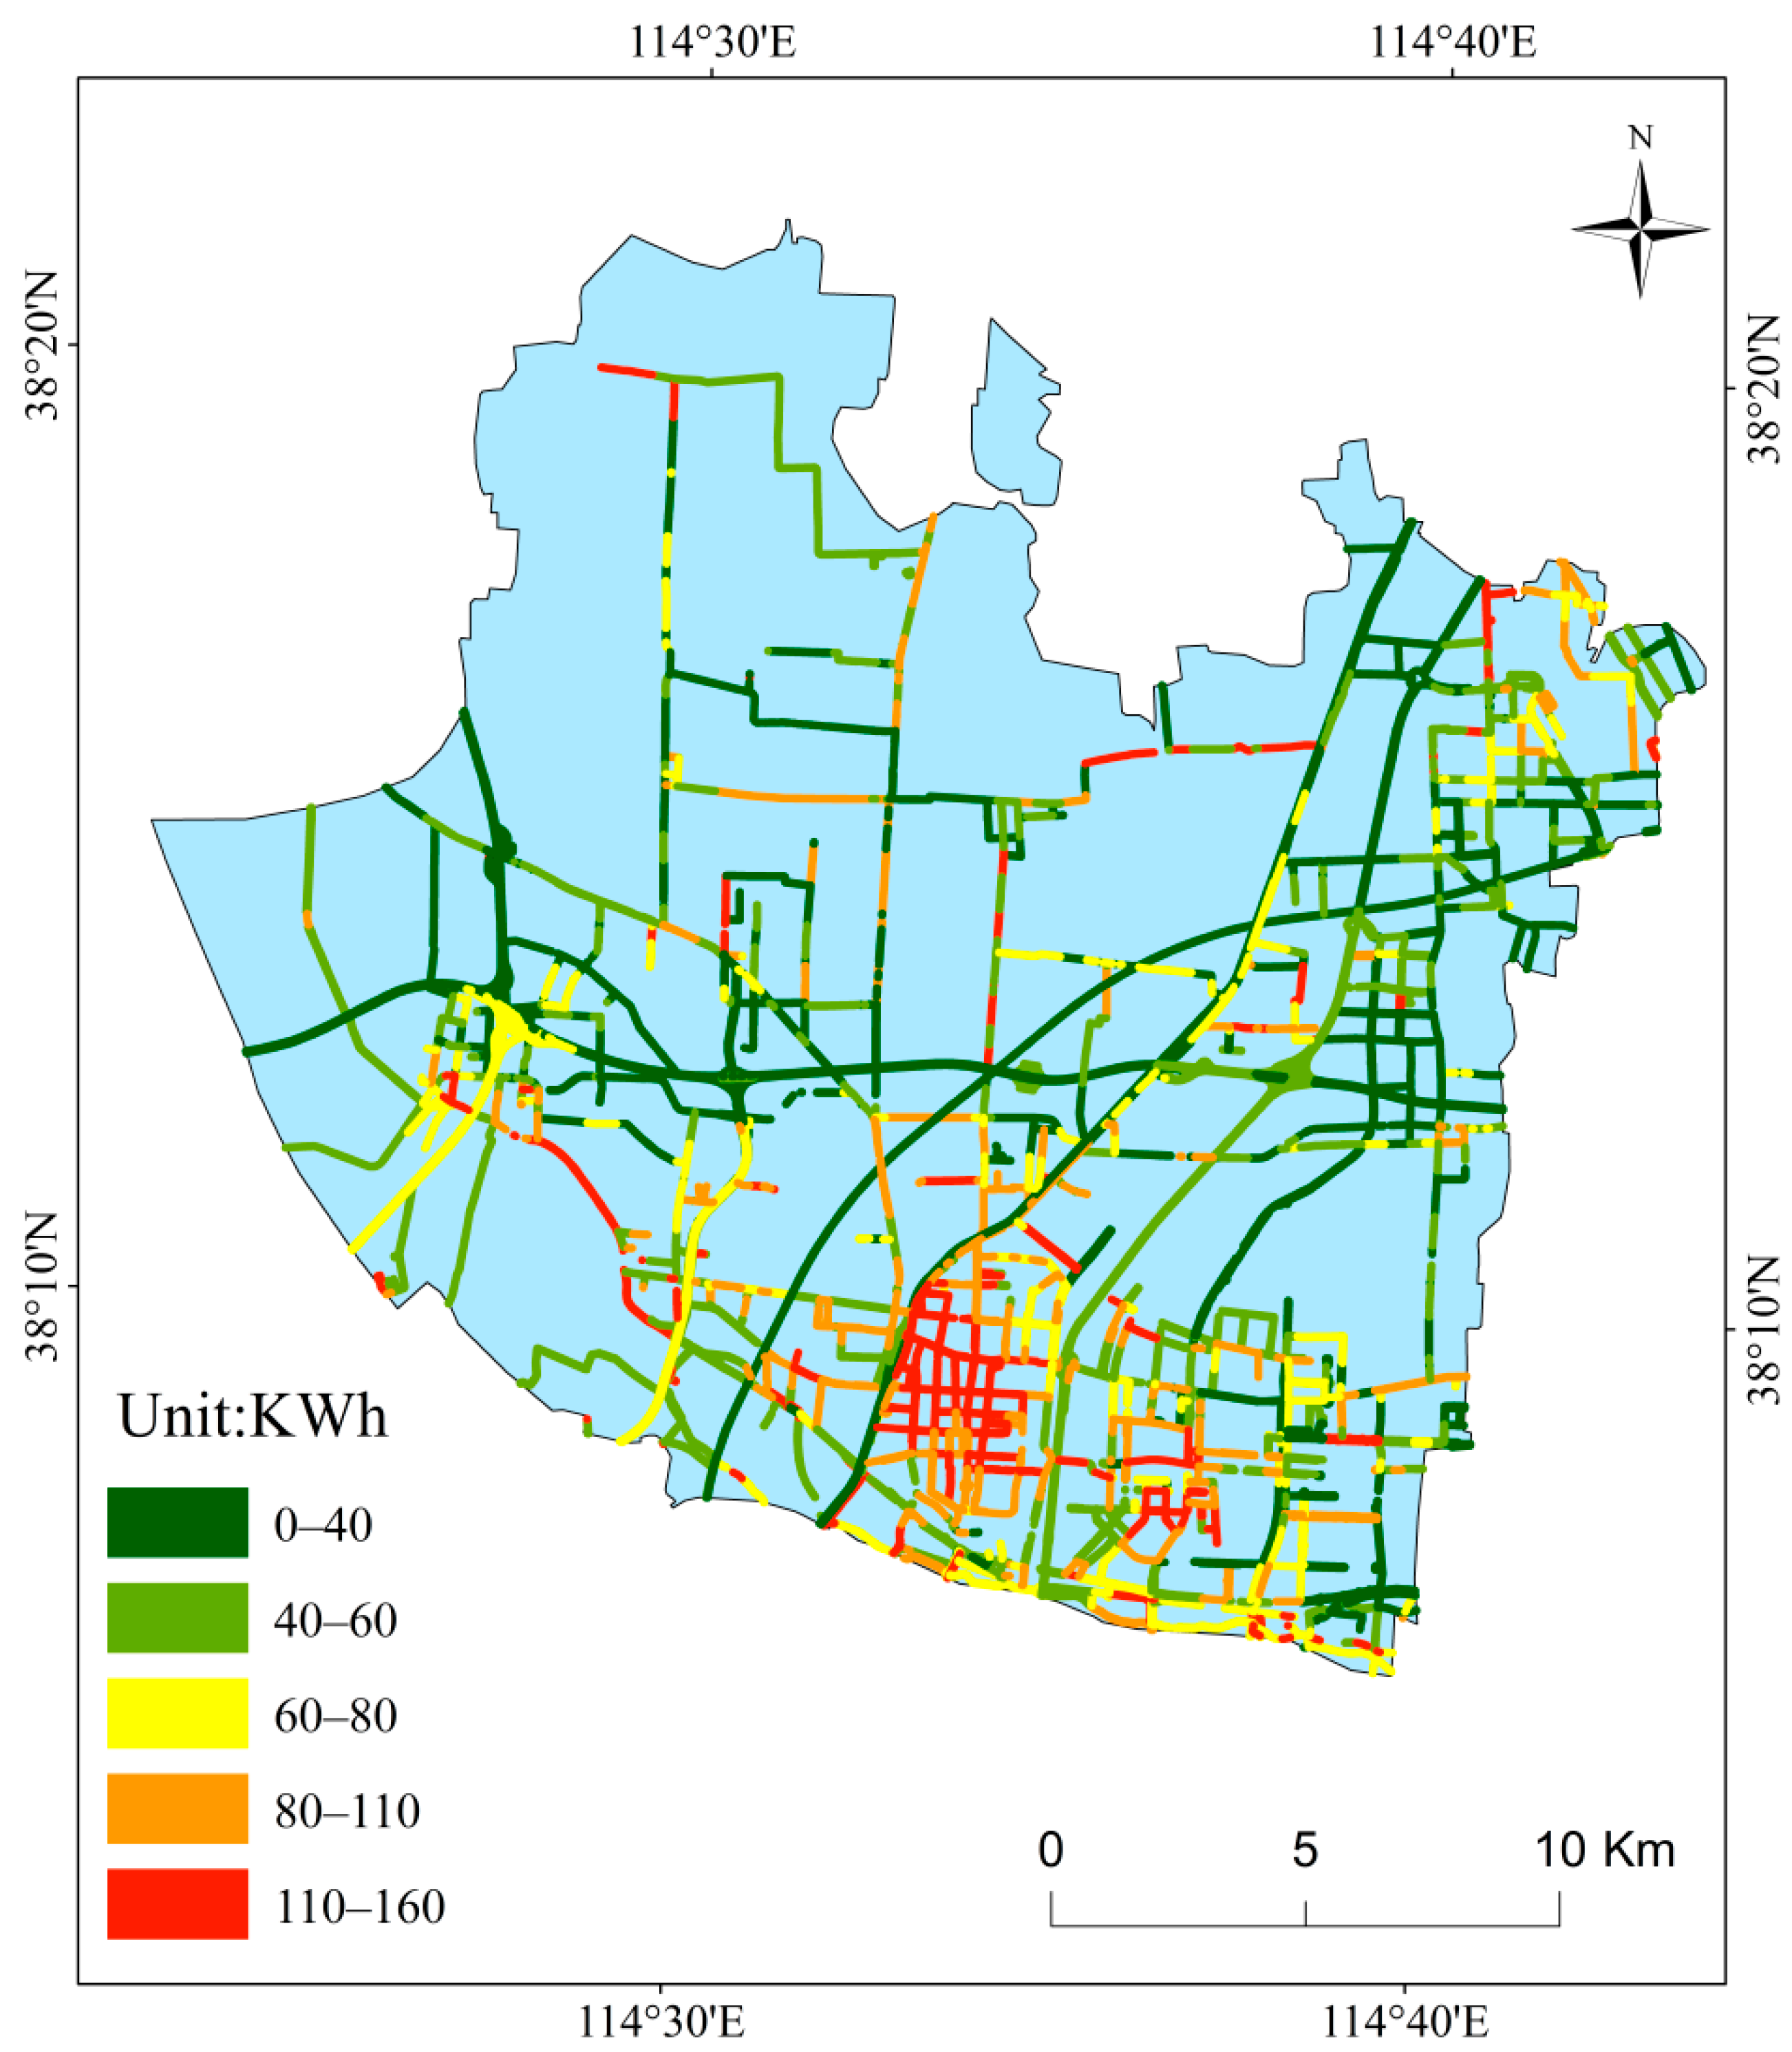
2.1.1. Study Area

Zhengding County in Southern Hebei Province was used as an example to evaluate the PV development potential of road spaces. Zhengding County is located in the North China Plain at the eastern foot of the Taihang Mountains (Figure 1). The terrain is relatively flat, with an area of approximately 486 km2 and a population of 517,000. The average annual total solar surface radiation in the county is 4960–5020 MJ/m2, and the solar energy resources are relatively stable. In recent years, due to the urban expansion of the provincial capital, Shijiazhuang, urban construction has developed rapidly and Zhengding became a pilot county for the distribution of PV development in the entire county. In addition to traditional rooftop PV, the development of road space PV is also included in the plan.

2.1.2. Data Sources

The high-resolution (10 km) surface solar radiation dataset with the integration of sunshine duration in China (1983–2017) was used because it provides the monthly high-resolution surface solar radiation data in China [33]. The resolution is 10 km, and the unit is W/m2. This dataset is based on the global high spatial and temporal resolution solar radiation dataset (1983–2017) with the ISCCP-HXG cloud product as the main input. This product uses a geo-weighted regression method and integrates the radiation data obtained from the inversion of sunshine hours from 2261 meteorological stations across China to generate the national surface solar radiation distribution data.
Based on Google Maps remote-sensing images from 2020, the roads and road spaces data in the study area were obtained by manual visual interpretation. Roads and road spaces are specifically divided into five categories: freeway, ordinary road, service area (land used for transportation facilities), railway, and railway station (land used for railways).

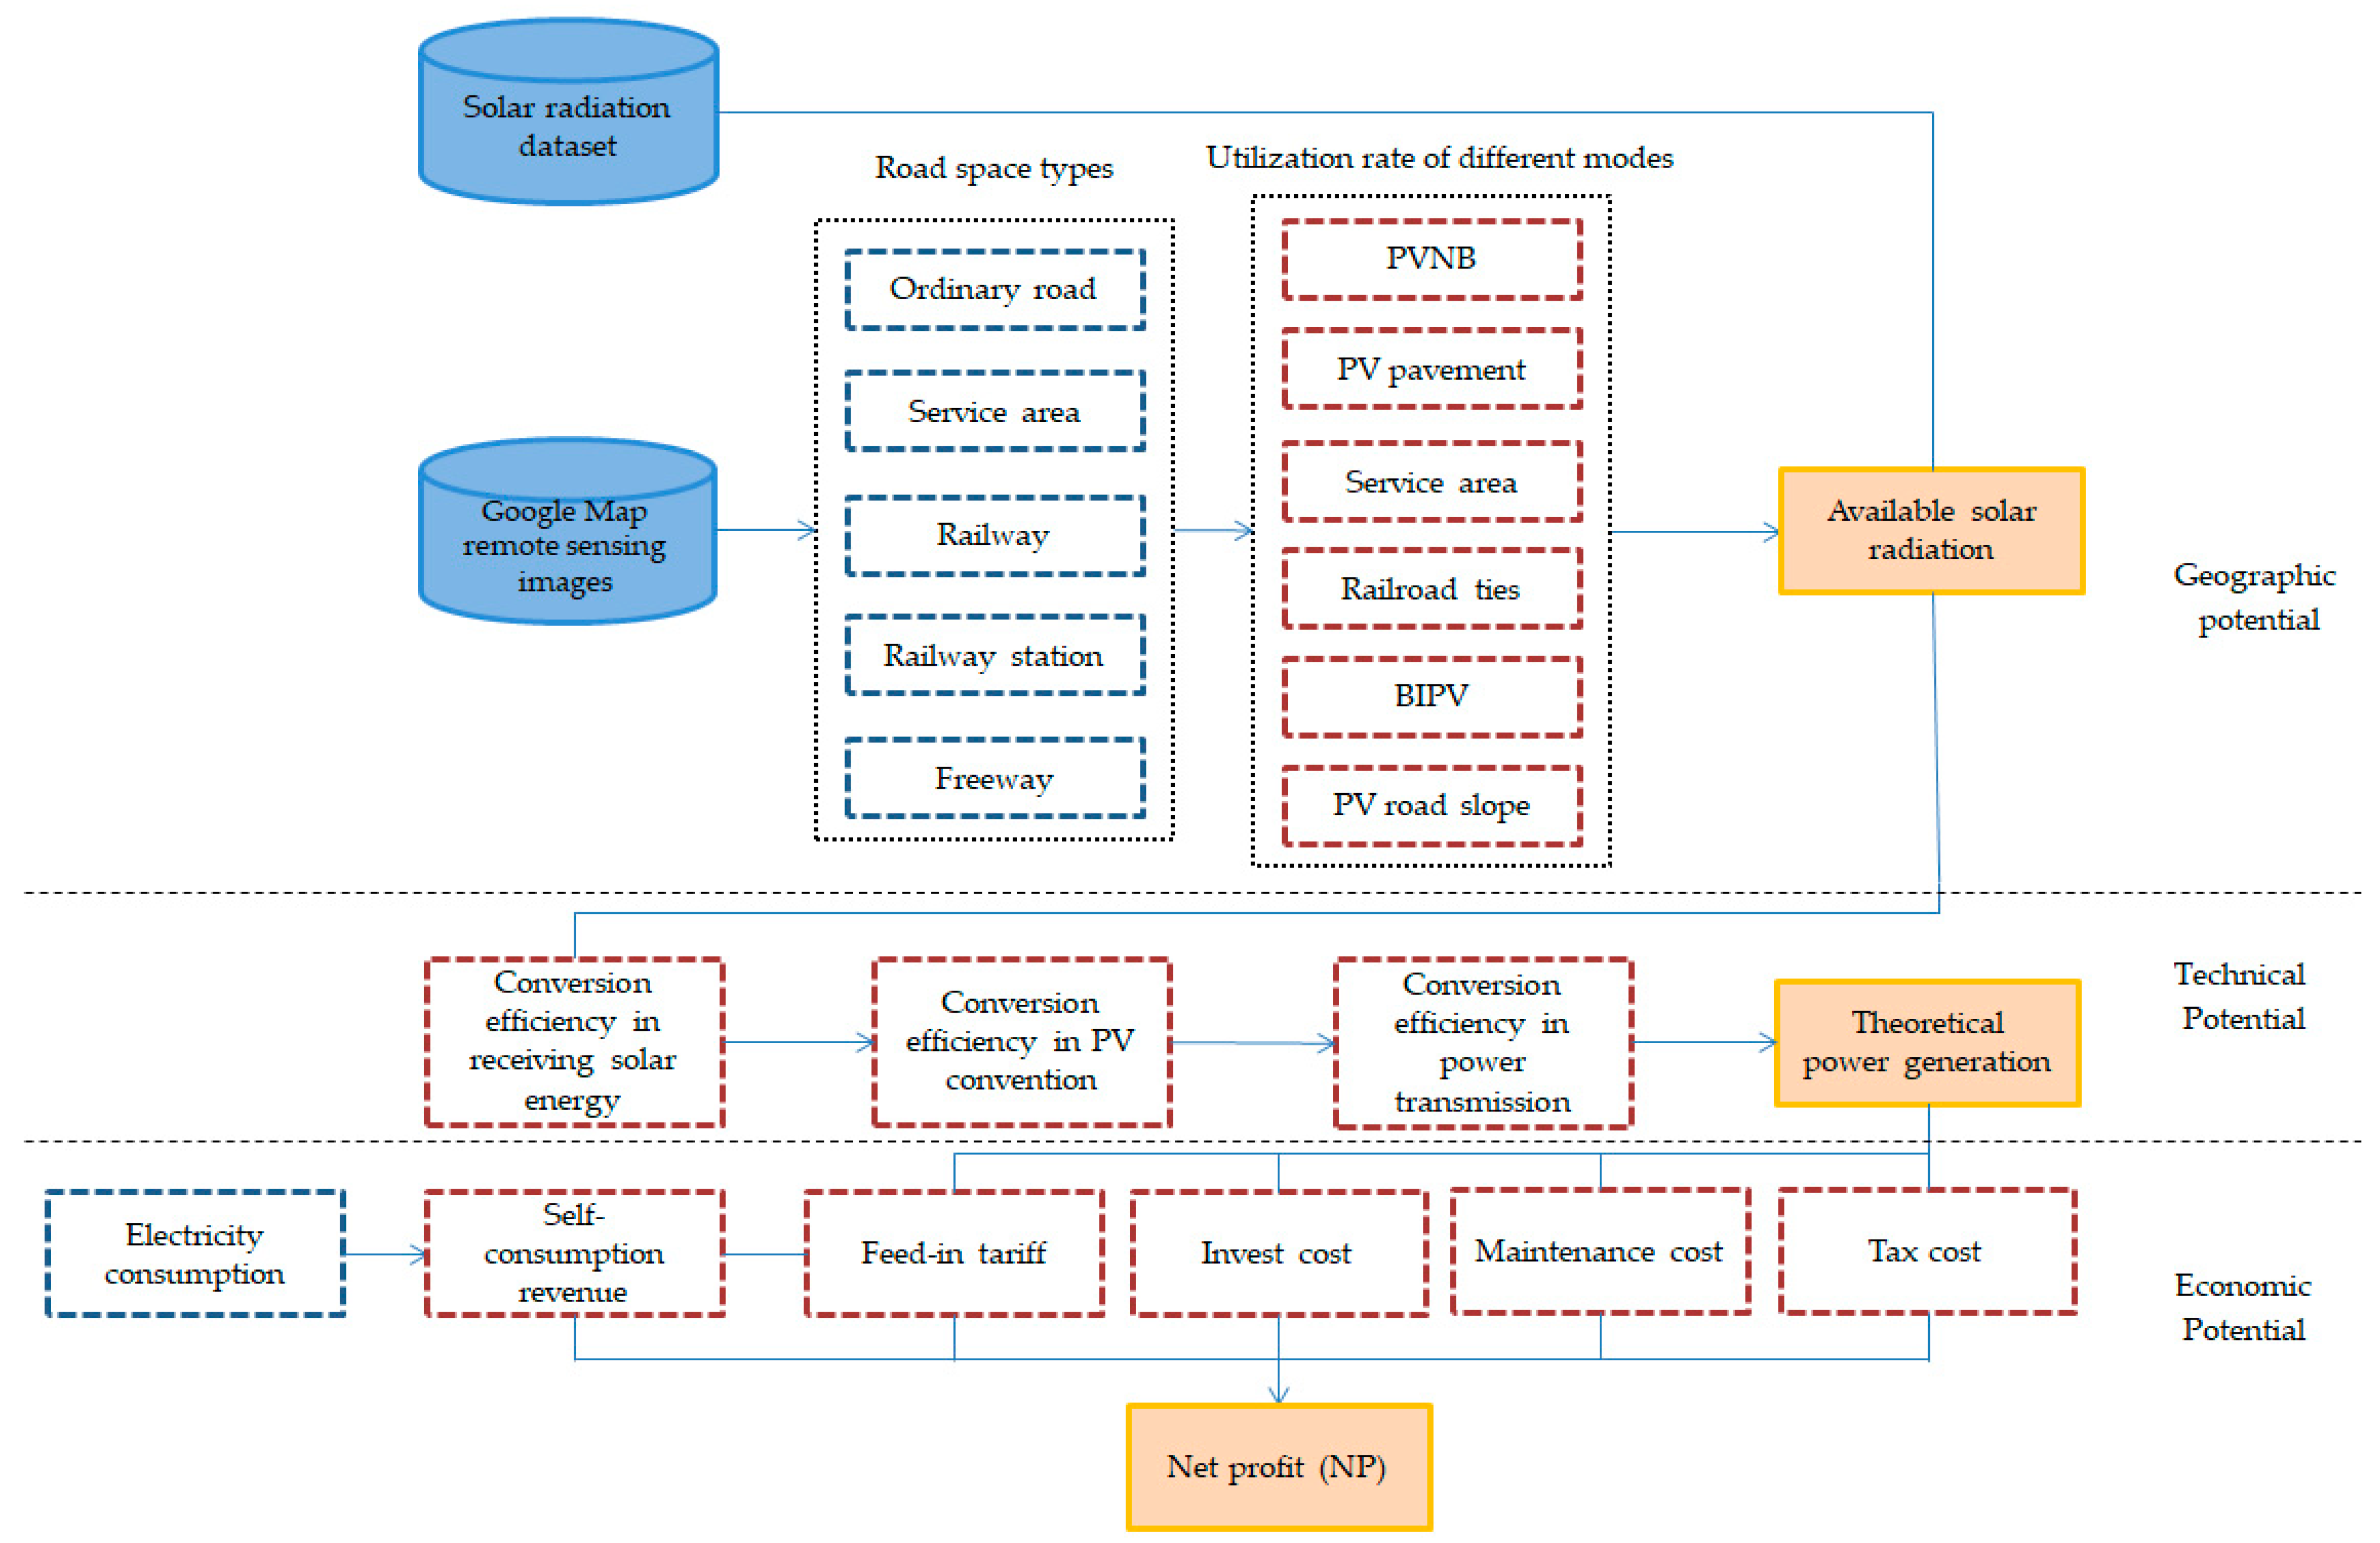
2.2. Research Methods

This research proposes an economic potential assessment method for PV installed in road spaces that integrates all the elements of the road. The input data mainly relies on the solar radiation dataset and road spaces captured by visual interpretation. Furthermore, some steps require parameters obtained from the literature or online sources. The method is mainly divided into the following three parts: (1) calculation of the geographical potential of PV in the road space, which analyzes different utilization rates of road types with different PV installation; (2) calculation of the technical potential of PV in the road space by analyzing the conversion efficiencies in the process of converting solar energy into electricity; (3) calculation of the economic potential of PV in the road space using NP, which consists of investment cost, maintenance cost, self-consumption income, feed-in tariff, and electricity tax. Figure 2 shows the specific process flowchart.

2.2.1. Geographic Potential Calculation

The road space land available for PV can be divided into five categories: freeway, ordinary road, service area (land used for transportation facilities), railway, and railway station (land used for railways). Based on the available PV area for different land use types, the geographical potential is calculated with the following equation [34,35]:
E g e o = i = 0 A i α i R .
where Egeo refers to the geographical potential, i refers to the number of available land types for PV, R refers to the solar radiation value, Ai refers to the area of the PV array deployed in a certain installation mode, and αi is the space utilization rate for PV. The value of α is different based on the different installation methods.
Based on the different types of land use and the surrounding environments, different PV installation methods are selected to achieve the maximum space utilization rate for PV. The selected PV installation method should be the one that can provide the largest amount of power generation, is easy to implement, and does not affect the use of the land itself.
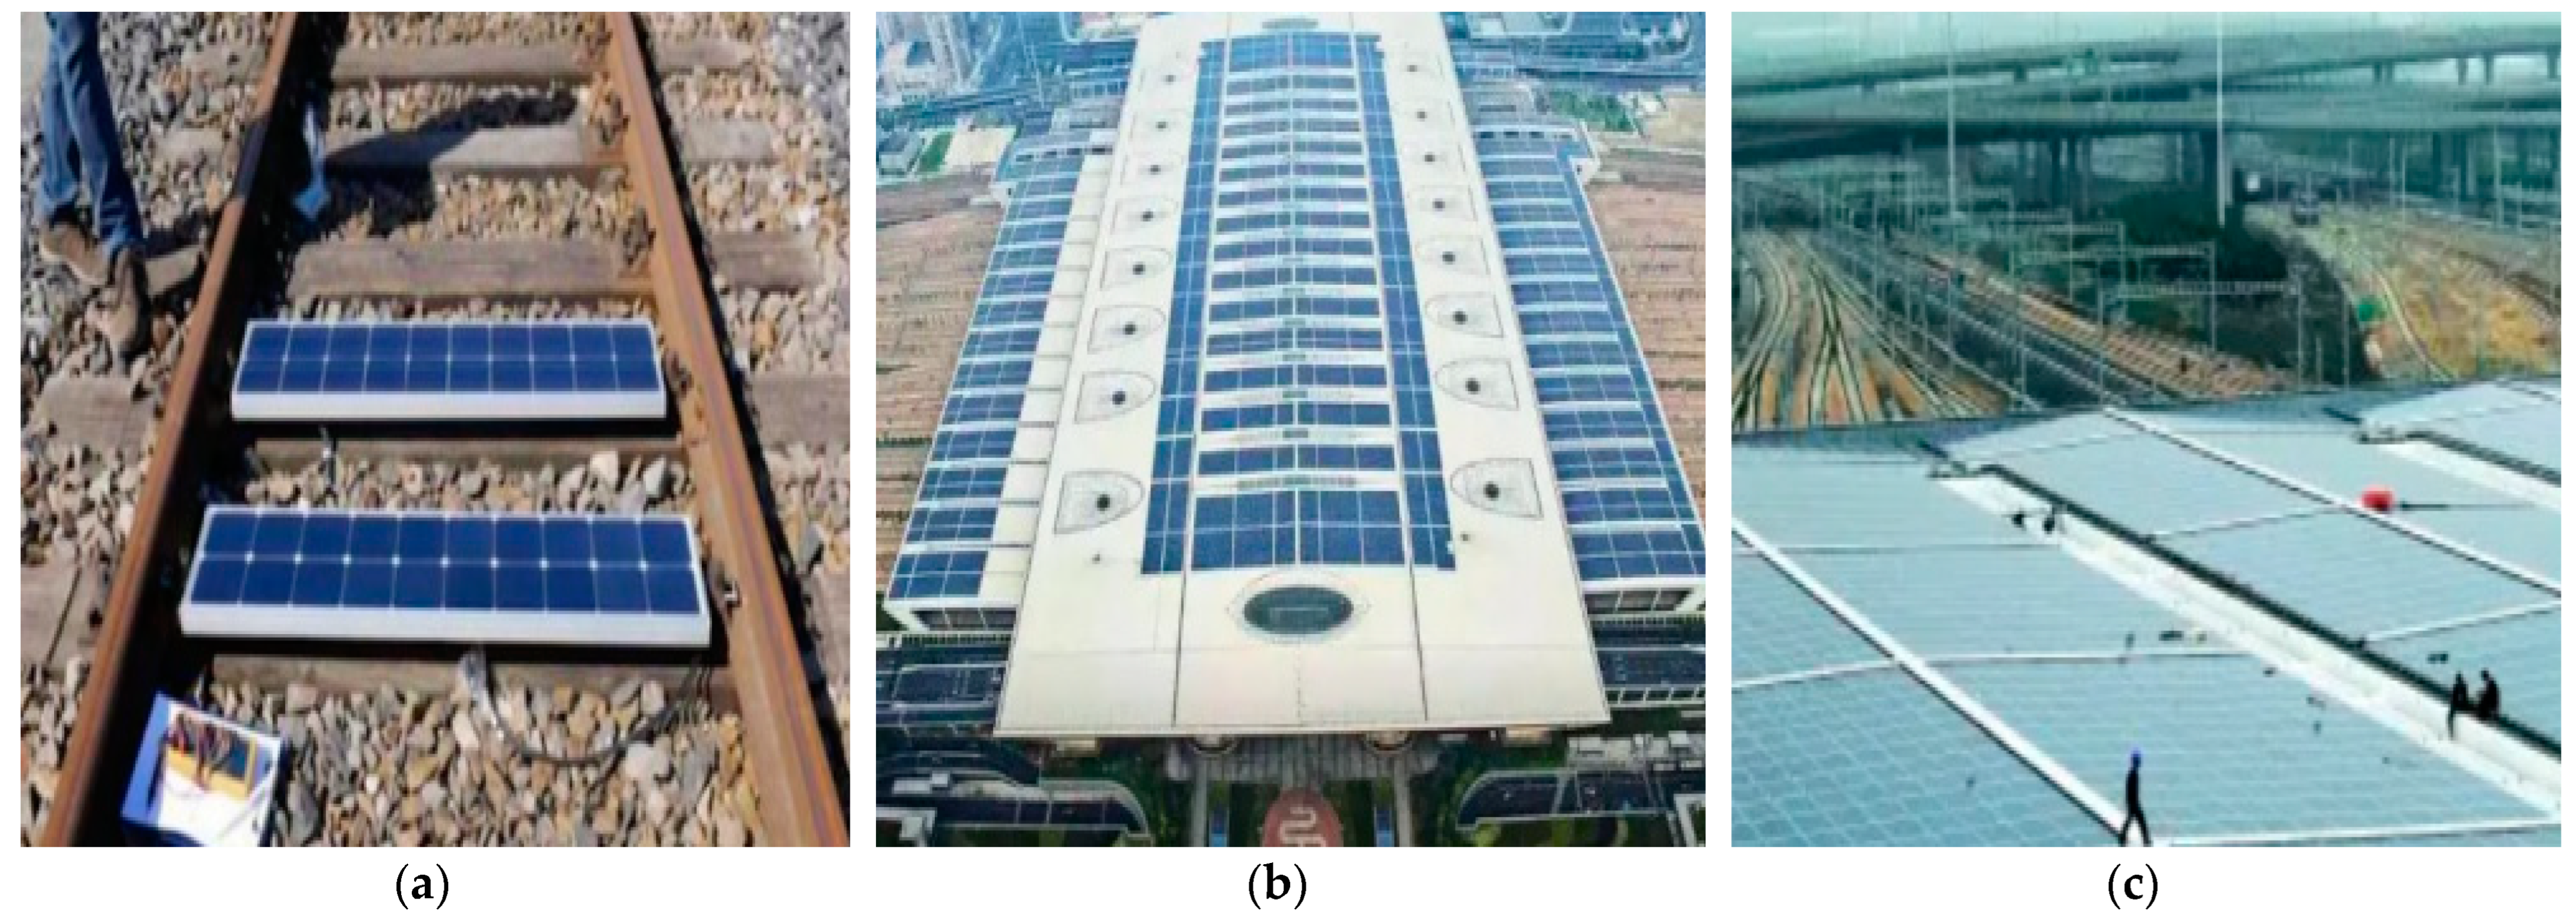
  • Freeway and ordinary road
There are three PV installation methods for freeways and ordinary roads, which are PV noise barrier, PV on road slope, and PV pavement, as shown in Figure 3.
PV noise barrier: the combination of noise sound barriers and PV systems to reduce traffic noise while generating electricity. The installation of photovoltaic sound barriers in densely populated urban areas can not only reduce the interference of noise on residential areas but also reduce the loss in power transmission and the emission of pollutants. The layout of the PV noise barrier is related to the direction of the road, and the inclination angle of PV modules is close to vertical [36]. It requires little road space, and the area of the photovoltaic sound barrier should be simulated and calculated according to the length of the road.
PV on road slope: the installation of PV modules on the slope along the road. For closed roads (such as highways), photovoltaic modules can be continuously laid along the road to generate a large amount of electricity, which can be used for cameras and street lights along the road. The use of equipment such as charging stations has high economic potential. The United States, Germany, Japan, China, and other countries have conducted beneficial explorations of PV road slopes [37,38,39].
PV pavement: a brand-new multifunctional pavement that uses PV panels to replace traditional cement or asphalt pavement, or to directly pave the PV power generation layer on the surface of the existing pavement. Its research started relatively late. In 2011, the French company COLAS conducted research on the flexible SP of solar thin-film cells; in 2016, it laid a PV road with a length of 1 km and an area of 2800 m2 in Normandy [40]. The PV pavement test project was also carried out on the highway around the city. China has also carried out an experimental PV pavement project on the Jinan Bypass expressway. The pavement length was 1.08 km, and the road area was 7290 m2; the PV panel has a length of 21.5 m, a width of 2.46 m, and a total area of 5874 m2 [41].
The selection of the PV installation method requires comprehensive consideration of the geographical environment and the amount of sunlight that is blocked. As a part of a freeway, the freeway slope is usually located in suburbs with low building density and the surrounding environment is relatively empty, which means only a low amount of sunlight is blocked by buildings or trees; therefore, it has a relatively large open space. Furthermore, when considering the construction cost, PV on the road slope is the optimal choice for a freeway. Due to the differences in reasons and methods of slope construction, in reference to existing cases [37] and literature [32], the slope length on both sides of the freeway is conservatively set to 5 m [36]. In this paper, ordinary roads include major roads such as China national highways, provincial highways, and county roads. Ordinary roads distributed near densely-populated residential areas (ORDA) are close to residential buildings, so the construction of PV noise barriers can effectively isolate noise. Considering the rule of noise attenuation, the PV noise barrier heights are usually no greater than 3 m. After excluding the gap between the supports and the PV panel, the height of the PV panel should be 2 m [44]. For ordinary roads in non-populated areas (ORNA), solar pavement can be used. In addition, because not all areas are suitable for the installation of PV panels, in reference to the literature and existing PV projects [36,37,40], the PV utilization rates of the road slope, solar pavement, and PV noise barrier are 75%, 46%, and 98%, respectively. Table 1 shows the PV installation methods and space utilization rate for PV in correlation to various land types, where Ai represents the usable area of PV panels, S represents the road area, and L represents the road length.
2.
Service area (land used for transportation facilities)
In theory, most freeway service areas in China can be used for the installation of PV panels, except for service facilities and green areas. According to the local standard of Hebei Province in the study area [45], the area of service facilities and green areas in the first-class service area of six-lane freeways is 11,000 km2, and the land area of the first-class service area of six-lane freeways is 76,000 km2; therefore, the space utilization rate of the service area for PV can reach 85%.
3.
Railway
Railway-based PV refers to a type of PV installation that uses railroad ties. In June 2018, Bankset Energy began the installation of 200 MW solar panels on 1000 km of railroad tracks in Germany [46] by using silicone resin to attach and fix Al solar panels to existing railroad ties, as shown in Figure 4. Based on the Chinese railway standard, the usable area of a single railroad tie for PV is 0.55 m2. Railroad ties are laid at 1667/km, i.e., the spacing is 60 cm, and the utilization rate of PV on railroad ties is approximately 27%.
4.
Railway station (land used for railways)
Stations and other railway lands for PV mainly refer to rooftop PV systems, and the available rooftop spaces are mainly in two areas: station buildings and canopies. These are collectively known as the BIPV project of the railway station. The development of station rooftop PV systems is relatively mature, and there are many completed projects. Crystalline silicon solar panels rated at 230 W were installed for the Hangzhou East Railway Station building-integrated photovoltaic (BIPV) project. There are a total of 23,480 panels on the station building, including 12,900 panels on the south shed and 7300 panels on the north shed. The total installation area of PV is 79,000 km2, which accounts for 23% of the total area [47]. For the Shanghai Hongqiao Railway Station BIPV system, the total installation area is 34,600 km2, which accounts for 31% of the total area [48]. For the Jinan–Qingdao high-speed railway BIPV project, the total area of the canopy is 350,000 m2, and the total installation area is 120,000 m2. According to existing projects and the related literature [34], the space utilization rate of PV for railway stations is 30%.

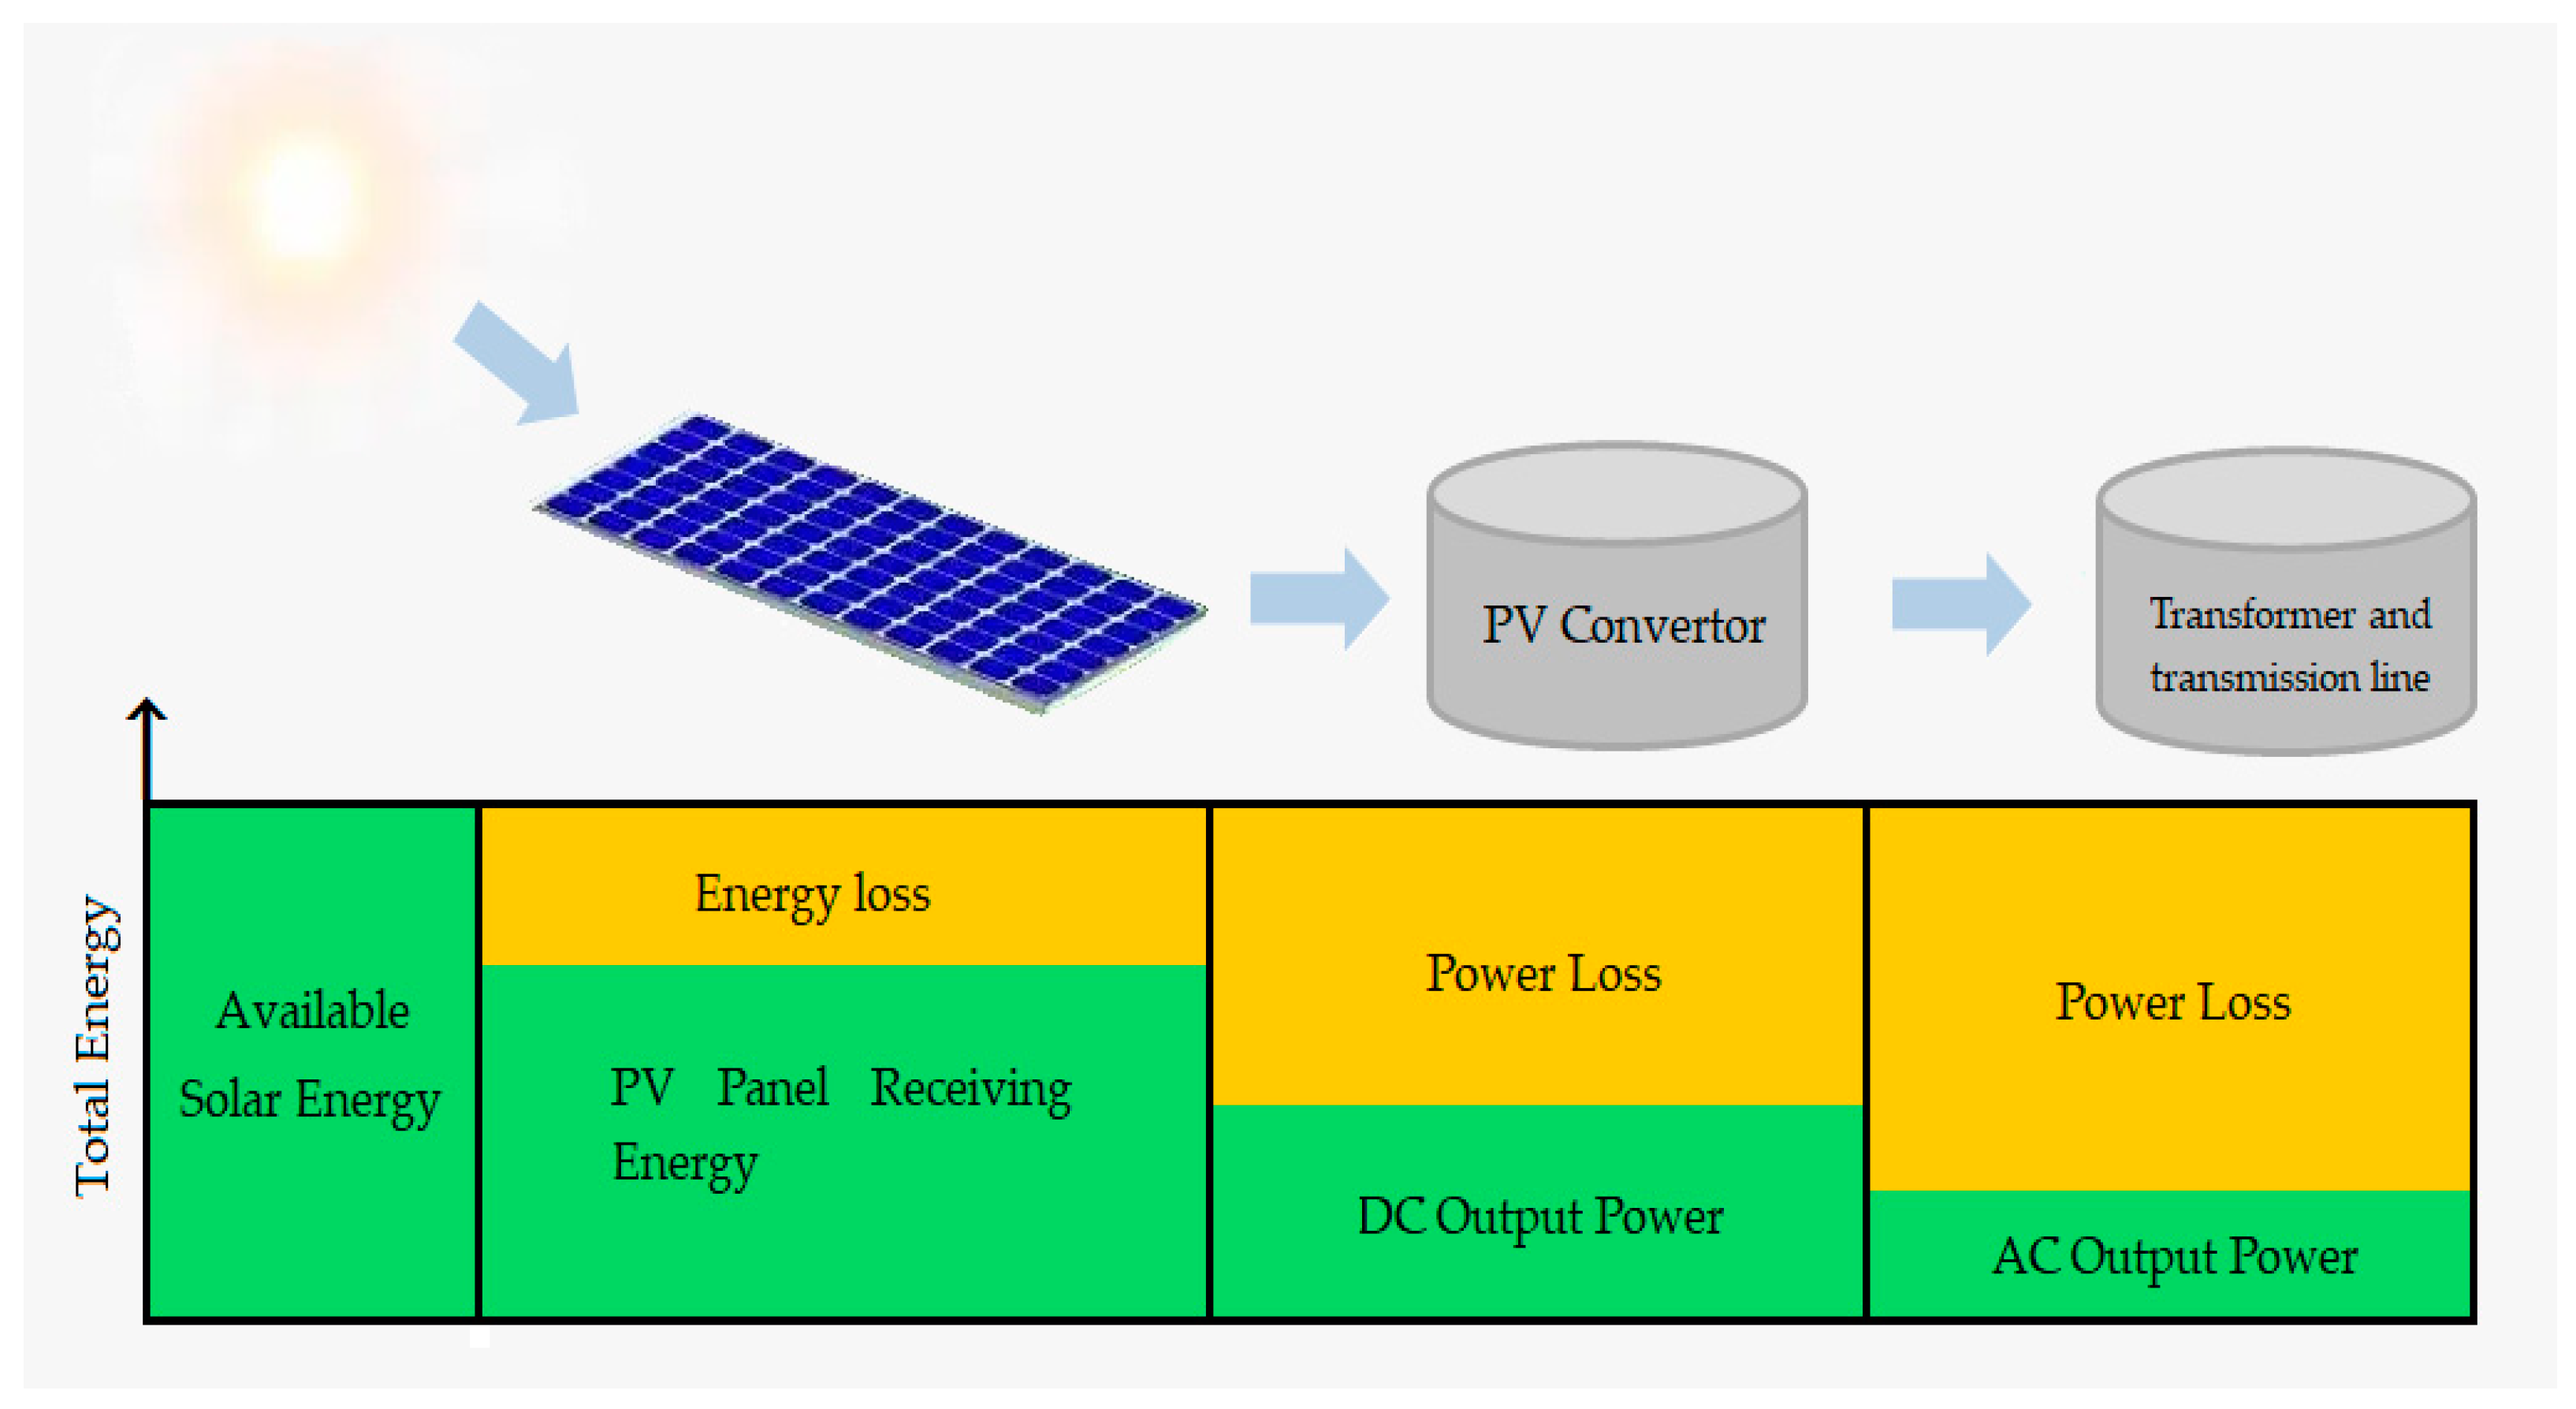
2.2.2. Calculation of Technical Potential

The process of converting solar energy into electricity can be divided into three stages. In the first stage, solar energy is directly received by the PV panel. Due to the influence of external environmental factors, the total solar radiation energy could be weakened to a certain extent; therefore, there is a gap between the solar energy received by the PV panel and the actual solar radiation. The second stage is the PV conversion process, through which the received solar energy is converted into electric energy by the PV panel. The third stage is the electric power transmission process. Since the electric energy is transmitted through the converter, the line, and the transformer, there are varying degrees of reduction. The entire process is shown in Figure 5.
Based on the solar energy attenuation in the three processes, the technical potential is calculated based on the available area for PV of each land use type, and the formula is as follows [32]:
E t e c = η 1 · η 2 · η 3 · E g e o
where Etec refers to the potential of PV technology, η1, η2, and η3 are the conversion efficiencies of the three processes, and Egeo refers to the geographic potential of PV.
For the first part, traffic flow, dust, solar radiation angle, and vegetation shading are the main factors that weaken solar radiation. Ref. [49] studied the impact of traffic on the power generation performance of solar pavement. The reduction rate reached a minimum value of 2.09% in June and a maximum value of 3.25% in December; the average reduction rate was approximately 2.6%, and the availability was 97.4%. According to Ref. [50], the impact of dust on PV panels with rain-washing is between 2% and 4%, while the impact of dust on PV panels without rain-washing increases to approximately 10%. Therefore, the reduction rate caused by surface dust is 6%, i.e., the availability is 94%. In the early morning and evening, due to the angle of incoming solar radiation, the solar radiation cannot meet the conditions to start the PV panel for energy conversion. Therefore, approximately 2% of the radiation is unavailable in the morning and evening, and the availability is 98%. For the non-road parts and railroad ties, there is no need to consider the reduction rate brought by traffic flow. For road slopes and PV noise barriers, the orientation angle of the PV panels could reduce the received solar radiation, which is mainly related to the latitude of the location. The latitude of the study area is 38°N. Based on engineering experience at the same latitude, there is a quadratic relationship between the availability coefficient and the orientation angle x of the PV panels, which is determined by the road orientation. The last part is the impact of vegetation shading. According to relevant studies, the attenuation of solar radiation caused by vegetation shading is related to the fractional vegetation cover (FVC) [51], and the VC can be estimated based on the normalized difference vegetation index (NDVI) [52]. Five factors and corresponding availability coefficients are shown in Table 2.
In the second part of the PV conversion process, the conversion efficiency of the PV module is related to the solar panel material. The average efficiency η2 of the PV conversion process is calculated with Equation (3).
η 2 = 23 % × 75 % = 17.3 %
The average conversion efficiency of monocrystalline silicon PV panels is 23%, the average conversion efficiency of polycrystalline silicon PV panels is 16%, the conversion efficiency of amorphous silicon PV panels is 10%, and the conversion efficiency of thin-film polycrystalline silicon PV panels is 8% [35]. Currently, monocrystalline silicon is the main PV panel material and occupies most of the PV market. Therefore, the average conversion efficiency of monocrystalline silicon PV panels is used. The conversion of solar energy into electricity is also affected by temperature. When the temperature of the PV panel is greater than 25 °C, the output power exhibits a downward trend. According to Ref. [32], temperature can cause a reduction rate of approximately 4%, and the operating efficiency of the PV system is generally between 75% and 80%, therefore, 75% is taken as the standard.
In the third part of the power transmission process, the transmission efficiency is related to three factors: the converter efficiency, the power plant efficiency, and the availability efficiency, as shown in Equation (4).
η 3 = 96 % × 95 % × 98 % = 89.4 %
where η3 is the efficiency of the power transmission process. According to actual engineering experience, the average efficiency of the grid-connected converter is 96%. The power loss of the transmission line and the step-up transmission substation usually accounts for 5% of the total power generation, so the power plant efficiency is set to 95%. Considering the power loss caused by line maintenance and power failure, the availability efficiency is assumed to be 98% [32].

2.2.3. Calculation of Economic Potential

Net present value (NPV) is closely related to internal rate of return (IRR). The theoretical IRR of distributed photovoltaics is around 8–10% in China. However, in practice, there are many factors that affect the IRR. The irregular power cuts in the research area greatly reduce the internal rate of return, which makes it difficult to estimate an accurate IRR. Thus, net profit (NP), rather than NPV, was used to measure economic potential. The larger the NP, the better the scheme and the greater the investment benefit. According to Ref. [20], NP has five parts: investment cost, maintenance cost, self-consumption income, feed-in tariff, and electricity tax. In this study, the NP was recalculated based on China’s PV policy.
N P = R c o n + R f e e d i n C i n v C m a i n t C t a x
where Rcon represents the income from self-consumption, Rfeed-in represents the feed-in tariff, i.e., the income of surplus energy that is produced at home via PV panels and provided to the National Grid, Cinv represents the investment cost, Cmaint represents the maintenance cost, and Ctax represents the tax expenditure. The total electricity consumption of the transportation industry was used as self-consumption electricity (Econ) for each year in the future, and the annual amount of electricity sent to the grid could be calculated by Rcon and the theoretically-calculated power generation (ET). Since the calculation of investment and maintenance costs require equivalent power (EP), the theoretical power generation (kWh) of each land lot is divided by the corresponding annual equivalent utilization hours (h) to obtain the EP (Kw) as the value of power generation. Table 3 illustrates the calculation of the five parts.
The initial full investment (Cinv) of ground-based PV systems in China mainly comprises key equipment costs such as components, inverters, supports, cables, primary equipment and secondary equipment, land costs, power grid access, building installation, and management costs [53]. Among them, the primary equipment includes pad-mounted transformers, main transformers, switchgear, step-up transmission substations (50 MW, 110 kV), and other equipment; secondary equipment includes monitoring and communication equipment. The land cost includes the full cycle land rent and vegetation restoration fees or related compensation fees, while the cost of grid connection includes the modification fee for sending surplus electricity (50 MW, 110 kV, and 10 km). Management costs include pre-management, survey, design, and bidding costs. Construction and installation costs mainly include labor costs, earthwork costs, and conventional rebar and cement costs. Among them, installation and management costs (including equipment, land fees, cost of grid connection, construction and installation, and management fees) have little room for reduction in the future. The cost of key equipment such as components and inverters may still decrease with technological progress and large-scale benefits. In 2021, the average Cinv of ground-based PV systems in China was $0.61/W, and the average maintenance cost (Cmaint) was $0.007/W/year [54]. The projected changes in average investment costs over the next 10 years are shown in Figure 6.
The income from self-consumption (Rcon) can reduce the electricity cost, and its value is related to the price of electricity. For the transportation service industry, the average electricity price is $0.1/kWh, which is based on the commercial electricity price of the Southern Hebei Power Grid. The feed-in tariff (Rfeed-in) is the income of surplus energy that is produced via PV panels and provided to the National Grid. The relevant documents of the National Development and Reform Commission [55] formulate the guidance electricity price for centralized PV power generation. The study area is a Class III resource area that corresponds to a feed-in tariff of $0.13/kWh. The tax paid by PV power generation (Ctax) is divided into three parts: value-added tax (VAT), personal income tax (PIT), and stamp duty (SD) [56]. When the monthly PV power generation income is less than $4443, the users are exempt from VAT and personal income tax; when the monthly PV power generation income is less than $493.6, the users are exempt from stamp duty. The VAT rate is 8.5% and the stamp duty rate is 0.03%. For PV projects built by energy enterprises, the personal income tax can be temporarily disregarded.

3. Results

3.1. Area of Available Road Space for PV

In this study, the effective area of each underlying surface type was calculated using GIS software, and the theoretical area of the road slope and the PV noise barrier were calculated using a buffer zone, as shown in Table 4. The total road space area in Zhengding County is approximately 13.79 km2, and the available area of road space and its surroundings for PV installation is 20.98 km2. The effective available area for ordinary roads and freeways is large, at 9.67 km2 and 10.91 km2, respectively, and the sum of these two accounts for over 98% of the total effective area, which indicates that roads are the main type of road space available for PV.

3.2. Evaluation of PV Power Generation in Road Space

According to different road space types, different PV installation methods were selected, and the solar radiation reduction factor, PV conversion power loss, and power transmission loss are comprehensively considered to estimate the potential of PV in the road space. Figure 7 shows annual power generation per unit area. The annual power generation in most regions is below 80 kWh/m2, and the regions with high power generation are concentrated in the PV noise barrier area on both sides of urban roads, which reaches 110 kWh/m2.
Table 5 shows the power generation of each road type. According to the local statistical yearbook [57], in 2019, the cumulative electricity consumption of local road transportation-related industries, such as railway transportation, road transportation, and road services, was 1450.672 million kWh and the calculated theoretical power generation was 1505.88 million kWh. Therefore, if all road space types are utilized, the electricity demand of the transportation and service industries can be met, and some of the surplus electricity can be sent to the power grid for other uses.

3.3. Evaluation of the Economic Potential of PV Power Generation in Road Space

This study estimated the annual NP of the projects in operation between 2021 and 2026. The results are shown in Figure 8. The NP of projects in operation roughly increases at an average rate of 152 million dollars per year. The earlier the project is put into operation, the smaller the NP is in the first year of operation. If the project completes construction in 2021, the NP could become positive for the first time in 2026—i.e., the project could start to make a profit—and the NP of the project can reach $705 million by 2030. If the inflation rate (2.2%) is taken into account, the project will also be profitable in 2026, with NP in 2030 equivalent to about $588 million today. The NP for projects completed between 2023 and 2026 can become positive in the fourth year after operation, i.e., it takes approximately four years for the project to start making a profit, and NP in the first year with profitability would continue to rise as PV investment costs decrease. However, since the decline in PV investment costs is limited and gradually decelerating, projects should be put into operation as soon as possible to maximize the benefits by 2030.

4. Discussion and Conclusions

Compared to the traditional available photovoltaic spaces, the photovoltaic installation mode of road spaces is more complex and diverse. Therefore, an assessment method that considers the photovoltaic potential of various road spaces is proposed in this study. PV available road spaces in Zhengding County were taken as an example to evaluate the economic potential of PV power generation. The results show that the amount of road space in Zhengding County is relatively large, and the available area for PV is 20.98 km2. The PV areas available for road surfaces, freeway slopes, PV noise barriers, railroad ties, station roofs, and service areas are 3.96 km2, 9.67 km2, 6.96 km2, 0.15 km2, 0.03 km2, and 0.21 km2, respectively. These areas have a large potential for PV power generation, and the total annual theoretical power generation capacity could reach 1.5 billion kWh. The PV power generation capacities of road surfaces, freeway slopes, and PV noise barriers are 353,391,100 kWh, 542,734,700 kWh, and 57,841,200 kWh, respectively, and together they account for 98% of the total power generation and are therefore suitable for priority development. When the above projects are put into operation, the annual profit could reach $152 million. If the PV road space project is fully operational in 2021, it could be profitable by 2026, and the NP could reach $705 million in 2030. If fully developed, it could meet the needs of the local transportation industry and provide massive economic benefits. When compared with existing studies [14,23,32], all available photovoltaic scenarios were considered in road spaces, and the installation method with maximum power generation and easy implementation was selected to conduct a quantitative and economic evaluation.
From the technological and economic perspectives, greater PV power generation integrated into roads and railways can not only create more emerging technologies and business models, which can greatly promote technological progress and application, but also introduce some economic growth opportunities, thereby reshaping the development of related industrial clusters in the energy and transportation sectors. From a sustainable development perspective, serious challenges, such as climate change, environmental pollution, and the non-synergistic effects between development and environmental pollution caused by emissions, endanger the sustainable development of the energy and transportation sectors. To meet the requirements of sustainable development in the energy and transportation sectors, environmental-friendly development, strategic planning, transformation, and upgrading have become the basic methods. Solar roads and rail transits could play an important role in the evolution of sustainable transportation and energy transformation, which can help reduce global pollution emissions and aid in global energy conservation. Therefore, solar transportation can greatly promote the further evolution of the energy and transportation industries toward a low-carbon, green, and sustainable future, and bring more positive benefits, including technological progress, industrial upgrading, and economic growth.
This study preliminarily explores the economic potential of road PVs. Based on the construction of future projects, the IRR can be estimated more accurately to calculate the NPV value of road PVs. Furthermore, the social and environmental benefits brought by the production of road PVs, such as the reduction of carbon emissions during energy production and the increase of job opportunities, are also worthy of quantitative evaluation. Current road-space-based PV power generation technology could achieve a sustainable balance between limited resources and social needs, and the feasibility of applying PV power generation technology in the field of road engineering is unquestionable. There are extensive prospects for PV applications on roads.

Author Contributions

Conceptualization, X.S. and M.H.; methodology, Z.L. and Y.H.; software, M.W. and X.S.; validation, X.S. and Z.L.; writing—review and editing, M.H. and Z.B.; visualization, Z.B. All authors have read and agreed to the published version of the manuscript.

Funding

This research was funded by State Grid Hebei Electric Power Co., Ltd., potential survey of photovoltaic and pumped-storage resources based on high-resolution satellite images. Grant B704JY210065.

Institutional Review Board Statement

Not applicable.

Informed Consent Statement

Not applicable.

Data Availability Statement

Not applicable.

Conflicts of Interest

The authors declare no conflict of interest.

References

  1. Bódis, K.; Kougias, I.; Jäger-Waldau, A.; Taylor, N.; Szabó, S. A high-resolution geospatial assessment of the rooftop solar photovoltaic potential in the European Union. Renew. Sustain. Energy Rev. 2019, 114, 109309. [Google Scholar] [CrossRef]
  2. Mainzer, K.; Killinger, S.; Mckenn, R.; Fichtner, W. Assessment of rooftop photovoltaic potentials at the urban level using publicly available geodata and image recognition techniques. Solar Energy 2017, 155, 561–573. [Google Scholar] [CrossRef]
  3. Sahu, A.; Yadav, N.; Sudhakar, K. Floating photovoltaic power plant: A review. Renew. Sustain. Energy Rev. 2016, 66, 815–824. [Google Scholar] [CrossRef]
  4. Mittal, D.; Saxena, B.K.; Rao, K. Floating solar photovoltaic systems: An overview and their feasibility at Kota in Rajasthan. In Proceedings of the 2017 International Conference on Circuit, Power and Computing Technologies (ICCPCT), Kollam, India, 20–21 April 2017. [Google Scholar]
  5. Xiao, J.; Yao, Z.; Qu, J.; Sun, J. Research on an optimal site selection model for desert photovoltaic power plants based on analytic hierarchy process and geographic information system. J. Renew. Sustain. Energy 2013, 5, 023132. [Google Scholar] [CrossRef]
  6. Wang, Y.; Zhou, S.; Huo, H. Cost and CO2 reductions of solar photovoltaic power generation in China: Perspectives for 2020. Renew. Sustain. Energy Rev. 2014, 39, 370–380. [Google Scholar] [CrossRef]
  7. IEA. Global Energy Review 2020: The Latest Trends in Energy and Emissions in 2020. 2021. Available online: https://www.iea.org/reports/global-energy-review-2030 (accessed on 22 July 2022).
  8. Pan, H.; Qi, L.; Zhang, Z.; Yan, J. Kinetic energy harvesting technologies for applications in land transportation: A comprehensive review. Appl. Energy 2021, 286, 116518. [Google Scholar] [CrossRef]
  9. Pei, J. Progress of highway engineering and generation upgrading of highway transportation system. China J. Highw. Transp. 2018, 31, 1. [Google Scholar]
  10. Lameirinhas, R.A.M.; Torres, J.P.N.; Cunha, J.P.D.M. A Photovoltaic Technology Review: History, Fundamentals and Applications. Energies 2022, 15, 1823. [Google Scholar] [CrossRef]
  11. Cieslik, W.; Szwajca, F.; Zawartowski, J.; Pietrzak, K.; Rosolski, S.; Szkarlat, K.; Rutkowski, M. Capabilities of nearly zero energy building (nzeb) electricity generation to charge electric vehicle (ev) operating in real driving conditions (rdc). Energies 2021, 14, 7591. [Google Scholar] [CrossRef]
  12. Wadhawan, S.R.; Pearce, J.M. Power and energy potential of mass-scale photovoltaic noise barrier deployment: A case study for the US. Renew. Sustain. Energy Rev. 2017, 80, 125–132. [Google Scholar] [CrossRef]
  13. Zhong, T.; Zhang, K.; Chen, M.; Wang, Y.; Zhu, R.; Zhang, Z.; Yan, J. Assessment of solar photovoltaic potentials on urban noise barriers using street-view imagery. Renew. Energy 2021, 168, 181–194. [Google Scholar] [CrossRef]
  14. Jung, J.; Han, S.; Kim, B. Digital numerical map-oriented estimation of solar energy potential for site selection of photovoltaic solar panels on national highway slopes. Appl. Energy 2019, 242, 57–68. [Google Scholar] [CrossRef]
  15. Deshmukh, S.S.; Pearce, J.M. Electric vehicle charging potential from retail parking lot solar photovoltaic awnings. Renew. Energy 2021, 169, 608–617. [Google Scholar] [CrossRef]
  16. Ma, T.; Yang, H.; Gu, W.; Li, Z.; Yan, S. Development of walkable photovoltaic floor tiles used for pavement. Energy Convers. Manag. 2019, 183, 764–771. [Google Scholar] [CrossRef]
  17. Liu, Z.; Yang, A.; Gao, M.; Jiang, H.; Kang, Y.; Zhang, F.; Fei, T. Toward feasibility of photovoltaic road for urban traffic-solar energy estimation using street view image. J. Clean. Prod. 2019, 228, 303–318. [Google Scholar] [CrossRef]
  18. Tulpule, P.J.; Marano, V.; Yurkovich, S.; Rizzoni, G. Economic and environmental impacts of a PV powered workplace parking garage charging station. Appl. Energy 2013, 108, 323–332. [Google Scholar] [CrossRef]
  19. Zhou, B.; Pei, J.; Hughes, B.R.; Nasir, D.S.; Zhang, J. Analysis of mechanical properties for two different structures of photovoltaic pavement unit block. Constr. Build. Mater. 2020, 239, 117864. [Google Scholar] [CrossRef]
  20. Krapf, S.; Kemmerzell, N.; Uddin, S.; Vázquez, M.H.; Netzler, F.; Lienkamp, M. Toward scalable economic photovoltaic potential analysis using aerial images and deep learning. Energies 2021, 14, 3800. [Google Scholar] [CrossRef]
  21. Melius, J.; Margolis, R.; Ong, S. Estimating rooftop suitability for PV: A review of methods, patents, and validation techniques. United States. Available online: https://doi.org/10.2172/1117057 (accessed on 22 July 2022).
  22. Hofierka, J.; Kanuk, J. Assessment of photovoltaic potential in urban areas using open-source solar radiation tools. Renew. Energy 2009, 34, 2206–2214. [Google Scholar] [CrossRef]
  23. Kim, S.; Lee, Y.; Moon, H.R. Siting criteria and feasibility analysis for pv power generation projects using road facilities. Renew. Sustain. Energy Rev. 2018, 81, 3061–3069. [Google Scholar] [CrossRef]
  24. Wa Lch, A.; Castello, R.; Mohajeri, N.; Scartezzini, J.L. Big data mining for the estimation of hourly rooftop photovoltaic potential and its uncertainty. Appl. Energy 2020, 262, 114404. [Google Scholar] [CrossRef]
  25. Bergamasco, L.; Asinari, P. Scalable methodology for the photovoltaic solar energy potential assessment based on available roof surface area: Application to Piedmont Region (Italy). Solar Energy 2011, 85, 1041–1055. [Google Scholar] [CrossRef]
  26. Lingfors, D.; Bright, J.M.; Engerer, N.A.; Ahlberg, J.; Killinger, S.; Widén, J. Comparing the capability of low- and high-resolution lidar data with application to solar resource assessment, roof type classification and shading analysis. Appl. Energy 2017, 205, 1216–1230. [Google Scholar] [CrossRef]
  27. Schallenberg-Rodriguez, J. Photovoltaic techno-economical potential on roofs in regions and islands: The case of the Canary Islands. Methodological review and methodology proposal. Renew. Sustain. Energy Rev. 2013, 20, 219–239. [Google Scholar] [CrossRef]
  28. Miranda, R.; Szklo, A.; Schaeffer, R. Technical-economic potential of pv systems on brazilian rooftops. Renew. Energy 2015, 75, 694–713. [Google Scholar] [CrossRef]
  29. Lee, M.; Hong, T.; Jeong, K.; Kim, J. A bottom-up approach for estimating the economic potential of the rooftop solar photovoltaic system considering the spatial and temporal diversity. Appl. Energy 2018, 232, 640–656. [Google Scholar] [CrossRef]
  30. Branker, K.; Pathak, M.J.M.; Pearce, J.M. A review of solar photovoltaic levelized cost of electricity. Renew. Sustain. Energy Rev. 2011, 15, 4470–4482. [Google Scholar] [CrossRef]
  31. Brito, M.C.; Freitas, S.; Guimarães, S.; Catita, C.; Redweik, P. The importance of facades for the solar PV potential of a Mediterranean city using LiDAR data. Renew. Energy 2017, 111, 85–94. [Google Scholar] [CrossRef]
  32. Jia, L.; Ma, J.; Cheng, P.; Liu, Y. A perspective on solar energy-powered road and rail transportation in China. CSEE J. Power Energy Syst. 2020, 6, 760–771. [Google Scholar] [CrossRef]
  33. Feng, F.; Wang, K. Merging High-Resolution Satellite Surface Radiation Data with Meteorological Sunshine Duration Observations over China from 1983 to 2017. Remote Sens. 2021, 13, 602. [Google Scholar] [CrossRef]
  34. Singh, R.; Banerjee, R. Estimation of rooftop solar photovoltaic potential of a city. Solar Energy 2015, 115, 589–602. [Google Scholar] [CrossRef]
  35. Song, X.Y. Evaluation of Rooftop Solar PV Potential Based on Multi-Source High-Resolution Remote Sensing Image; China University of Mining & Technology: Beijing, China, 2018. [Google Scholar]
  36. Zimmerman, R.; Panda, A.; Bulović, V. Techno-economic assessment and deployment strategies for vertically mounted photovoltaic panels. Appl. Energy 2020, 276, 115149. [Google Scholar] [CrossRef]
  37. Poe, C.; Filosa, G. Alternative uses of highway rights-of-way: Accommodating renewable energy technologies. Transp. Res. Record 2012, 2270, 23–30. [Google Scholar] [CrossRef]
  38. Meng, J.W.; Jia, W.; Zhang, H.W. ”Solar PV +” can be applied in multiple scenarios to help address climate change. China Environ. 2021, 8, 44–47. [Google Scholar]
  39. Kesolar. Available online: https://www.kesolar.com/headline/178159.html (accessed on 22 July 2022).
  40. Colas. Available online: http://www.wattwaybycolas.com (accessed on 22 July 2022).
  41. Hu, H.W.; Zha, X.D.; Cen, Y.Q.; Jiang, H.; Wang, Z. Research status and prospect of solar pavement. J. Chang’an Univ. Nat. Sci. Ed. 2020, 40, 16–29. [Google Scholar] [CrossRef]
  42. Hanweishengpingzhang. Available online: https://www.shengpingzhang.com/taiyangnengzaoyinping.html (accessed on 25 August 2022).
  43. Chinaden. Available online: http://www.chinaden.cn/news_nr.asp?id=14270&Small_Class=3 (accessed on 25 August 2022).
  44. Yin, Z.L. The Research of PV Sound Barrier of Solar Energy; Wuhan Textile University: Wuhan, China, 2010. [Google Scholar]
  45. DB13 T 2669-2018, Code for design of expressway service area. Available online: https://max.book118.com/html/2019/0104/6025240121001243.shtm (accessed on 22 July 2022).
  46. CDSTM. Available online: https://www.cdstm.cn/frontier/qt/201811/t20181108_892126.html (accessed on 22 July 2022).
  47. Lei, J. Brief Introduction to the 10 MWp BIPV Demonstration Project at Hangzhou East Railway Station. Build. Electr. 2014, 33, 5. [Google Scholar] [CrossRef]
  48. Chinanews. Available online: https://www.chinanews.com.cn/ny/2010/07-19/2409557.shtml (accessed on 22 July 2022).
  49. Feng, Y.J. Power Generation and Pavement Performance of Load-Bearing Photovoltaic Pavement; Shandong University: Jinan, China, 2021. [Google Scholar]
  50. Chanchangi, Y.N.; Ghosh, A.; Sundaram, S.; Mallick, T.K. Dust and PV Performance in Nigeria: A review. Renew. Sustain. Energy Rev. 2020, 121, 109704. [Google Scholar] [CrossRef]
  51. Chen, Z.L.; Wang, F.; Feng, Y.F. Multi-Evaluation of PV Utilization Potential of Urban Building Roof in Guangzhou. Solar Energy 2021, 11, 11. [Google Scholar]
  52. Li, M.M. The Method of Vegetation Fraction Estimation by Remote Sensing; Graduate School of Chinese Academy of Sciences: Beijing, China, 2003. [Google Scholar]
  53. PV. Available online: https://www.diyifanwen.net/c4p61r6f9ex1h1yk7phhy1xkfw968dk01b0b_1.html (accessed on 22 July 2022).
  54. CHINAPV. Available online: http://www.chinapv.org.cn/index.html (accessed on 22 July 2022).
  55. NDRC. Available online: https://www.ndrc.gov.cn/xxgk/zcfb/tz/202004/t20200402_1225031.html?code=&state=123 (accessed on 22 July 2022).
  56. MOF. Available online: http://jjs.mof.gov.cn/tongzhigonggao/201307/t20130731_971420.html (accessed on 22 July 2022).
  57. Hebei Bureau of Statistics. Hebei Statistical Yearbook 2020. Available online: http://tjj.hebei.gov.cn/hetj/tjsj/ (accessed on 22 July 2022).
Figure 1. Location of the study area.
Energies 15 06408 g001
Figure 2. Process flowchart.
Energies 15 06408 g002
Figure 3. PV panels installed on three places: (a) noise barrier [42]; (b) road slope [43]; and (c) solar pavement [41].
Energies 15 06408 g003
Figure 4. PV panels installed on three places: (a) railroad ties [46]; (b) station roofs [47]; and (c) canopies [48].
Energies 15 06408 g004
Figure 5. Process of converting solar energy into electric energy.
Energies 15 06408 g005
Figure 6. Projected changes in the average initial total investment cost of PV in the next 10 years.
Energies 15 06408 g006
Figure 7. Power generation per unit area.
Energies 15 06408 g007
Figure 8. Theoretical NP of projects in operation between 2021 and 2026.
Energies 15 06408 g008
Table 1. Installation method and space utilization rate corresponding to each road type.
Road TypePV Installation ModeAvailable Area (m2)Utilization Rate (αi)
FreewayPV road slopeAi = S × 575%
ORNAPV pavementAi = S46%
ORDAPVNBAi = L × 298%
Table 2. Solar radiation reduction factors and availability coefficients.
Factors that Weaken Solar Radiationη1
Traffic flow97.4%
Dust94.0%
Unavailable radiation98.0%
Solar radiation angle−0.00001933x2 − 0.0002406x + 1.001 1
Vegetation shading1− FVC
1x refers to solar orientation angle.
Table 3. The computational formulas of economic parameters.
Economical ParametersComputational Formula
Rcon0.1 × Econ × Y 1
Rfeed-in0.13 × (ETEcon) × Y
CinvINV × EP × Y 2
Cmaint0.007 × EP × Y
CtaxVAT + PIT + SD3
1 Y refers to operating years; 2 INV refers to the average initial total investment cost of PV, which is a variable (as shown in Figure 6); 3 VAT stands for value added tax, PIT stands for personal income tax, and SD stands for stamp duty. Calculation methods are described in detail in the following part.
Table 4. Total area and effective area of road space.
TypesRoad Space Area (m²)Effective Available Area (m²)
Freeway2,838,7339,669,233
Ordinary road10,011,63910,913,791
Service area248,291211,047
Railway585,505158,086
Railway station105,85631,757
Total area13,790,02420,983,914
Table 5. Power generation of each road space type.
Road TypePV Installation ModePower Generation (1 Million kWh)
FreewayPV road slope542.73
ORNAPV pavement353.39
ORDAPVNB578.41
Service areaService area13.04
RailwayRailroad ties14.66
Railway stationBIPV3.65
Total 1505.88
Publisher’s Note: MDPI stays neutral with regard to jurisdictional claims in published maps and institutional affiliations.

