Article

Improved Oil Recovery from Carbonate Reservoirs by Tuning Injection Seawater Composition

1
State Key Laboratory of Enhanced Oil Recovery, Research Institute of Petroleum Exploration and Development of Petro China, Beijing 100083, China
2
SINOPEC Research Institute of Petroleum Engineering Co., Ltd., Beijing 102206, China
3
CAS Key Laboratory of Colloid, Interface and Chemical Thermodynamics, Institute of Chemistry Chinese Academy of Sciences, Beijing 100190, China
*
Authors to whom correspondence should be addressed.
Energies 2022, 15(17), 6405; https://doi.org/10.3390/en15176405
Submission received: 2 August 2022 / Revised: 26 August 2022 / Accepted: 29 August 2022 / Published: 1 September 2022

Abstract

:
In order to improve the adaptability of low-salinity waterflooding technology in some areas where freshwater resources are scarce, we aimed at implementing the low-salinity effect (LSE) in carbonate reservoirs through tuning injection seawater composition. LSE of ion tuning water (ITW) was verified by the results of core flooding tests, obtaining a water-free recovery factor of 50.7% and cumulative oil recovery of 77.2%. The micro mechanisms behind it were revealed via direct force-measuring and Zeta parameter (Zetap) measuring. Our results are expected to provide a new LSW strategy via tuning injection seawater composition in the case of carbonate reservoirs.

1. Introduction

Carbonate rocks host more than 60% of the world’s oil reserves, mainly composed of the minerals calcite and dolomite together with impurities, including quartz, anhydrite, clay minerals, organic matter, and apatite, etc. [1]. While, oil recovery from carbonate reservoirs is generally lower than 40% [2], prompting enormous motivation to improve oil recovery via proper techniques. At present, the enhanced oil recovery (EOR) technologies for carbonate reservoirs are still mainly gas flooding, water flooding, and chemical flooding [3,4,5]. For example, the present research showed that the presence of asphaltene inhibitors can effectively promote asphaltene desorption and improve core permeability, thereby enhancing recovery efficiency [6]. Compared with other methods, low-salinity water flooding is often considered a convenient and cost-effective and eco-friendly natural method [3,7,8,9]. Several mechanisms have been proposed to describe how LSW improves oil recovery in sandstone at both laboratory-scale and field-scale, such as fines mobilization and mineral dissolution [10], multicomponent ion exchange [11], expansion of the electric double layer [12,13,14], increased pH similar to the alkaline flooding [15]. However, limited by the lack of direct in-situ measurements, a deep understanding of the low-salinity effect (LSE) in carbonate reservoirs has not yet been achieved; rather, research has merely proposed the acceptable mechanism of wettability alteration within the last two decades, hindering the application of LSW in carbonated reservoirs [3]. The theory holds that when the reservoir is filled with oil, polar functional groups on the molecules in the oil may adsorb onto the mineral surfaces, rendering them oil-wet. After the injection of low-salinity water, some of these molecules desorb, the surfaces become more water-wet, and oil is released. Furthermore, the LSW strategies on the improved oil recovery (IOR) from carbonate reservoirs are even fewer, except the reports on the injection of dilute brine or the addition of some active ions of Ca2+, Mg2+, or SO42 [3,16,17,18]. The former one benefits from the reduction of connate water salinity, resulting in wettability alteration to a mixed-wet condition; the latter one is based on the interactions between Ca2+ and SO42 and between Mg2+ and SO42 at the chalk surface, resulting in the release of negatively charged carboxylic materials in crude oil from the positively charged chalk surface. Until now, there still has been a lack of studies regarding IOR from carbonate reservoirs with high-effectiveness methods and with clear descriptions on the underlying mechanisms.
Considering the limited knowledge on the mechanisms behind IOR from carbonate reservoirs and the insufficient methods on IOR from carbonate reservoirs, we have adopted a new LSW strategy via tuning injection water composition, and committed to reveal the micro mechanisms through direct force-measuring and Zeta parameter (Zetap) measuring. Our results are expected to provide a scientific basis for evaluating and enhancing the LSE potential on the low-salinity IOR process in the case of carbonate reservoirs.

2. Experimental

2.1. Materials

2.1.1. Rock Mineralogy

The mineralogy of the core plugs was examined prior to all the other experiments in our study. X-ray diffraction (XRD) results showed 98.9% of calcite and 1.1% dolomite. The detailed XRD pattern information is noted in the Supporting Information (Figure S1).

2.1.2. Brine Properties

Formation water (FW) was prepared based on the composition of produced water from AUH reservoirs. It is worth noting that AUH is the code name for a low-permeability carbonate reservoir in the Middle East whose real name is inconvenient to disclose. Formation brine was then diluted 10 times (10d FB) and 20 times (20d FB) using deionized water to obtain the low-salinity brine required for this study. Sea water (SW) near AUH reservoirs was tested, and four kinds of ion tuning water (ITW-1, ITW-2, ITW-3, and ITW-4) were prepared by adding inorganic salt solutions of different concentrations to it. The compositions of these brines used in our study are listed in Table 1.

2.1.3. Crude Oil

The experimental crude oil was obtained from AUH oil field, with the physical properties as shown in Table 2.

2.2. Experimental Setup and Procedure

2.2.1. Zeta Potential Measurements

Zeta potentials of oil–brine (Zetaoil/brine) and brine–core powder (Zetabrine/rock) interfaces pairs were measured using a Zetasizer (Nano-ZS, Malvern, UK). The compositions of the brine solutions are shown in Table 1. The systems of oil/brine were prepared at a volume ratio of 1:19 and stirred by a magnetic stirring apparatus at the rate of 350 rpm for about 1 min [19,20]. The powder was dispersed at 0.2 g/L in different brine solutions, respectively. All the measurements were performed at 25 °C, and each zeta potential value was obtained from the average of three measurements.

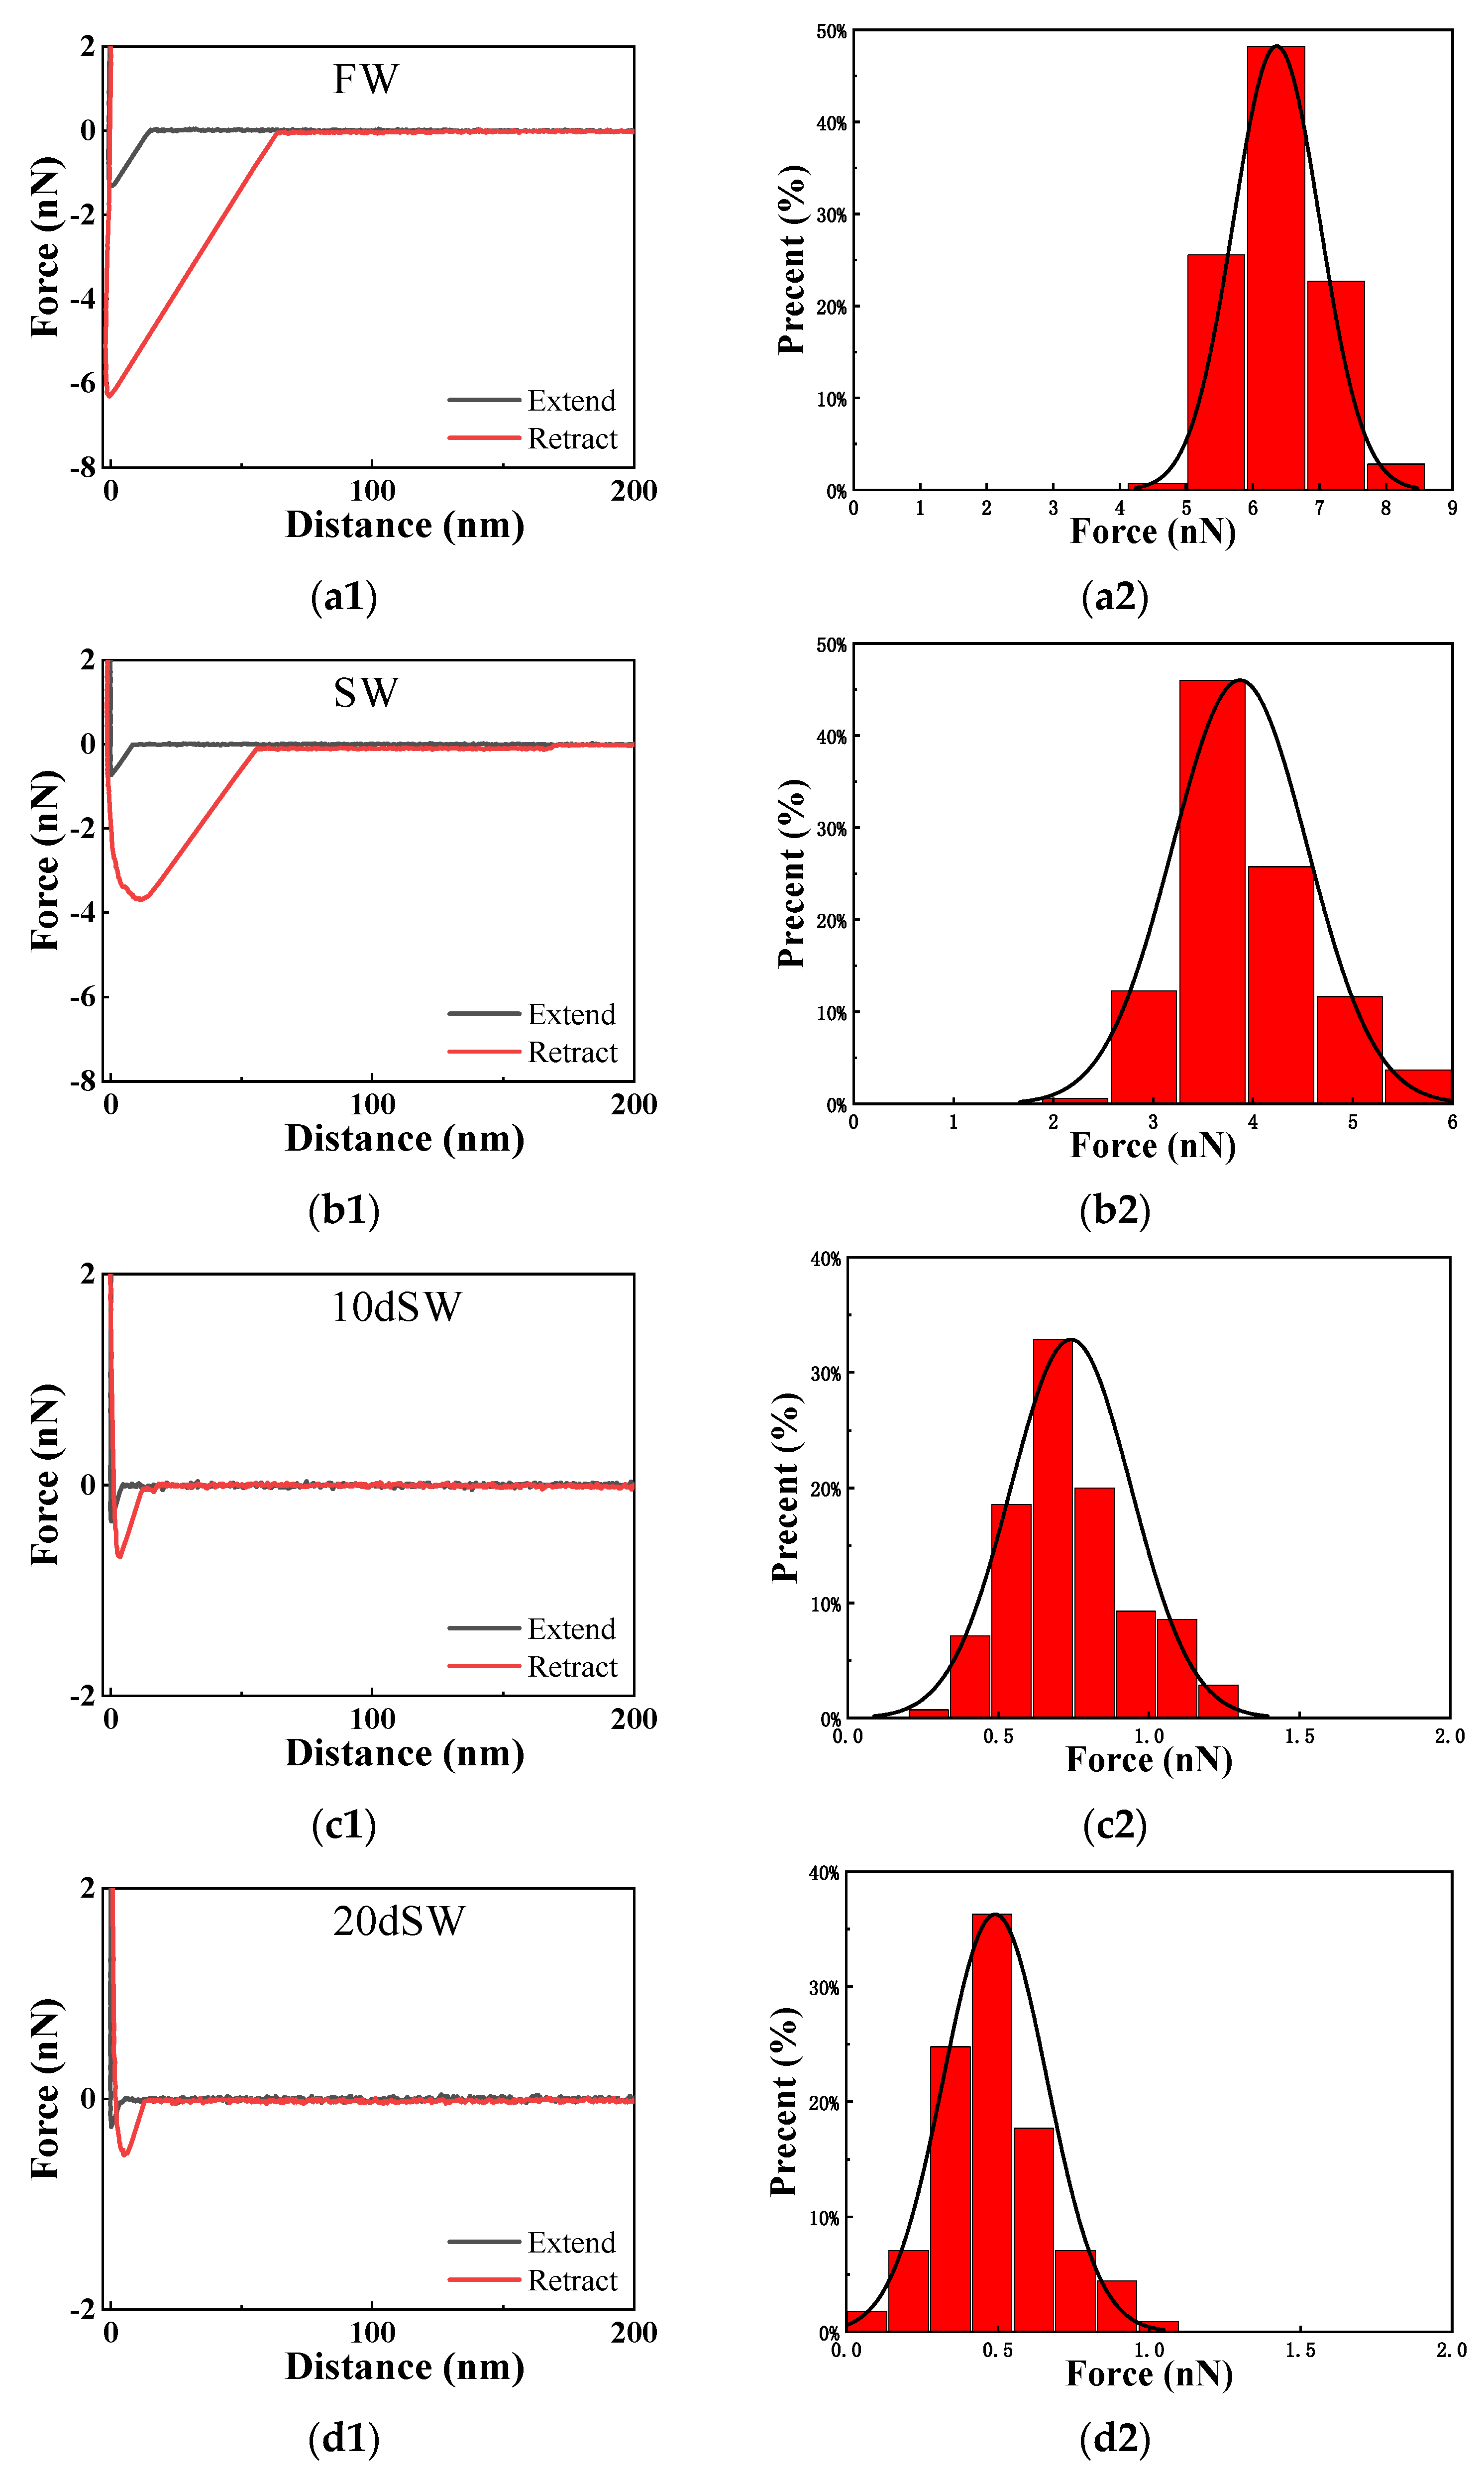
2.2.2. Force-Measuring Technique

N-(1-hexylheptyl)-N′-(5-carboxylicdodecyl) perylene-3,4,9,10-tetracarboxylic bisimide (C5Pe), selected as a model compound to mimic asphaltene component, was synthesized according to previous reports [21,22,23,24]. Functionalization tips were prepared by modifying the C5Pe molecules to AFM tips, and the preparation process was described in detail in our previous work [25]. Calcite with atomically flat surface was selected as the substrate. Forces between the C5Pe-terminated tip and substrate in the presence of different salinity waters were measured via Multimode VIII atomic force microscope (Bruker Instruments, Billerica, MA, USA) in contact mode with an O-ring liquid cell. The detailed procedures were according to our previous reports [25].

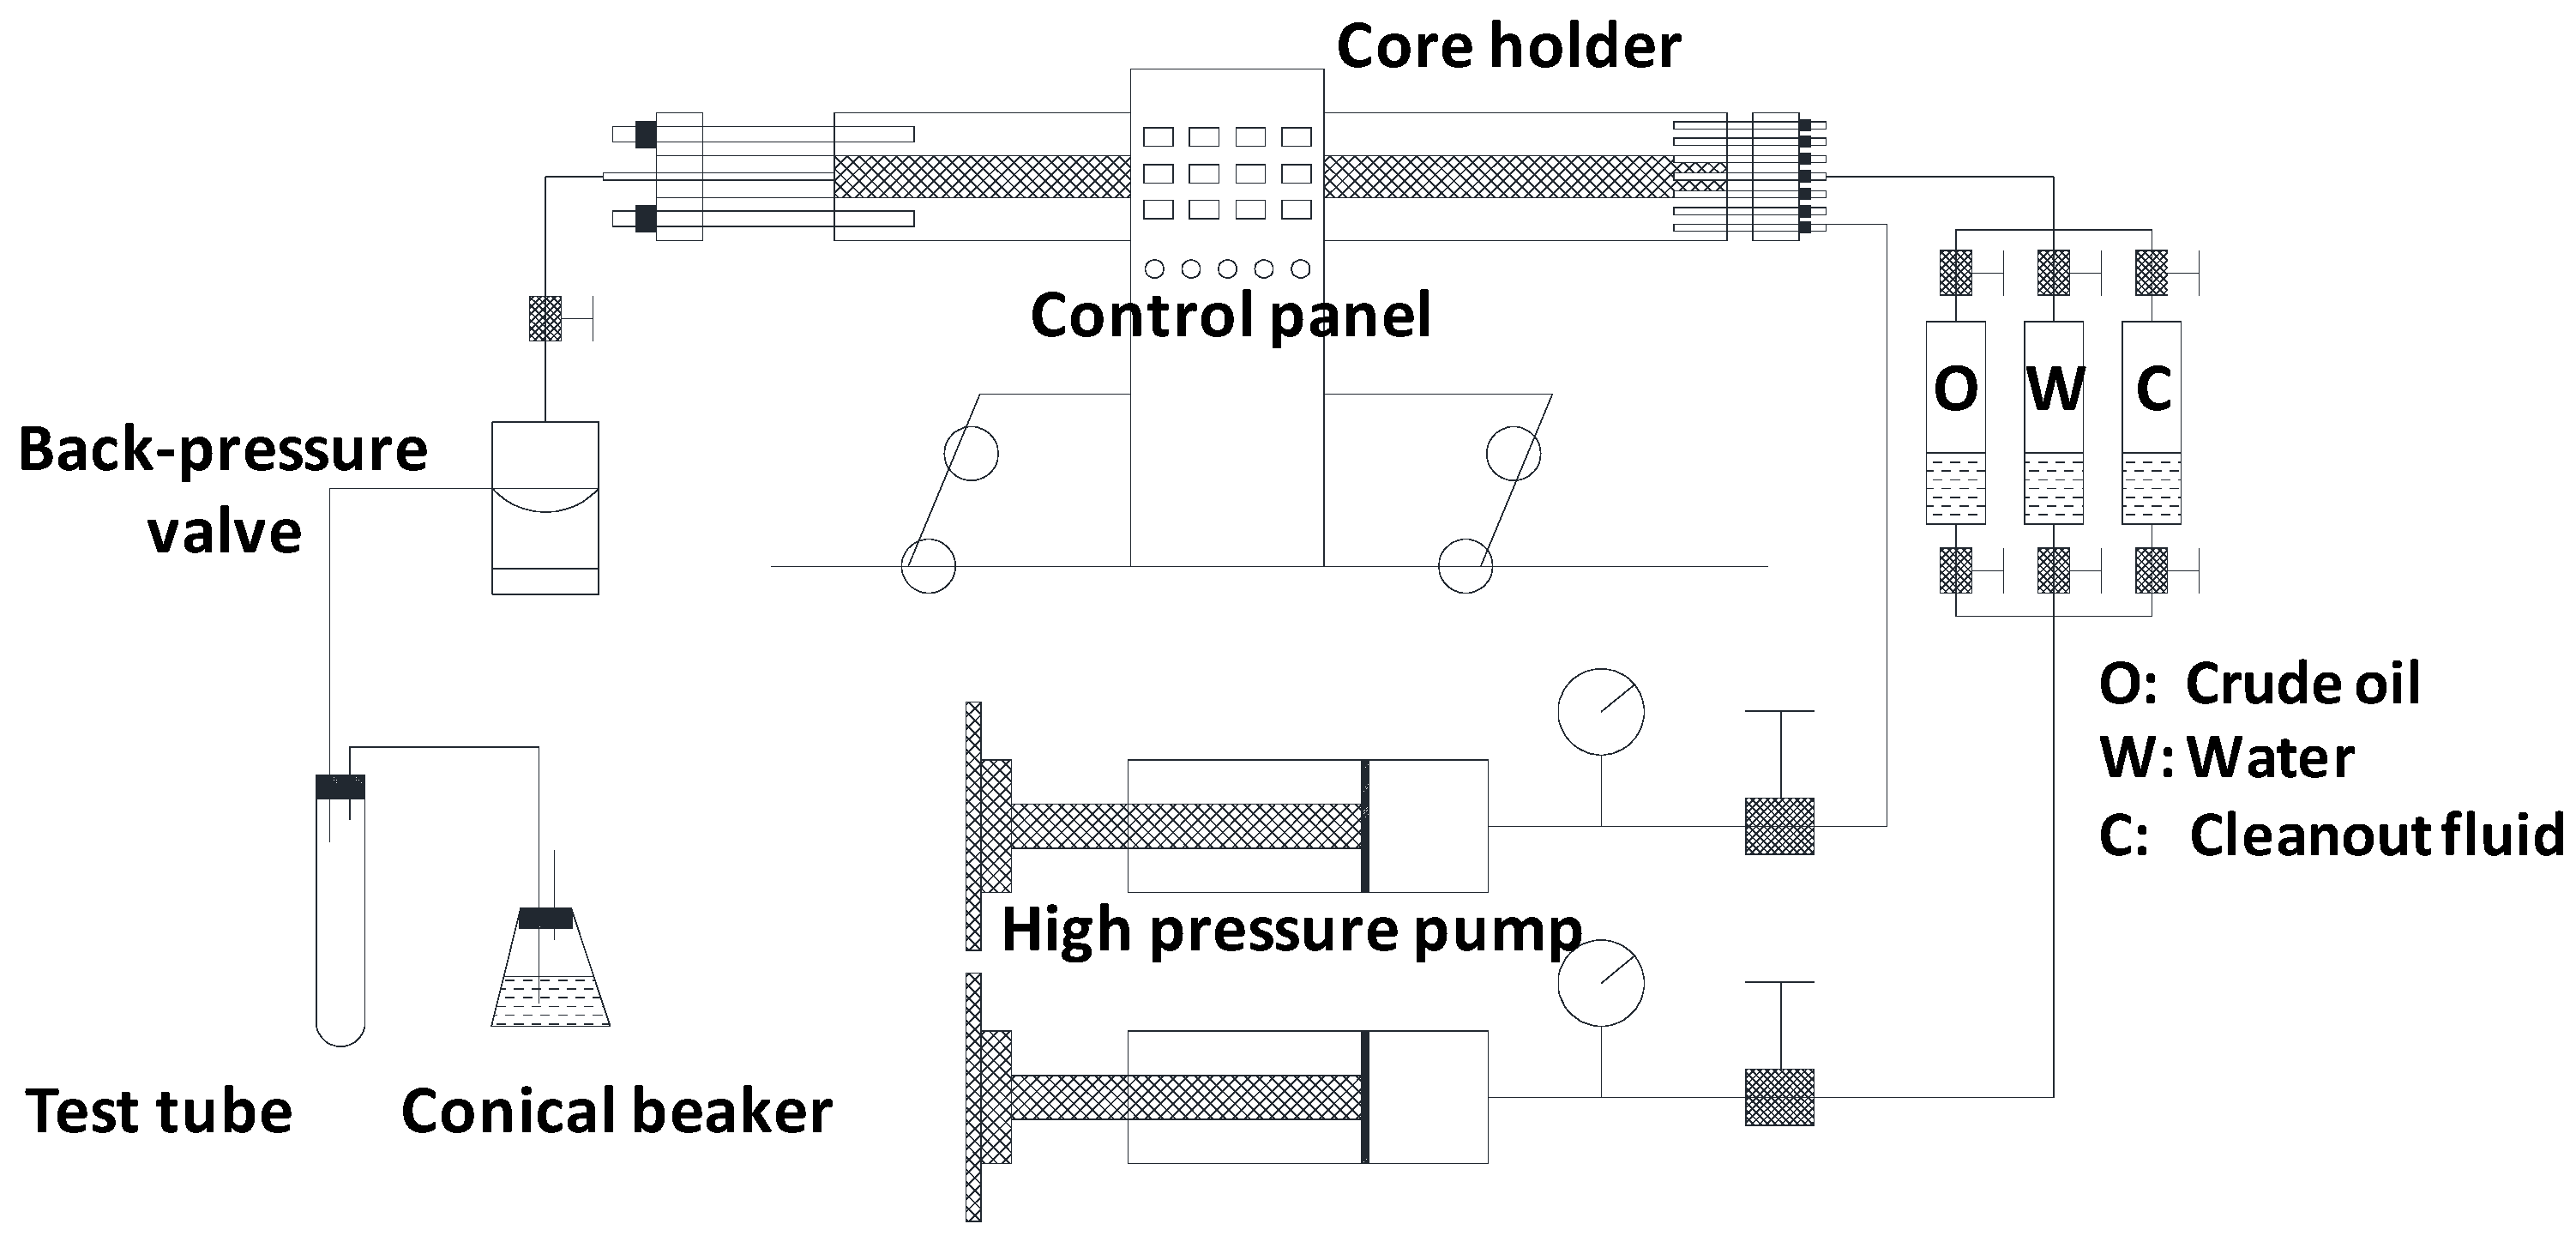
2.2.3. Core-Flooding Experiments

The oil displacement experiment diagram is shown in Figure 1. The displacement device is a core holder with a diameter of 3.8 cm and a length of 10 cm with a pressure resistance of 70 MPa. In addition, this flood was conducted in a horizontal method. The waters used in the core-flooding experiments were FW, SW, ITW-1, respectively, whose compositions are shown in Table 1. To further compare the differences between ITW and LSW in enhancing recovery efficiency, the desalinated sea water (DSAL), essentially a kind of non-potable water after desalination of seawater where the reservoir is located, was used as low-salinity water in our study. Crude oil was degassed, whose physical properties are shown in Table 2. The core plugs used in our experiment were the natural core of the main layer of the AUH reservoir, and their petrophysical properties and the flooding sequences are exhibited in Table 3. Plant essential oil was used to create bound water. When the bound water saturation (Swi) was about 10%, the degassed crude oil was injected, more than 5 PV, to displace the bound water. The core plugs were then aged for four weeks at 90 °C. In order to further evaluate the IOR performance of different injection waters, four experiments were designed as shown in Table 4.
The injection fluids and injection speeds used in the experiment are given in Table 4. All salinity solutions were injected sequentially at rates from 0.1–2.0 mL/min. It should be noted when no extra production was observed, the injection rates increased to 0.5 mL/min, and then to 2.0 mL/min. Because the constant current injection method was used, the pressure changed during the injection process. Accordingly, the key data about the relative permeability are shown as follows. For core 1#, the irreducible water saturation was 11.03%, and the residual oil saturation was 43.2%, with the oil–water two-Phase flow range was 45.77%. For core 2#, the irreducible water saturation was 10.3%, the residual oil saturation was 20.33%, and the oil-water two-Phase flow range was 69.37% respectively. For core 3#, the irreducible water saturation was 12.1%, the residual oil saturation was 29.5%, the oil-water two-Phase flow range was 58.4%. For core 4#, the irreducible water saturation was 10.9%, the residual oil saturation was 31.0%, the oil-water two-Phase flow range was 58.1%. Besides, the phase permeability curves of different cores are shown in Figure 2.

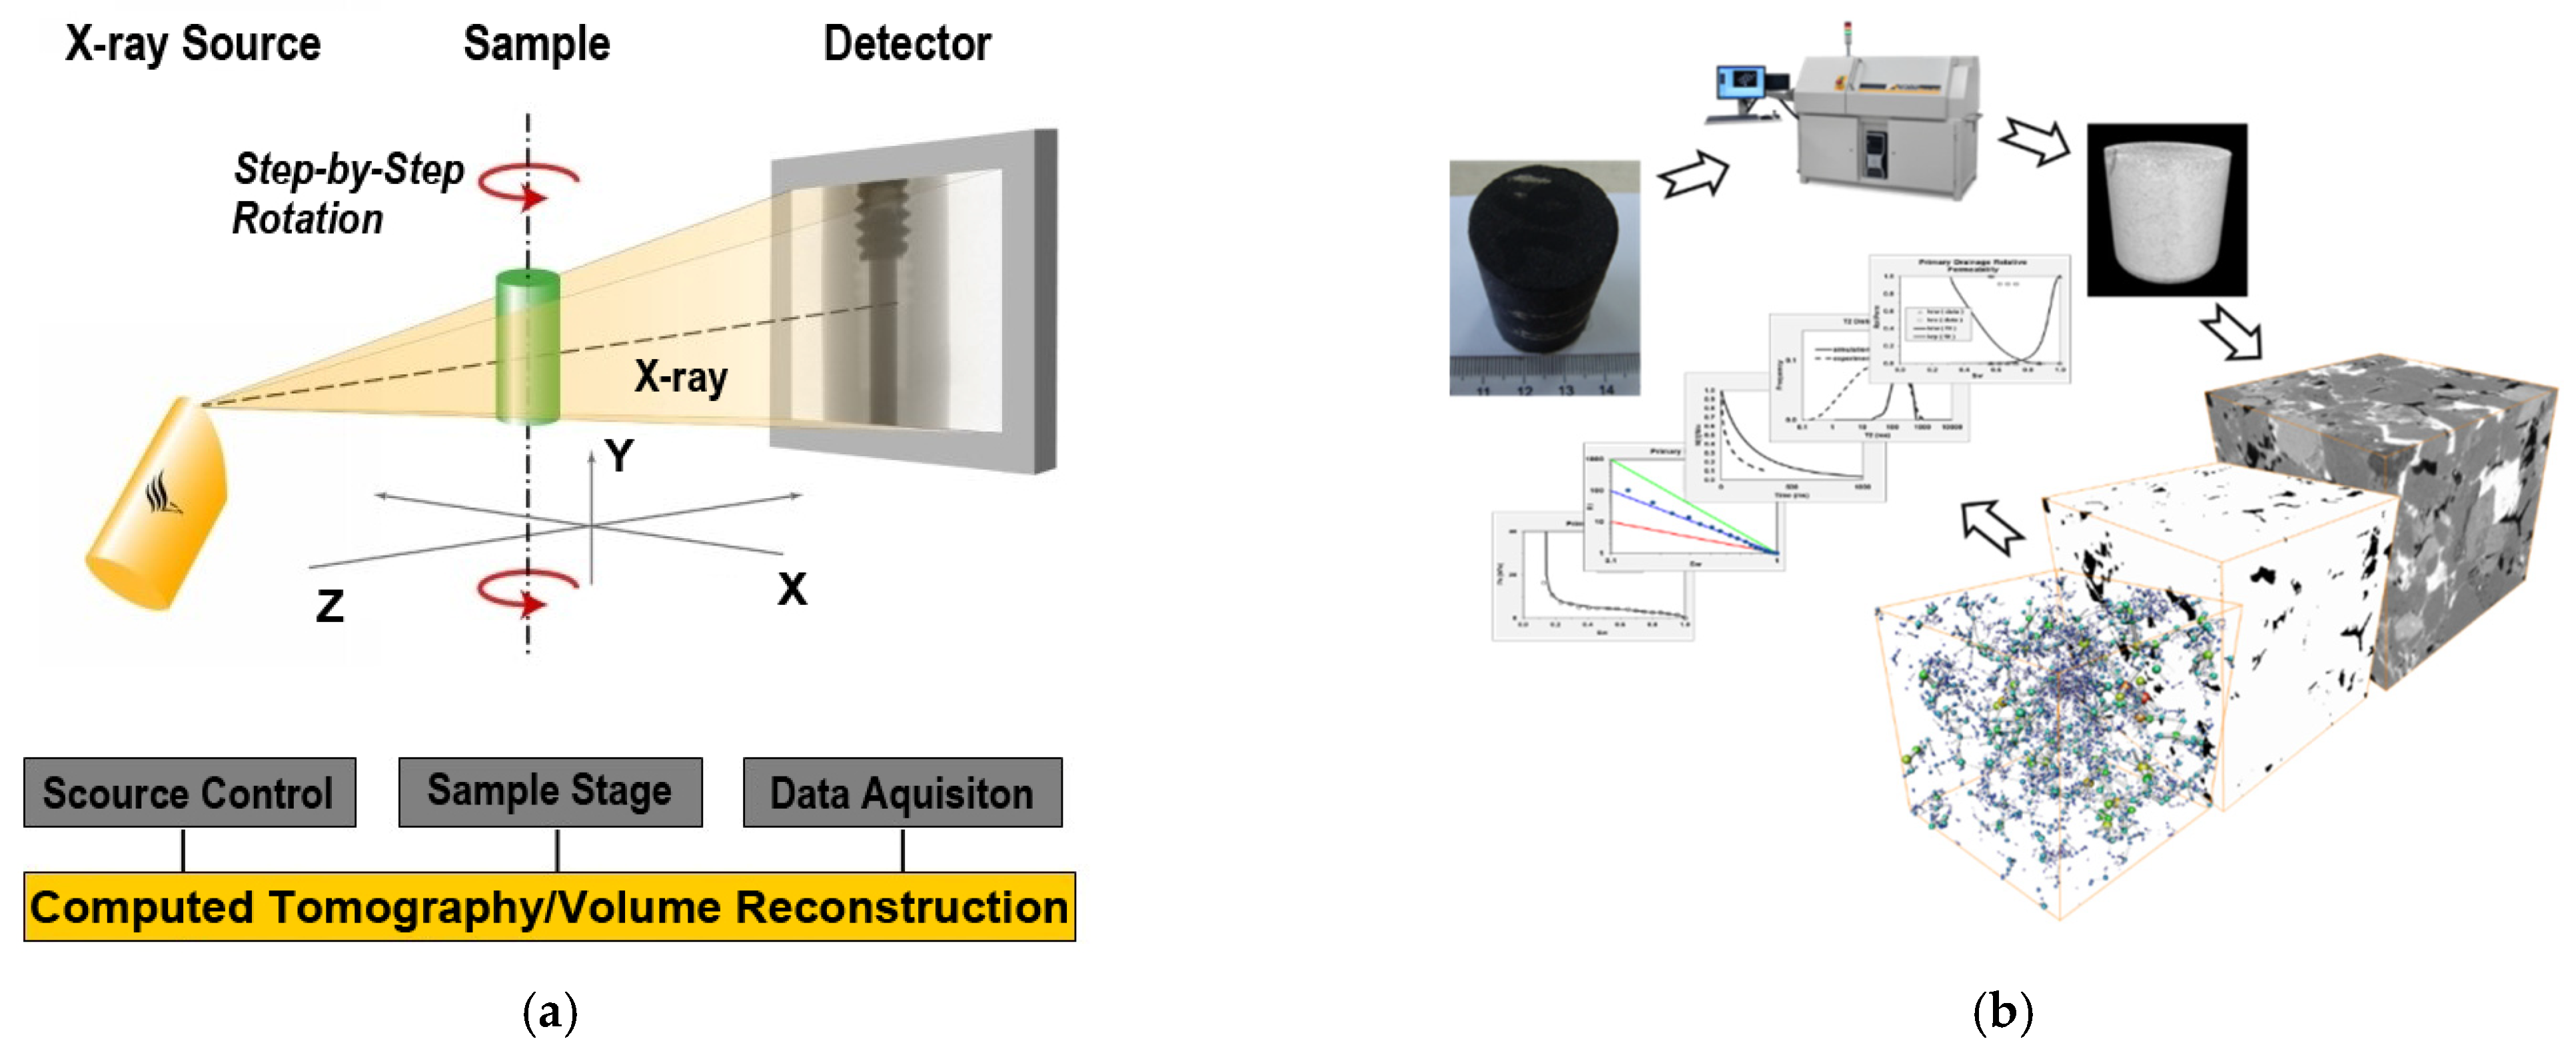
2.2.4. Micro-CT Experiments

The conical X-ray was used to penetrate objects, and the images can be magnified by objective lenses with different multiples. Three-dimensional models can be reconstructed using a large number of X-ray attenuated images obtained by 360 degree rotation, as shown in Figure 3a. Therefore, CT images can reflect the energy attenuation information of X-ray in the process of penetrating the object, and 3d CT images can reflect the pore structure and relative density of the core. The working voltage was 40–150 kV. The pixel size was 0.7–40 μm. The apparatus power was 1–10 W. The sample size was 1–70 mm in diameter. The brief experimental process is shown in Figure 3b.

3. Results and Discussion

Zeta potential values at the interface of oil/brine and brine/rock in the presence of different brines are shown in Table 5. With the decrease of salinity level, taking the presence of SW, 10d SW, and 20d SW as an example, both values of Zetaoil/brine and Zetabrine/rock declined, suggesting an increase of repulsive force with decreasing salinity, and thus a more water-wet system [26]. Similar results were also obtained, indicating that zeta potential of the brine–kaolinite system decreased from −10 to −30 mV with decreasing salinity from 50 to 2000 mg/L of NaCl [27]. Since the same polarity of Zetaoil/brine and Zetabrine/rock will trigger electric double-layer repulsion, while the opposite polarity of Zetaoil/brine and Zetabrine/rock will generate the attractive force, Zetap is introduced here as the absolute value of Zetaoil/brine and Zetabrine/rock (Equation (1)), which can be applied with both the opposite and same polarity of zeta potential [28]. It has been reported that the oil recovery is higher with the increase of the Z parameter [26]. Notably, after tuning ions of the sea water, the composition of total dissolved solid (TDS) does not change very much, while the values of Zetaoil/brine and Zetabrine/rock decrease and the Zetap value increases (except the ITW-3 case), compared with that of the SW system. This suggests that tuning the potential determining ions, such as Ca2+, Mg2+, and SO42−, may contribute to improve the reservoir wettability and oil recovery. However, this needs to be confirmed by other experiments.
Z e t a p = Z e t a oil / brine + Z e t a brine / rock
Approach and retraction force curves between C5Pe-terminated tips and calcite surfaces in the presence of different brine solutions are shown in Figure 4(a1–h1). Positive interaction force means a repulsive interaction and negative interaction force means an attractive interaction [20,29]. It can be seen that the attractive force weakened with the decrease of salinity from FW to SW and to diluted SW. Interestingly, after tuning some ionic composition in SW, especially for the ITW-1 system, the attractive force greatly decreased compared with the SW system and acted as a leading force at the short range of 0–15 nm. Similar results were obtained between quartz surfaces and polar tips (NH2– and COOH–terminated tip) in the presence of low salinity of NaCl solution, as well as the interactions between the K-feldspar surface and COOH–terminated tip under an AFM mapping mode [14,30]. To further quantitatively analyze the attractive forces of oil/brine/calcite systems, the adhesion forces were calculated from the deflection on the y axis of each force curve through the “Find Peak” function of the NanoScope analysis software [13,14] and, subsequently, the histograms of adhesion force could be obtained by statistics as shown in Figure 4(a2–h2) and the average adhesion forces were calculated as shown in Table 5. An increasing order in the adhesion force is 20d SW < 10d SW < ITW-1~4 < SW < FW, dependent on the salinity. The adhesion force grows stronger with the increase of salinity, because the more compact compression of electric double layer leads to the reduction of the repulsive force [14,31]. The weaker the average adhesion force is, the more favorable it is for the modified tip retracting from the surface in the presence of brine, in correspondence with the results from Zeta potential measurements: the higher the Zetap value is, the more water-wet the interfacial system is, which is beneficial for the solid–liquid separation.
Additionally, for the four kinds of ion-tuning water systems, the average adhesion force was reduced ~70% by the ITW-1 system, and reduced by ~60% by the ITW-2~4 systems compared with that of the SW system. Through tuning injection water composition, parts of the Ca2+, Mg2+, and SO42− ions were removed from sea water, which is good for reducing the ion bridge of the asphaltene–solid surface [32] and removing asphaltenes from the solid/liquid interface. Considering the high efficiency and eco-friendliness for actual application, ITW-1 was selected to apply in the following core-flooding experiments.
Secondary mode experiments were carried out by injecting FW or ITW as shown in Figure 5 and Table 6. The oil recovery was 43.0%~54.9%, 65.2%~66.4%, and 55.6%~68.0% with the injection of FW from Core 1#, Core 3#, and Core 4#, and the water-free recovery factor was 29.1%, 45.0%, and 42.7%, respectively. In comparison, the oil recovery reached 77.1% with the injection of ITW from Core 2# and the water-free recovery factor reached 50.7%. Tertiary mode was implemented by injecting DSAL, showing the oil recovery of 55.3%~58.3%, 77.2%, and 68.7%~70.3% from Core 1#, Core 2, and Core 4#. The oil recovery by ITW and DSAL under tertiary mode was 66.8% and 67.5%~67.8%, respectively. Therefore, low-salinity effect of ITW was further verified by the results of the typical core flooding tests, through the high oil recovery and water-free recovery factor. The cores with low permeability (less than 4 × 10⁻³ μm2) and complex structures (Figure S2), such as Core 2# and Core 3#, have almost no end effects, resulting from the little difference in cumulative recovery with the increase of the injection speed. While, the cores with higher permeability, such as Core 1# and Core 4#, have obvious end effects. Hence, it is better not to increase injection speed for the low-permeability core.
The result from displacement experiments with FW, ITW, and DSAL showed (1) the oil displacement efficiency with either ITW or DSAL was much higher than the water flooding efficiency with FW. Residual oil saturation after the displacement with ITW and DSAL declined obviously, with the oil-water two-Phase flow range increasing by more than 13%. (2) There was no end effect on the lower permeability core (e.g., core 2#, 3#), unable to improve oil displacement efficiency by changing injection velocity in the condition of residual oil. (3) There was an end effect on slightly higher-permeability cores (e.g., core 1#, 4#), which can be overcome by improving injection velocity to improve oil displacement efficiency. However, the oil displacement efficiency basically cannot be improved by changing the subsequent displacement system. That is why the ultimate displacement efficiency on core 1# was not high. (4) For the reservoir being evaluated, the ITW and DSAL displacement system could improve the oil displacement efficiency, with no ability to increase the flow resistance to enhance the swept volume.

4. Conclusions

In this work, a series of in-situ AFM experiments were performed to directly determine the attractive interaction of asphaltene molecules on calcite surfaces in different brines. The results showed that the attractive interaction was found to decrease in the order FW > SW > ITW-4~1 > 10d SW > 20d SW with the decrease of salinity. This is because the injections of the low-salinity solutions cause the expansion of the electric double layer. By comparing the zeta potentials and zeta parameters at the interface of oil/brine and brine/rock in the presence of different brines, it was found that the wettability and oil recovery in carbonate reservoirs was governed by the ionic composition of injected water rather than salinity levels. If some of the potential determinants, such as Ca2+, Mg2+, and SO42−, are removed from the seawater, it is beneficial for the repulsion enhancement in the oil/brine/rock system and for the reservoir wettability shifting to water-wettability. Therefore, based on the above two conclusions, it is reasonable to believe that in addition to the salinity of the injected water, the ion type is also a key factor affecting the water flooding efficiency. Moreover, considering the scarcity of fresh water in some areas, ITW-1 has been applied instead of diluting seawater, and the low-salinity effect of ITW has been verified by the results of core flooding tests. This means that when freshwater resources are insufficient, the oil displacement effect equivalent to low-salinity water flooding can be achieved by adjusting the key ions in the seawater. Our research could provide new strategies for enhanced oil recovery from carbonate reservoirs and the wise use of marine resources.

Supplementary Materials

The following supporting information can be downloaded at: https://www.mdpi.com/article/10.3390/en15176405/s1, Figure S1. XRD pattern for the core plug; Figure S2. Micro-CT images of Core 1#~4#; Figure S3. The stratigraphic map; Figure S4. The geological map.

Author Contributions

Conceptualization, F.L. and H.Y.; Data curation, J.W. and X.C.; Formal analysis, S.Y.; Methodology, H.H.; Writing—original draft, F.L.; Writing—review & editing, H.Y. All authors have read and agreed to the published version of the manuscript.

Funding

This work was funded by the PetroChina Company Limited project: Research and Pilot Test of Functional Water Flooding Technology [2019A-0910] and Critical Technical Research of Functional Water Flooding Technology [2021DJ1302].

Institutional Review Board Statement

Not applicable.

Informed Consent Statement

Not applicable.

Data Availability Statement

Not applicable.

Conflicts of Interest

The authors declare no conflict of interest.

References

  1. Klemme, H.D. Effective petroleum source rocks of the world; stratigraphic distribution and controlling depositional factors. Aapg. Bull. 1991, 75, 1809–1851. [Google Scholar]
  2. Sari, A.; Chen, Y.; Xie, Q.; Saeedi, A. Low salinity water flooding in high acidic oil reservoirs: Impact of pH on wettability of carbonate reservoirs. J. Mol. Liq. 2019, 281, 444–450. [Google Scholar] [CrossRef]
  3. Al-Shalabi, E.W.; Sepehrnoori, K. A comprehensive review of low salinity/engineered water injections and their applications in sandstone and carbonate rocks. J. Pet. Sci. Eng. 2016, 139, 137–161. [Google Scholar] [CrossRef]
  4. Mogensen, K.; Masalmeh, S. A review of EOR techniques for carbonate reservoirs in challenging geological settings. J. Pet. Sci. Eng. 2020, 195, 107889. [Google Scholar] [CrossRef]
  5. Lashkarbolooki, M.; Riazi, M.; Hajibagheri, F.; Ayatollahi, S. Low salinity injection into asphaltenic-carbonate oil reservoir, mechanistical study. J. Mol. Liq. 2016, 216, 377–386. [Google Scholar] [CrossRef]
  6. Azizollah, K.; Sharifov, A.R.; Torba, D.I. Experimental and modeling study of asphaltene adsorption onto the reservoir rocks. Pet. Sci. Technol. 2018, 36, 1–8. [Google Scholar]
  7. Koleini, M.M.; Badizad, M.H.; Kargozarfard, Z.; Ayatollahi, S. The impact of salinity on ionic characteristics of thin brine film wetting carbonate minerals: An atomistic insight. Colloids Surf. A 2019, 571, 27–35. [Google Scholar] [CrossRef]
  8. Song, J.; Zeng, Y.; Wang, L.; Duan, X.; Puerto, M.; Chapman, W.G.; Biswal, S.L.; Hirasaki, G.J. Surface complexation modeling of calcite zeta potential measurements in brines with mixed potential determining ions (Ca2+, CO32−, Mg2+, SO42−) for characterizing carbonate wettability. J. Colloid Interface Sci. 2017, 506, 169–179. [Google Scholar] [CrossRef]
  9. Rezaeidoust, A.; Puntervold, T.; Strand, S.; Austad, T. Smart water as wettability modifier in carbonate and sandstone: A discussion of similarities/differences in the chemical mechanisms. Energy Fuels 2009, 23, 4479–4485. [Google Scholar] [CrossRef]
  10. Tang, G.Q.; Morrow, N.R. Influence of brine composition and fines migration on crude oil/brine/rock interactions and oil recovery. J. Pet. Sci. Eng. 1999, 24, 99–111. [Google Scholar] [CrossRef]
  11. Lager, A.; Webb, K.J.; Black, C.J.J.; Singleton, M.; Sorbie, K.S. Low salinity oil recovery—An experimental investigation. Petrophysics 2008, 49, 28–35. [Google Scholar]
  12. Xie, Q.; Liu, Y.; Wu, J.; Liu, Q. Ions tuning water flooding experiments and interpretation by thermodynamics of wettability. J. Pet. Sci. Eng. 2014, 124, 350–358. [Google Scholar] [CrossRef]
  13. Wu, J.; Fanghui, L.; Yang, H.; Xu, S.; Xie, Q.; Zhang, M.; Chen, T.; Hu, G.; Wang, J. Effect of specific functional groups on oil adhesion from mica substrate: Implications for low salinity effect. J. Ind. Eng. Chem. 2017, 56, 342–349. [Google Scholar] [CrossRef]
  14. Liu, F.; Yang, H.; Wang, J.; Zhang, M.; Chen, T.; Hu, G.; Zhang, W.; Wu, J.; Xu, S.; Wu, X. Salinity-dependent adhesion of model molecules of crude oil at quartz surface with different wettability. Fuel 2018, 223, 401–407. [Google Scholar] [CrossRef]
  15. Mcguire, P.; Chatham, J.; Paskvan, F.; Sommer, D.; Carini, F. Low salinity oil recovery: An exciting new eor opportunity for Alaska’s north slope. In Proceedings of the SPE Western Regional Meeting, Irvine, CA, USA, 30 March–1 April 2005. [Google Scholar]
  16. Al-Nofli, K.; Pourafshary, P.; Mosavat, N.; Shafiei, A. Effect of initial wettability on performance of smart water flooding in carbonate reservoirsan experimental investigation with IOR implications. Energies 2018, 11, 1394. [Google Scholar] [CrossRef]
  17. Hassan, M.; Keya, A.L.; Berg, S.; Nasralla, R. Electrokinetics of carbonate/brine interface in low-salinity waterflooding: Effect of brine salinity, composition, rock type, and pH on zeta-potential and a surface-complexation model. SPE J. 2017, 22, 53–68. [Google Scholar]
  18. Hadia, N.J.; Ashraf, A.; Tweheyo, M.T.; Torsæter, O. Laboratory investigation on effects of initial wettabilities on performance of low salinity waterflooding. J. Pet. Sci. Eng. 2013, 105, 18–25. [Google Scholar] [CrossRef]
  19. Yang, G.; Chen, T.; Zhao, J.; Yu, D.; Liu, F.; Wang, D.; Fan, M.; Chen, W.; Zhang, J.; Yang, H.; et al. Desorption mechanism of asphaltenes in the presence of electrolyte and the Extended Derjaguin–Landau–Verwey–Overbeek theory. Energy Fuels 2015, 29, 4272–4280. [Google Scholar] [CrossRef]
  20. Wu, J.; Liu, F.; Chen, G.; Wu, X.; Ma, D.; Liu, Q.; Xu, S.; Huang, S.; Chen, T.; Zhang, W.; et al. Effect of ionic strength on the interfacial forces between oil/brine/rock interfaces: A chemical force microscopy study. Energy Fuels 2016, 30, 273–280. [Google Scholar] [CrossRef]
  21. Xiong, Y.; Cao, T.; Chen, Q.; Li, Z.; Yang, Y.; Xu, S.; Yuan, S.; Sjöblom, J.; Xu, Z. Adsorption of a polyaromatic compound on silica surfaces from organic solvents studied by molecular dynamics simulation and afm imaging. J. Phys. Chem. C 2017, 121, 5020–5028. [Google Scholar] [CrossRef]
  22. Wang, J.; Lu, Q.; Harbottle, D.; Sjoblom, J.; Xu, Z.; Zeng, H. Molecular interactions of a polyaromatic surfactant C5Pe in aqueous solutions studied by a surface forces apparatus. J. Phys. Chem. B 2012, 116, 11187–11196. [Google Scholar] [CrossRef] [PubMed]
  23. Higaki, Y.; Hatae, K.; Ishikawa, T.; Takanohashi, T.; Hayashi, J.I.; Takahara, A. Adsorption and desorption behavior of asphaltene on polymer-brush-immobilized surfaces. ACS Appl. Mater. Interfaces 2014, 6, 20385. [Google Scholar] [CrossRef] [PubMed]
  24. Nordgard, E.L.; Landsem, E.; Sjoblom, J. Langmuir films of asphaltene model compounds and their fluorescent properties. Langmuir 2008, 24, 8742–8751. [Google Scholar] [CrossRef] [PubMed]
  25. Liu, F. Molecular interaction between asphaltene and quartz with different surface wettability: A combined study of experimental measurement and theoretical calculation. Fuel 2019, 258, 115937. [Google Scholar] [CrossRef]
  26. Sari, A.; Xie, Q.; Chen, Y.; Saeedi, A.; Pooryousefy, E. Drivers of low salinity effect in carbonate reservoirs. Energy Fuels 2017, 31, 8951–8958. [Google Scholar] [CrossRef]
  27. Nasralla, R.A.; Nasr-El-Din, H.A. Impact of cation type and concentration in injected brine on oil recovery in sandstone reservoirs. J. Pet. Sci. Eng. 2014, 122, 384–395. [Google Scholar] [CrossRef]
  28. Jackson, M.; Al-Mahrouqi, D.; Vinogradov, J. Zeta potential in oil-water-carbonate systems and its impact on oil recovery during controlled salinity water-flooding. Sci. Rep. 2016, 6, 37363. [Google Scholar] [CrossRef]
  29. Yang, H.; Duan, H.; Wu, X.; Wang, M.; Chen, T.; Liu, F.; Huang, S.; Zhang, W.; Chen, G.; Yu, D. Self-assembly behavior of ultrahighly charged amphiphilic polyelectrolyte on solid surfaces. Langmuir 2016, 32, 11485–11491. [Google Scholar] [CrossRef]
  30. Lorenz, B.; Ceccato, M.; Andersson, M.P.; Dobberschütz, S.; Stipp, S. Salinity-dependent adhesion response properties of aluminosilicate (K-Feldspar) surfaces. Energy Fuels 2017, 31, 4670–4680. [Google Scholar] [CrossRef]
  31. Hilner, E.; Andersson, M.P.; Hassenkam, T.; Matthiesen, J.; Salino, P.A.; Stipp, S. The effect of ionic strength on oil adhesion in sandstone—The search for the low salinity mechanism. Sci. Rep. 2015, 5, 9933. [Google Scholar] [CrossRef]
  32. Zhang, J.; Liu, F.; Yang, H.; Zhu, Y.; Wang, X.; Hua, Z. Effect of ion type on the interaction between polar model oil and mica substrate: A chemical force microscopy study. Energy Fuels 2018, 32, 10486–10492. [Google Scholar] [CrossRef]
Figure 1. Diagram of the core displacement experiment.
Energies 15 06405 g001
Figure 2. Phase permeability curves of different cores.
Energies 15 06405 g002
Figure 3. (a) Layout of the X-ray CT scan imaging; (b) workflow chart analysis.
Energies 15 06405 g003
Figure 4. Approach and retraction force curves, as well as histograms of adhesion forces, as a function of separation between the C5Pe-modified AFM tip and calcite surfaces in different brines. (a1,a2): FW; (b1,b2): SW; (c1,c2): 10d SW; (d1,d2): 20d SW; (e1,e2): ITW-1; (f1,f2): ITW-2; (g1,g2): ITW-3; (h1,h2): ITW-4).
Energies 15 06405 g004aEnergies 15 06405 g004b
Figure 5. Oil recovery vs. injected PV in the condition of different core plugs: (a) sample core 1#; (b) sample core 2#; (c) sample core 3#; (d) sample core 4#.
Energies 15 06405 g005
Table 1. Specifications of the brines used in this study.
BrineInjection Water Composition (mg/L)
ClSO42−CO32−HCO3Na+K+Mg2+Ca2+Sr2+TDS
FW140,980.80312.5053.2060,919.751117.521524.4416,506.200.00338.68221,753.09
SW23,573.003458.000.00154.0013,050.00468.001561.00513.030.0042,777.03
ITW-123,366.903362.2619.63113.0713,434.90424.171535.28431.080.0042,687.29
ITW-222,094.903430.1919.63106.4213,682.20435.981571.86387.140.0041,728.32
ITW-322,160.303468.1219.6393.1213,157.60435.701517.75339.680.0041,191.90
ITW-420,827.903379.5919.6393.1212,935.00423.071468.51305.000.0039,451.82
Table 2. Physical properties of crude oil.
Volatiles/%Saturates/%Aromatics/%Resin/%Asphaltene/%Acid Number mg KOH/g
7.1963.6417.4610.231.480.116
Table 3. Basic parameters of the core plugs.
CoresDepth/mPorosity/%Air Permeability/mDL/cmD/cmFlooding Sequence
1#2957.1125.112.57.0233.770FW → DSAL
2#2962.5823.53.427.0353.764ITW → DSAL
3#2968.8321.23.636.9903.765FW → ITW → DSAL
4#2957.0524.811.66.9023.768FW → DSAL
Table 4. Main parameters of core-flooding experiments.
CoresExperiment SchemeExperimental Procedures and Conditions
1#FW flooding (0.1–0.5–2.0 mL/min) + DSAL flooding (0.1–0.5–2.0 mL/min)(1) Swi is about 10%
(2) Temp. 90 °C
(3) Dead oil aging for 4 weeks in cores
(4) Back pressure is 2980 psi (20.5 MPa), and confining pressure is 300 psi more
(5) Dead oil displaced 5 PV at 0.1 mL/min before water was injected
(6) Water displaced at 0.1 mL/min
(7) When no extra production is observed, increase to 0.5 mL/min, and then to 2.0 mL/min
2#ITW flooding (0.1–0.5–2.0 mL/min) + DSAL flooding (0.1–0.5–2.0 mL/min)
3#FW flooding (0.1–0.5–2.0 mL/min) + ITW flooding (0.1–0.5–2.0 mL/min) + DSAL flooding (0.1–0.5–2.0 mL/min)
4#FW flooding (0.1–0.5–2.0 mL/min) + DSAL flooding (0.1–0.5–2.0 mL/min)
Table 5. Zeta potential of fluid–fluid and fluid–rock, Zetap, and average adhesion force.
BrineZetaoil/brine/mVZetabrine/rock/mVZetap/mVAverage Adhesion Force/nN
FW0.81 ± 0.22−2.89 ± 0.432.086.36 ± 0.65
SW−7.62 ± 0.37−5.72 ± 0.3413.343.87 ± 0.68
10d SW−13.62 ± 0.48−9.77 ± 0.1823.390.74 ± 0.20
20d SW−32.00 ± 0.62−11.75 ± 0.4543.750.49 ± 0.17
ITW-1−12.01 ± 0.27−6.55 ± 0.1118.561.03 ± 0.26
ITW-2−8.10 ± 0.20−6.97 ± 0.1115.071.37 ± 0.28
ITW-3−5.69 ± 0.44−6.65 ± 0.3312.341.48 ± 0.27
ITW-4−8.17 ± 0.37−6.82 ± 0.3514.991.46 ± 0.39
Table 6. Core-flooding experiment results for different sample cores.
CoresSwi/%Ka/10−3 μm2Kw/10−3 μm2Ko/10−3 μm2Water-Free Recovery Factor/%FW Cumulative Recovery %ITW Cumulative Recovery %DSAL Cumulative Recovery %
0.10.52.00.10.52.00.10.52.0
1#11.0312.505.122.6029.143.049.754.9///55.355.358.3
2#10.283.421.310.8150.7///77.177.177.177.277.277.2
3#12.073.631.700.9845.065.265.966.466.866.866.867.567.867.8
4#10.9011.604.933.1142.755.663.868.0///68.770.370.3
Publisher’s Note: MDPI stays neutral with regard to jurisdictional claims in published maps and institutional affiliations.

