1. Introduction
Fossil fuels have played a key role in the rise and expansion of the global economic system over the past 150 years. Industrial revolutions brought about technological change, facilitating increased gross domestic product (GDP) and per-capita income [
1,
2]. Global GDP increased from 3 trillion dollars in 1970, to 88 trillion in 2019 [
3]. At the same time, primary energy use increased from 239 exajoules (EJ) in 1970 to over 624 EJ in 2019 [
4]. Thus, in parallel with the spread of the capitalist system, a wealth-power system, motivated mainly by profit maximisation and based on continuous expansion, the circulation of capital and increasing fossil fuel consumption, has emerged [
5,
6,
7,
8,
9]. The current wealth–power system brought about three major challenges for advanced industrialised and industrialising countries and regions of the world: (1) import dependence on fossil fuels; (2) fossil fuel supply scarcity; and (3) environmental deterioration.
First, wealth–power systems in non-fossil fuel-producing countries are increasingly dependent on fossil fuel-producing countries. In energy consumer countries, including many European Union (EU) Member States, growing domestic demand combined with dwindling indigenous reserves gives rise to increasing import dependence [
2]. Following the 1970s oil crises, import dependence plummeted briefly, as industrialised nations responded to import dependence concerns [
10]. Since 2014, however, energy imports (and dependence on such imports) have again increased in developed and developing countries, China, India, and other late-industrialising countries [
3,
11]. Many fossil-fuel-producing countries leverage such supplies as a geopolitical instrument during instances of conflict [
2,
12]. Furthermore, fossil fuels are largely concentrated in unstable regions such as the Middle East and Persian Gulf, exposing energy supplies to regional conflicts [
13,
14].
Second, the global rise in fossil fuel demand combined with disparate increases in proven reserves generates increased fossil fuel scarcity. Albeit slower than previously, fossil fuel demand is still rising [
4]. The growth in global energy consumption and the lag in fossil fuel supply growth has invoked international fossil fuel scarcity concerning oil and gas. Fossil fuel scarcity therefore threatens the economic and social security of both fossil fuel producer countries and importing countries [
12,
15,
16,
17].
Third, the production, transportation, and consumption of fossil fuels contribute significantly to anthropogenic GHG and other emissions [
18], intensifying global warming and environmental impacts [
19,
20].
Transitioning to a Renewable Energy (RE)-based economy can help resolve these three challenges. Shifting reliance on fossil fuels towards RE limits both import dependence and the consequences of fossil fuel scarcity. The generation of RE requires fewer specific conditions (such as infrastructure) than those demanded by fossil fuels [
17]. Additionally, RE is, in general, largely abundant, regardless of how many countries base their economies on such resources [
21]. Furthermore, transitioning to a RE-based economy would bolster de-carbonisation efforts, alleviating climate change [
22,
23]. Fossil energy use contributes to about 78% of global Greenhouse Gas (GHG) emissions, 91% of which derive from fossil fuel combustion [
24]. Increasing the share of renewable energy (RE) has been considered a key measure in reducing GHG emissions. In order to limit global temperature increases to 2 degrees, studies estimate that RE would need to be in the range of 200–300 EJ in 2050, equivalent to 40–80% of total primary energy supply in 2050 [
25]. This is a threefold increase compared to the 2019 estimate of 83 EJ [
26]. Despite a significant increase in the absolute use of RE spanning the period 2000 to 2019 (from 54 EJ to 83 EJ), the share of RE in total primary energy use has only slightly increased from 12.5% in 2000 to 13.7% in 2019 [
26]. Accounting for 68% in 2019, biomass is currently the top source of RE, followed by hydro power (18%) [
26].
There are many promising RE technologies that could play a role in increasing the contribution of RE sources in the energy supply but which are not yet commercially available. Examples of these are wave and tidal energy, floating wind and solar, osmotic energy, urban wind turbines and micro hydro. The development rate of new RE technologies depends on many factors, such as Research and Development (R&D) efforts and policies.
In the past, European Union (EU) states have been frontrunners in the development and deployment of RE technologies, especially concerning on- and offshore wind energy [
27]. Since about 2005 however, China has more than caught up and is now a global leader in installed RE capacity [
28]. Furthermore, China has become increasingly involved in RE investment in the EU and elsewhere [
29]. Curren et al. [
30] found that Chinese investments in European wind and solar infrastructure are mostly concentrated in Germany. Regarding new RE technologies, it is unknown where most investment activity is taking place and what China’s role is in global efforts. This study focusses on comparing China’s efforts regarding the development of new RE technologies with those of the European Union. The main research question is: How does China’s investment in new RE technology compare to that of the EU, and what role does each play in global RE technology development? The comparison of the EU to China is interesting, since both play a big role in renewable energy deployment globally, but their strategy has been very different. As far as we know, a comparison focussing on their efforts in new RE technology development is not yet available.
The paper is structured as follows: in
Section 2, we review China’s renewable energy strategy vis à vis the EU; in
Section 3, we introduce methods for comparing the EU and China in the development of new RE technologies; and in
Section 4 and
Section 5, we present results and conclusions, respectively.
2. Renewable Energy Strategy in China and the European Union
In this section, we review the different strategies for energy security and a transition to RE in the EU and China and the related lateral pressure in liberal and centralised political economies.
The wealth–power system, as discussed in the introduction, arranges fossil fuel consumption, wealth growth, fossil fuel scarcity and environmental deterioration in a self-reinforcing loop. In liberal, pluralistic state-society complexes, interrupting this loop requires government intervention, steering society through transition while non-governmental actors assert lateral pressure on the government to align energy policies with their interests. Understanding the threat posed to fossil fuel-based wealth–power systems, and the potential to alleviate these challenges by transitioning to a RE-based economy, the EU has set RE goals for 2030 [
31]. EU Member States have also developed policy strategies to secure their energy (fossil fuels) supply [
32,
33,
34], whilst guiding their various economic sectors towards becoming more RE-based, via policies and various incentives [
11,
12,
13,
35]. Different actors have various interests in the energy system and are affected differently by changing energy policies. Actors with
similar interests often form coalitions, exerting lateral pressure on government actors, seeking to shape energy policies around their interests [
36]. The success of such lateral pressure varies in different EU Member States. As such, the ability of major energy corporations to influence energy policies depends on their relationship with public institutions in a particular EU Member State or wealth-power structure.
Stukart [
37] identifies two RE transition policy categories (“liberal” and “industrial”) when considering The Netherlands (as a liberal state-society model) and China (as a centralised state-society model) (see [
1,
5]). Each transition faces two policy level choices: (1) “making or buying”, and (2) cost-efficiency versus effectiveness. Stukart (ibid: 81–84) found that The Netherlands applies a liberal policy, while China applies an industrial policy seeking to set up and rapidly expand RE industries. The Dutch policy objective of cost-efficient RE explains why the Dutch RE transition has proven less efficient than that of China [
37]. Stukart (ibid.) points to the presence of large fossil energy companies in The Netherlands and the potential to trade RE with Germany, Denmark, and Norway, as factors in the country’s cost-efficient approach. Conversely, China’s industrial policy has spurred rapid growth in companies producing RE technologies [
38]. The National Renewable Energy Development Plan, updated every five years, promotes the localization of the RE technology supply chain, the improvement of technological innovation capacities and the participation of domestical companies in international industrial standards development [
38].
China’s rapid industrial development has led to increasing lateral (i.e., socio-economic) pressure on its government to fulfil societal demands beyond growth, such as clean air and water [
1,
5]. Furthermore, the three White Papers by the Communist Party of China (CPC) identified threats to China’s energy security in 2007, 2012 and 2020: its inadequate industrial capabilities, low energy efficiency, and lack of technological expertise [
39,
40,
41].
Investment in the energy sectors of the main oil-producer countries to secure its energy supply is a top Chinese foreign policy objective [
42]. Furthermore, the Belt and Road Initiative (BRI) and 16 + 1 “Cooperation between China and Central and Eastern European (CEE) countries” have emerged as key instruments in strengthening China’s energy security (see [
43], p. 20). The 2003 EU–China Strategic Partnership was an initial step towards closer bilateral relations. The year 2019, however, marked a turning point in EU–China relations, as the uneven playing field between Chinese and European companies and a lack of reciprocity (i.e., China’s refusal to open up for foreign investment), sparked a change in approach by the EU ([
44], in [
43], p. 27).
As two of the largest global economic powers, China and the EU exchange daily trade flows of over 1 billion EUR [
45]. In terms of investment, China has expanded its rate of foreign direct investment (FDI) in the EU since 2010 [
46]. Wind power has, by far, been the primary target of Chinese investment in the EU energy sector, followed by solar power projects ([
47], p. 6 in [
43], p. 30). Wind technology has been acquired from European, and, specifically, German companies (such as Siemens), which play particularly important roles in global wind technology innovation. This has allowed China to develop the largest market for wind energy in the world, whilst also assisting its companies’ emergence as leading players in this market (see [
43]).
Consequently, it becomes clear that Chinese involvement in the European energy sector is motivated by both strategic and economic goals, which ultimately contribute to its energy security. Chinese companies require technology, industrial capabilities, and market experience in order to become more competitive and profitable internationally. Energy investments in the EU’s strategic sectors are designed to expand China’s presence in the EU internal market and gain technological know-how in the field of RE technologies. Such investments also strengthen the country’s geopolitical influence. This is supported by the broader trend of investing not only in energy but also in other critical infrastructure, such as transport or communication ([
48], in [
43], p. 45).
The following section provides an overview on the data and method on the development of renewable energy technology in China and the EU.
3. Methodology
In this section, we explain the method used to compare the efforts in new RE technology in China and the EU. To limit the scope, we focus mainly on electricity-generating renewables, which include the main share of RE technologies. We predominantly aim to consider relatively new renewable electricity technologies such as wave and tidal, binary geothermal power, floating solar, micro hydro, osmotic energy, floating offshore wind and vertical axis wind turbines. Where relevant, mainstream renewable electricity is included for comparative purposes. Mainstream renewables include onshore and offshore horizontal axis wind turbines, solar photovoltaics (PV) and hydropower. The technologies falling under “new renewable electricity technologies” may differ throughout the results, depending on the data sources used, which is indicated where relevant.
The analysis focuses both on recent trends (since 2000) and planned projects. Where possible, we compare data on China and the EU, and where relevant, we add global data from relevant regions or countries, such as the United States and Japan. Additionally, where relevant, we separate the EU (EU-28) by country. Inclusion of the United Kingdom in this study’s treatment of the EU is justified by the UK’s membership of the EU for most of the timeframe under study.
In order to measure Chinese and EU efforts towards the development of new RE technologies, we focus on a number of indicators. These include:
Development of renewable electricity generation and capacity;
Demonstration projects and companies/countries involved;
Public and private investments in R&D and research projects;
Patent applications.
Renewable electricity generation and demonstration projects are a direct result of efforts in furthering the application of RE technologies. Investments in R&D and patent applications are aimed more towards early stage technological innovation. The main data sources used per indicator are provided in
Table 1.
To identify demonstration projects, an online search was conducted. Therefore, the selected new renewable electricity technologies were used as search terms. The search was limited to projects in operation between 2000 and 2020 and to projects which generated capacity.
The report “Global Trends in Renewable Energy Investment 2020”, which builds on the BloombergNEF database, is used for outlining global and regional trends in total RE investment [
50]. The study considers how different types of RE investments, both private as well as public investments, are playing an important role. The role of venture capital and private equity investments in renewable energy is growing. Renewable Energy Finance Flows contain information on investments by development finance institutes in renewable energy projects [
51]. For public investment in renewable energy R&D, we utilised the Energy Technology RD&D Budget Database, containing IEA member state data on energy technology spending by governments and state-owned companies [
54].
In addition to the report “Global Trends in Renewable Energy Investment 2020”, the two reports, namely, “Energy Technology Perspectives 2020” [
52] and “Energy Technology RD&D Budgets” [
53] are used for private investment in the renewable energy R&D. To analyse the EU’s R&D spending on new RE technologies in greater detail, data were collected from the Community Research and Development Information Service (CORDIS). Since the Framework Programme (FP) databases do not contain classifications of projects based on RE technologies, a keyword search was conducted (as in [
57]). The keyword search targeted the title of the projects and their objectives. The following terms were used: “floating wind”, “vertical wind”, “urban wind”, “floating solar”, “floating PV”, “solar windows” “PV windows”, “binary energy”, “organic cycle”, “small hydropower”, “flexible hydropower”, “wave energy”, “tidal energy”, “tidal power”, “osmotic power”, “blue energy” and “ocean energy”. Projects containing these terms in their title or objective were initially regarded as hits. Afterwards, these pre-selected projects were filtered by examining the content of the title and the objectives to identify the projects within the scope of this study. This analysis identified 137 projects from the FP6, FP7 and H2020 as relevant to this study.
Finally, renewable energy patents are studied based on the IRENA INSPIRE data from the renewable technology patents reports. This data gives insights into the evolution of patents by RE technologies [
56].
4. Results
In
Section 4.1, we present results on renewable electricity generation and capacity and in
Section 4.2, we show results from investments in RE, R&D spending and patent data.
4.1. Renewable Electricity Generation and Capacity
In this section we discuss renewable electricity output per technology, following the main renewable energy categories from IEA statistics (geothermal, tidal/wave/ocean, solar PV, solar thermal, wind and hydro) [
58]. Most categories include both new and mainstream RE developments. Where possible, we try to disaggregate between the two.
4.1.1. Geothermal Power
Table 2 presents the amount of geothermal electricity generation in 2000, 2010 and 2020, globally and per country. The table shows values for the 15 largest generating countries. The remaining countries (including China) are included in the row “Other countries”. In order to show China as well, we have included its values in the bottom row together with the aggregated EU-28 values.
The table shows that China has a very limited amount of geothermal electricity output so far (0.1 TWh in 2020), while the US and EU have greater amounts (18.8 and 6.7 TWh in 2020, respectively).
Various different forms of geothermal power generation are employed and under development. Geothermal energy in high enthalpy reservoirs can be directly used to generate electricity in a Rankine cycle. The main share of geothermal power plants is of this type. For lower enthalpy reservoirs, binary Organic Rankine Cycles (ORC) can be used to generate power. The latter technology is increasingly applied. The advantage is that a much bigger share of aquifers can be used for power generation.
The total installed capacity of geothermal power plants globally was about 12.8 GW by the end of 2017, of which 1.5 GW consisted of binary ORCs (based on [
49]).
Table 3 shows the amount of installed capacity of binary ORC plants in operation, under construction and planned. Most plants in operation, as well as under construction and planned, are located in the United States, New Zealand and Turkey. Remarkable is the strong growth in Turkey from 0.7 TWh in 2010 to 10.0 TWh in 2020. The amount of binary geothermal plants in China is very limited, with only 1 MW in operation. The EU has a modest share of global activity, although 25% of plants under construction are located in the EU.
Another form of geothermal power generation is hot dry rock (HDR), which is rooted in enhanced geothermal systems (EGS). Instead of using heat from aquifers, this entails injecting water under pressure in deep layers of dry radioactive rocks. The first HDR project started in the Los Alamos National Laboratory in the United States in 1973. In European countries, HDR projects have been conducted since 1977. The first large HDR project was a joint European initiative by France, Germany, Italy, Switzerland and the UK in Soultz-sous-Forêts in France in 1987. The project received funding from the EU, Germany and France. Since 2016, this HDR plant has been used commercially. The first private commercial plant commenced operations in Australia in 2013 [
59,
60]. The main activities at the moment are in Europe and the United States [
61,
62]. Besides the joint EU initiative in France, Germany has been the most active country in establishing EGS demonstrations [
63]. HDR is one of the research topics for the Chinese roadmap to carbon neutrality by 2060, and has been demonstrated in Tangshan, Hebei Province [
64].
4.1.2. Tidal, Wave and Ocean
Table 4 shows the amount of tidal, wave and ocean electricity generation in 2000, 2010 and 2020, globally and per country, sorted on electricity output in 2020. For the countries not listed in the table, the power generation is negligible for this category. Note that the unit for this table is GWh instead of TWh (as in the other tables), due to the small size of generation.
The two biggest sources of electricity generation from wave and tidal projects are two tidal barrages located in France (commissioned in 1966) and South Korea (commissioned in 2011) (see also
Table 5). Other wave and tidal power generations are very small. In Spain, the Mutruka Breakwater plant has been in operation since 2011 with an installed capacity of 0.3 MW [
65]. In Canada, several demonstration projects were decommissioned after 2010, since they were only installed for testing. The United Kingdom is the main testing ground for small wave and tidal rotors. Our online search showed that the UK plays an important role in wave energy demonstration projects, since 10 of the 30 pilot projects found between 2000 and 2020 were located in the UK.
Another form of ocean energy in its early development stage is Ocean Thermal Energy Conversion (OTEC). Its application thus far is very limited, with 0.1 MW in operation in the US, 10 MW planned for China, and 10 MW planned for the Bahamas [
49].
Finally, a further form of ocean energy is osmotic power. In 2009, the first pilot power plant was opened in Norway. In the Netherlands one plant has been in operation since 2014 [
66]. Additionally, in 2014, research projects in Canada, Germany, Italy, Japan, Singapore, South Korea and the US were conducted to address the existing technological challenges [
67]. There are two different techniques; while the Netherlands focuses on the technique of Reversed Electrodialysis, other countries focus on Pressure Retarded Osmosis.
4.1.3. Solar PV
Table 6 shows the amount of solar photovoltaic electricity generation in 2000, 2010 and 2020, globally and per country, sorted on output in 2020.
Overall, there was a considerable growth in solar PV, especially in the EU, during the 2000s, and in China, the Unites States and Japan during the 2010s.
For the relatively new floating PV, the current deployment is limited, with most activity occurring in China and Japan. Total floating capacity reached almost 1100 MW
p in 2018 ([
68], p. 4). The first floating PV farms were installed in Japan in 2007, which has commissioned 180 MW
p up to now. In China, between 2016 and 2018, more than 700 MW
p was commissioned [
69]. Most of the largest farms are installed there ([
68], p. 2–4). The French company Ciel & Terre is an important technology constructor of floating PV farms worldwide, particularly in China. However, in the Chinese market, the Chinese company Sungrow plays an even more important role. Finally, South Korea has installed 80 MW
p and the United Kingdom, 12 MW
p of floating PV. The United States has planned projects totalling 19 MW
p [
49]. For PV with heat recovery, 20 MW
p is planned in China [
49].
4.1.4. Solar Thermal Power
Table 7 shows the amount and growth of solar thermal power generation in 2000, 2010 and 2020, globally and per country. The absolute amount is small with 14 TWh in 2020, globally. Spain has the highest share of this, followed by the United States. The low application of this technology so far could be related to the desert-like conditions needed, since the technology only operates with direct beam sunlight. Planned solar thermal power plants are mainly present in the United States, which has 476 MW planned [
49]. According to [
70], China has plans for CSP plants by 2030 located in Quinghai (400 MW), Gansu (410 MW) and Jilin (200 MW).
4.1.5. Wind
Table 8 shows the amount and growth of wind power generation in 2000, 2010 and 2020: globally and per country. In 2020, the contribution of China and EU-28 was almost equal. The main growth in China occurred in the 2010s, though in EU-28, in relative sense, a stronger growth occurred in the 2000s.
Horizontal axis wind turbines account for the largest share of wind power installation. Based on [
49], the current deployment of vertical axis wind turbines (VAWT) is very limited, with just 57 MW in operation in the US, 18 MW in Canada, 3.3 MW in Europe (mainly Germany and Sweden) and 2.6 MW China. Planned projects amount to 150 MW in Russia, 71 MW in the US and 10 MW in Indonesia.
Initially, the deployment of offshore wind power occurs mainly in the EU, where 75% of its global capacity is located. However, China has increased its capacity significantly in recent years to account for 41% of global capacity [
71]. Current offshore wind farms are mainly with fixed foundations placed in relatively shallow water. The use of floating wind turbines, which can be placed further from shore or in deeper waters, can significantly increase the potential of wind power application. Besides Europe, Japan plays a relevant role in the development of floating wind power technology ([
72], p. 5). In 2013, more than 60% of floating wind energy structures (either connected to the grid or under development) were located in Europe, while 23% and 10% were located in Japan and the US, respectively ([
73], p. 13). Demonstration projects in Europe are mostly located in Sweden, France, Norway and Spain ([
74], p. 9). China installed its first floating turbine in 2021 [
75].
4.1.6. Hydro
Table 9 shows the amount and growth of hydropower generation in 2000, 2010 and 2020, globally and per country. Total hydropower generation appears to have decreased in EU-28 during the period 2010 to 2020. This is slightly misleading, however, since the trend series does not reflect a visible decline, but rather a strong yearly fluctuation in hydro output, possibly related to climate conditions such as rainfall and river runoff. On average, EU-28 hydropower output was 340 TWh during the period 2000–2021 [
26]. China has, by far, the biggest amount of hydropower output, which is directly related to the presence of very large hydropower stations such as in the Three Gorges Dam and the Xiluodu Dam.
4.1.7. All Sources
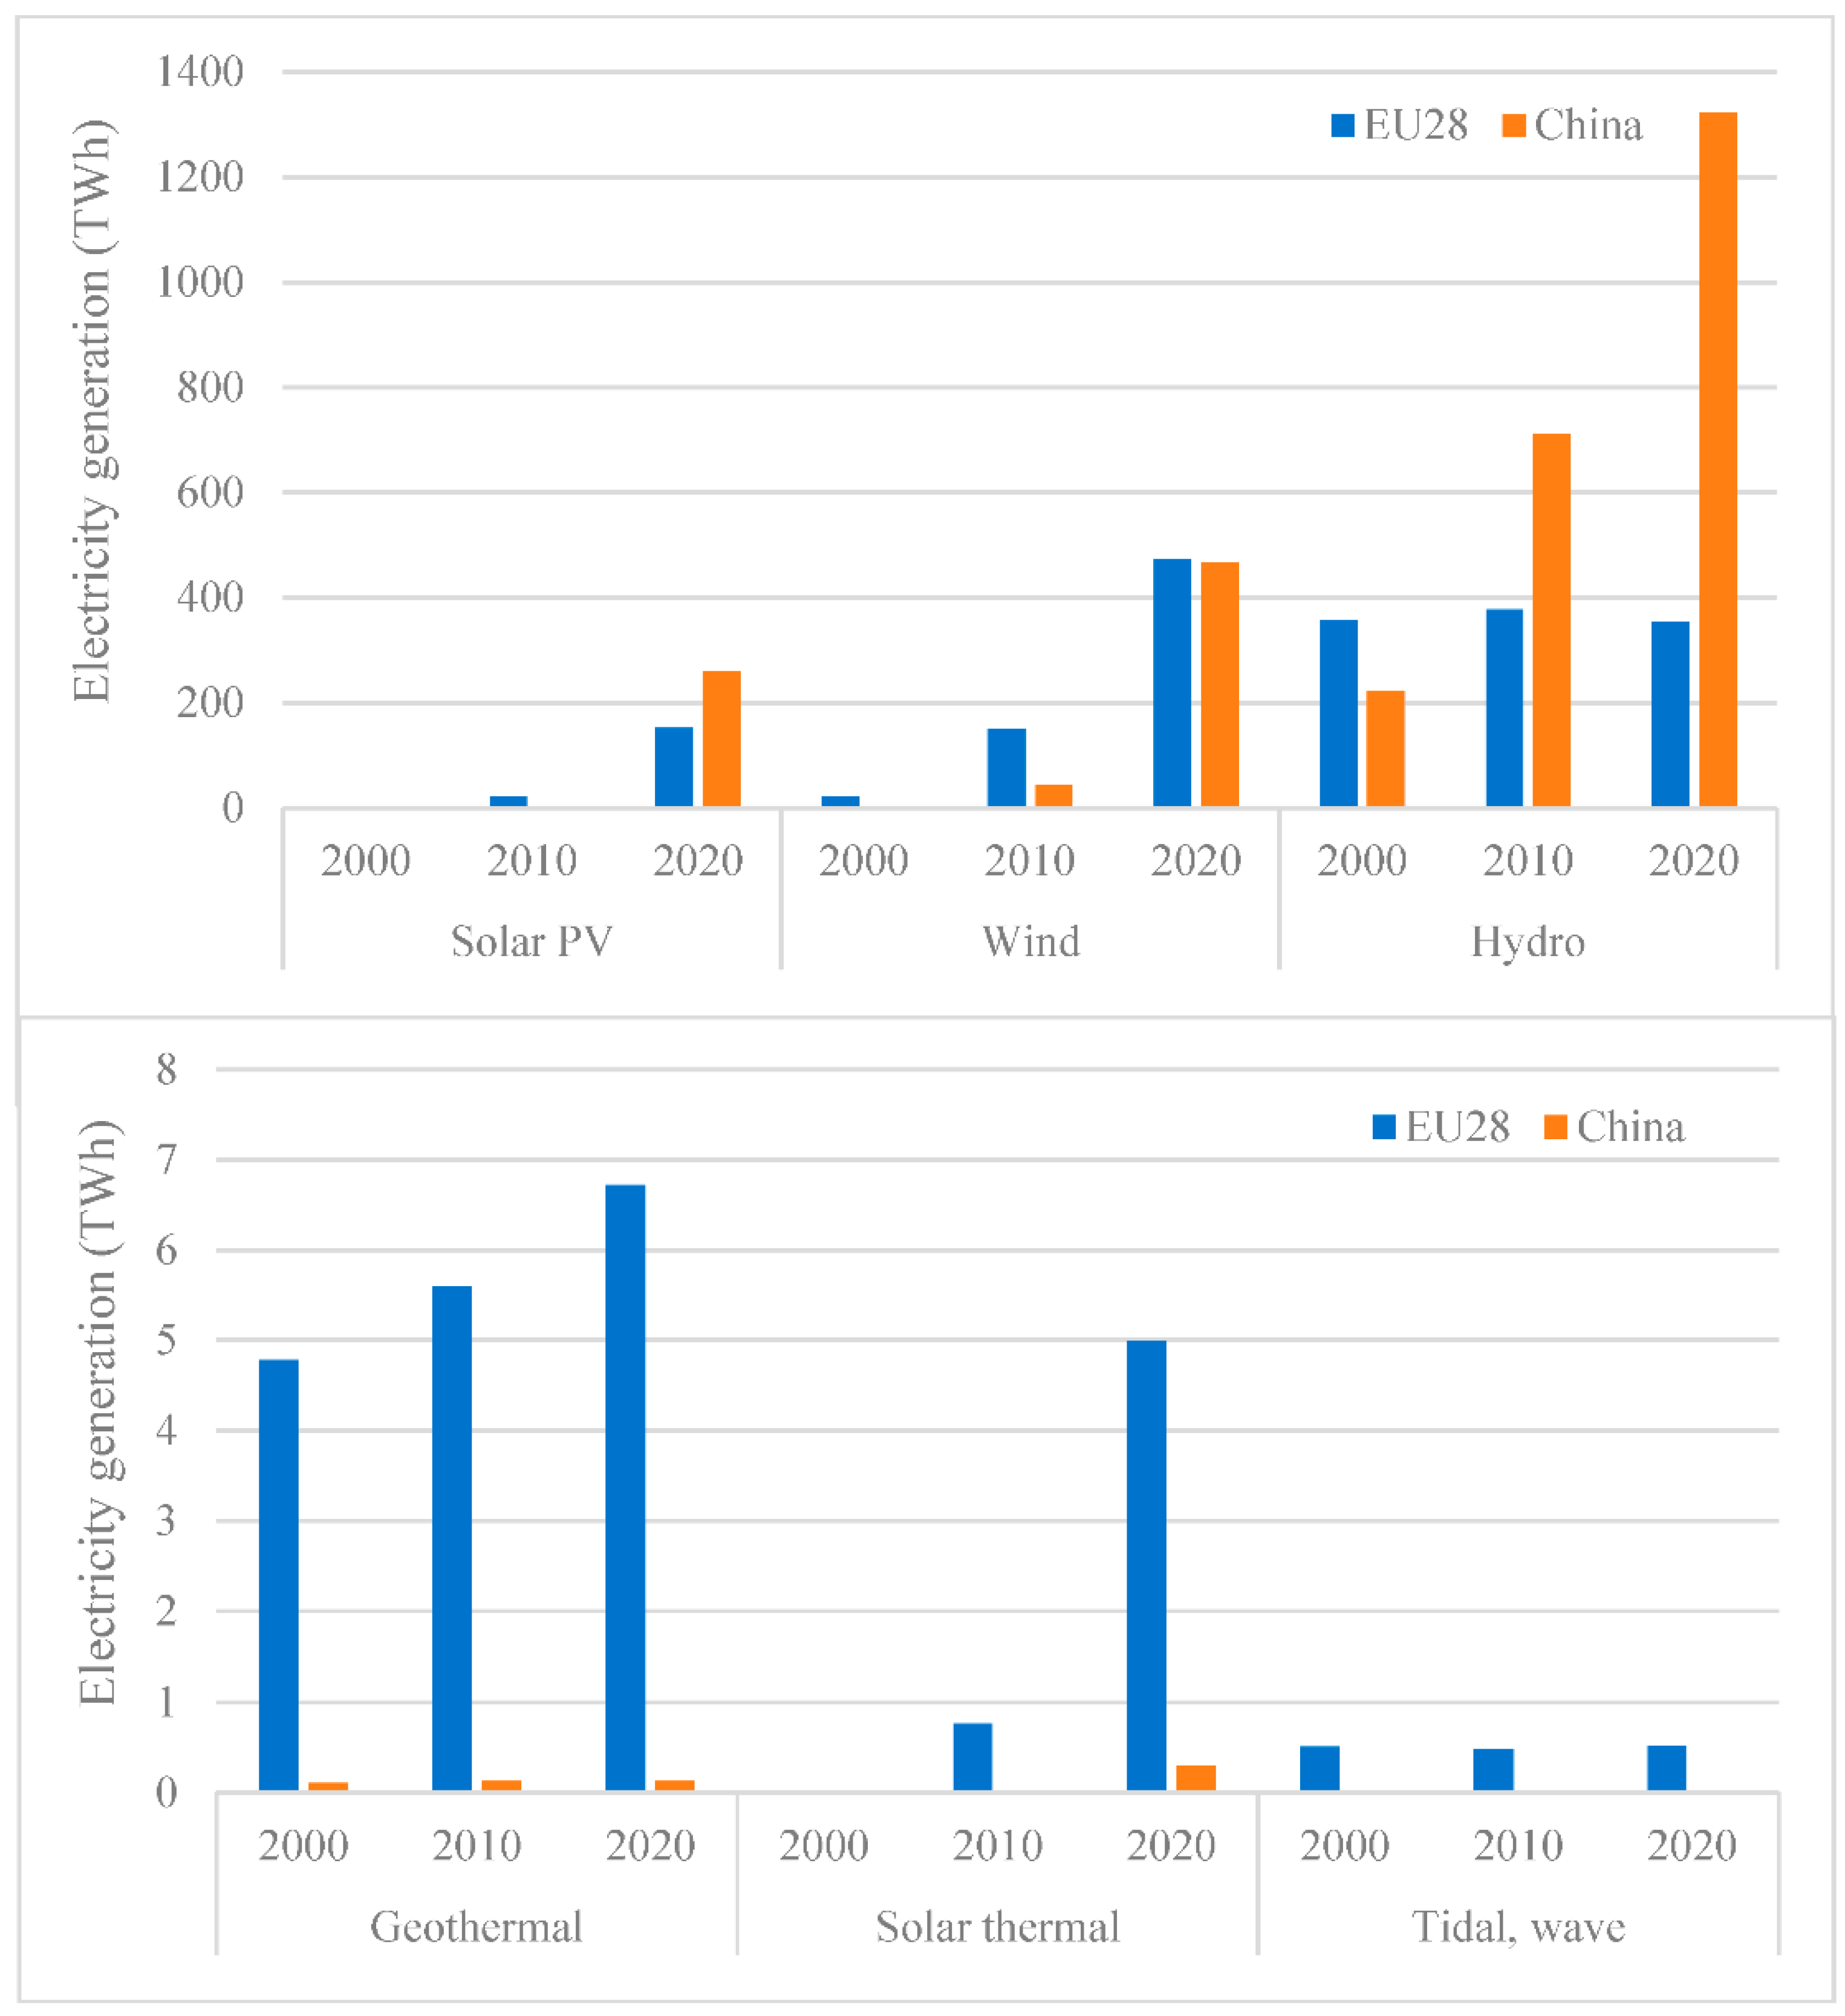
Figure 1 shows a summary of renewable electricity generation by source in 2000, 2010 and 2020 for the EU-28 and China. As can be seen, China is the biggest player for mainstream renewable electricity (especially hydro and solar PV). This compounds the relative success of China’s RE transition as part of its industrial policy, which prioritises effectiveness over cost efficiency. The main developments occurred in the 2010s and more than caught up with the EU, which was a frontrunner in the 2000s. Regarding newer or less mainstream technologies (geothermal, floating wind, wave/tidal), the application in China remains low compared to the EU, with the exception of floating solar, where China is a lead player (see
Section 4.1.3).
4.2. Investments and Research in Renewable Energy Technologies
In this section, we give an overview of available data on investments in renewable energy projects, R&D spendings and patent applications.
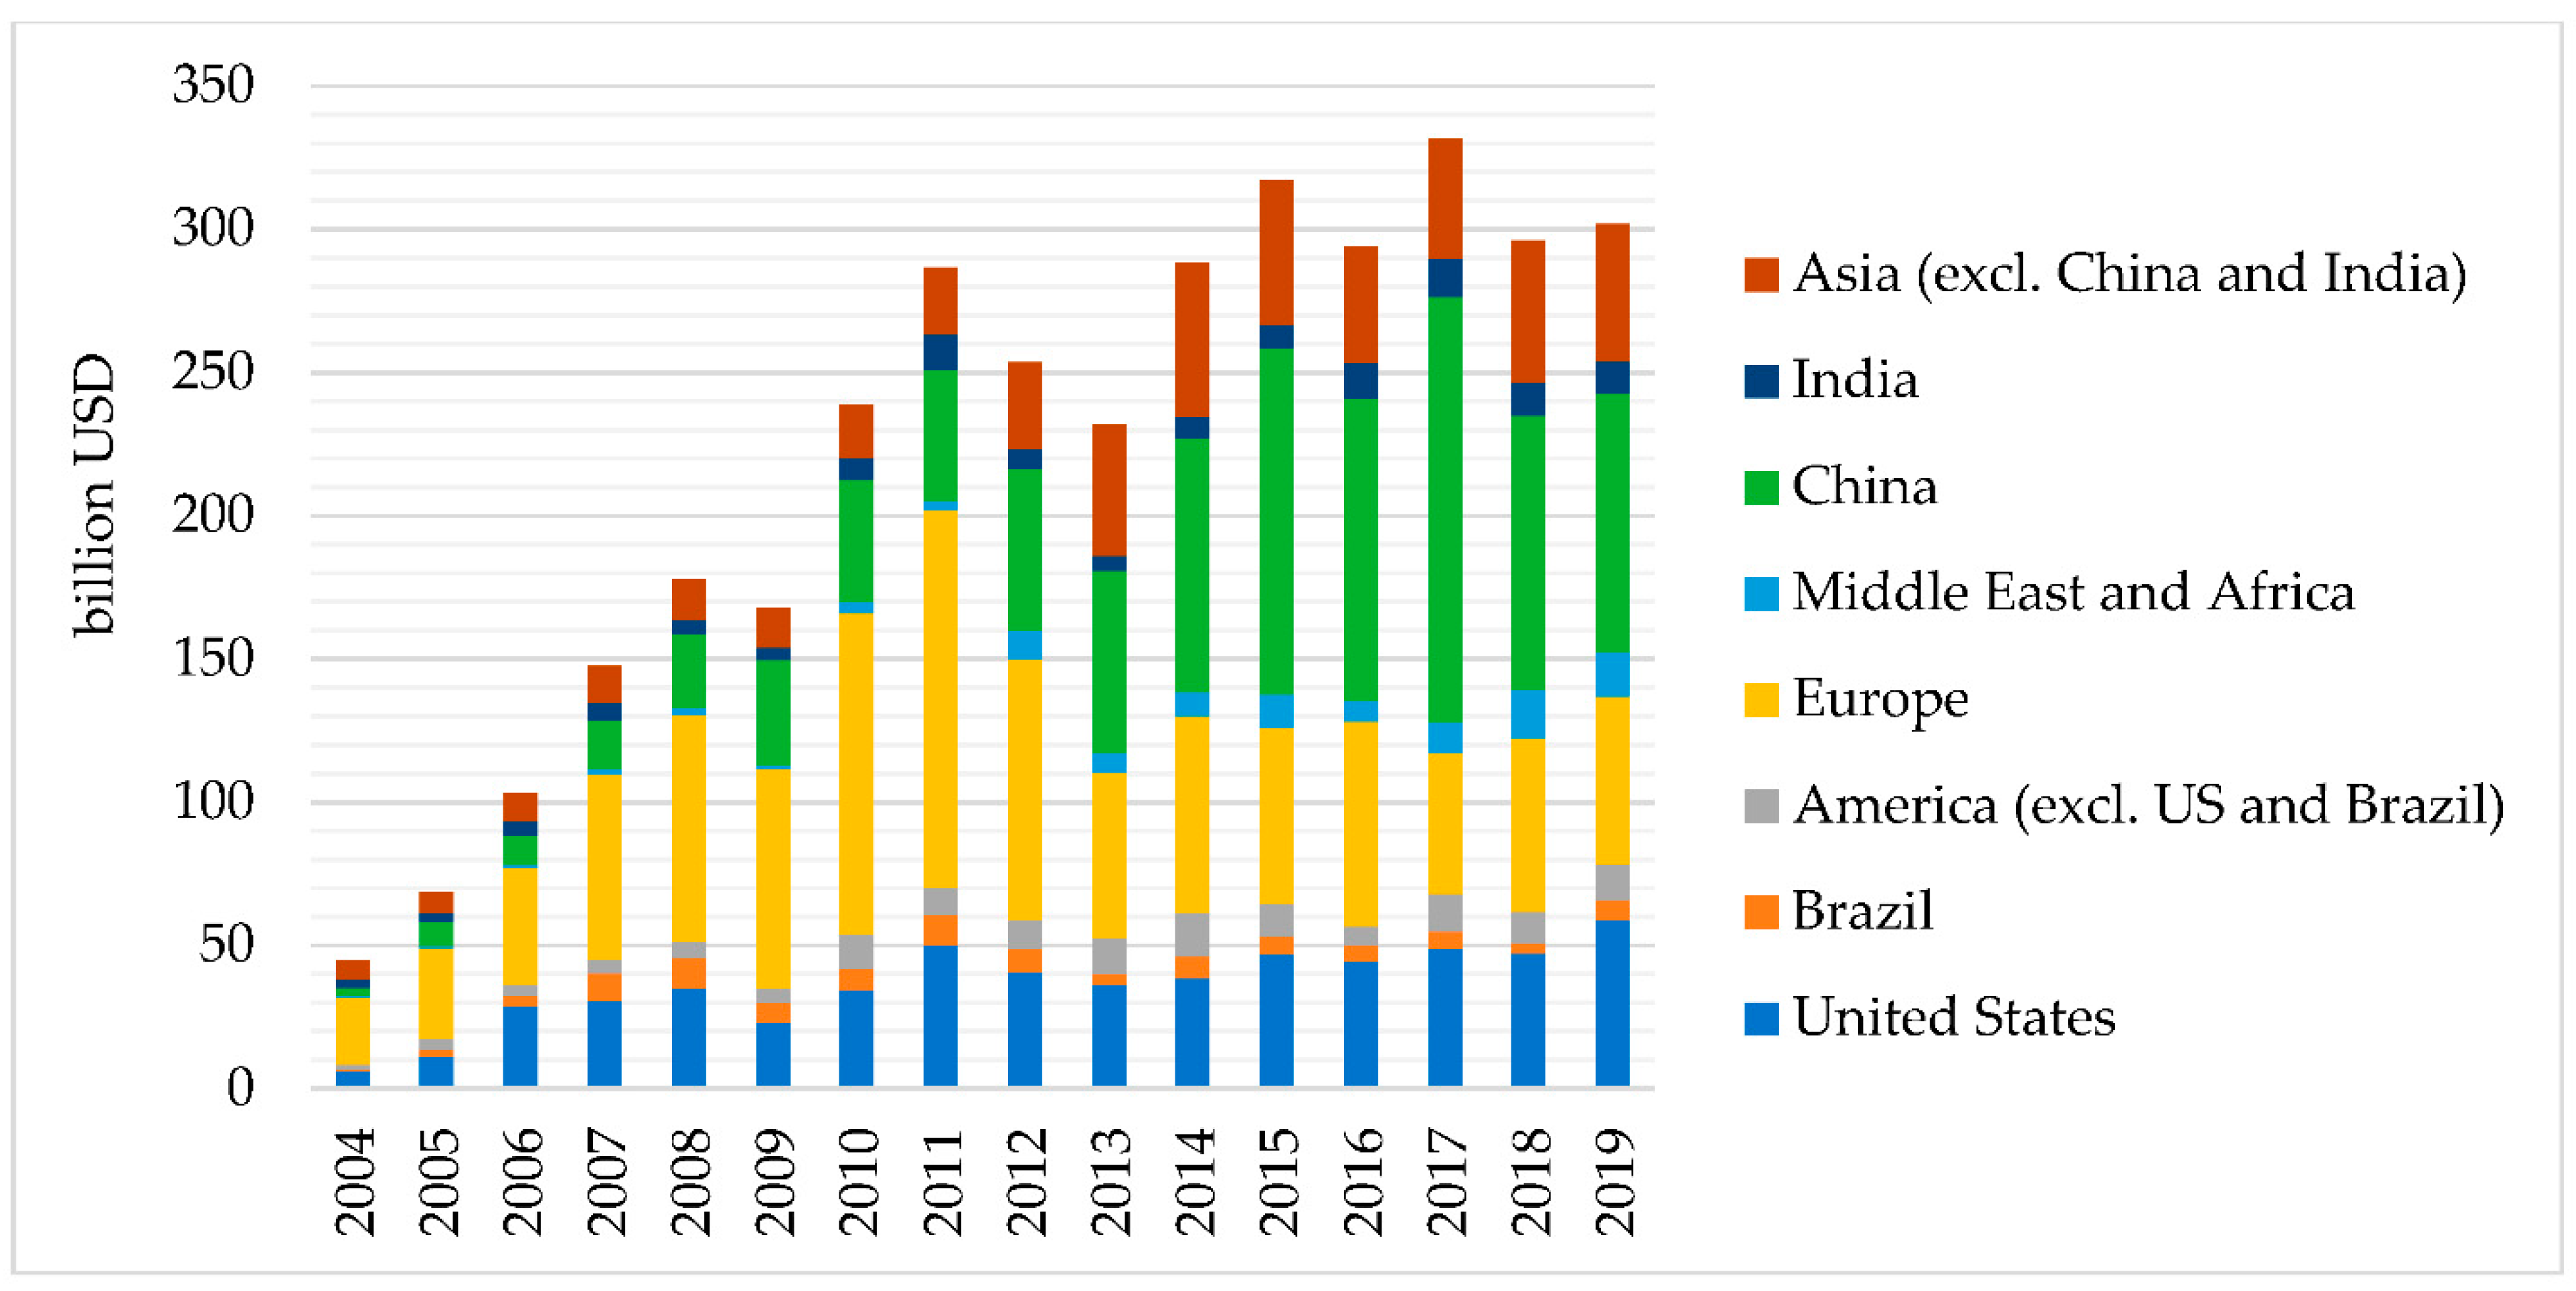
Figure 2 illustrates the development of investment in RE during the period 2004–2019, by country. In 2019, investments amounted to USD 302 billion, an increase of 800% compared to 2004. Global RE investment has remained relatively stable since 2015 [
50]. China has shown the biggest absolute and relative growth in investments and accounted for USD 90 billion in 2019, followed by the United States with USD 59 billion and Europe with USD 58 billion. The annual growth rate for RE investments during the period 2004–2019 was 25%/y for China, 16%/y for the US and 6%/y for Europe (based on [
50]).
Some of the investments are made through development finance institutes (DFI), which offer a source of finance for RE projects. Comparing DFI-investment in RE projects from 2000 to 2017 between China, the EU-28 and the US finds that European countries received the highest amount (more than USD 36 billion). From 2000 to 2017, China received around USD 3 billion DFI-investments, while the US received USD 224 million [
51].
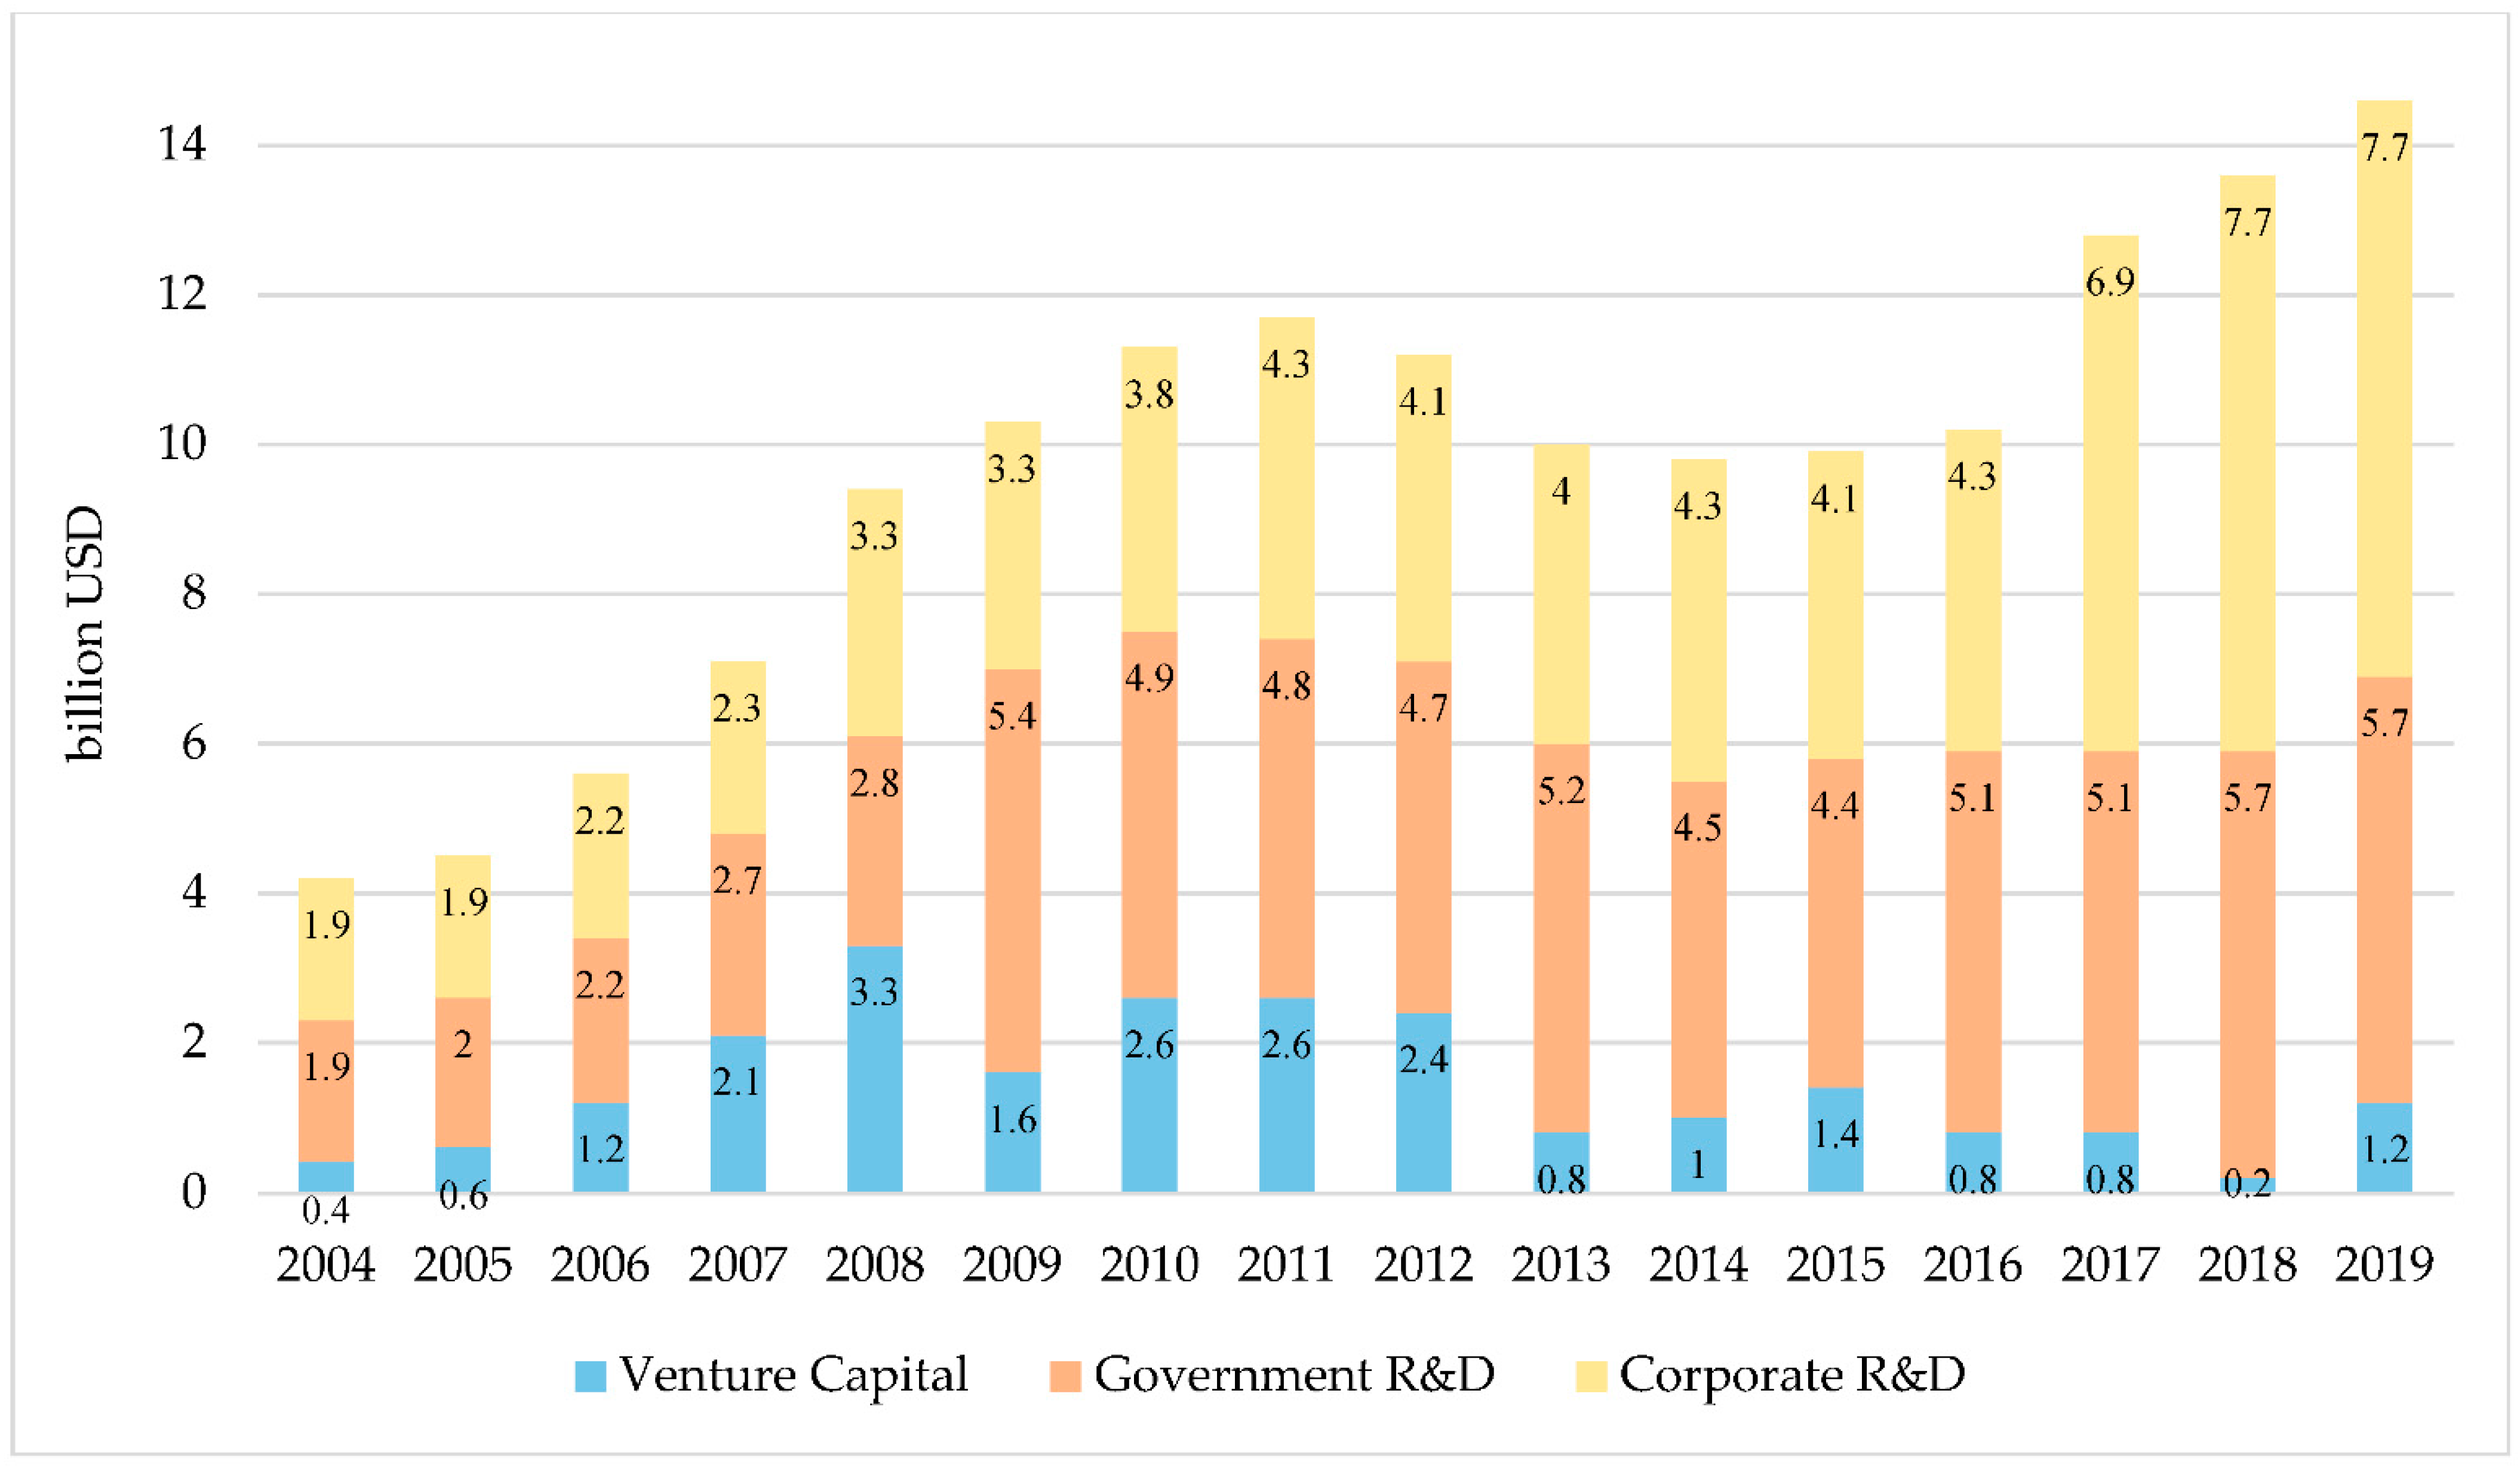
In 2019, public and private renewable energy-related R&D spending totalled USD 13.4 billion. Thereby, investments in solar energy reached USD 6.7 billion, wind energy USD 2.7 billion, biofuels USD 1.8 billion, small hydropower USD 0.7 billion, biomass and waste USD 1 billion, and geothermal energy and ocean energy each receiving USD 0.2 billion ([
50], p. 65). As
Figure 3 illustrates, since 2017, corporate R&D spending is the primary source of new investment for RE technology development, accounting for USD 7.7 billion in 2019. Besides corporate and public spending, venture capital (VC) is a more recent financing source for technology development in the renewable energy sector. Solar power accounted for more than 60% of venture capital and private equity investment in renewables ([
50], pp. 66–67). Globally, the hydrogen and energy storage sectors experienced the highest growth in early stage venture capital in 2019 ([
52], p. 321). The RE sector in India received by far the most considerable venture capital and private equity investment in 2019 (USD 1.4 billion), followed by the US with USD 797 million and Europe with USD 443 million. Venture capital and private equity investments did not play a relevant role in China in 2019 ([
50], p. 67).
The IEA Energy Technology RD&D Budget Database contains government and state-owned companies’ spending on energy technology development [
54]. The dataset presents limitations, since the data on China is not included Additionally, several years of data are missing for some countries. Nevertheless, the data can give insights into the development of R&D spending in renewables. Based on the data, the EU-28 (with 18.23 billion) had the highest public spending on renewables among the IEA member states between 2000 and 2018, followed by the US (with USD 15.8 billion) and Japan (USD 6.8 billion) [
54]. Of the EU-28 countries, Germany (USD 3.9 billion) and France (USD 2.3 billion) had the highest spendings, followed by the European Commission (USD 2005 million) and Italy (USD 1716 million) [
54]. For all regions, the public R&D budget has increased significantly since 2000 (by a factor 2 for Japan and US and 5 for EU-28). For the EU-28 and the United States between 2011 and 2018, the highest R&D spending was found for biofuels. The EU-28 had the highest public R&D budget for solar, wind and ocean energy, while the US had the highest spendings for geothermal energy and biofuels [
54].
Part of the EU public funding for RE technology is through its framework programs (FP), which aim to promote research. Over the last 20 years, the EU spent EUR 3.6 billion on RE technologies ([
57], p. 7). To analyse the EU’s R&D spending on new renewable energy technologies, data were collected from CORDIS [
55].
Table 10 shows the budget of EU-funded R&D projects regarding selected new RE technologies for the FP6 (2002–2006), FP7 (2007–2013) and H2020 (2014–2020) programmes. As such, the H2020 programme was found to finance the majority of the identified renewable energy projects. Most EU funding, with more than EUR 98 million, went towards floating wind power projects. Thus, from the selected new RE technologies, floating wind power projects received a share of 26% of the funding. Wind energy projects, with EUR 97 million, received the second-largest share of EU R&D funding.
Finally, patents offer insights into research activities which hold the potential for commercialisation. While patents are not a direct measure of R&D output, they are an indicator of innovation activities in the renewable energy sector ([
53], pp. 322–323).
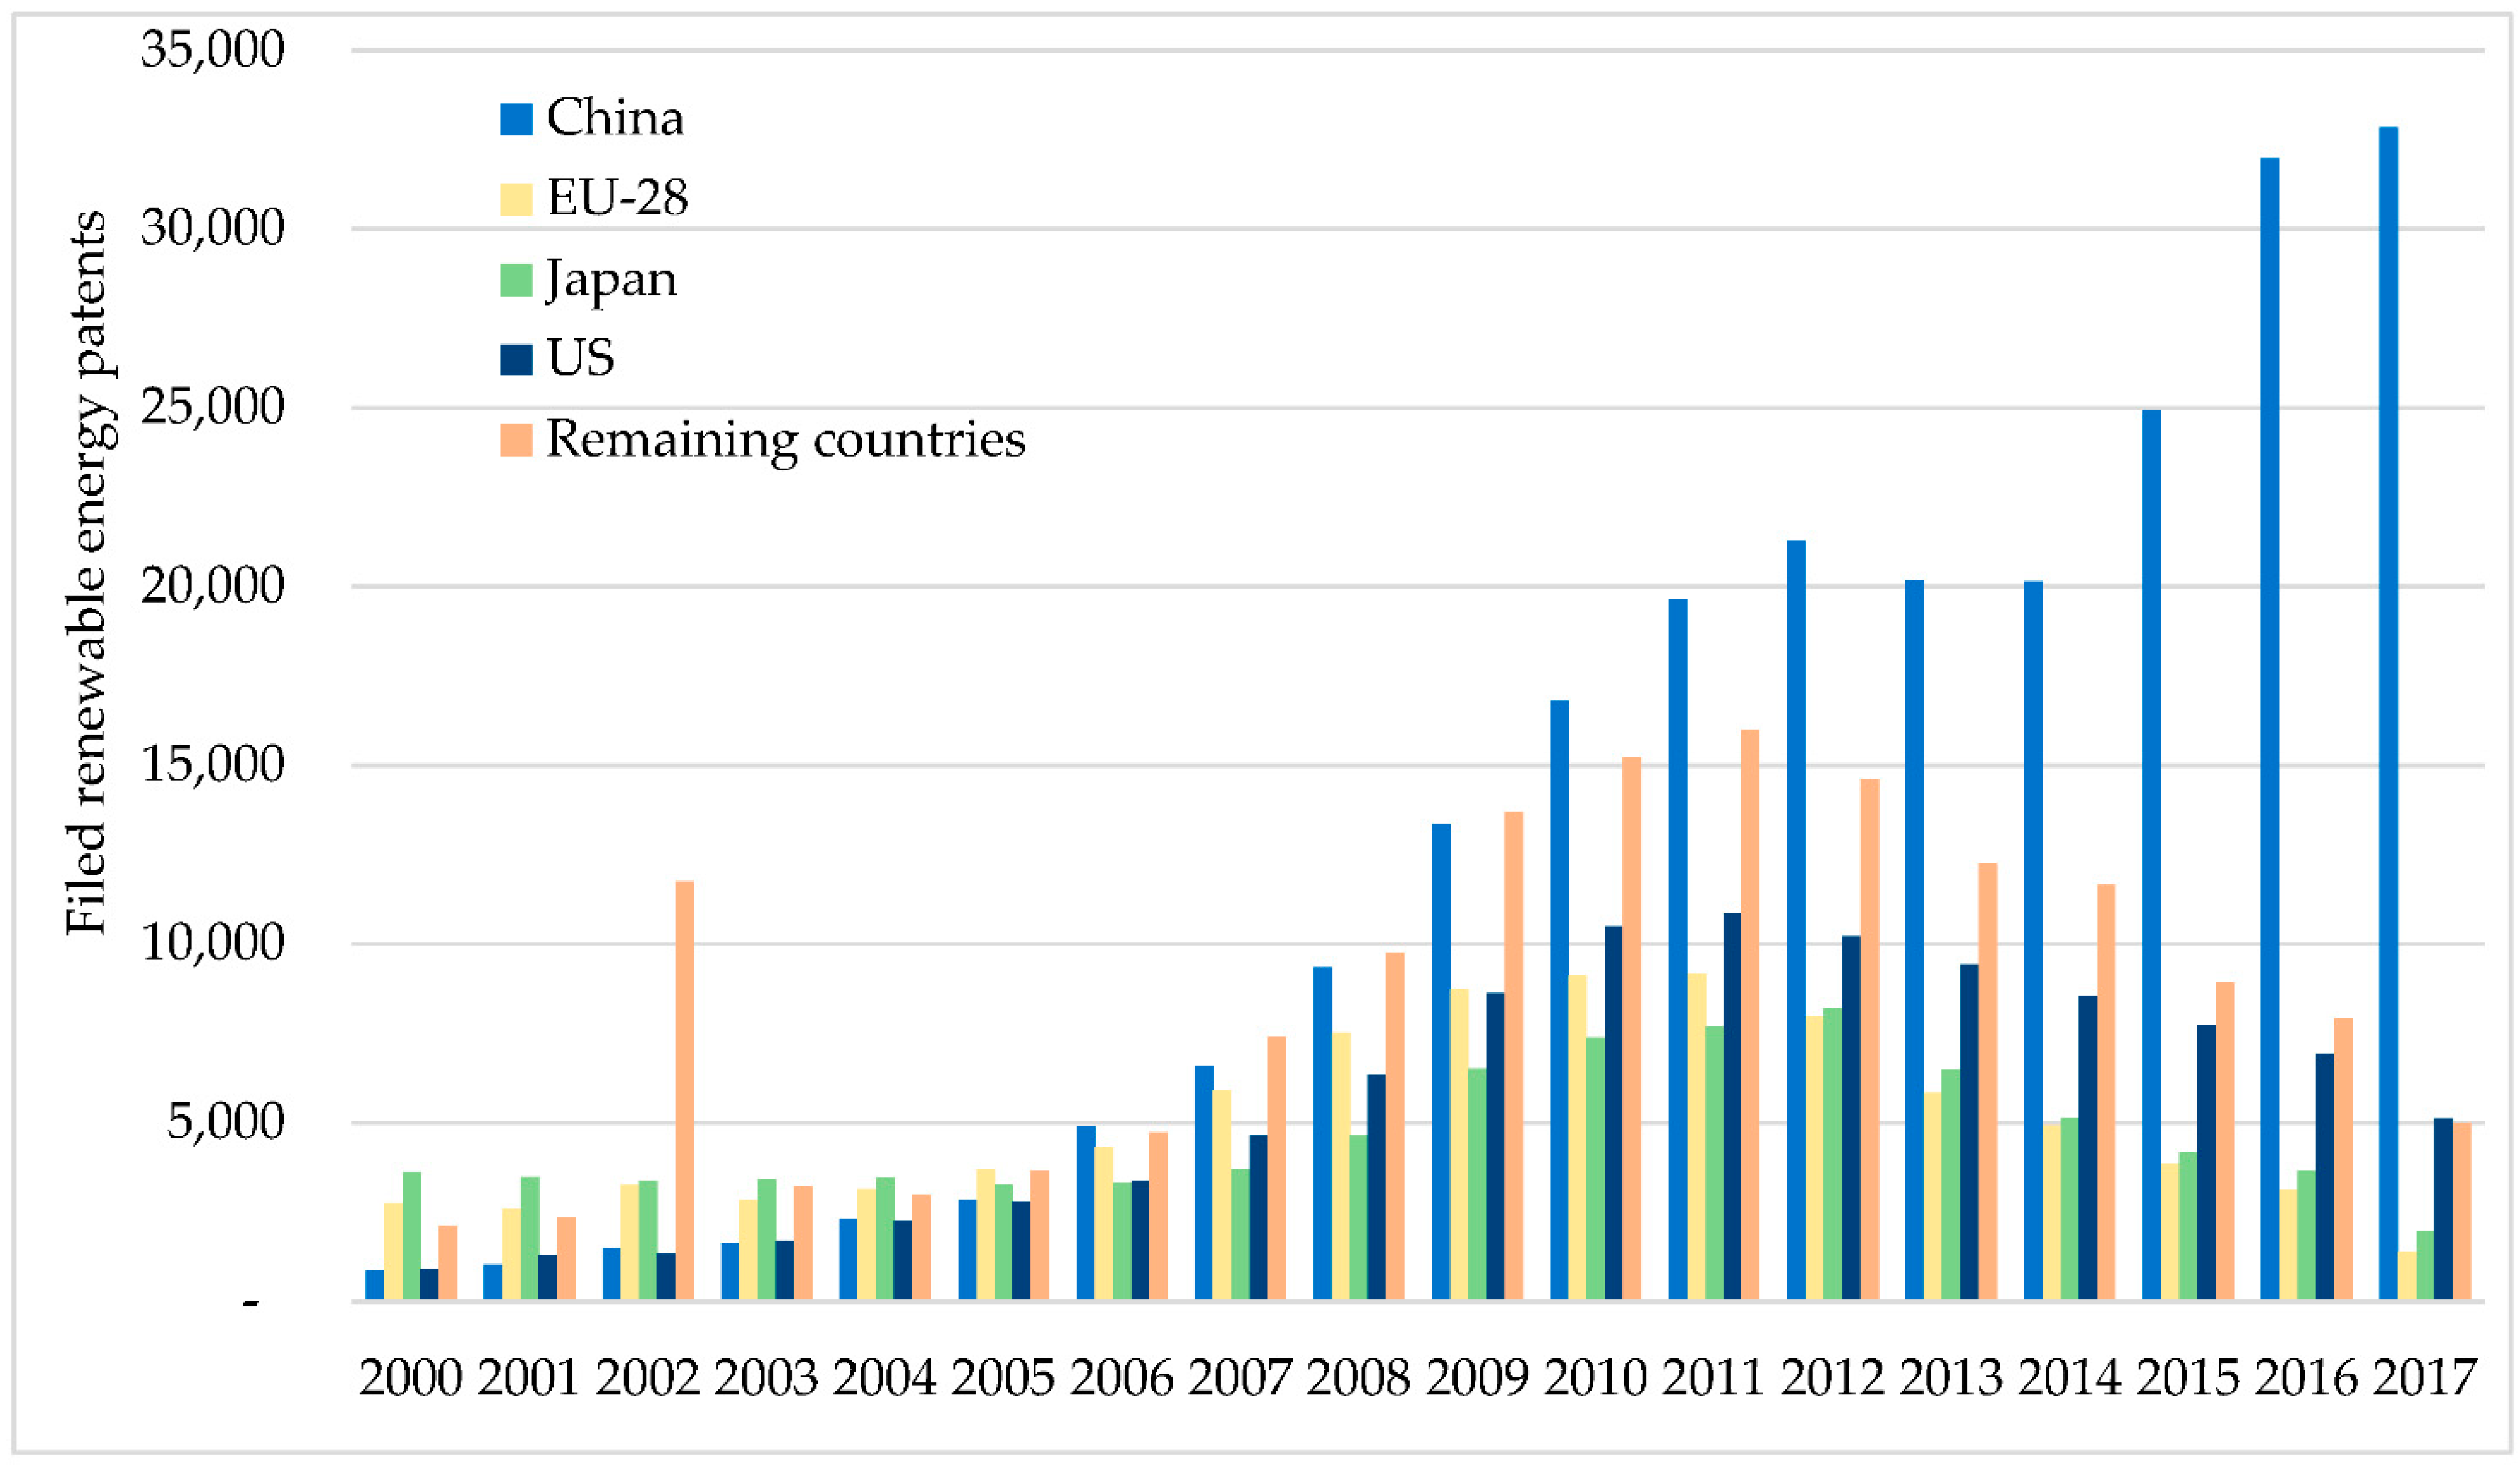
Figure 4 compares the development of renewable energy patents in China, the EU-28, the US and remaining countries. The data include information on 72 countries worldwide. Annual filed patents for renewable energy technologies have declined in EU-28 and the US since 2012. On the other hand, the number of Chinese patents are, after a decline in 2013 and 2014, increasing again.
Total cumulative filed patents over the period 2000–2017 amounted to 221,732 for China, followed by the US with 102,567, the EU-28 with 90,168 and Japan with 83,484 patents (based on [
56]).
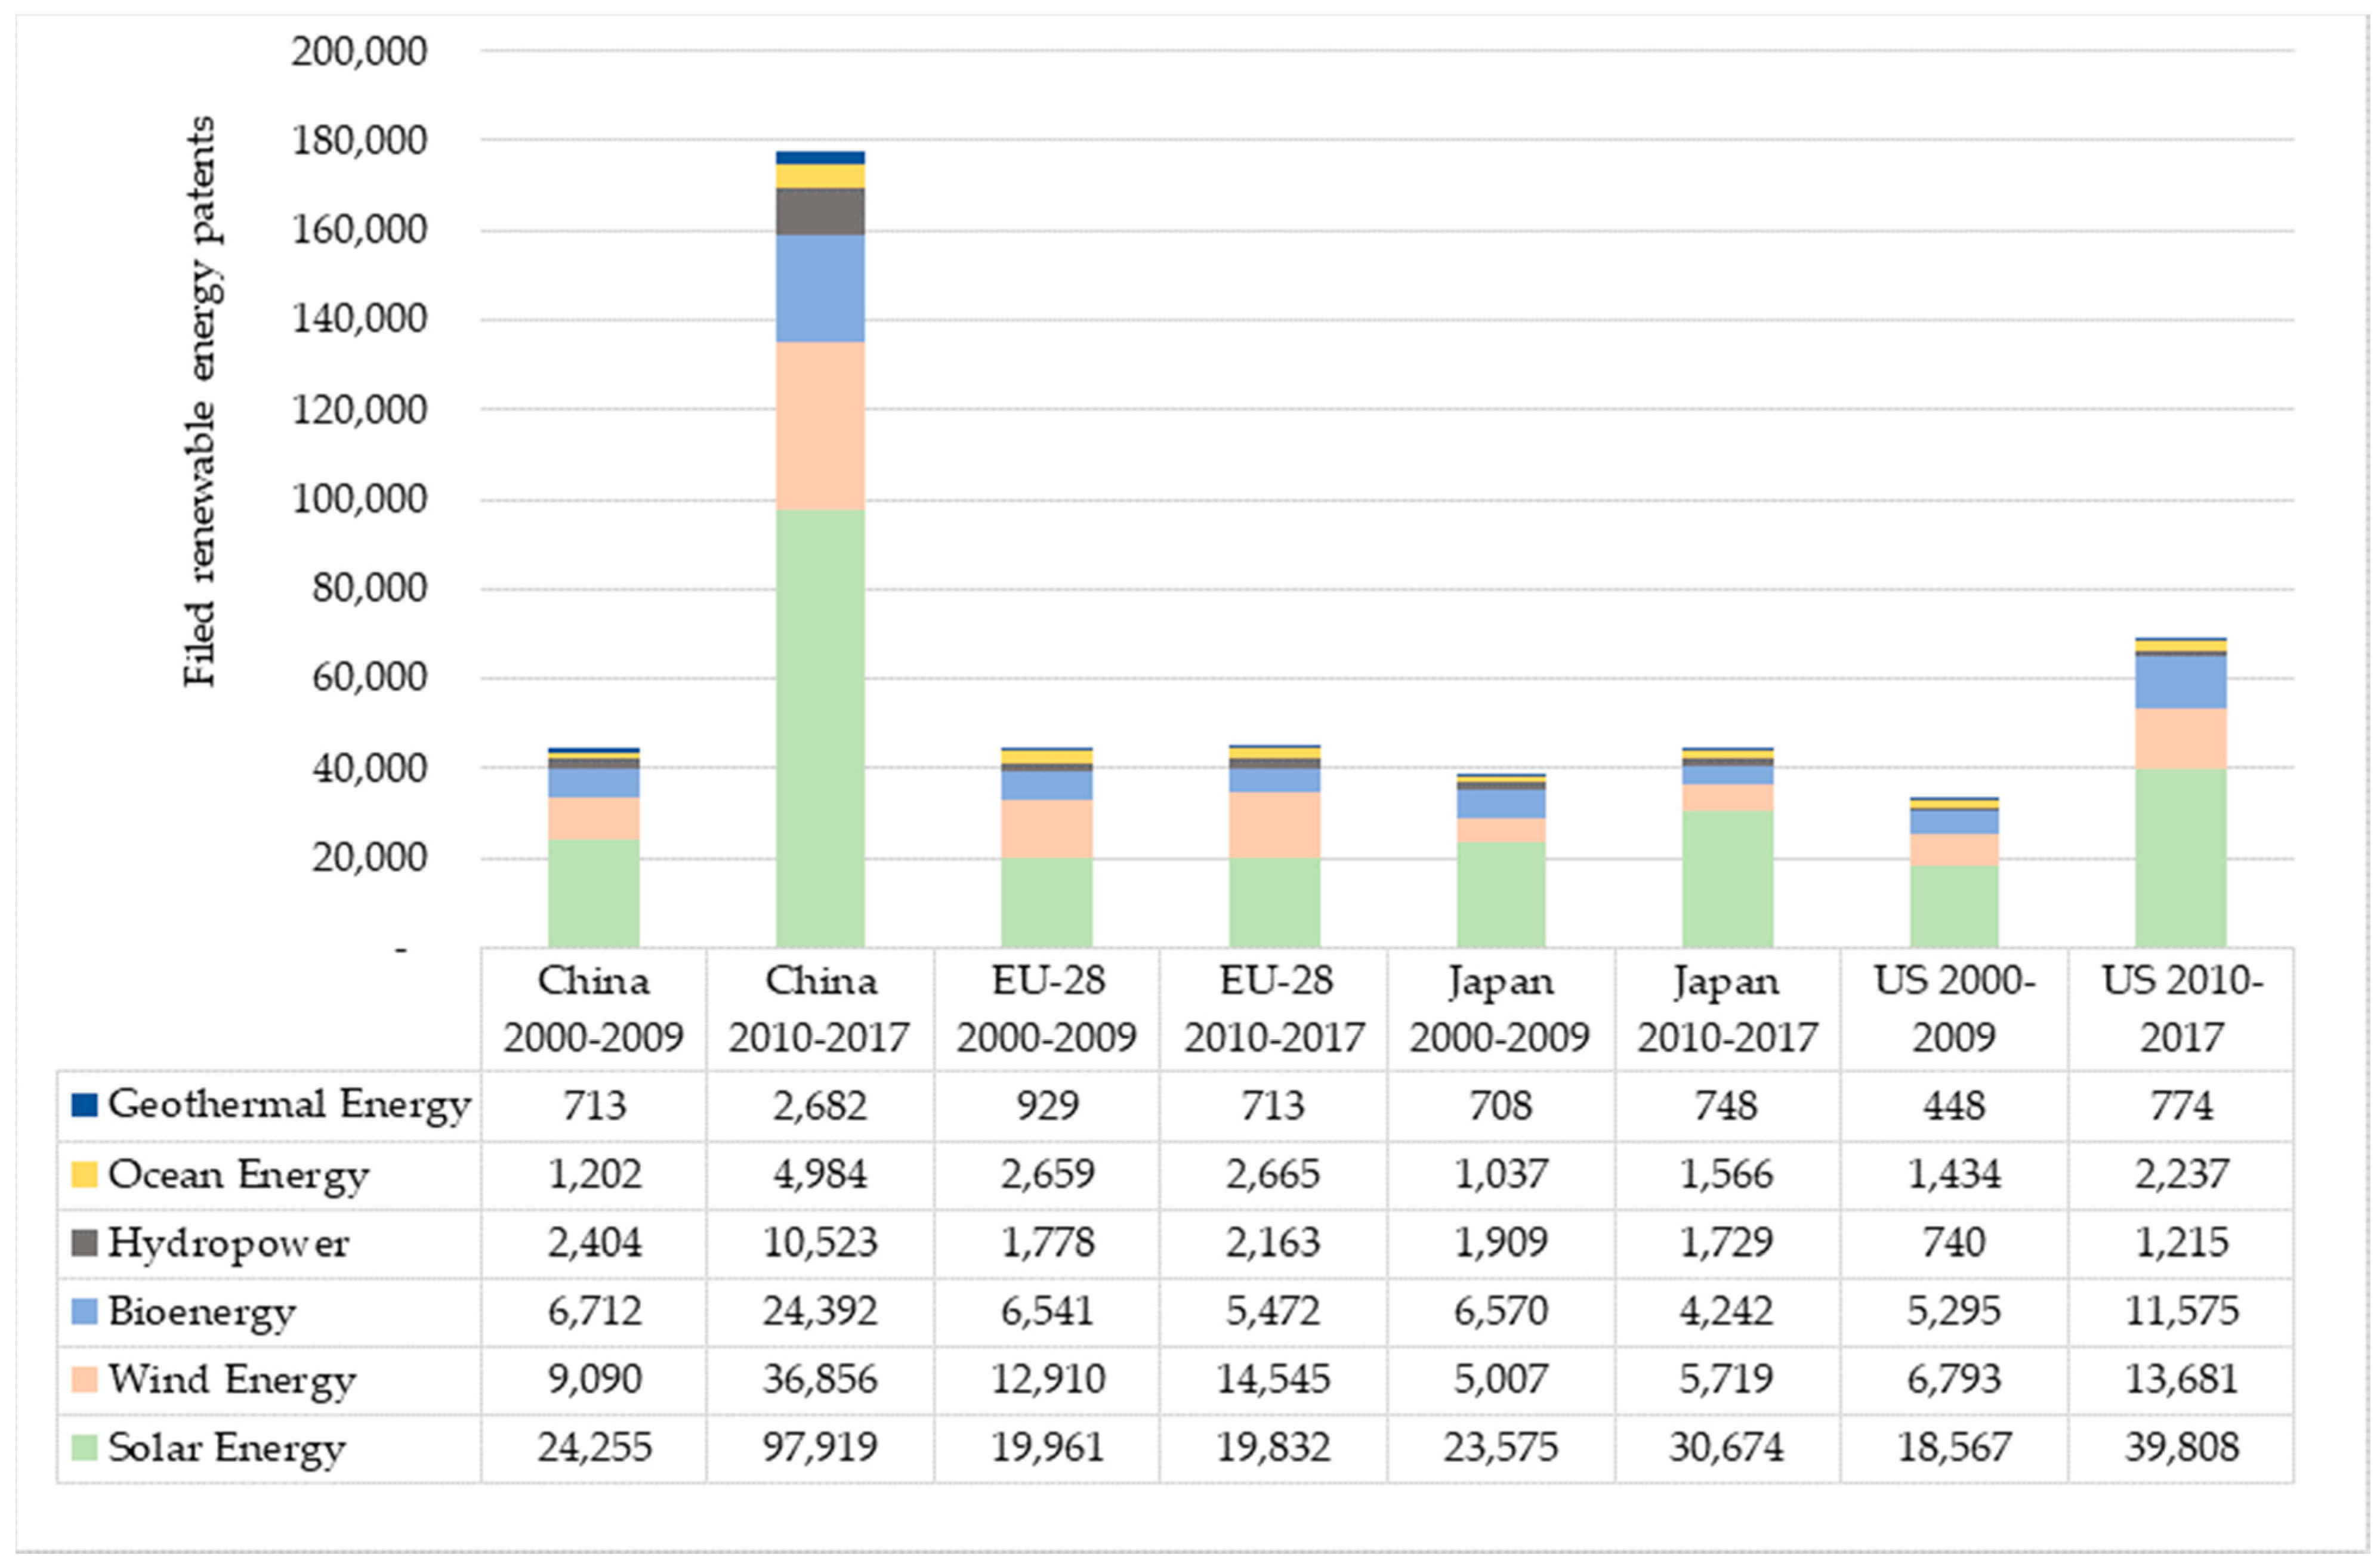
As
Figure 5 displays, especially during the period 2010–2017, a strong increase occurred in filed renewable energy patents in China, particularly in the field of wind, solar and bioenergy. Lam et al. [
76] point out that although the amount of patent applications in China is high, only a few were granted by foreign or international patent offices. In a recent study by Elsevier [
77], it was shown that in 2020, 320,000 clean energy patents out of 362,000 patents in China were active only in its national market. Thus, the value of the Chinese patent portfolio is smaller than that of inventor countries, with a broader geographical patent validity. However, the vast increase and size of patent applications, clearly shows China’s increased role in new technology development.
5. Conclusions
The structural problems of fossil fuel-based wealth and power, namely, import dependence on fossil fuels together with the scarcity of fossil fuels and environmental degradation, created a material condition for all economies, China and the EU in particular, to move gradually towards a RE based economy and society. This study focused on comparing China’s efforts regarding the development of new RE technologies with those of the European Union. For this purpose, we have collected information and data from literature sources and databases and conducted a comparison and analysis for the following indicators: development of renewable electricity generation and capacity, demonstration projects and companies/countries involved, public and private investments in R&D and research projects and patent applications. Furthermore, we reviewed the difference in energy strategy in EU and China.
It was found that China’s industrial policy has spurred rapid growth in companies producing RE technologies. China has become the biggest player for mainstream renewable electricity (especially hydropower and solar PV). As for wind energy, EU and Chinese electricity output was roughly equal in 2020. The main developments in China occurred in the 2010s, while the EU was a frontrunner in the 2000s. For the newer or less mainstream technologies (geothermal, solar thermal, wave/tidal), the application in China remains low compared to the EU, with the exception of floating solar, where China is a lead player.
These trends are reflected in data on investments in renewable energy capacity, which showed considerable Chinese investment levels during the 2010s, while European investments dominated during the 2000s. It must be noted that data for investments in R&D were very limited for China, which hampered the comparison to EU countries. However, patent data gave an indication of R&D efforts. Data on patent applications reflected strong growth in China in recent years, whereas for most countries, such applications decreased after 2012. Patent applications in China have remained on the increase since 2010, and the country maintains the highest volume of applications, particularly in the field of solar energy. Although the amount of patents in China is very high, only a small share is valid internationally. This reduces the value per patent compared to countries with a higher share of internationally valid patents. However, the vast increase in patent applications clearly shows China’s growing role in new technology development.
We can conclude from our findings that despite having arrived slightly later in the renewable energy sector compared to the EU, China has emerged as a big player in mainstream renewable energy technologies (solar PV, hydropower and wind) and therefore energy transition over the last decade. Owing to this development is China’s industrial policy and prioritisation of effectiveness over cost efficiency. Regarding new renewable energy technologies, China is predominantly involved in solar energy and, in comparison to the EU, is less involved in other new technologies (e.g., binary geothermal systems and ocean energy).
This study made a comparison of China and EUs role in a global context. The value mainly lies in the collection, combination and reviewing of data from different literature sources and databases in order to generate an overall picture. For future research, it is important to look in more detail at the technology level and to include more information for China in terms of investments in R&D. For the latter, searching both in the English and Chinese language did not give many results. A different data collection method could be adopted, such as interviews or surveys. In terms of technology level data, it is important to focus more on details of demonstration projects and the involvement of Chinese and EU actors in these. Lastly, the data on patent applications could be studied in more detail to assess international validity and the degree of innovativeness of patents.


