Abstract
A printed circuit heat exchanger (PCHE) is utilized to cool the compressor inlet air to increase the compression efficiency in a liquid air energy storage and liquid natural gas (LNG) coupled system, which can offer large-scale energy storage with significantly improved exergy efficiency and round-trip efficiency. In this work, the effect of pressure of air, incline angle, and hydraulic diameter on the performance of a compressed air–water PCHE with a semicircle cross-section was studied. The results show that PCHE can realize the intermediate cooling of air compression in the liquid air energy storage system, and the pressure variation of air shows a limited effect on the heat transfer of PCHE; however, the hydraulic diameter and the incline angle both affect the heat transfer and the flow resistance of PCHE, and the best incline angle is 15°.
1. Introduction
The power generation capacity of renewable energy sources, such as solar and wind, is increasing rapidly to solve the carbon-related environmental problems. However, the power generation with most renewable energy is strongly affected by weather patterns and day/night cycle, having a significant impact on the electrical power grid. Therefore, energy storage technology which can solve the unstable nature of renewable energy is attracting particular attention.
Electromechanical and thermal storage are widely used for large-scale energy storage. Liquid air energy storage (LAES) is one of the few mechanical storage technologies which can offer large-scale storage without geographical restrictions. This technology can be extended extensively since it has the advantages of high reliability, flexible layout, low internal energy, high exergy, etc.
However, it should be noted that these systems have relatively low round-trip efficiency and a considerable capital cost, and they are only considered to be cost-efficient when the electricity price difference between on-peak and off-peak reaches double or even triple [1,2], or there is another cryogenic source that can be used for air liquefaction, such as the liquid natural gas (LNG). LNG (−161.5 °C, 0.1 MPa) which is the liquid phase of natural gas, and it is estimated that LNG trade will increase by 300% in the next 30 years. The liquefaction process of LNG consumes a large amount of energy, but the gasification of LNG is generally achieved without energy recovery, leading to the waste of cold energy from LNG [3].
In order to improve the efficiency of LAES, Park et al. [4] proposed a combined system of LAES and LNG gasification, called the LNG–LAES. In this system, the LNG cold energy is transferred to the air and stores the excess electricity energy from power grid at off-peak times, and the LNG cold energy and stored liquid air generate electricity at on-peak times. Moreover, many other studies have proven the extremely high exergy efficiency and round-trip efficiency of this complicated system.
In the LNG–LAES system, the air is compressed through multiple stages, and then exchanges heat with LNG or other cold energy storage medium, before being successfully liquified [5]. Commonly, to increase the compression efficiency of the compressor, a heat exchanger is mounted between each stage of the compressor to cool the inlet air and improve the compressor efficiency. In this study, a PCHE is utilized for the first time to cool the compressor inlet air, considering that the traditional shell and tube heat exchanger cannot meet the requirements of the small footprint characteristic of the liquid air energy storage system.
Recently, PCHE has been extensively used in areas requiring efficient heat transfer. It was invented by Sydney University, and it is used in refrigeration and the oil chemical industry. Its channel is generated through photochemical etching, and its module is made through welding. The diameter of the channel is between 0.5 and 2 mm with the heat exchange area per unit volume reaching 2500 m2/m3. In the same heat transfer conditions, the volume of the PCHE is smaller than the traditional shell and tube heat exchanger by 85% [6]. Natesan et al. [7] compared the heat transfer areas of the PCHE and shell-and-tube heat exchanger. It is found that the volume of PCHE was 1/30 of shell-and-tube heat exchanger with bare tubes and 1/5 of shell-and-tube heat exchanger with internally and externally finned tubes [8]. Moreover, the strength of welding spot was close to the parent metal when the diffusion welding was adopted. Therefore, PCHE can withstand temperatures as high as 900 °C and pressures as high as 60 MPa [6], and it is suitable for use in the area of high-pressure fluid heat transfer.
Many researchers have investigated the thermal–hydraulic performance of PCHE. Yang et al. [9] experimentally studied the flow and heat transfer characteristics of S-CO2 in a rhombic fin channel, and they found that the rhombic fin channel can realize the heat transfer rate per unit volume equivalent to a zigzag channel with relatively low pressure drops. Wang et al. [10] obtained the heat transfer and flow characteristics of straight-type rectangular channels with different widths using numerical methods. Baik et al. [11] reported that the thermal performance of the wavy channel is significantly higher than that of the corresponding straight channel. Zhang et al. [12] numerically investigated the effects of pressure, mass flux, heat flux, and tube geometry on the heat transfer characteristics of S-CO2 heated in a horizontal semicircular microtube, and the variations of thermophysical properties in the pseudocritical region have significant effects on heat transfer mechanisms. Ngo et al. [13] numerically studied the heat transfer characteristics of S-CO2 in an S-shaped fin configuration PCHE. Results indicated that the pressure drop of the CO2 side of the S-shaped PCHE was decreased by 37%, and the pressure drop of the water side was decreased by 90%. Tsuzuki et al. [14] numerically studied the characteristics of fin configuration and angle of the S-shaped PCHE. The pressure loss of the optimized structure was only 1/5 of the traditional zigzag channel but presented the same thermal–dynamic performance. Lee and Kim [15] optimized the angle of the zigzag channel and ellipse aspect ratio using a numerical method. Aneesh et al. [16] reported that the trapezoidal wavy channel had the highest heat transfer with the largest pressure drop compared to sinusoidal, triangular, and straight channels, and the heat transfer rate of the trapezoidal wavy channel was about 41% higher than that of the straight channel. Xu et al. [17] found that a staggered arrangement of airfoil wings showed good thermal–hydraulic characteristics. Kim et al. [18] studied the effect of incline angle, pitch length, and hydraulic diameter on the thermal–hydraulic characteristics of He in zigzag channels. Results showed that Nusselt number and Fanning factor increased with the angle, while the pitch length and thermal–hydraulic diameter played a significant role in the performance. Lee and Kim [19] researched the effect of S-CO2 in four different channels with semicircular, rectangular, trapezoidal, and circular cross-sections, as well as their channel combinations, on PCHE performance. It was found that the hydraulic characteristics of the rectangular channel were the worst, and the heat transfer of the circular channel was the worst. The channel angle and semi-ellipse aspect ratio were also estimated, and results showed that the heat transfer efficiency was the highest when the incline angles on the two sides were the same. Zhao et al. [20,21,22,23] carried out a succession of experiments and simulations on the performance of cross-flow PCHEs. For safety reasons, liquid nitrogen was used in their experiments instead of LNG as the cold fluid, while R22 was selected as the hot fluid. Bai et al. [24] analyzed the effects of pressure and heat flux on the performance of a sinusoidal channel LNG vaporizer. Therefore, the geometrical parameter and the operation parameter both have an important impact on PCHE performance.
However, previous studies mainly focused on S-CO2, He, LNG, etc., as well as the effect of different types of fin channel, wavy profile, and cross-section shape on the flow and heat transfer characteristics. Few scholars investigated the heat transfer performance of compressed air and water in PCHE, while the compressed air–water heat exchanger is an important component in the LNG–LAES system. Thus, the compressed air–water PCHE was studied in this study, and the effects of air pressure, incline angle, and hydraulic diameter on the heat transfer and resistance characteristics were analyzed in a zigzag channel with a semicircular cross-section. This study is expected to provide a basis for the design of the compressed air–water heat exchanger in the LNG–LAES system.
2. Physical Model and Computational Method
2.1. Physical Model and Boundary Condition
The PCHE with a zigzag channel was used to disturb fluid flow and enhance heat transfer. The zigzag channel studied in present study is shown in Figure 1. The photochemical etching plates were stacked together to generate the flow channel. Considering the periodic characteristics of PCHE, this work selected a pair of cold and hot flow channel and the corresponding solid plate for modeling.
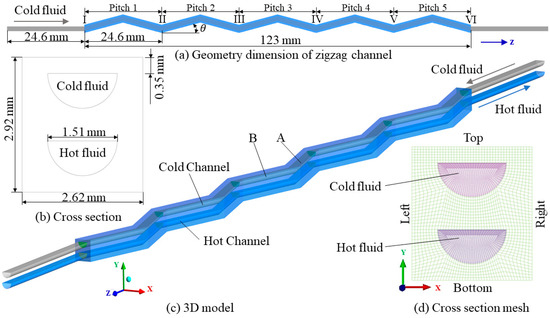
Figure 1.
Diagram of the zigzag channel and cross-section mesh system.
The hot and cold plates were identical, and the channels were both semicircular; diameters of 1.51 mm and 1.8 mm were chosen to explore the effect of semicircular diameter. The thickness of the plate was 1.46 mm. The pitch of channel in the cross-section and flow direction was 2.62 mm and 24.6 mm, respectively. The top and bottom surfaces were defined as periodic boundaries, as well as the left and right surfaces. There were five pitches in flow direction of PCHE with the length of 123 mm. The present study investigated the flow and heat transfer characteristics of the heat exchanger at four incline angles: 0°, 15°, 30°, and 45°. To provide a uniform inlet flow rate and avoid backflow at the outlet, a straight channel with a pitch length was added at the inlet and outlet, respectively. The mass flow rate and average temperature were set for the inlets of cold and hot fluids. The channel surfaces at the front and back were set to be adiabatic. The hot fluid was compressed air with different pressures, and the cold fluid was water. All the inlet parameters of the working fluid were from Park’s study [5]. The property parameters of the two fluids were all related to the temperature and were derived from REFPROP 9.1. (Gaithersburg, MD, USA) [25].
2.2. Numerical Method
This work was conducted with the commercial software of ANSYS FLUENT 14.5 (Pittsburgh, PA, USA). It was assumed that the flow in present heat exchanger in calculation is 3D, laminar, incompressible, and steady. The governing equations contain the continuity conservation, momentum conservation and energy conservation, which are expressed as follows [6]:
The governing equations were solved using the finite volume method. The pressure and velocity coupling was addressed using the SIMPLEC algorithm. The criterion of convergence is that the residuals of each variable were smaller than 10−6. The calculation equations regarding the flow and heat transfer parameters are as follows [6]:
where the thermal properties of the working fluid could be determined with the average temperature of the working fluid in each pitch, and u is the average velocity calculated through averaging the thermal property parameters. The inlet and outlet temperatures are the mass-weighted average temperature. The heat flow qw and temperature of the surface Tw are derived from the surface area and weight [26]. Dh is the hydraulic diameter of the channel.
The local Fanning friction factor is defined as follows:
where indicate the overall pressure drop in each pitch, frication pressure drops, and acceleration pressure drop, respectively. , are the density of the inlet and outlet working fluids, respectively. , are the inlet and outlet velocity, respectively. Lp is the flow channel length.
Commonly, a higher incline angle of the wavy channel results in a higher heat transfer coefficient and flow resistance. To comprehensively evaluate the performance of the heat exchanger, a factor is defined as a comprehensive indicator of the heat exchanger [27].
2.3. Simulation Conditions
In the system (Figure 2) proposed by Park [5], the four stages of compressed air shown in Table 1 are all cooled by seawater (15 °C, 0.1013 MPa) to improve the compressor efficiency. Finally, the compressed air liquified by the cold energy is released in LNG gasification at off-peak times, while the liquified air converts to gas and generates power in the turbine through expansion at on-peak times. Obviously, this system can capture and store the cold energy released from LNG gasification at on-peak times and utilize the stored cold energy to store electricity at off-peak times.
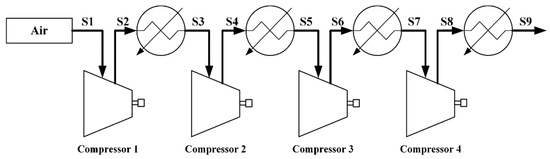
Figure 2.
The four stages of the air compression process in Park’s system.

Table 1.
The parameters of the four stages of the air compression process [5].
2.4. Grid Independence Test and Model Validation
The grid quality has a significant effect on the numerical simulation. The present study adopted the block grid division technology to divide the grid of the wavy channel. To model the heat convection accurately and capture the flow and heat transfer characteristics in the boundary layer, the boundary grid was set close to the surface of the wavy channel. For the first-level grid node, y+ < 1, 10 levels were set along vertical wall surface, and the increment was 1.15 for each level.
The grid independence test was carried out for the baseline channel with an incline angle of 15°. The grid number for Grid 1, Grid 2, and Grid 3 was 1.51 million, 2.21 million, and 2.64 million, respectively, and the deviations were defined as follows:
Table 2 shows the deviations of temperature difference and pressure drop across different grid systems. It can be seen that the deviation between Grid 2 and Grid 3 was less than that between Grid 1 and Grid 3; thus, Grid 2 was selected for accuracy and time saving.
Table 2.
Grid independent test.
Due to the lack of experimental data of heat transfer between compressed air and water, the results from Kim’s experiment [28] on supercritical pressure air and natural gas in cryogenic PCHE were used to validate the simulation model. The relative errors were derived as follows:
Table 3 shows the comparison between experimental data and numerical results. It can be seen that the relative errors of the temperature differences were less than 1%, and the pressure differences of the cold and hot sides were 11.52% and 10.69%, respectively. The reason for the pressure drop gaps between the simulation and experiment could be the friction losses and header losses at the inlet and outlet, which could account for 13.57% of the total measured pressure drop [28]. Therefore, the reliability and accuracy of the proposed model were validated.
Table 3.
Comparison between experimental and numerical data.
3. Results and Discussion
3.1. The Characteristics of Internal Flow and Heat Transfer
Figure 3 shows the distribution of temperature difference between the hot and cold fluids along the cold flow direction in the heat exchanger. It can be seen that the five-pitch wavy channel met the cooling requirements of hot fluid. In addition, the heat transfer process between compressed air and water under different pressures was similar, but the outlet temperature of the cold fluid slightly increased with the increased pressure of the hot fluid. This is because the specific heat capacity and the heat released from the hot fluid increased. Consequently, the cold fluid with the same flow rate and inlet temperature was heated to higher temperature.
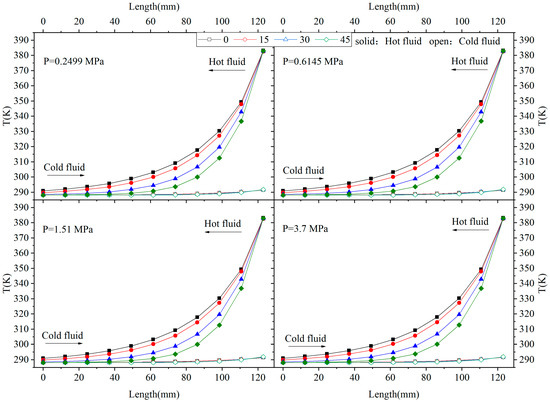
Figure 3.
Temperature distribution of the countercurrent flow.
Moreover, the heat transfer coefficient increased with the increase in incline angle at the same hot fluid pressure, and the outlet temperature of the hot fluid gradually decreased. Especially when , the temperature of the hot fluid almost decreased to be the same with the inlet temperature of the cold fluid. The reason is that, when , the overall heat transfer coefficient was the maximum, and the temperature of the hot fluid declined rapidly. After the heat transfer process in four pitches, the temperature was reduced to be close to the inlet temperature of the cold fluid. In the fifth pitch, the temperature of the hot fluid was almost the same as that of the cold fluid. It should be noted that the temperature of the cold fluid increased slightly in all conditions since the specific heat capacity of water is much bigger than that of air.
It is well known that there a flow boundary layer will be formed near the channel wall when the fluid flows in the channel, and the flow velocity in the channel central area will increase to compensate for the velocity reduction near the channel wall. Figure 4 and Figure 5 show the velocity and temperature distribution of different cross-sections along the flow direction. It can be seen that the accelerating core of the straight channel was always located in the central area of the channel. However, for the wavy channel, the flow direction in the channel changed periodically, and the location of the accelerating core moved from the center to the external surface due to the centrifugal force. Moreover, the deviation effect and the centrifugal force were more significant as the incline angle increased. The accelerating core struck the wall periodically, which could reduce and even destroy the boundary layer. The collision and destructive effects were stronger as the incline angle increased, which promoted convection heat transfer. Furthermore, it can be seen from the figure that, with increasing incline angle, the acceleration core area gradually expanded. The reason is that large incline angle led to strong centrifugal force and more significant flow separation at the bend, and then the gradual enlargement of the extremely-low-speed area in the cross-section. The temperature and velocity distributions in the channel presented similar behavior. Specifically, the low-temperature area of the cold fluid and the high-temperature area of the hot fluid matched the results of the accelerating core in the channel, reflecting that the flow temperature distribution in the channel depends on its velocity distribution.
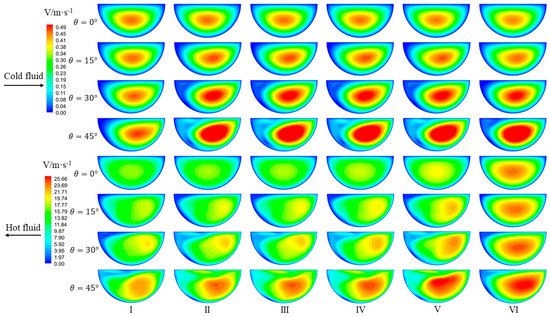
Figure 4.
Velocity distribution of different cross-sections along the flow direction.
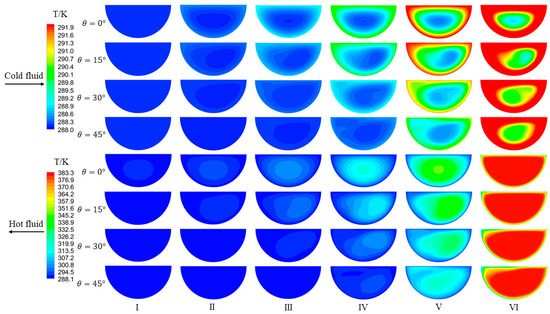
Figure 5.
Temperature distribution of different cross-sections along the flow direction.
It is well known that a regular associated movement named secondary flow can be generated when the viscous fluid moves along a wavy channel at a fixed main flow velocity. The secondary flow in the wavy channel is mainly named the Dean vortex, which is a pair of antisymmetric vortices generated due to the centrifugal force when incompressible fluid flows in the wavy channel. The Dean vortex can significantly promote the heat transfer due to the convection and shear function in the fluid flow [29]. In addition, the secondary flow at different cross-sections is distributed similarly at the same incline angle, leading to a similar distribution of the accelerating core.
Figure 6 shows the secondary flow of different cross-sections. It can be seen that the Dean vortex appeared in several cross-sections except for the inlet cross-sections of the cold and hot fluids. The distributions of the Dean vortex at different incline angles were different. For the cold fluid, since the speed was low, at the incline angle of 15°, the core of the Dean vortex was almost located symmetrically at the upper and lower regions of the semicircle channel. At the bending angle of 30°, the vortex core expanded outward. When the incline angle increased to 45°, the vortex core expanded outward dramatically. However, for the hot fluid, the vortex core showed the most significant expansion when the incline angle was 15°. With increasing incline angle, the expansion of the vortex core weakened.
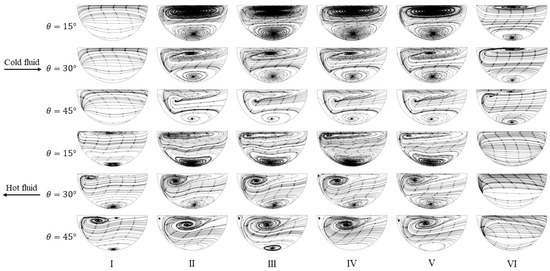
Figure 6.
Secondary flow of different cross-sections along the flow direction.
Compared with the flow in the straight channel, the combination of flow acceleration and secondary flow resulted in significantly different vortices. For example, for cross-section I of the cold fluid and cross-section VI of the hot fluid, no vortex appeared, and the streamline flowed to the right side. This is because the water just flowed from the inlet of the PCHE to the wavy channel through the straight channel. On the other cross-sections, a negative vortex appeared on the upper zone, and a positive vortex appeared on the lower zone. Furthermore, the secondary flow on the cross-section varied regularly with the increases in incline angle = 0°.
Figure 7 displays the pressure distribution along the flow direction. The hot fluid at different pressures showed similar resistance characteristics when the incline angle of the wavy channel remained the same. From the pressure variation profile of the hot fluid at different incline angles, it can be found that the pressure drops increased with the incline angle. The reason is that, at the same mass flow rate, low air pressure resulted in low air density and high velocity, thereby leading to great pressure drops in the channel. In addition, the flow separation phenomenon and pressure drop became more significant with increasing incline angle.
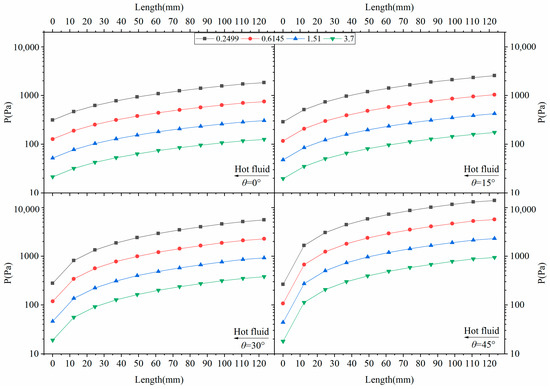
Figure 7.
Resistance characteristics of the hot fluid.
3.2. Effect of Hydraulic Diameter on the Performance of PCHE
As can be seen in Figure 8, the hot fluid temperature distribution of the two wavy channels with different diameters was similar, and the temperature decreased more quickly with increasing incline angle. Moreover, the temperature decline rate of the channel with d = 1.51 mm was larger than that of the channel with d = 1.8 mm under the same incline angle, and the outlet temperature of the channel with d = 1.8 mm was higher than that of the channel with d = 1.51 mm. This indicates that the overall heat transfer characteristics of the channel with d = 1.51 mm were better than those of the channel with d = 1.8 mm.
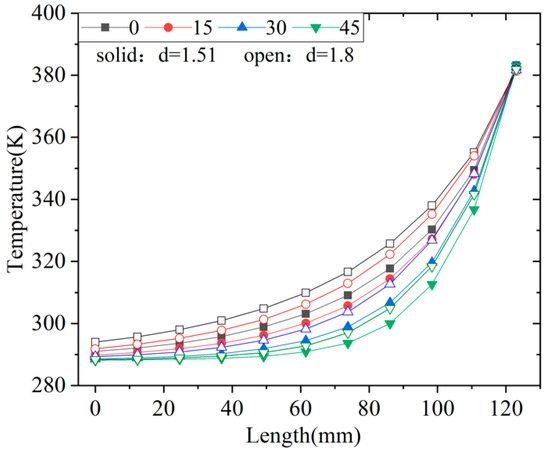
Figure 8.
Temperature distribution of hot fluid with different channel diameter.
Figure 9 shows the Nu distribution of hot fluid in the channels with different diameters. Table 4 shows the average Nu and total pressure drop of hot fluid. It can be seen from Figure 9 that, when the incline angle of the wavy channel was equal to 0° and 15°, the Nu in the channel with d = 1.51 mm was larger than that of the channel with d = 1.8 mm. When the incline angle was 30°, the Nu of the two channels was almost the same. However, when the incline angle was 45°, except for the first pitch, Nu in the channel with d = 1.8 mm was larger than that with d = 1.51 mm. This result indicates that, when the incline angle was small, the small-diameter channel showed better heat transfer performance. In addition, the total pressure drops in the channel with d = 1.51 was larger than that with d = 1.8, as shown in Table 4.
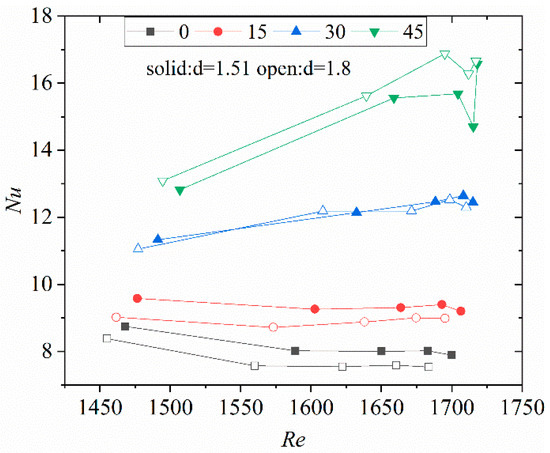
Figure 9.
Nu number of hot fluids vs. Re.
Table 4.
Average Nu and pressure drop of hot fluid.
3.3. Local Heat Transfer Behavior of PCHE
Figure 10 shows the streamline, velocity, and heat flux distributions of the third pitch on the cold flow side. The flow direction was from bottom to top. It can be seen that the flow in the channel was nonuniform with strong disturbance due to the change in the flow direction. Moreover, separation flow can be seen at the bend. This phenomenon was also verified by the velocity distribution along flow direction, as shown in Figure 10b. In the figure, it can be found that reverse flow existed outside and downstream of the bend. The reason may be that the adverse pressure gradient near the bend caused separated flow and reverse flow. The reverse flow in the channel could have increased the flow resistance. From Figure 10c, it can be seen that the heat flux distribution was nonuniform at the bend. The maximum heat flux appeared downstream of the bend, and its value at outside of the wavy channel was much higher than that inside of the channel. Combining Figure 10b,c, it can be concluded that, in the zone with high flow speed, the heat transfer was strong, and the heat flux was high.
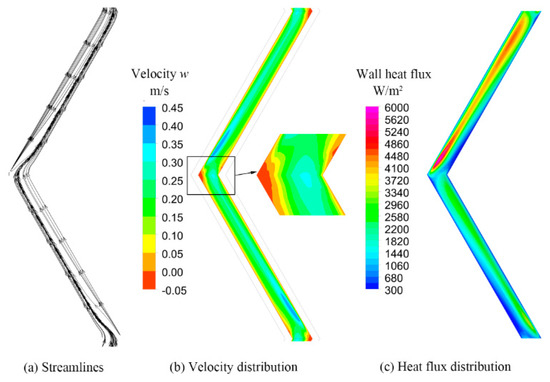
Figure 10.
Flow and heat flux distribution of hot side in the third pitch.
Figure 11 shows the heat flux distribution in different pitches. The first and last pitch were removed to avoid the entrance effect. It can be seen that along the flow direction, the heat flux in each pitch gradually decreased. This is because the temperature of the hot fluid gradually decreased along the flow direction and the corresponding thermal conduction of the fluid also varied. At the same pressure, the heat flux in each pitch decreased quickly when the angle increased. It can also be seen that the change in flow direction dramatically affected the distribution of the heat flux in each pitch. The present work divided each pitch into four equal parts and detailed the heat flux distribution on the wall of each pitch for the hot fluid. It was found that the heat flux of Ci and Ei in each pitch was higher than that of Di and Fi. This was due to Ci and Ei being located just downstream the bend, while Di and Fi were always in the straight channel. This demonstrates that, in the wavy channel, the heat flux increased when the flow direction changed. This result is consistent with the conclusion derived by Sharma [29].
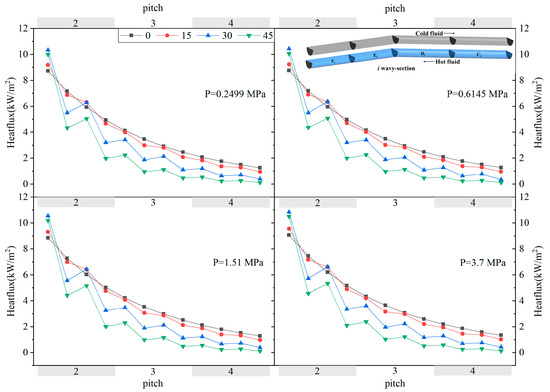
Figure 11.
The heat flux distribution of hot fluid.
Additionally, it was found that, along the hot fluid flow direction, the heat flux of the straight channel smoothly decreased, but the heat flux of the wavy channel showed a different trend. As seen in the figure, the heat flux of Ei was greater than that of Di, and the difference between the maxima and minima of the heat flux was smaller when the angle was smaller. This also confirms the conclusion that the flow direction changes in the wavy channel can enhance the heat transfer.
3.4. The Comprehensive Performance of the Wavy Channel
It is well known that heat transfer in the wavy channel is more remarkable than that in the straight channel, but the frictional loss is also great. When the wavy channel incline angle increases, the heat transfer is enhanced while the pressure loss also increases correspondingly. Therefore, it is not comprehensive to evaluate the performance of the heat exchanger solely as a function of the heat transfer or flow resistance characteristics. In this study, a factor named was adopted from the literature to estimate the comprehensive performance of the air–water PCHE heat exchanger at different incline angles [27].
Figure 12 displays the Nusselt number and Fanning friction factor of the hot fluid channel versus channel bending angle. It can be seen that the effects of pressure variation of hot fluid on Nu and f were similar, and Nu and f all increased with the increase in bending angle. When the bending angle increased from 0° to 15°, Nu increased significantly but f increased slightly, indicating that the bending angle was the main factor influencing the heat transfer. When the bending angle increased from 30° to 45°, the rising slope of the Fanning friction factor was greater than that of Nu. The reason is that the flow separation increased with increasing incline angle, resulting in a rapid increase in the resistance. The values of the integrated factor at different angles are listed in Table 5. It can be seen that the heat exchanger exhibited the best performance when the bending angle was 15°.
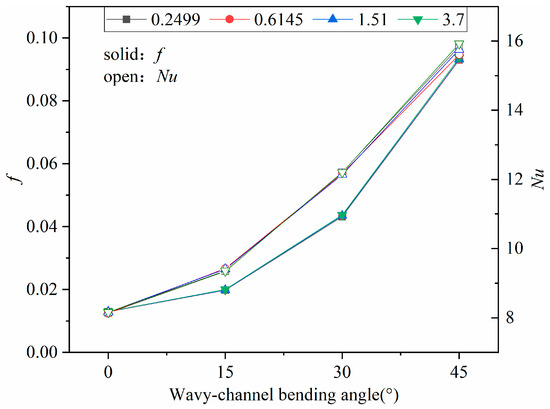
Figure 12.
Nu and Fanning factor of the hot fluid channel.
Table 5.
Comprehensive factor at different angles.
4. Conclusions
This work adopted a 3D simulation method to study the feasibility of adopting PCHE in the cooling process of four-stage air compression in the LNG–LAES system. The model was first validated by comparing numerical results with available experimental data; then, the effects of bending angle, air pressure, and hydraulic diameter of the PCHE heat exchanger on the heat transfer and flow resistance were analyzed, and the optimal angle was obtained by comprehensive performance criterion of the wavy channel. The main conclusions are as follows:
- It is feasible to adopt PCHE to realize the intermediate cooling of compressed air in the LNG–LAES system. The hydraulic diameter influenced the heat transfer performance of the wavy channel, and the heat flux increased when the flow direction changes.
- The pressure variation of air had a limited effect on PCHE heat transfer. The temperature distributions of the cold and hot fluids were almost the same for the four-stage intercooled heat exchanger, but the flow resistance distribution showed a great difference; a higher air pressure led to a smaller flow resistance.
- The incline angle had a significant effect on heat transfer and flow resistance. The best performance in terms of heat transfer and resistance was realized when the bending angle was 15° in this study.
Author Contributions
Conceptualization, H.L. and P.Y.; data curation, Y.Z.; formal analysis, H.L., Y.Z., and P.Y.; investigation, Y.Z.; methodology, H.L. and P.Y.; resources, Y.Z.; software, Y.Z. and J.X.; supervision, D.C.; validation, H.L. and P.Y.; writing—original draft, H.L.; writing—review and editing, H.L., L.Z. and Y.Z. All authors have read and agreed to the published version of the manuscript.
Funding
This research was funded by the Science and Technology Plan Program of Yulin, grant number CXY-2021-119.
Institutional Review Board Statement
Not applicable.
Informed Consent Statement
Not applicable.
Data Availability Statement
Not applicable.
Conflicts of Interest
The authors declare no conflict of interest.
References
- Qi, M.; Park, J.; Kim, J.; Lee, I.; Moon, I. Advanced integration of LNG regasification power plant with liquid air energy storage: Enhancements in flexibility, safety, and power generation. Appl. Energy 2020, 269, 115049. [Google Scholar] [CrossRef]
- She, X.; Zhang, T.; Cong, L.; Peng, X.; Li, C.; Luo, Y.; Ding, Y. Flexible integration of liquid air energy storage with liquefied natural gas regasification for power generation enhancement. Appl. Energy 2019, 251, 113355. [Google Scholar] [CrossRef]
- Park, J.; Lee, I.; Moon, I. A Novel Design of LNG Regasification Power Plant Integrated with Cryogenic Energy Storage System. Ind. Eng. Chem. Res. 2017, 56, 1288–1296. [Google Scholar] [CrossRef]
- Lee, I.; Park, J.; Moon, I. Conceptual design and exergy analysis of combined cryogenic energy storage and LNG regasification processes: Cold and power integration. Energy 2017, 140, 106–115. [Google Scholar] [CrossRef]
- Park, J.; You, F.; Cho, H.; Lee, I.; Moon, I. Novel massive thermal energy storage system for liquefied natural gas cold energy recovery. Energy 2020, 195, 117022. [Google Scholar] [CrossRef]
- Ma, T.; Li, L.; Xu, X.-Y.; Chen, Y.-T.; Wang, Q.-W. Study on local thermal–hydraulic performance and optimization of zigzag-type printed circuit heat exchanger at high temperature. Energy Convers. Manag. 2015, 104, 55–66. [Google Scholar] [CrossRef]
- Natesan, K.; Moisseytsev, A.; Majumdar, S. Preliminary issues associated with the next generation nuclear plant intermediate heat exchanger design. J. Nucl. Mater. 2009, 392, 307–315. [Google Scholar] [CrossRef]
- Saeed, M.; Kim, M.-H. Thermal and hydraulic performance of SCO2 PCHE with different fin configurations. Appl. Therm. Eng. 2017, 127, 975–985. [Google Scholar] [CrossRef]
- Yang, Y.; Li, H.; Xie, B.; Zhang, L.; Zhang, Y. Experimental study of the flow and heat transfer performance of a PCHE with rhombic fin channels. Energy Convers. Manag. 2022, 254, 115137. [Google Scholar] [CrossRef]
- Wang, Q.; Xu, B.; Huang, X.; Chen, Q.; Wang, H. Heat transfer and flow characteristics of straight-type PCHEs with rectangular channels of different widths. Nucl. Eng. Des. 2022, 391, 111734. [Google Scholar] [CrossRef]
- Baik, Y.-J.; Jeon, S.; Kim, B.; Jeon, D.; Byon, C. Heat transfer performance of wavy-channeled PCHEs and the effects of waviness factors. Int. J. Heat Mass Transf. 2017, 114, 809–815. [Google Scholar] [CrossRef]
- Zhang, Y.; Peng, M.; Xia, G.; Cong, T. Numerical investigation on local heat transfer characteristics of S-CO2 in horizontal semicircular microtube. Appl. Therm. Eng. 2019, 154, 380–392. [Google Scholar] [CrossRef]
- Ngo, T.L.; Kato, Y.; Nikitin, K.; Ishizuka, T. Heat transfer and pressure drop correlations of microchannel heat exchangers with S-shaped and zigzag fins for carbon dioxide cycles. Exp. Therm. Fluid Sci. 2007, 32, 560–570. [Google Scholar] [CrossRef]
- Tsuzuki, N.; Kato, Y.; Nikitin, K.; Ishizuka, T. Advanced Microchannel Heat Exchanger with S-shaped Fins. J. Nucl. Sci. Technol. 2009, 46, 403–412. [Google Scholar] [CrossRef]
- Lee, S.-M.; Kim, K.-Y. Optimization of zigzag flow channels of a printed circuit heat exchanger for nuclear power plant application. J. Nucl. Sci. Technol. 2012, 49, 343–351. [Google Scholar] [CrossRef]
- Aneesh, A.M.; Sharma, A.; Srivastava, A.; Chaudhury, P. Effects of wavy channel configurations on thermal-hydraulic characteristics of Printed Circuit Heat Exchanger (PCHE). Int. J. Heat Mass Transf. 2018, 118, 304–315. [Google Scholar] [CrossRef]
- Xu, X.; Ma, T.; Li, L.; Zeng, M.; Chen, Y.; Huang, Y.; Wang, Q. Optimization of fin arrangement and channel configuration in an airfoil fin PCHE for supercritical CO2 cycle. Appl. Therm. Eng. 2014, 70, 867–875. [Google Scholar] [CrossRef]
- Kim, I.H.; No, H.C. Physical model development and optimal design of PCHE for intermediate heat exchangers in HTGRs. Nucl. Eng. Des. 2012, 243, 243–250. [Google Scholar] [CrossRef]
- Lee, S.-M.; Kim, K.-Y. Comparative study on performance of a zigzag printed circuit heat exchanger with various channel shapes and configurations. Heat Mass Transf. 2013, 49, 1021–1028. [Google Scholar] [CrossRef]
- Zhao, Z.; Chen, X.; Zhang, X.; Ma, X.; Yang, S. Experimental and numerical study on thermal-hydraulic performance of printed circuit heat exchanger for liquefied gas vaporization. Energy Sci. Eng. 2020, 8, 426–440. [Google Scholar] [CrossRef]
- Zhao, Z.; Zhou, Y.; Ma, X.; Chen, X.; Li, S.; Yang, S. Numerical Study on Thermal Hydraulic Performance of Supercritical LNG in Zigzag-Type Channel PCHEs. Energies 2019, 12, 548. [Google Scholar] [CrossRef]
- Zhao, Z.; Zhou, Y.; Ma, X.; Chen, X.; Li, S.; Yang, S. Effect of Different Zigzag Channel Shapes of PCHEs on Heat Transfer Performance of Supercritical LNG. Energies 2019, 12, 2085. [Google Scholar] [CrossRef]
- Zhao, Z.; Chen, X.; Li, S.; Yang, S.; Huang, L. Methodology of design and analysis on the thermal hydraulic performance of the cross-flow printed circuit heat exchanger. Int. J. Heat Mass Transf. 2020, 156, 119756. [Google Scholar] [CrossRef]
- Bai, J.; Pan, J.; He, X.; Wang, K.; Tang, L.; Yang, R. Numerical investigation on thermal hydraulic performance of supercritical LNG in sinusoidal wavy channel based printed circuit vaporizer. Appl. Therm. Eng. 2020, 175, 115379. [Google Scholar] [CrossRef]
- NIST Standard Reference Database 23. The US Secretary of Commerce 2013. Available online: https://webbook.nist.gov/chemistry/name-ser/ (accessed on 21 June 2021).
- Kim, I.H.; No, H.C. Thermal hydraulic performance analysis of a printed circuit heat exchanger using a helium–water test loop and numerical simulations. Appl. Therm. Eng. 2011, 31, 4064–4073. [Google Scholar] [CrossRef]
- Pan, J.; Wang, J.; Tang, L.; Bai, J.; Li, R.; Lu, Y.; Wu, G. Numerical investigation on thermal-hydraulic performance of a printed circuit LNG vaporizer. Appl. Therm. Eng. 2020, 165, 114447. [Google Scholar] [CrossRef]
- Kim, I. Experimental and Numerical Investigations of Thermal-Hydraulic Characteristics for the Design of a Printed Circuit Heat Exchanger (PCHE) in HTGRs; Korea Advanced Institute of Science and Technology: Daejeon, Korea, 2011. [Google Scholar]
- Khan, H.H.; Sharma, A.; Srivastava, A.; Chaudhuri, P. Thermal-hydraulic characteristics and performance of 3D wavy channel based printed circuit heat exchanger. Appl. Therm. Eng. 2015, 87, 519–528. [Google Scholar] [CrossRef]
Publisher’s Note: MDPI stays neutral with regard to jurisdictional claims in published maps and institutional affiliations. |
© 2022 by the authors. Licensee MDPI, Basel, Switzerland. This article is an open access article distributed under the terms and conditions of the Creative Commons Attribution (CC BY) license (https://creativecommons.org/licenses/by/4.0/).