A Method for Large Underground Structures Geometry Evaluation Based on Multivariate Parameterization and Multidimensional Analysis of Point Cloud Data
Abstract
1. Introduction
2. State of the Art
3. Experiments and Data Description
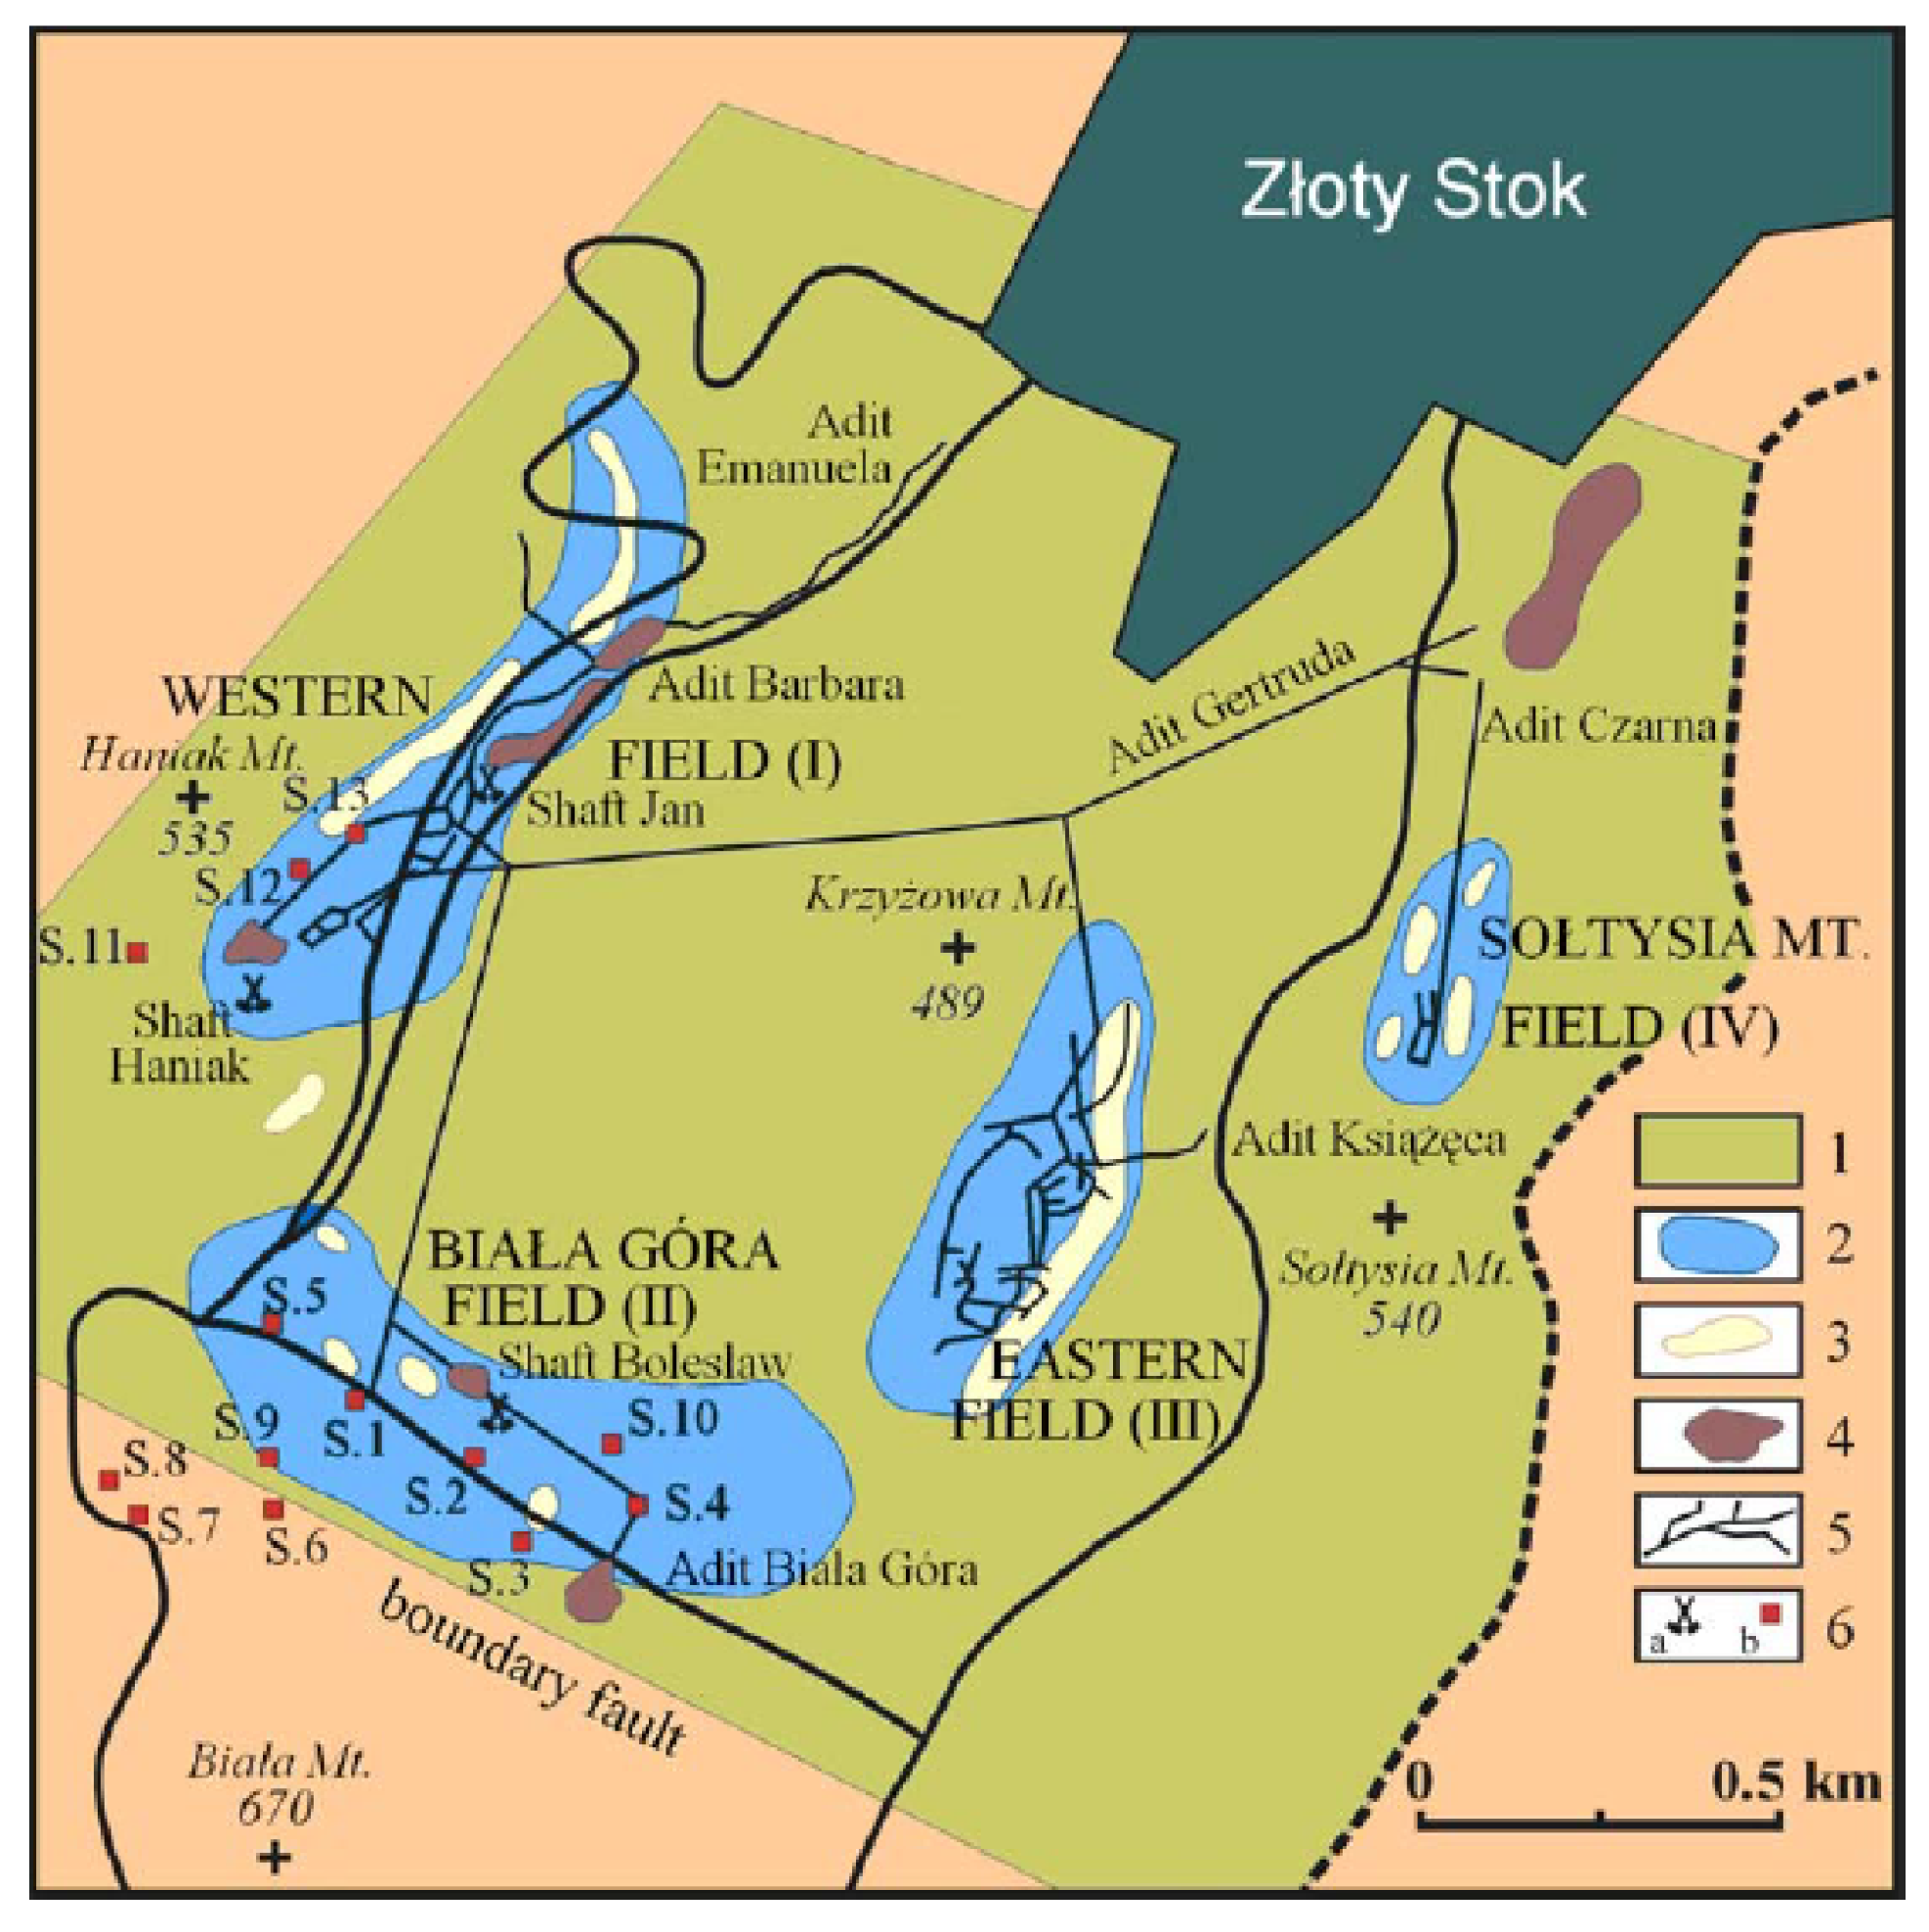
3.1. Złoty Stok Gold Mine
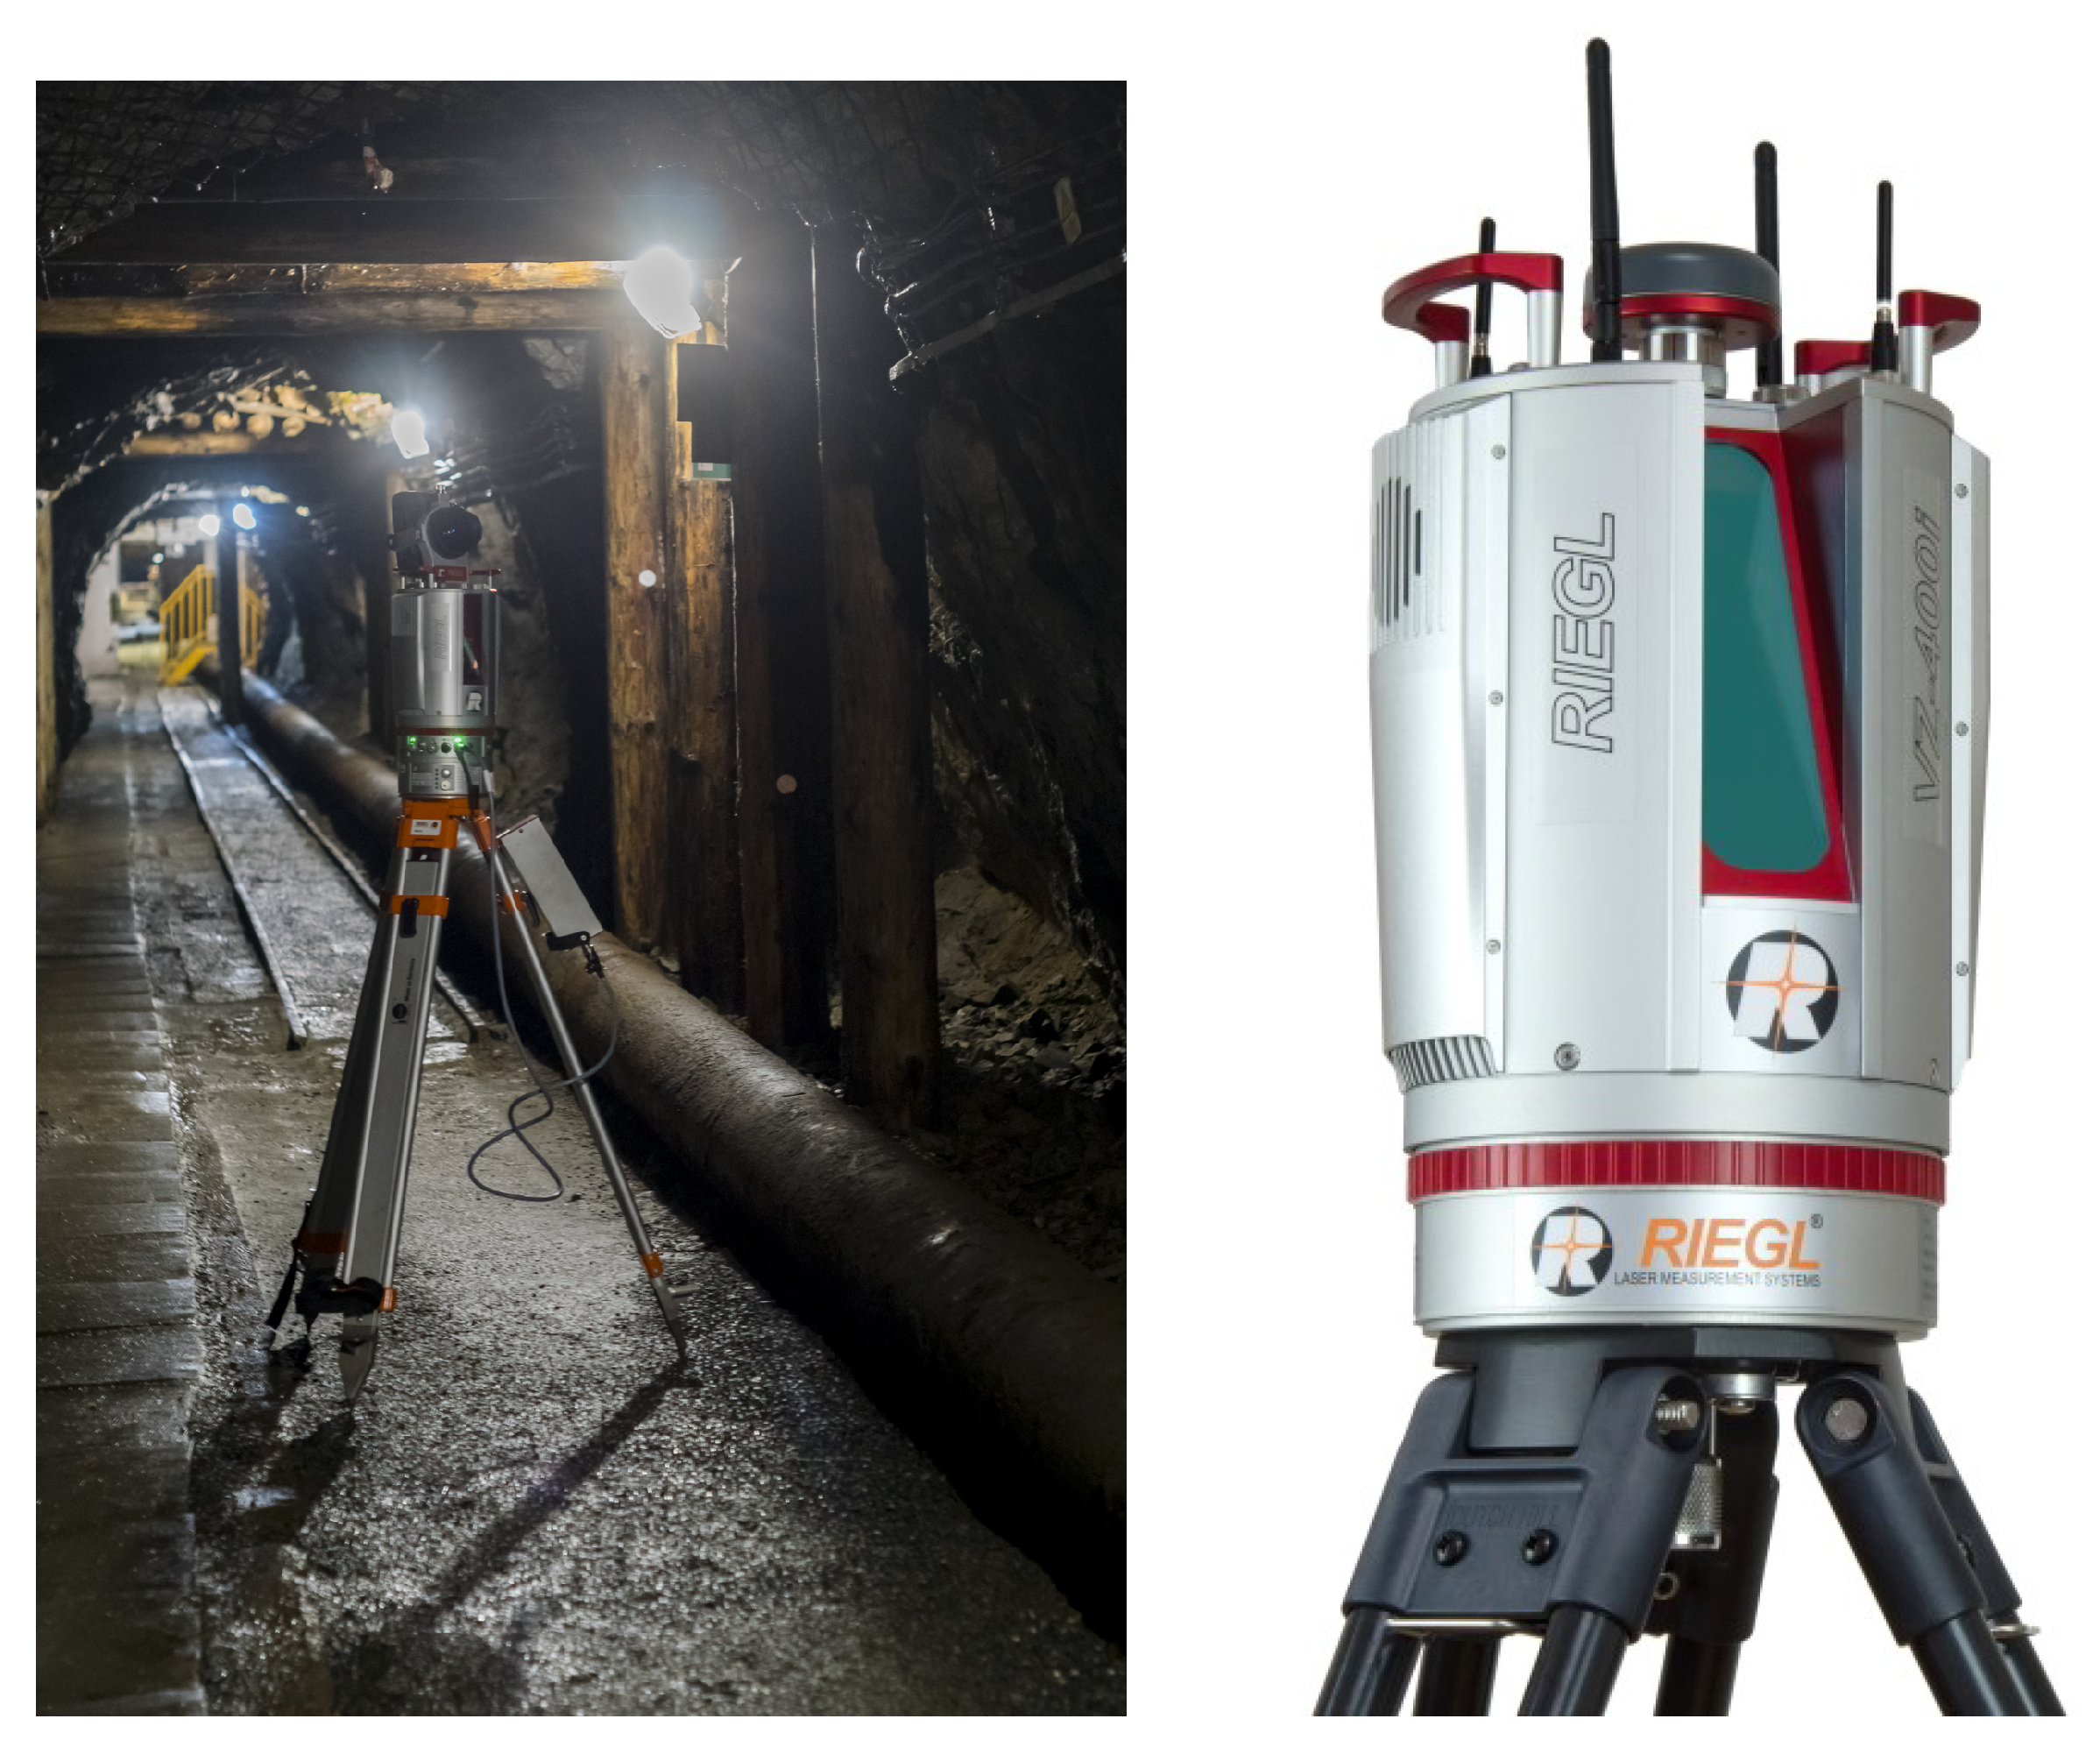
3.2. Data Collection
4. Methodology
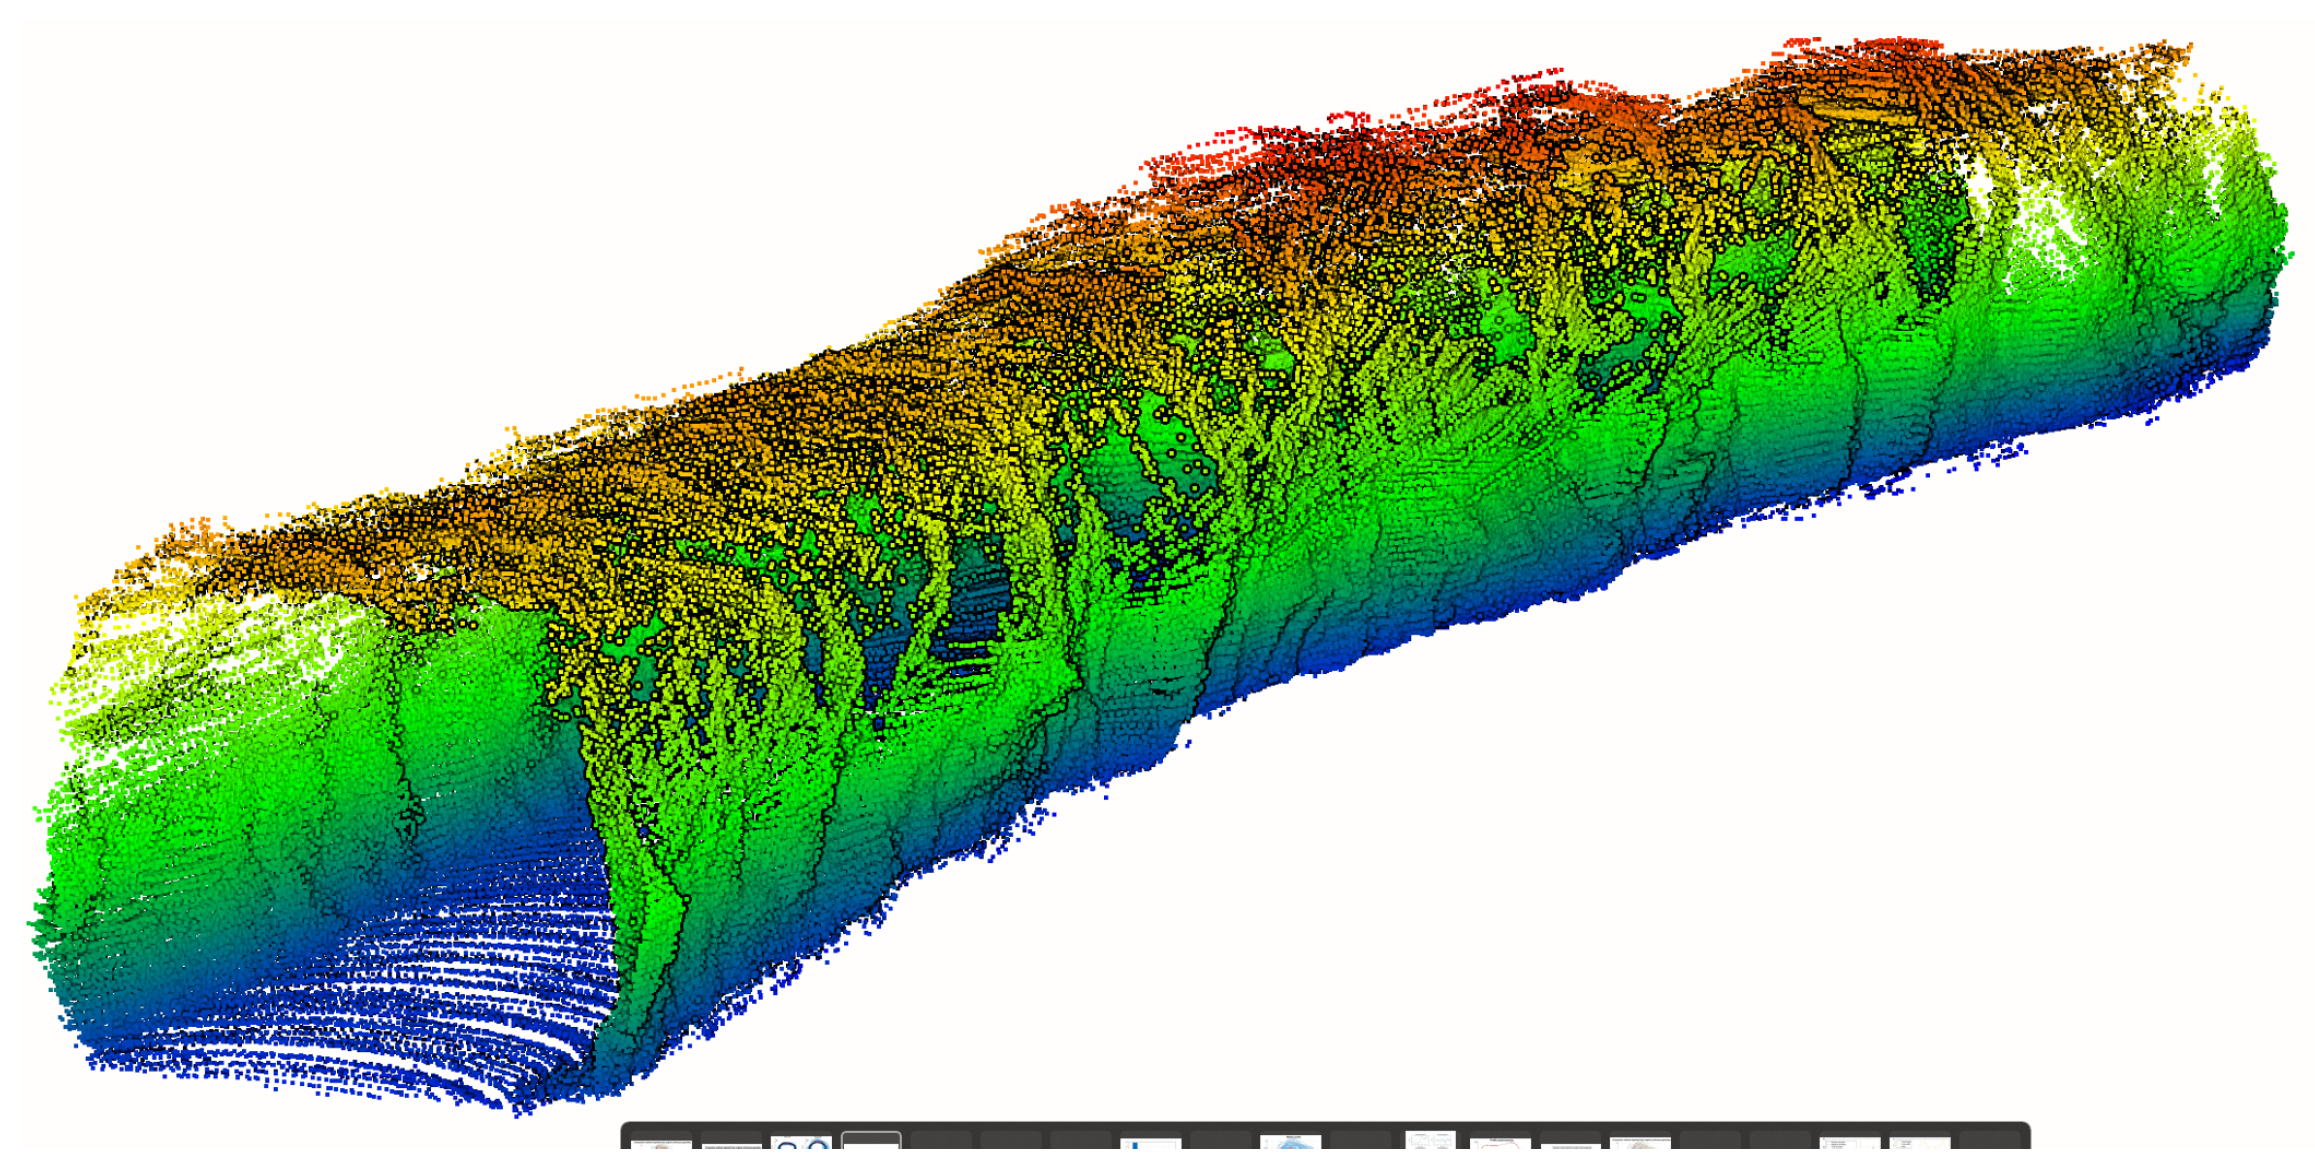
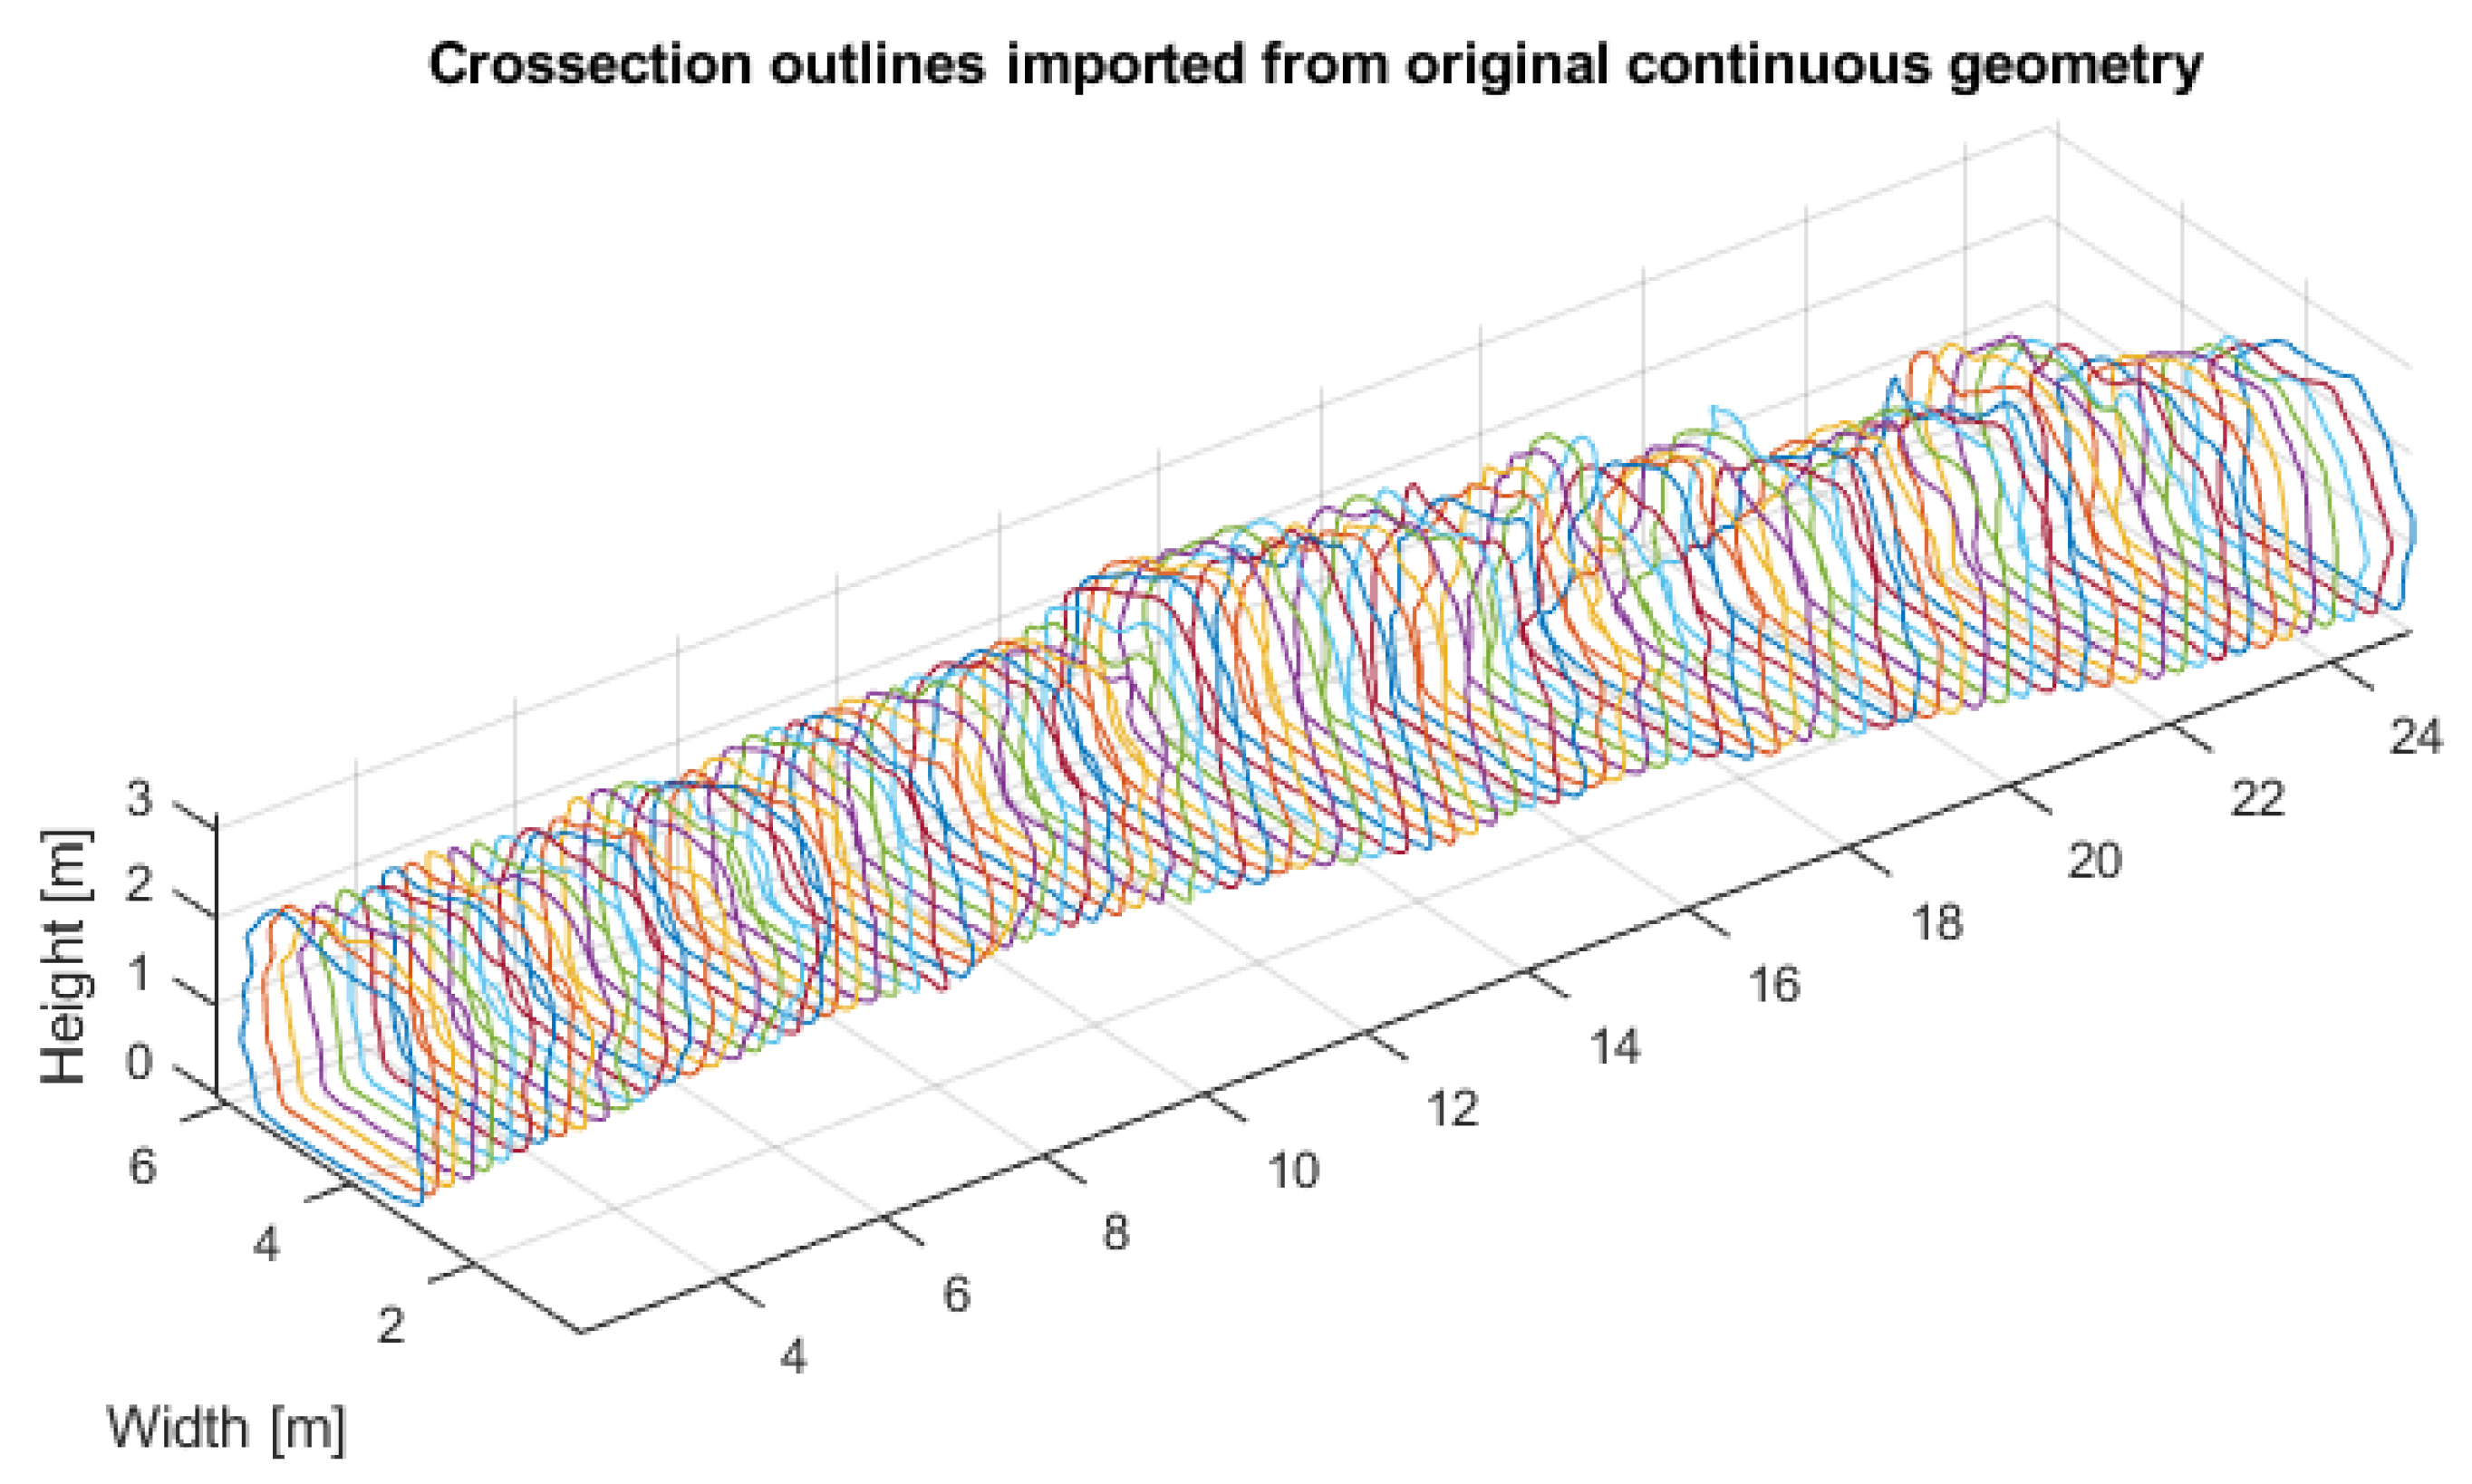
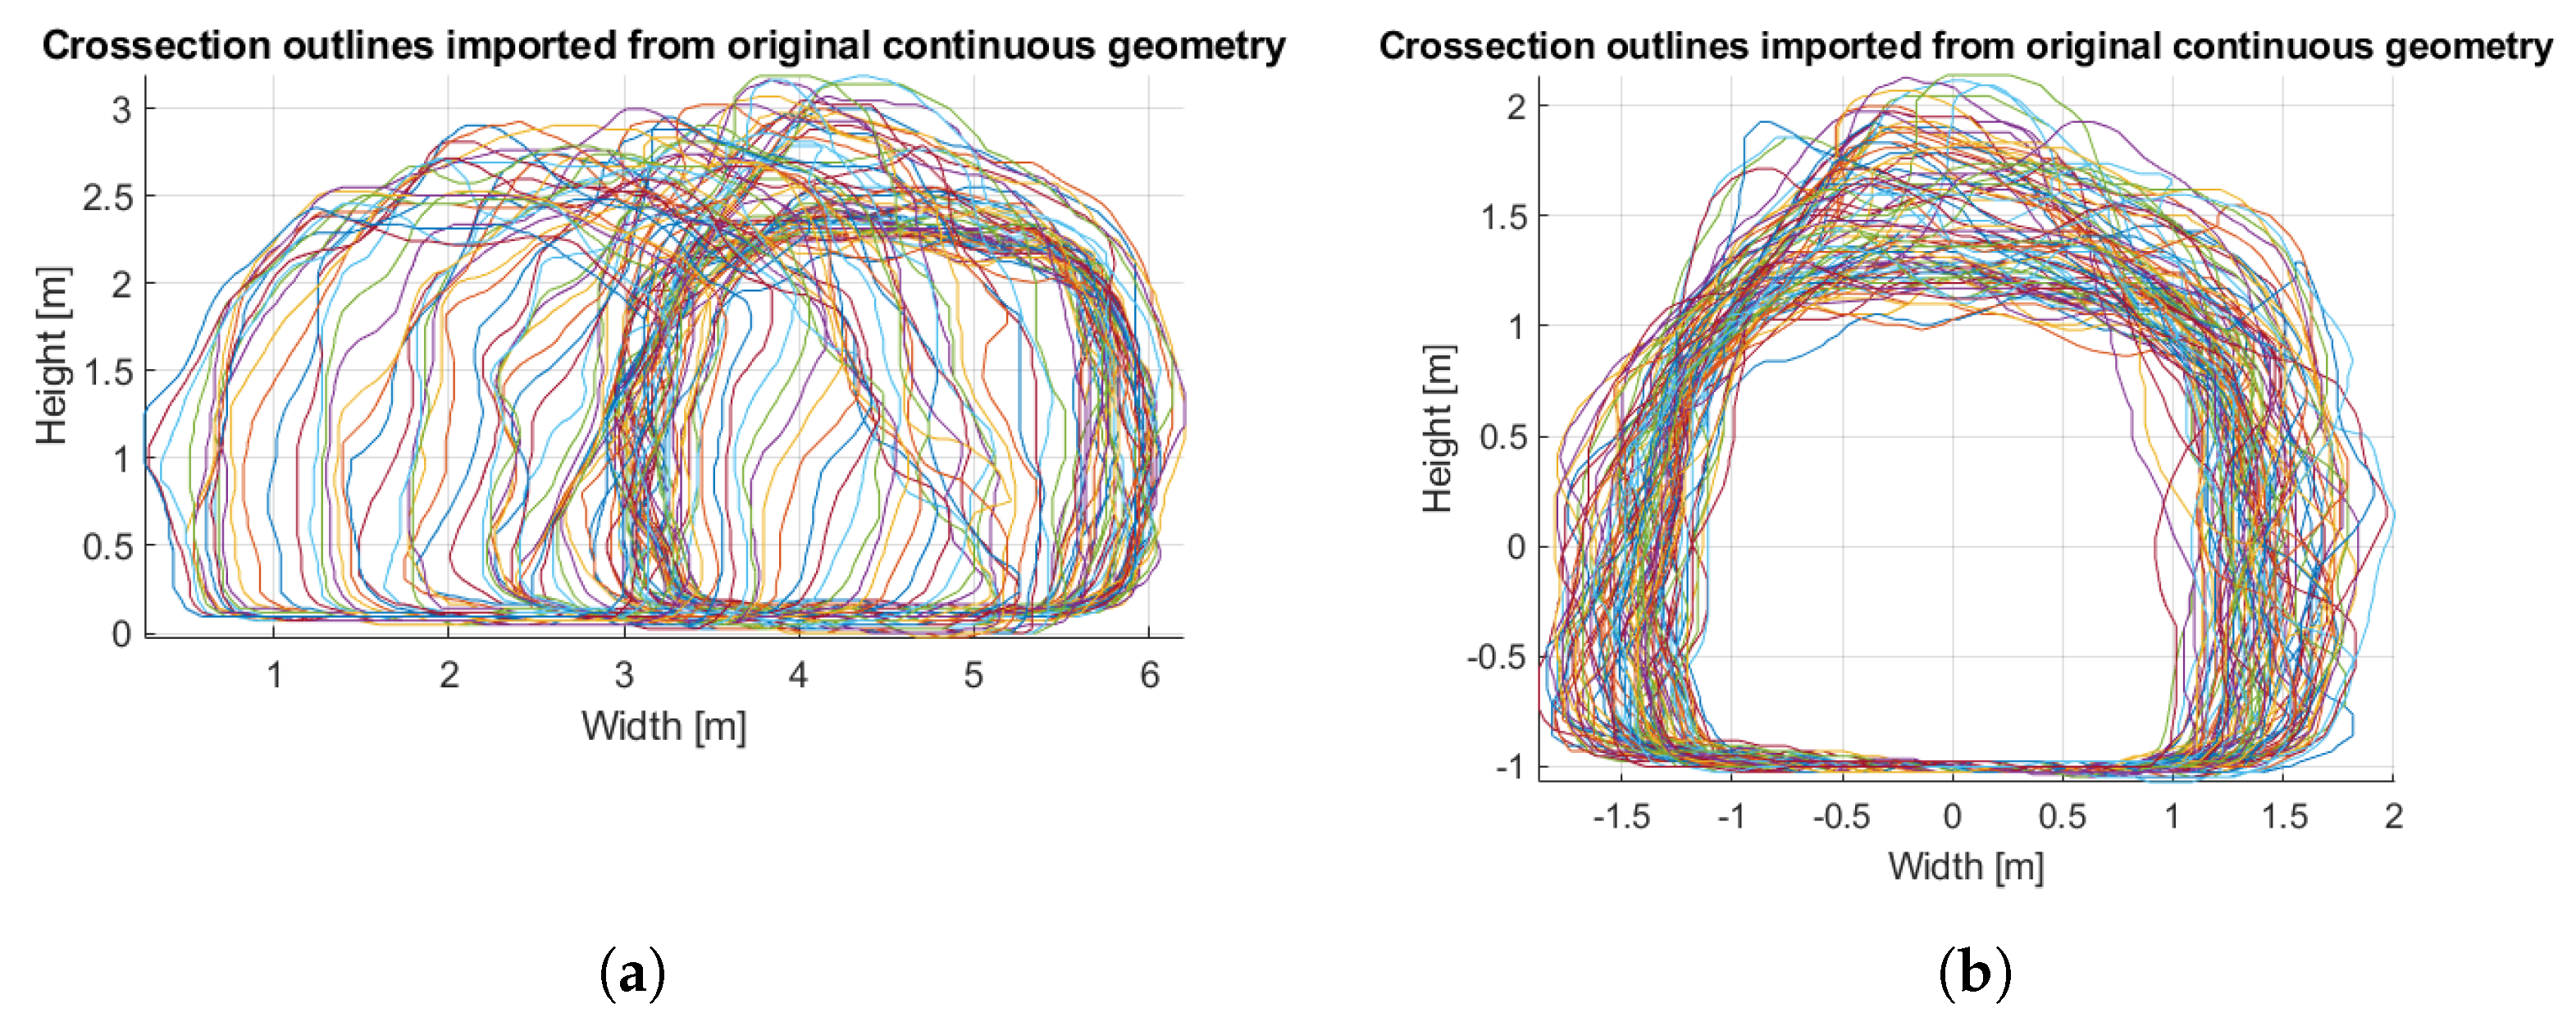
- Longitudinal sampling: In the first step, the grid is defined in the dimension of tunnel length with a given resolution. Then, the original geometry produced by a scanner is manually sampled longitudinally according to the grid. In practice, when raw data are imported from the device to the computer, they are assembled from multiple files to a single point cloud. From this point cloud, running the bounding box filter of a given longitudinal interval (i.e., chosen cross-section separation), the slices of a point cloud are extracted. Projecting them on a plane perpendicular to the tunnel axis, the points establishing flat corridor cross sections (further called “profiles”) of the entire geometry are generated. This way, it is possible to obtain a set of cross-sectional profiles that can be further analyzed. When a set of such profiles is obtained, they are cleaned by selecting only the edge points (see Section 4.1). This way, it is possible to get rid of unnecessary points inside the corridor.
- Centering: In the next step, the profiles are centered so that their shapes can be analyzed. It is a necessary preprocessing step to counteract any changes in the directions of a path of a corridor. For example, if the corridor was excavated in a perfectly straight line, centering would not be necessary because (at least in theory) the center of each profile would lie in the same position on its plane. In the horizontal direction, the median value (see Section 4.2) of each profile is subtracted (median of horizontal coordinates of points).In the vertical direction, profiles are first normalized to the average floor level (section of a profile describing the floor is identified, and a mean value of the vertical coordinates of this section is subtracted), and then the median value is subtracted from the entire geometry in terms of vertical coordinates, so that the projection orthogonal to the length of the corridor is centered around the origin of the coordinate system.
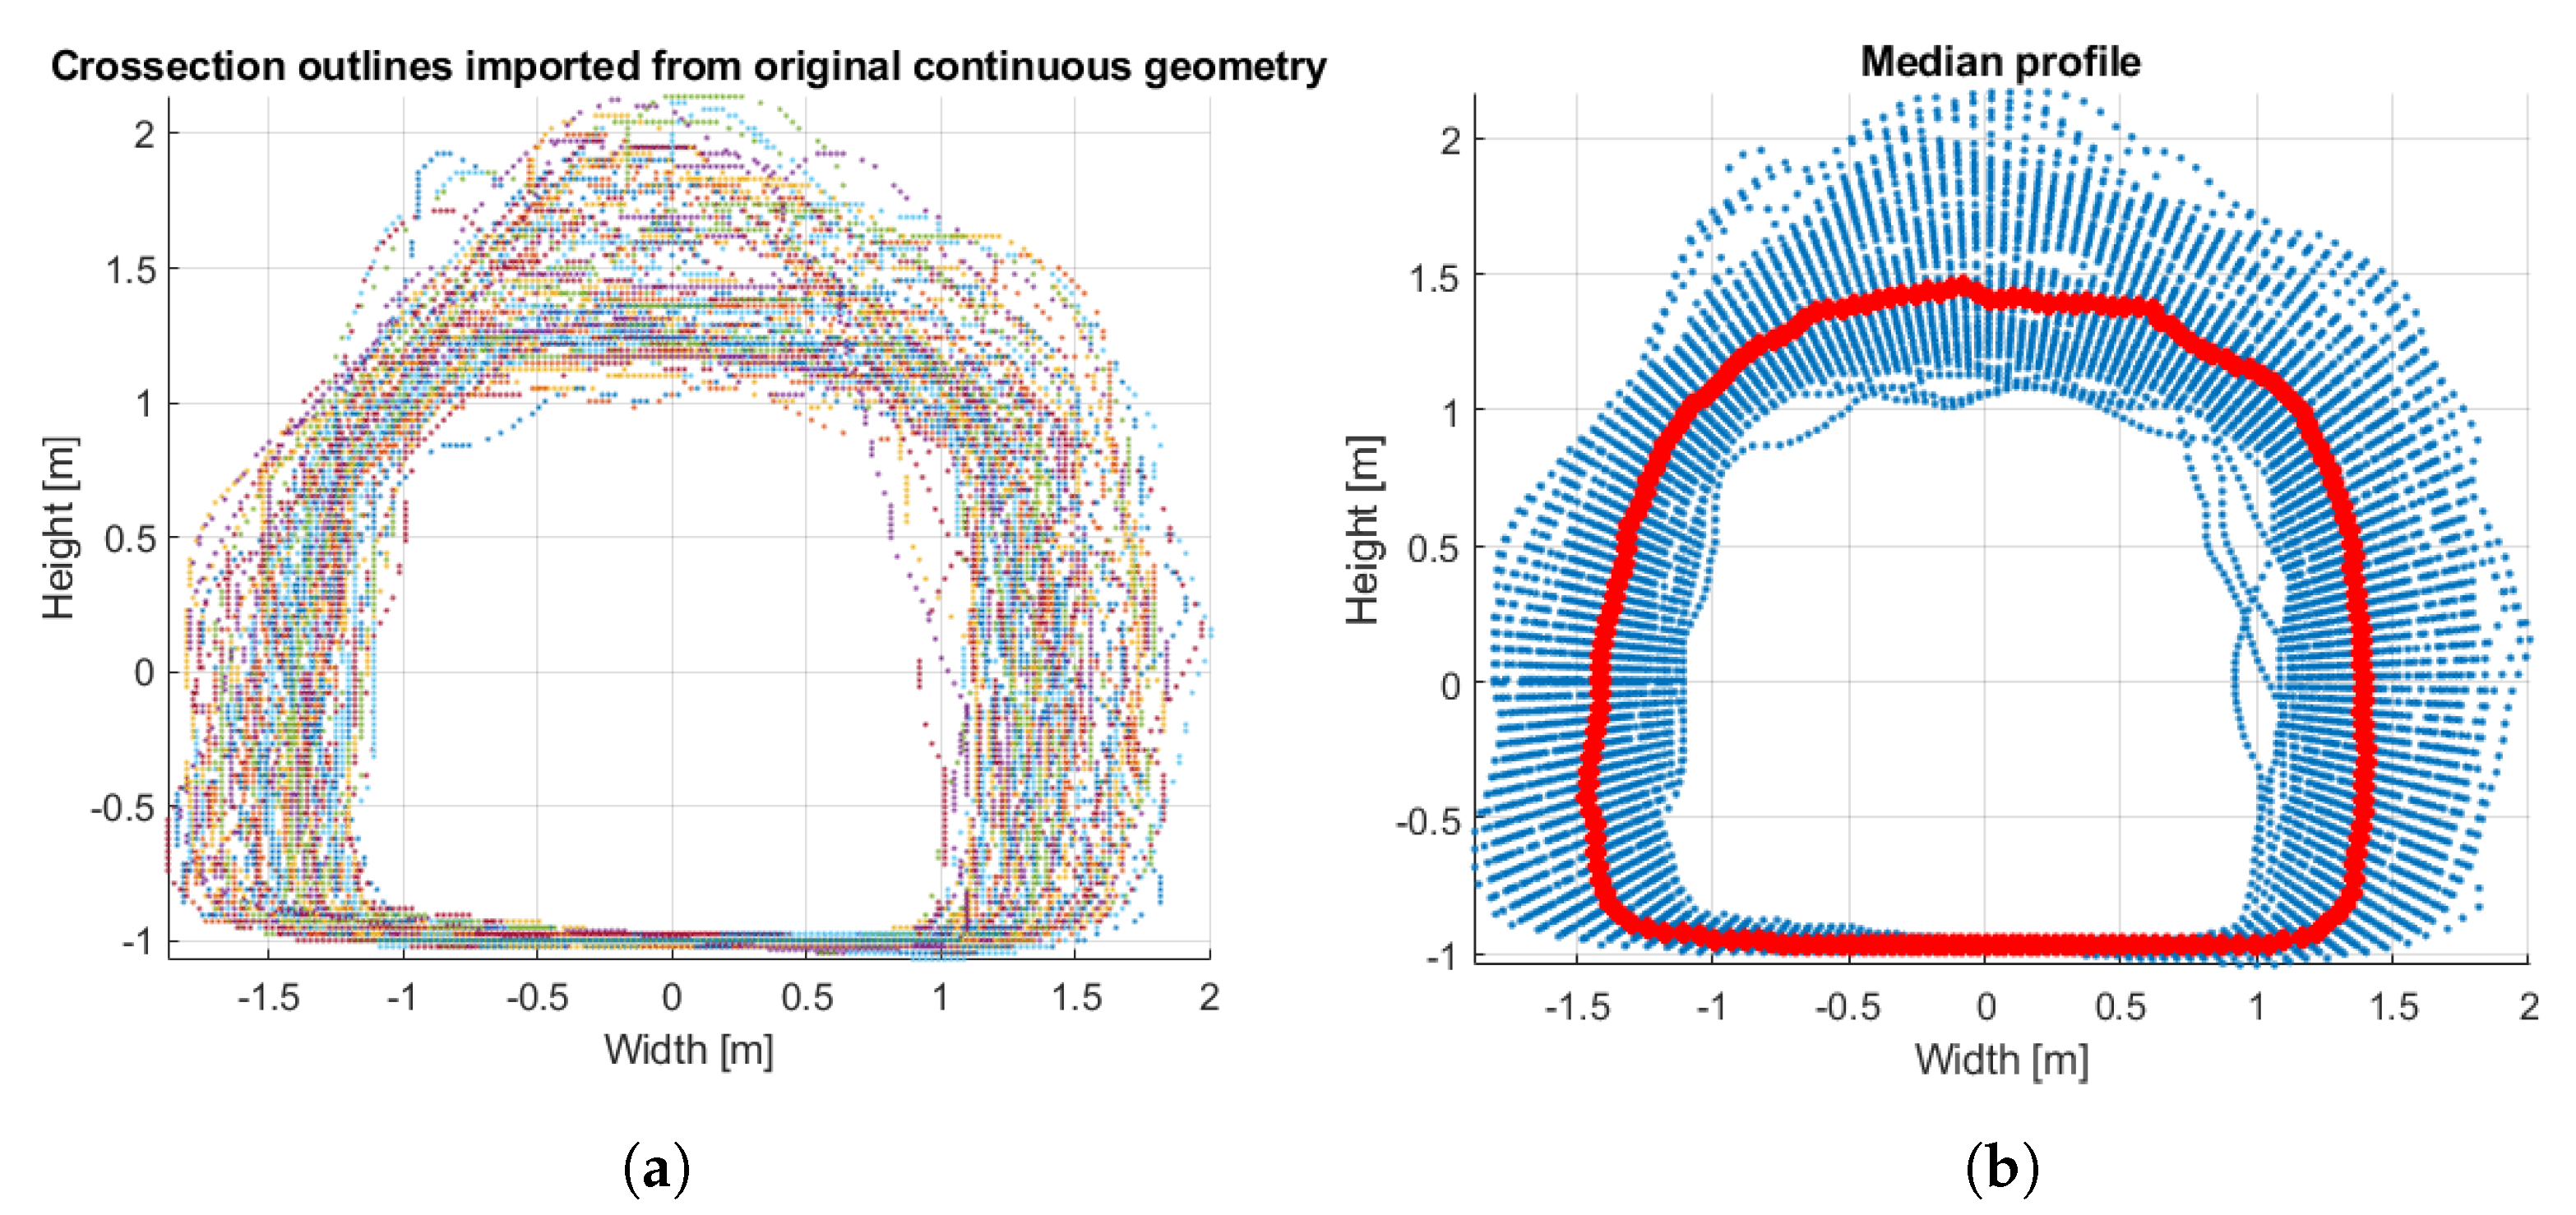
- Circumferential resampling: Centered profiles are converted to polar coordinates. This way, their shapes are “unfolded” so that the horizontal coordinate value of each point represents the angle of a point with respect to the center of a corridor, and the vertical coordinate value of each point represents the distance from the center of a corridor (such as a unit circle converted to polar coordinates becomes a constant linear function of value 1). For each profile represented by a pair of vectors holding the coordinates of individual points, the unfolded profile in a polar domain is represented by a pair of vectors holding the coordinates calculated as:where N is the number of profiles, the coordinate denotes the angle coordinate, and the coordinate R denotes the radius coordinate (distance from the center).Now the profile coordinates can be used as single-dimensional vectors in the domain , and they can be reinterpolated in the angle domain to the resolution that is common to all the profiles. First, a new domain vector is defined with K evenly spaced points in range . Then, all the vectors are resampled so that allows to produce , where it is important to notice that the angle domain vector is common for all . The resampling itself is performed using a Modified Akima cubic Hermite interpolation [62]. The interpolated values are based on a piecewise function of polynomials. This way, the profiles are described by the equal amount of points evenly spaced in the domain of the angle. At this point, the evenly sampled geometry of the desired grid resolution is obtained.
- Parameterization: In the beginning of parameterization, the median (see Section 4.2) profile is calculated from the entire geometry which serves as a reference model. For every profile (after circumferential resampling), their vectors are arranged in a matrix , and its median is calculated along the dimension of corridor length, which produces a new profile, also in the angle domain, such as:In practice, user can import additional geometry to serve as a reference model. Then, several statistics are calculated for every profile, such as:
- Total, positive, and negative deviation from the reference profile shape (see Section 4.3)—those features will be useful to describe the aspect of consistency of the excavation. Testing shows that having those 3 features together works better than using only 1 feature of total deviation, although in practice they carry the same information.
- Roughness factor (see Section 4.4)—this feature allows the user to describe the qualitative aspect of a profile in terms of how wasteful the excavation was at any given point. It is not optimal if a shape of a single profile contains a lot of variety.
- Width, height, and area of a given profile.
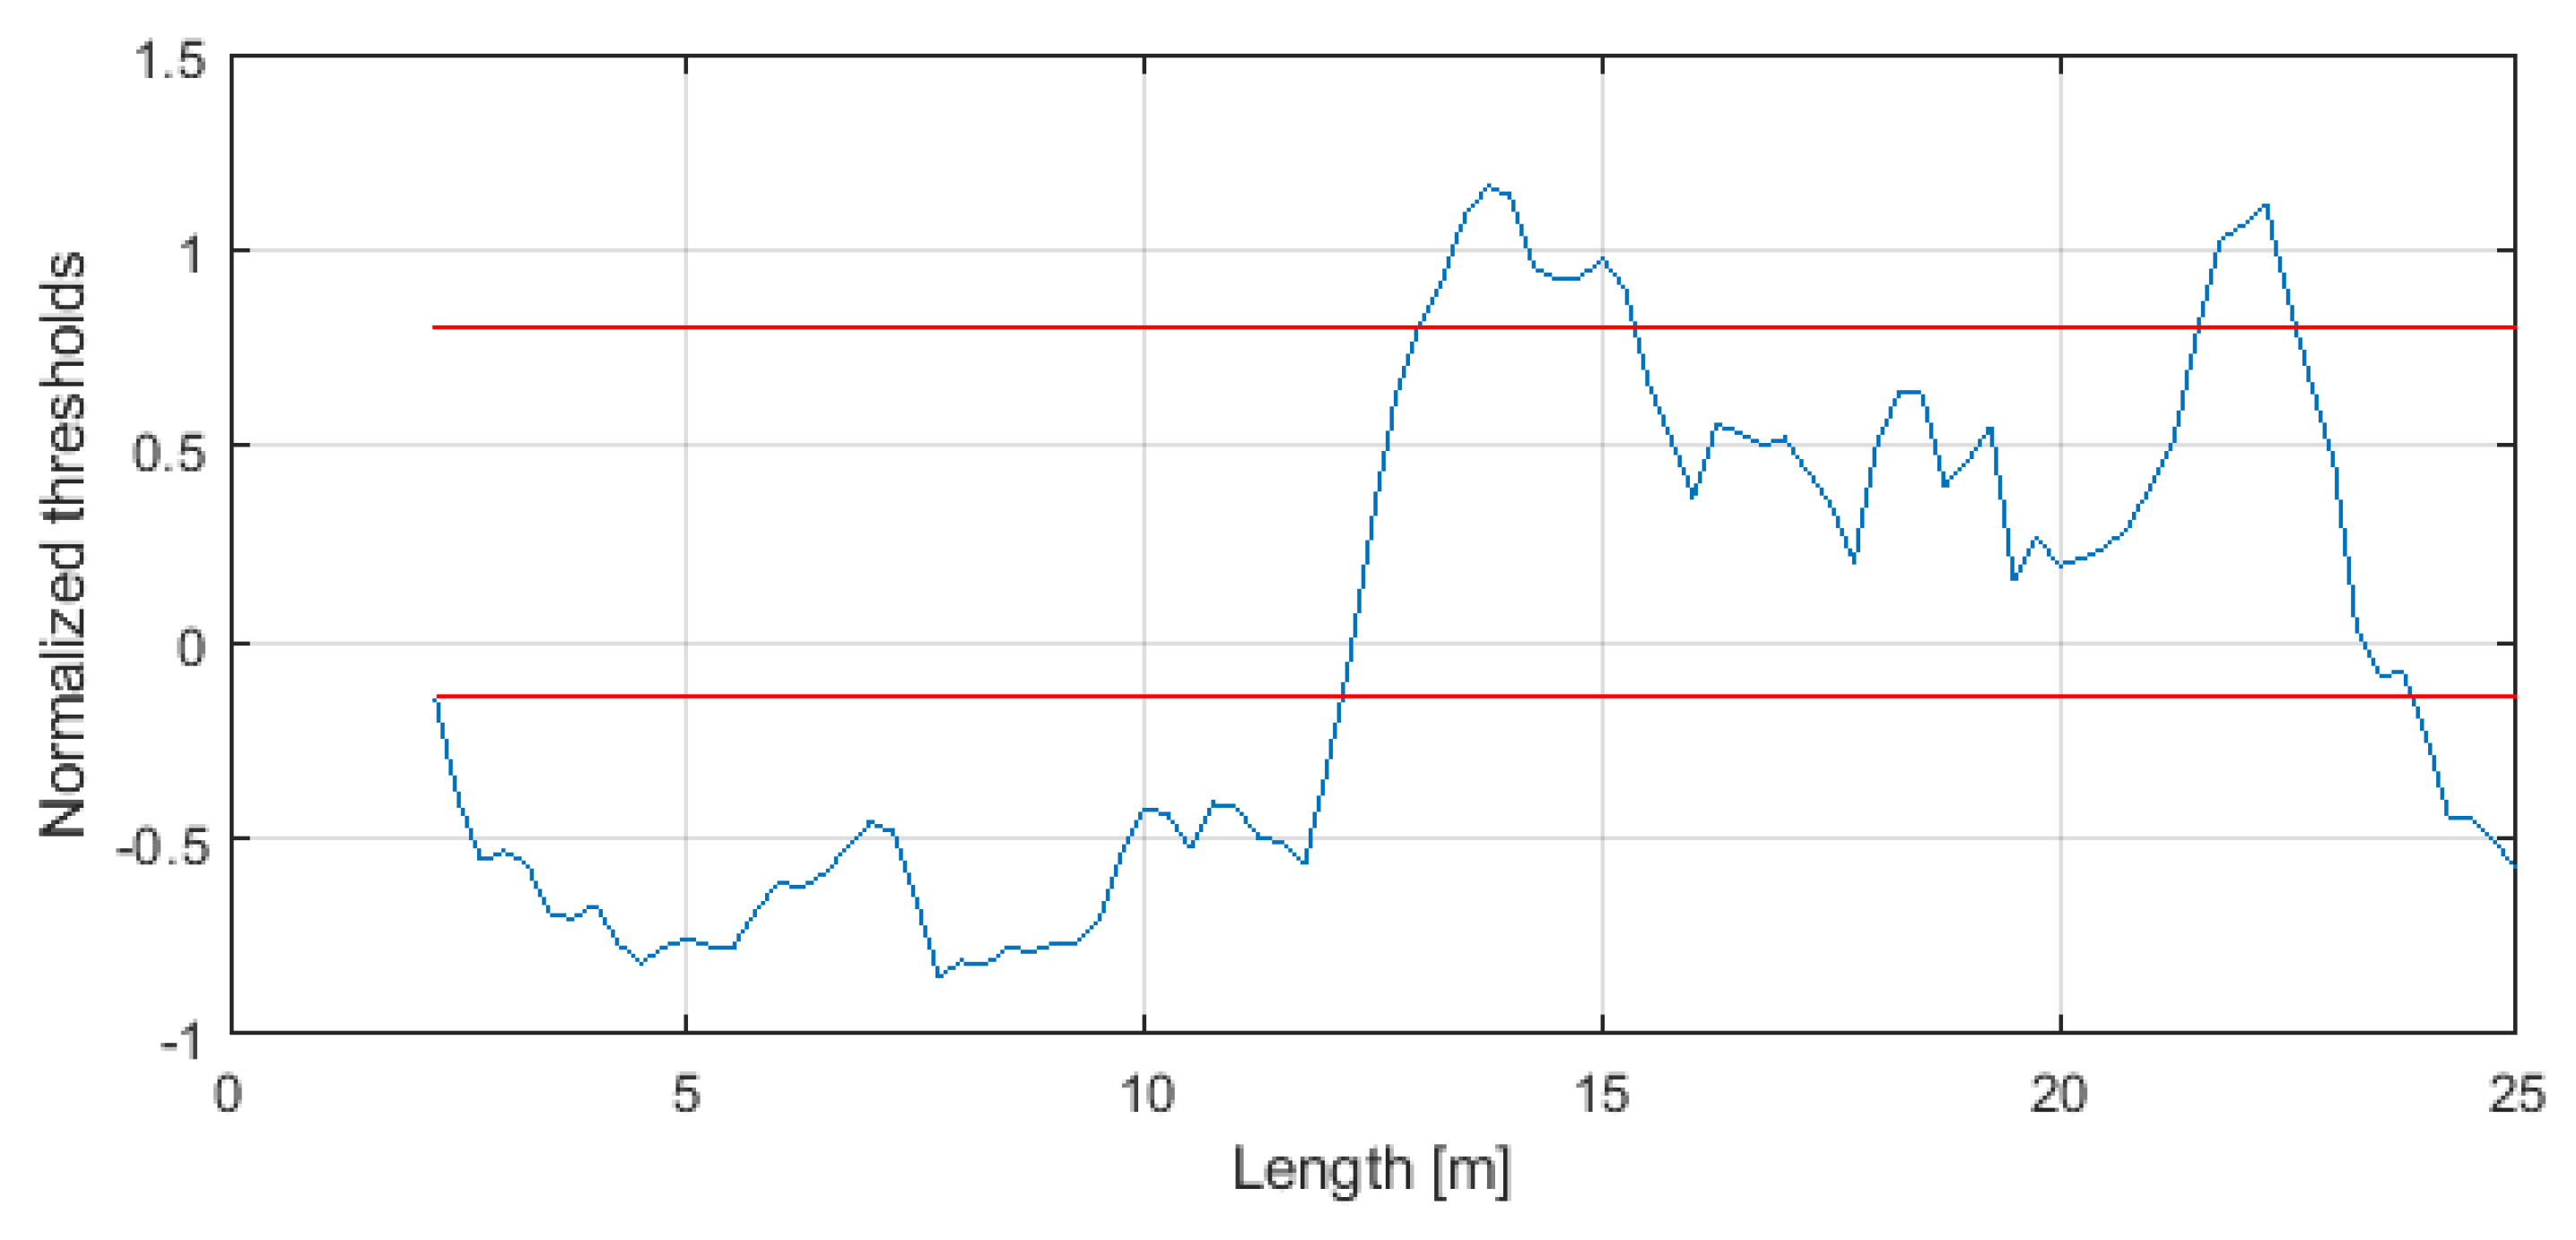
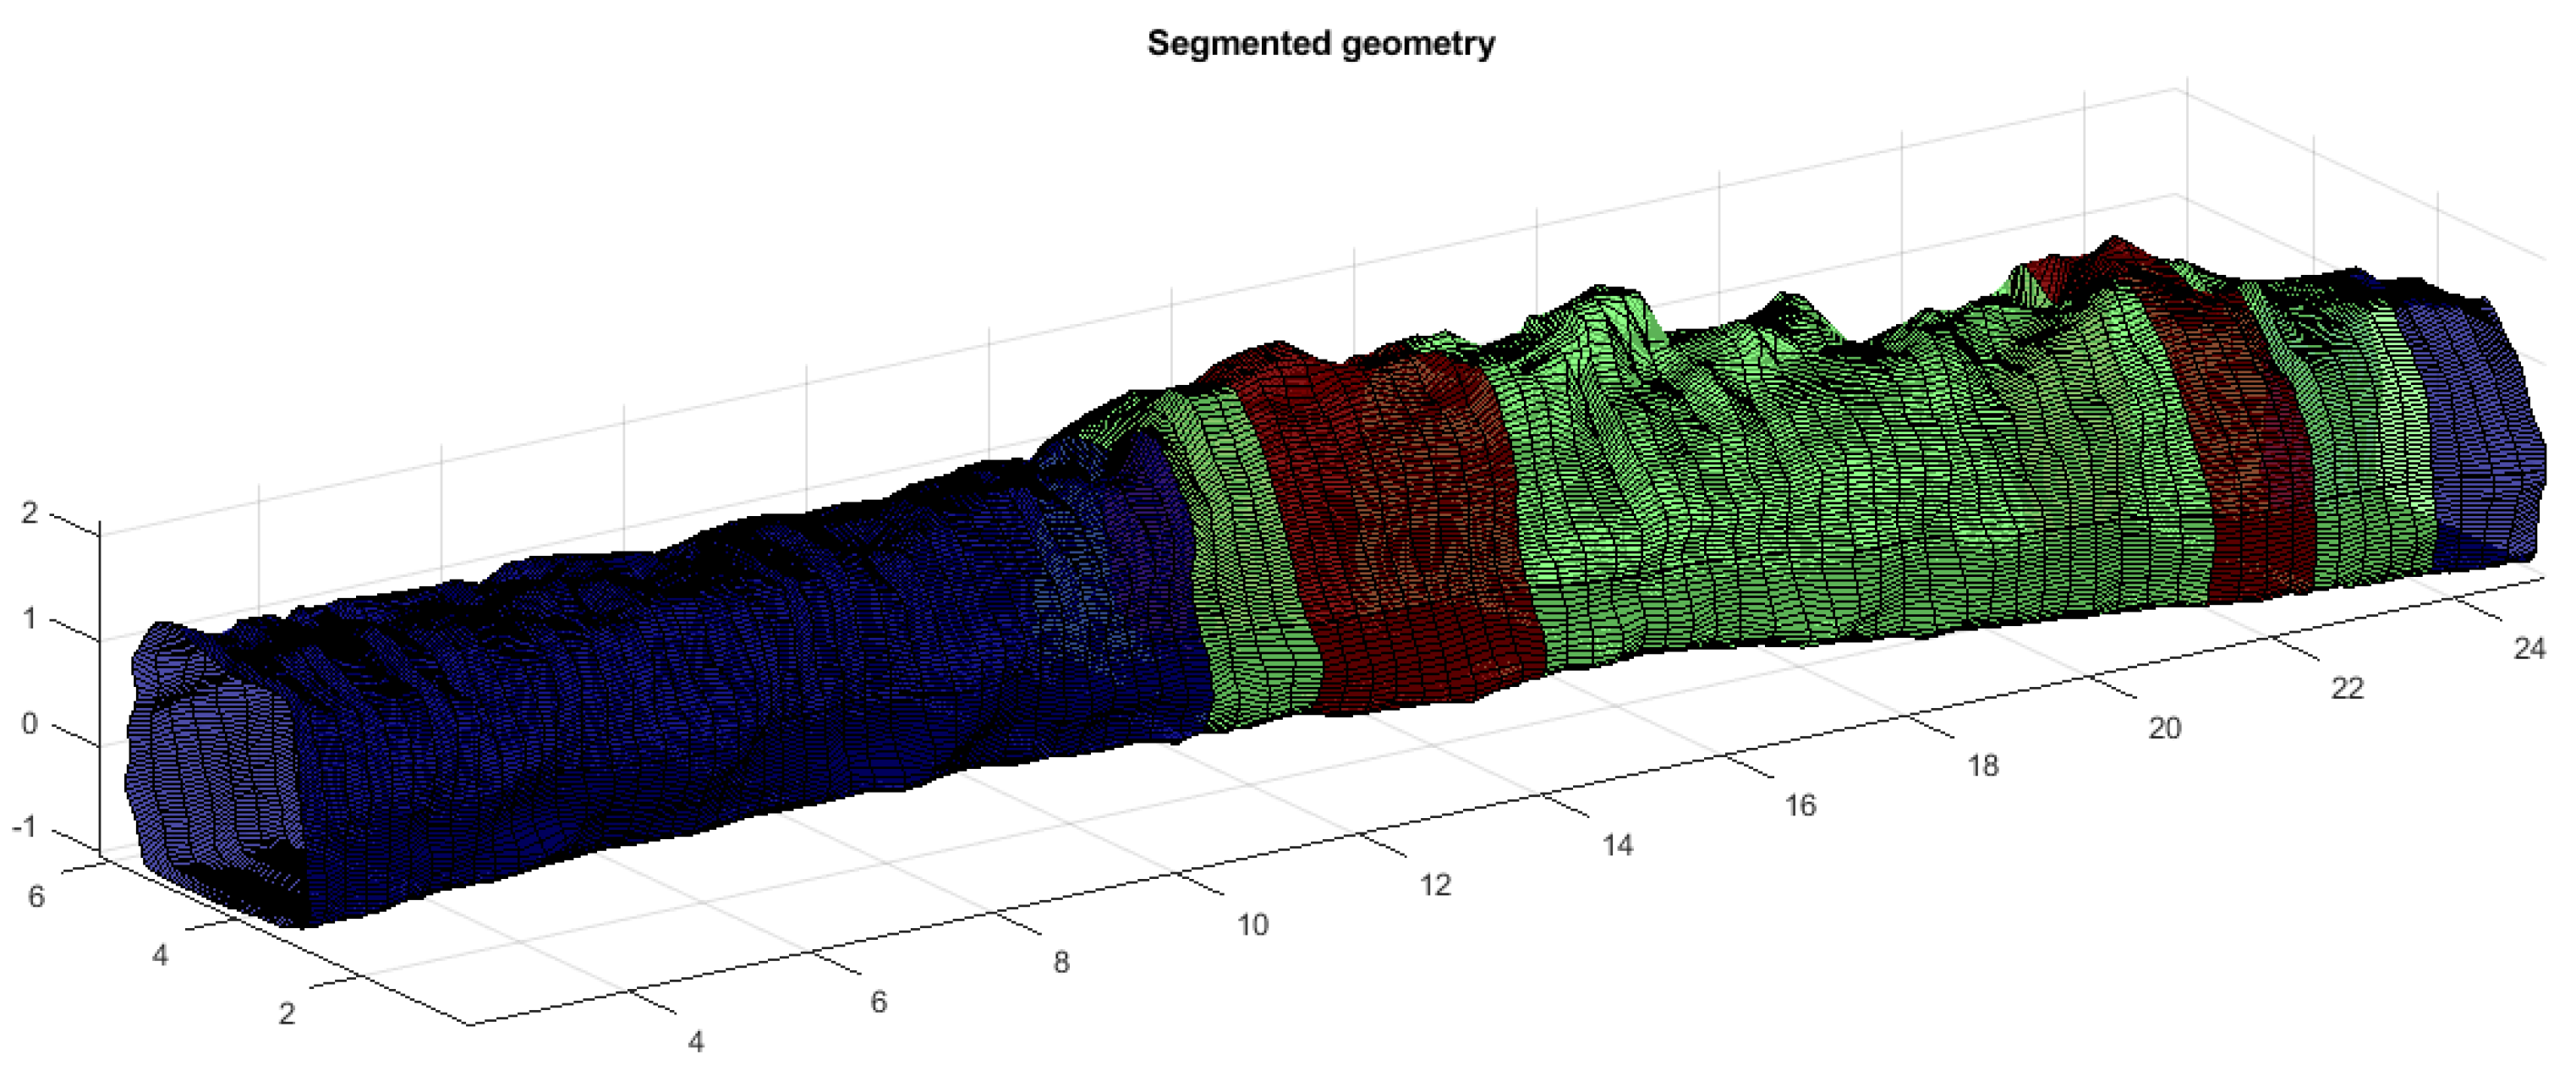
In total, it allows us to obtain 7 features describing the corridor along its length. Those 7 features are then used as a dataset of parameters that is used for further analysis. Those statistics can be analyzed by themselves to evaluate the geometry and draw conclusions; however, the authors propose the following method that fuses data from the statistics.The matrix containing the statistics (Table 1) is processed using a principal component analysis (PCA) algorithm (see Section 4.5). The PCA method is known for its ability to reduce dimensionality. In practice, it means that if it is able to produce one feature that explains the vast majority of information coming from the 7-dimensional dataset, it is very practical to analyze this singular feature instead of performing 7-dimensional analysis of the data. The first component forms a diagnostic feature that describes the differences between the profiles and can be used as a working statistic for segmentation. - Segmentation: The diagnostic feature is segmented based on value thresholds. To obtain them, authors calculate a kernel density estimate of a diagnostic feature (see Section 4.6) [63] and define the thresholds as the local minima between main modes. It is performed by differential analyses of the estimated probability density function. Local minima are located at places where the first derivative is equal to 0 and the second derivative is positive. Then, profiles that belong to particular classes between those thresholds are identified. In practice, Matlab provides a function called findpeaks that performs this operation automatically.
4.1. Boundary Detection
4.2. Median Calculation
4.3. Deviation Calculation
4.4. Roughness Factor
4.5. Principal Component Analysis
4.6. Kernel Density Estimation
5. Results
6. Discussion
7. Conclusions
Author Contributions
Funding
Institutional Review Board Statement
Informed Consent Statement
Data Availability Statement
Acknowledgments
Conflicts of Interest
References
- Person, P.A.; Holmberg, R.; Lee, J. Rock Blasting and Explosives Engineering; CRC Press: Boca Raton, FL, USA, 1993; p. 560. [Google Scholar]
- AFENI, T.B. Optimization of drilling and blasting operations in an open pit mine—The SOMAIR experience. Min. Sci. Technol. (China) 2009, 19, 736–739. [Google Scholar] [CrossRef]
- Yilmaz, O.; Unlu, T. An application of the modified Holmberg–Persson approach for tunnel blasting design. Tunn. Undergr. Space Technol. 2014, 43, 113–122. [Google Scholar] [CrossRef]
- Navarro, J.; Sanchidrián, J.; Segarra, P.; Castedo, R.; Costamagna, E.; López, L. Detection of potential overbreak zones in tunnel blasting from MWD data. Tunn. Undergr. Space Technol. 2018, 82, 504–516. [Google Scholar] [CrossRef]
- Bieniawski, Z. Principles and methodology of design for excavations in geologic media. Res. Eng. Des. 1993, 5, 49–58. [Google Scholar] [CrossRef]
- Brady, B.H.; Brown, E.T. Rock Mechanics: For Underground Mining; Springer Science & Business Media: Berlin, Germany, 1993. [Google Scholar]
- Jang, H.; Kawamura, Y.; Shinji, U. An empirical approach of overbreak resistance factor for tunnel blasting. Tunn. Undergr. Space Technol. 2019, 92, 103060. [Google Scholar] [CrossRef]
- Islam, M.R.; Hayashi, D.; Kamruzzaman, A. Finite element modeling of stress distributions and problems for multi-slice longwall mining in Bangladesh, with special reference to the Barapukuria coal mine. Int. J. Coal Geol. 2009, 78, 91–109. [Google Scholar] [CrossRef]
- Di Bartolo, S.; Salvini, R. Multitemporal Terrestrial Laser Scanning for Marble Extraction Assessment in an Underground Quarry of the Apuan Alps (Italy). Sensors 2019, 19, 450. [Google Scholar] [CrossRef]
- Benton, D.J.; Iverson, S.R.; Martin, L.A.; Johnson, J.C.; Raffaldi, M.J. Volumetric measurement of rock movement using photogrammetry. Int. J. Min. Sci. Technol. 2016, 26, 123–130. [Google Scholar] [CrossRef] [PubMed][Green Version]
- Kajzar, V.; Kukutsch, R.; Heroldova, N. Verifying the possibilities of using a 3D laser scanner in the mining underground. Acta Geodyn. Geomater. 2015, 12, 51–58. [Google Scholar] [CrossRef]
- Kukutsch, R.; Kajzar, V.; Konicek, P.; Waclawik, P.; Ptacek, J. Possibility of convergence measurement of gates in coal mining using terrestrial 3D laser scanner. J. Sustain. Min. 2015, 14, 30–37. [Google Scholar] [CrossRef]
- Riveiro, B.; DeJong, M.; Conde, B. Automated processing of large point clouds for structural health monitoring of masonry arch bridges. Autom. Constr. 2016, 72, 258–268. [Google Scholar] [CrossRef]
- Teri, S.S.; Musliman, I.A. Machine learning in big lidar data: A review. Int. Arch. Photogramm. Remote Sens. Spat. Inf. Sci. 2019, 42, 641–644. [Google Scholar] [CrossRef]
- Ibarra, J.; Maerz, N.H.; Franklin, J.A. Overbreak and underbreak in underground openings part 2: Causes and implications. Geotech. Geol. Eng. 1996, 14, 325–340. [Google Scholar] [CrossRef]
- Mei, J.; Zhang, W.; Xu, B.; Zhu, Y.; Wang, B. Optimization Methods of Blasting Parameters of Large Cross-Section Tunnel in Horizontal Layered Rock Mass. Geotech. Geol. Eng. 2021, 39, 5309–5323. [Google Scholar] [CrossRef]
- Singh, S.P.; Xavier, P. Causes, impact and control of overbreak in underground excavations. Tunn. Undergr. Space Technol. 2005, 20, 63–71. [Google Scholar] [CrossRef]
- Chen, J.; Qiu, W.; Zhao, X.; Rai, P.; Ai, X.; Wang, H. Experimental and numerical investigation on overbreak control considering the influence of initial support in tunnels. Tunn. Undergr. Space Technol. 2021, 115, 104017. [Google Scholar] [CrossRef]
- Trisugiwo, M.; Zabidi, H.; Ahmad, F. Joint analysis to evaluate geological overbreak in excavation of surge chamber cavern. Procedia Chem. 2016, 19, 751–756. [Google Scholar] [CrossRef]
- Jang, H.; Topal, E. Optimizing overbreak prediction based on geological parameters comparing multiple regression analysis and artificial neural network. Tunn. Undergr. Space Technol. 2013, 38, 161–169. [Google Scholar] [CrossRef]
- Liu, K.; Liu, B. Optimization of smooth blasting parameters for mountain tunnel construction with specified control indices based on a GA and ISVR coupling algorithm. Tunn. Undergr. Space Technol. 2017, 70, 363–374. [Google Scholar] [CrossRef]
- Mohammadi, H.; Barati, B.; Chamzini, A.Y. Prediction of blast-induced overbreak based on geo-mechanical parameters, blasting factors and the area of tunnel face. Geotech. Geol. Eng. 2018, 36, 425–437. [Google Scholar] [CrossRef]
- Foderà, G.; Voza, A.; Barovero, G.; Tinti, F.; Boldini, D. Factors influencing overbreak volumes in drill-and-blast tunnel excavation. A statistical analysis applied to the case study of the Brenner Base Tunnel–BBT. Tunn. Undergr. Space Technol. 2020, 105, 103475. [Google Scholar] [CrossRef]
- Maerz, N.H.; Ibarra, J.; Franklin, J.A. Overbreak and underbreak in underground openings Part 1: Measurement using the light sectioning method and digital image processing. Geotech. Geol. Eng. 1996, 14, 307–323. [Google Scholar] [CrossRef]
- Franklin, J.A.; Ibarra, J.T.; Maerz, N.H. Blast overbreak measurement by light sectioning. Int. J. Min. Geol. Eng. 1989, 7, 323–331. [Google Scholar] [CrossRef]
- Heritage, G.; Large, A. Laser Scanning for the Environmental Sciences; John Wiley & Sons: Hoboken, NJ, USA, 2009. [Google Scholar]
- Trybała, P.; Blachowski, J.; Błażej, R.; Zimroz, R. Damage Detection Based on 3D Point Cloud Data Processing from Laser Scanning of Conveyor Belt Surface. Remote Sens. 2021, 13, 55. [Google Scholar] [CrossRef]
- Lindenbergh, R.; Uchanski, L.; Bucksch, A.; Van Gosliga, R. Structural monitoring of tunnels using terrestrial laser scanning. Rep. Geod. 2009, 231–238. Available online: https://yadda.icm.edu.pl/yadda/element/bwmeta1.element.baztech-article-PWAB-0005-0007/c/httpwww_rog_gik_pw_edu_plphocadownloadnr8727.pdf (accessed on 7 December 2021).
- Loupos, K.; Doulamis, A.D.; Stentoumis, C.; Protopapadakis, E.; Makantasis, K.; Doulamis, N.D.; Amditis, A.; Chrobocinski, P.; Victores, J.; Montero, R.; et al. Autonomous robotic system for tunnel structural inspection and assessment. Int. J. Intell. Robot. Appl. 2018, 2, 43–66. [Google Scholar] [CrossRef]
- Amedjoe, C.G.; Agyeman, J. Assessment of effective factors in performance of an open stope using cavity monitoring system data: A case study. J. Geol. Min. Res. 2015, 7, 19–30. [Google Scholar]
- Warneke, J.; Dwyer, J.; Orr, T. Use of a 3-D scanning laser to quantify drift geometry and overbreak due to blast damage in underground manned entries. In Proceedings of the 1st Canada-US Rock Mechanics Symposium, Vancouver, BC, Canada, 27–31 May 2007. [Google Scholar]
- Zou, B.; Luo, Z.; Wang, J.; Hu, L. Development and Application of an Intelligent Evaluation and Control Platform for Tunnel Smooth Blasting. Geofluids 2021, 2021, 6669794. [Google Scholar] [CrossRef]
- Che, E.; Jung, J.; Olsen, M. Object recognition, segmentation, and classification of mobile laser scanning point clouds: A state of the art review. Sensors 2019, 19, 810. [Google Scholar] [CrossRef]
- Gikas, V. Three-dimensional laser scanning for geometry documentation and construction management of highway tunnels during excavation. Sensors 2012, 12, 11249–11270. [Google Scholar] [CrossRef]
- Luo, Y.; Chen, J.; Xi, W.; Zhao, P.; Qiao, X.; Deng, X.; Liu, Q. Analysis of tunnel displacement accuracy with total station. Meas. J. Int. Meas. Confed. 2016, 83, 29–37. [Google Scholar] [CrossRef]
- Chang, X.; Wang, H.; Zhang, Y.; Wang, F.; Li, Z. Bayesian prediction of tunnel convergence combining empirical model and relevance vector machine. Meas. J. Int. Meas. Confed. 2022, 188, 110621. [Google Scholar] [CrossRef]
- Wang, D.; Luo, J.; Shen, K.; Gao, L.; Li, F.; Wang, L. Analysis of the causes of the collapse of a deep-buried large cross section of loess tunnel and evaluation of treatment measures. Appl. Sci. 2022, 12, 161. [Google Scholar] [CrossRef]
- Tan, Z.; Li, S.; Yang, Y.; Wang, J. Large deformation characteristics and controlling measures of steeply inclined and layered soft rock of tunnels in plate suture zones. Eng. Fail. Anal. 2022, 131, 105831. [Google Scholar] [CrossRef]
- Hou, G.Y.; Li, Z.X.; Hu, Z.Y.; Feng, D.X.; Zhou, H.; Cheng, C. Method for tunnel cross-section deformation monitoring based on distributed fiber optic sensing and neural network. Opt. Fiber Technol. 2021, 67, 102704. [Google Scholar] [CrossRef]
- Puente, I.; González-Jorge, H.; Martínez-Sánchez, J.; Arias, P. Automatic detection of road tunnel luminaires using a mobile LiDAR system. Meas. J. Int. Meas. Confed. 2014, 47, 569–575. [Google Scholar] [CrossRef]
- Vanneschi, C.; Mastrorocco, G.; Salvini, R. Assessment of a rock pillar failure by using change detection analysis and FEM modelling. ISPRS Int. J. Geo-Inf. 2021, 10, 774. [Google Scholar] [CrossRef]
- Xu, T.; Xu, L.; Li, X.; Yao, J. Detection of Water Leakage in Underground Tunnels Using Corrected Intensity Data and 3D Point Cloud of Terrestrial Laser Scanning. IEEE Access 2018, 6, 32471–32480. [Google Scholar] [CrossRef]
- Webber-Youngman, R.; Grobler, H.; Gazi, T.; Stroh, F.; van der Vyver, A. The impact of forensic laser scanning technology on incident investigations in the mining industry. J. South. Afr. Inst. Min. Metall. 2019, 119, 817–824. [Google Scholar] [CrossRef]
- Voit, K.; Amvrazis, S.; Cordes, T.; Bergmeister, K. Drill and blast excavation forecasting using 3D laser scanning [Ausbruchprognose beim Sprengvortrieb mittels 3D-Laser scanning]. Geomech. Tunnelbau 2017, 10, 298–316. [Google Scholar]
- Otero, R.; Lagüela, S.; Garrido, I.; Arias, P. Mobile indoor mapping technologies: A review. Autom. Constr. 2020, 120, 103399. [Google Scholar] [CrossRef]
- Kang, Z.; Zhang, L.; Tuo, L.; Wang, B.; Chen, J. Continuous extraction of subway tunnel cross sections based on terrestrial point clouds. Remote Sens. 2013, 6, 857–879. [Google Scholar] [CrossRef]
- Han, S.; Cho, H.; Kim, S.; Jung, J.; Heo, J. Automated and efficient method for extraction of tunnel cross sections using terrestrial laser scanned data. J. Comput. Civ. Eng. 2013, 27, 274–281. [Google Scholar] [CrossRef]
- Yoon, J.S.; Sagong, M.; Lee, J.; Lee, K.s. Feature extraction of a concrete tunnel liner from 3D laser scanning data. NDT E Int. 2009, 42, 97–105. [Google Scholar] [CrossRef]
- Adoko, A.C.; Jiao, Y.Y.; Wu, L.; Wang, H.; Wang, Z.H. Predicting tunnel convergence using Multivariate Adaptive Regression Spline and Artificial Neural Network. Tunn. Undergr. Space Technol. 2013, 38, 368–376. [Google Scholar] [CrossRef]
- Fei, J.; Wu, Z.; Sun, X.; Su, D.; Bao, X. Research on tunnel engineering monitoring technology based on BPNN neural network and MARS machine learning regression algorithm. Neural Comput. Appl. 2021, 33, 239–255. [Google Scholar] [CrossRef]
- Grilli, E.; Menna, F.; Remondino, F. A review of point clouds segmentation and classification algorithms. Int. Arch. Photogramm. Remote Sens. Spat. Inf. Sci. 2017, 42, 339. [Google Scholar] [CrossRef]
- Remondino, F.; El-Hakim, S.; Gruen, A.; Zhang, L. Turning images into 3-D models: Developments and performance analysis of image matching for detailed surface reconstruction of heritage objects. IEEE Signal Process. Mag. 2008, 25, 55–64. [Google Scholar] [CrossRef]
- Remondino, F.; Nocerino, E.; Toschi, I.; Menna, F. A critical review of automated photogrammetric processing of large datasets. Int. Arch. Photogramm. Remote Sens. Spat. Inf. Sci. 2017, 42, 591–599. [Google Scholar] [CrossRef]
- Przylibski, T.A. Radon and its daughter products behaviour in the air of an underground tourist route in the former arsenic and gold mine in Złoty Stok (Sudety Mountains, SW Poland). J. Environ. Radioact. 2001, 57, 87–103. [Google Scholar] [CrossRef]
- Muszer, A. Gold at Złoty Stok–history, exploitation, characteristic and perspectives. Arch. Mineral. Monogr. 2011, 2, 45–62. [Google Scholar]
- Szrek, J.; Zimroz, R.; Wodecki, J.; Michalak, A.; Góralczyk, M.; Worsa-Kozak, M. Application of the infrared thermography and unmanned ground vehicle for rescue action support in underground mine—The amicos project. Remote Sens. 2021, 13, 69. [Google Scholar] [CrossRef]
- Zimroz, P.; Trybała, P.; Wróblewski, A.; Góralczyk, M.; Szrek, J.; Wójcik, A.; Zimroz, R. Application of UAV in search and rescue actions in underground mine—A specific sound detection in noisy acoustic signal. Energies 2021, 14, 3725. [Google Scholar] [CrossRef]
- Koide, K.; Miura, J.; Menegatti, E. A portable 3d lidar-based system for long-term and wide-area people behavior measurement. IEEE Trans. Hum. Mach. Syst. 2018, 16, 1729881419841532. [Google Scholar]
- Trybała, P. LiDAR-based Simultaneous Localization and Mapping in an underground mine in Złoty Stok, Poland. IOP Conf. Ser. Earth Environ. Sci. 2021, 942, 012035. [Google Scholar] [CrossRef]
- Velodyne Lidar Puck Data Sheet. Available online: https://velodynelidar.com/products/puck/#downloads (accessed on 7 December 2021).
- Riegl VZ-400i Terrestrial Laser Scanner Data Sheet. Available online: http://www.riegl.com/uploads/tx_pxpriegldownloads/RIEGL_VZ-400i_Datasheet_2020-10-06.pdf (accessed on 7 December 2021).
- Akima, H. A new method of interpolation and smooth curve fitting based on local procedures. J. ACM 1970, 17, 589–602. [Google Scholar] [CrossRef]
- Silverman, B.W. Density Estimation for Statistics and Data Analysis; Routledge: London, UK, 2018. [Google Scholar]
- De Loera, J.; Rambau, J.; Santos, F. Triangulations: Structures for Algorithms and Applications; Springer Science & Business Media: Berlin, Germany, 2010; Volume 25. [Google Scholar]
- Guibas, L.J.; Knuth, D.E.; Sharir, M. Randomized incremental construction of Delaunay and Voronoi diagrams. Algorithmica 1992, 7, 381–413. [Google Scholar] [CrossRef]
- Moore, B. Principal component analysis in linear systems: Controllability, observability, and model reduction. IEEE Trans. Autom. Control 1981, 26, 17–32. [Google Scholar] [CrossRef]
- Peter, D.H. Kernel estimation of a distribution function. Commun. Stat. Theory Methods 1985, 14, 605–620. [Google Scholar] [CrossRef]
- Silverman, B.W. Density estimation for statistics and data analysis. In Monographs on Statistics and Applied Probability; CRC Press: Boca Raton, FL, USA, 1986; Volume 26. [Google Scholar]







| Statistics | |||||||
|---|---|---|---|---|---|---|---|
| No. | Positive Deviation | Negative Deviation | Total Deviation | Roughness | Total Height | Total Width | Area |
| 1 | 13.172 | 12.881 | 26.053 | 11.239 | 2.454 | 2.949 | 6.102 |
| 2 | 4.250 | 6.120 | 10.370 | 8.160 | 2.382 | 2.831 | 5.913 |
| 3 | 2.984 | 12.852 | 15.835 | 7.871 | 2.289 | 2.878 | 5.562 |
| ... | ... | ... | ... | ... | ... | ... | ... |
| 90 | 4.016 | 14.168 | 18.184 | 11.125 | 2.384 | 2.902 | 5.570 |
| 91 | 9.192 | 25.012 | 34.204 | 10.122 | 2.312 | 2.926 | 5.405 |
| 92 | 1.304 | 13.055 | 14.359 | 8.896 | 2.336 | 2.855 | 5.469 |
Publisher’s Note: MDPI stays neutral with regard to jurisdictional claims in published maps and institutional affiliations. |
© 2022 by the authors. Licensee MDPI, Basel, Switzerland. This article is an open access article distributed under the terms and conditions of the Creative Commons Attribution (CC BY) license (https://creativecommons.org/licenses/by/4.0/).
Share and Cite
Wróblewski, A.; Wodecki, J.; Trybała, P.; Zimroz, R. A Method for Large Underground Structures Geometry Evaluation Based on Multivariate Parameterization and Multidimensional Analysis of Point Cloud Data. Energies 2022, 15, 6302. https://doi.org/10.3390/en15176302
Wróblewski A, Wodecki J, Trybała P, Zimroz R. A Method for Large Underground Structures Geometry Evaluation Based on Multivariate Parameterization and Multidimensional Analysis of Point Cloud Data. Energies. 2022; 15(17):6302. https://doi.org/10.3390/en15176302
Chicago/Turabian StyleWróblewski, Adam, Jacek Wodecki, Paweł Trybała, and Radosław Zimroz. 2022. "A Method for Large Underground Structures Geometry Evaluation Based on Multivariate Parameterization and Multidimensional Analysis of Point Cloud Data" Energies 15, no. 17: 6302. https://doi.org/10.3390/en15176302
APA StyleWróblewski, A., Wodecki, J., Trybała, P., & Zimroz, R. (2022). A Method for Large Underground Structures Geometry Evaluation Based on Multivariate Parameterization and Multidimensional Analysis of Point Cloud Data. Energies, 15(17), 6302. https://doi.org/10.3390/en15176302


