Article

Underground Mine Tunnel Modelling Using Laser Scan Data in Relation to Manual Geometry Measurements

Strata Mechanics Research Institute of the Polish Sciences Academy, Reymonta 27, 30-059 Krakow, Poland
*
Author to whom correspondence should be addressed.
Energies 2022, 15(7), 2537; https://doi.org/10.3390/en15072537
Submission received: 4 March 2022 / Revised: 21 March 2022 / Accepted: 28 March 2022 / Published: 30 March 2022
(This article belongs to the Special Issue Mining Technologies Innovative Development II)

Abstract

:
Underground mine tunnels, drifts, and mine headings are susceptible to the impact of convergence. The convergence has a big influence on further measurements such as airflow and the volume concentration of methane and other gases. In most cases, deformation of arch supports lead to getting a smaller cross-section area. A comparison is made between five methods of measuring the cross-sectional area of a mine tunnel. The reference size of the six cross-section mine drift areas were obtained by Terrestrial Laser Scanning, which were then compared with the cross-section areas obtained by four other methods. The following methods were considered: area calculation using CAD software, an empirical method, approximation by a semi-ellipse and approximation by a semi-ellipse with attached straight sections. This article presents the quantitative and qualitative differences of the obtained results. Differences in the calculated cross-sectional areas of the mine drift are discussed, and reasons for the differences are determined. In addition, the advantages and disadvantages of each method are indicated.

1. Introduction

The modelling of underground mine tunnels, drifts and mine headings is of great importance in many tasks connected with maintenance, inventory, underground transport, CFD modelling and accuracy of measurements [1,2,3]. In these tasks, the 3D models are necessary to reconstruct the measurement or inventory object. In many scientific publications, we see very simplified 3D or only 2D models which were made using technical design documentation or manual measurements [4,5]. These models can be improved by laser scanning data and a reconstruction model from a data point cloud [6]. It takes a lot of time and requires a lot of effort to make it accurate and to a satisfactory degree of simplification. If we think about monitoring of geometry, we need to keep updates in a loop after any shape change. It can be done using machine learning and automatic recognition objects from a point cloud [7]. Underground mine spaces are susceptible to the impact of convergence. The convergence has a great influence on further measurements such as airflow and volume concentration of methane and other gases. In most cases, deformations of arch supports lead to getting a smaller cross-section area, which is an important factor in any flow measurements [8].
The convergence is a result of strata mechanics caused by stress and rock deformation. Stress and deformation can be derived from mining works [9,10,11].
In mine ventilation measurements, a necessary value that characterizes the flow is the flow rate. There are several methods to determine the flow rate, including the manual traverse method, which is the most commonly used method in underground mining [12,13]. This is an indirect method, where average air velocity and cross-sectional area are measured. The product of these two values gives the flow rate. In addition to the traverse method, and mainly for accurate measurements or scientific research, the multi-spot flow velocity field measurement system (SWPPP) is used [14]. This uses a system of spaced vane anemometers in the measurement cross-sections, which helps to measure air velocity at numerous points of the cross-sections at the same time. To calculate the air flow rate with the use of the SWPPP system, it is necessary to know the exact shape of the mine tunnel where the system is placed. Usually, the outline of the mine tunnel is obtained by measuring the tunnel’s height and width and delineating the cross-section using CAD tools. Using equipment of this kind, such outlines can be drawn in several ways depending on the type of arch yielding support. In the simplest case, the cross-section outline can be approximated by a semi-ellipse, and in a slightly more complex case, by a semi-ellipse with attached straight sections. In the latter case, it is necessary to know the length of the straight sections or to take nominal lengths. The most complex case of delineation of the cross-section involves using the manufacturer’s standards and catalog data and taking into account changes in the shape of the mine tunnel due to clamping [15]. The Creo Parametric software used by the authors allows one to define nodes between individual elements of the arch yielding support and to define moving dimensions, which, based on the many dependencies between individual elements of the arch, can be determined by the software. As a reference method, the use of laser scanning and point cloud processing tools is adopted. In many cases, the typical methods of measuring cross-sections in mines fail because of the large uncertainties. The source of these errors can be found in the strata forces which act on the arch yielding support [16]. The forces depend on the particular place in the mine: closer to the excavation process, the forces and strata tension are normally much greater. In the present case, we consider a ventilation tunnel which is sufficiently far from the main excavation area.
Information about the real shape and proper cross-sectional area of the mine tunnel are also very important in Computer Fluid Dynamics of air flow in the underground mine environment [17,18,19,20]. Proper cross-sectional area determination is necessary to obtain correct results of the numerical simulations. Very often, CFD simulations of air flow are carried out on simplified models. These simplifications consist of assuming the same cross-sectional area in the entire numerical model [21].
Constant development of new technologies has resulted in the proliferation of methods that were previously restricted to a small group of specialists. One example of this type of technology is Terrestrial Laser Scanning (in short TLS). The very fast determination of X, Y and Z point coordinates, called point cloud, is used to get the image of an object. From the spatially oriented point cloud obtained during the scanning process, it is possible to generate a scanned object 3D model. Development of the post-processing software has made the processing of such a large amount of data more efficient.
The capabilities of this technology, in conjunction with the CAD systems, create new possibilities. It is commonly used for land surveying to visualize changes taking place in the field [22,23], deep tunnels’ evolution [24,25,26] and deformation of large-size devices such as wind turbine towers [27]. It can be in combination with a 3D printing technology to reproduce the actual shape of the object at a reduced scale [28,29]. This combination was used in [30] to reproduce the historical building ornamental components. It is also used in underground mining to observe temporary evaluation and changes of mine tunnels’ geometry over time [31]. Another application of this technology is its use in CFD modelling. Accurate information about the shape of mine drift, in the form of a point cloud, was used in [32] to design the actual shape of the tested object. This work also presents differences in simulation results on simplified model geometries, the design of which was possible using the laser scanning technology. The combination of laser scanning technology with Virtual Reality gives even greater possibilities. Authors of work [33] show how effectively those technologies can improve mining safety.
In this article, the authors decided to use laser scanning technology to determine the exact cross-sectional area of a mine drift. These data were used to compare with the results of determining the cross-sectional area using other methods. This article presents the quantitative and qualitative differences of the obtained results.

2. Measurements of Mine Tunnel Geometry Using Terrestrial Laser Scanning

The functioning of a laser scanner is based on the phase method of measuring distances, based, in turn, on the properties of the wave emitted by the laser. The instrument emits a laser beam of known frequency, which—after meeting the object—comes back to the instrument. The phase of the returning light is compared with the phase of the known frequency. The difference between the two peak values is called the phase shift.
This is a polar measurement method, in which the location of a given point is determined by means of the horizontal and the vertical angle, as well as the distance from the measuring point. The angles are determined from the location of the mirrors scattering the laser beam. To establish the location of the point P, one has to know the length of the ray ρ, and the values of the angles α and ß (as illustrated in Figure 1). The scanners used to measure the phase shift are among the most accurate instruments for laser scanning intended for commercial purposes, as they make it possible to obtain the desired data very quickly, and generate scans with a very high resolution.

2.1. Measuring Device

For measurements of a mine drift geometry, the FARO Focus 3D laser scanner was used [34]. The range of the instrument is 0.6–120 m; the laser beam falls at an angle of 90° on a surface whose reflectance is 90%. The scanner is capable of a high speed of measurement, from 120,000 to 980,000 points/s, depending on the scanning resolution. Uncertainty of measurement is ±0.002 m [35]. The scanning visual range of the device is 360° in the horizontal axial and 305° in the vertical axial with a wavelength of over 900 nm and beam divergence 0.16 mrd. During the measurements, data of the scanned points’ coordinates are saved on a portable disk and can therefore be transferred to a computer easily.

2.2. The Measurement Site

Measurements using the 3D scanner were performed in the ZG Sobieski mine, in the Grodzisko cross-cut gallery, level 300. The measurement site was chosen in the neighborhood of a turn, which gave the researchers wide-ranging measurement possibilities.
The mine tunnel was secured with 8-KS/KO-21 type arch supports. Due to the complex structure of the mine tunnel, authors had to choose appropriate places for the 3D laser measurements [36,37,38]. For the best mapping of the mine tunnel geometry, a double scanning site in the object’s cross-section was established. The scanning sites were placed at the left and the right side of the mine tunnel, which minimizes the areas where no scanning was performed. Next, authors had to place the appropriate number of markers along the mine tunnel, thanks to which, in the preprocessing process, it was possible to combine subsequent scans placing them at a chosen set of coordinates. To obtain a full spatial model of the mine tunnel, the whole section of the gallery was divided into 11 scanning cross-sections, which resulted in 22 measurement sites. The first scanning cross-section was 23 m before the bend, and the last was 56 m after the bend (Figure 2).
In situations where the floor is flat, 3D scanner can be placed on a special autonomous guided vehicle [39].

2.3. Processing of Laser Scanning Data

First stage of point cloud processing was preprocessing. As a part of the measurement data processing, the data had to be prepared for further use. The most important process of this stage was the point cloud’s connection into one set of data. Obtained point cloud was filtered, which involved cleaning and removal of all measurement errors.
As a result of mine tunnel geometry laser scanning and point cloud preprocessing, a very detailed, digital mapping of the whole space of the scanned mine tunnel section was obtained, comprising over 150,000,000 points (Figure 3).
During the measurements of the mine tunnel geometry, it was decided to divide the relevant part of the mine tunnel into three sections:
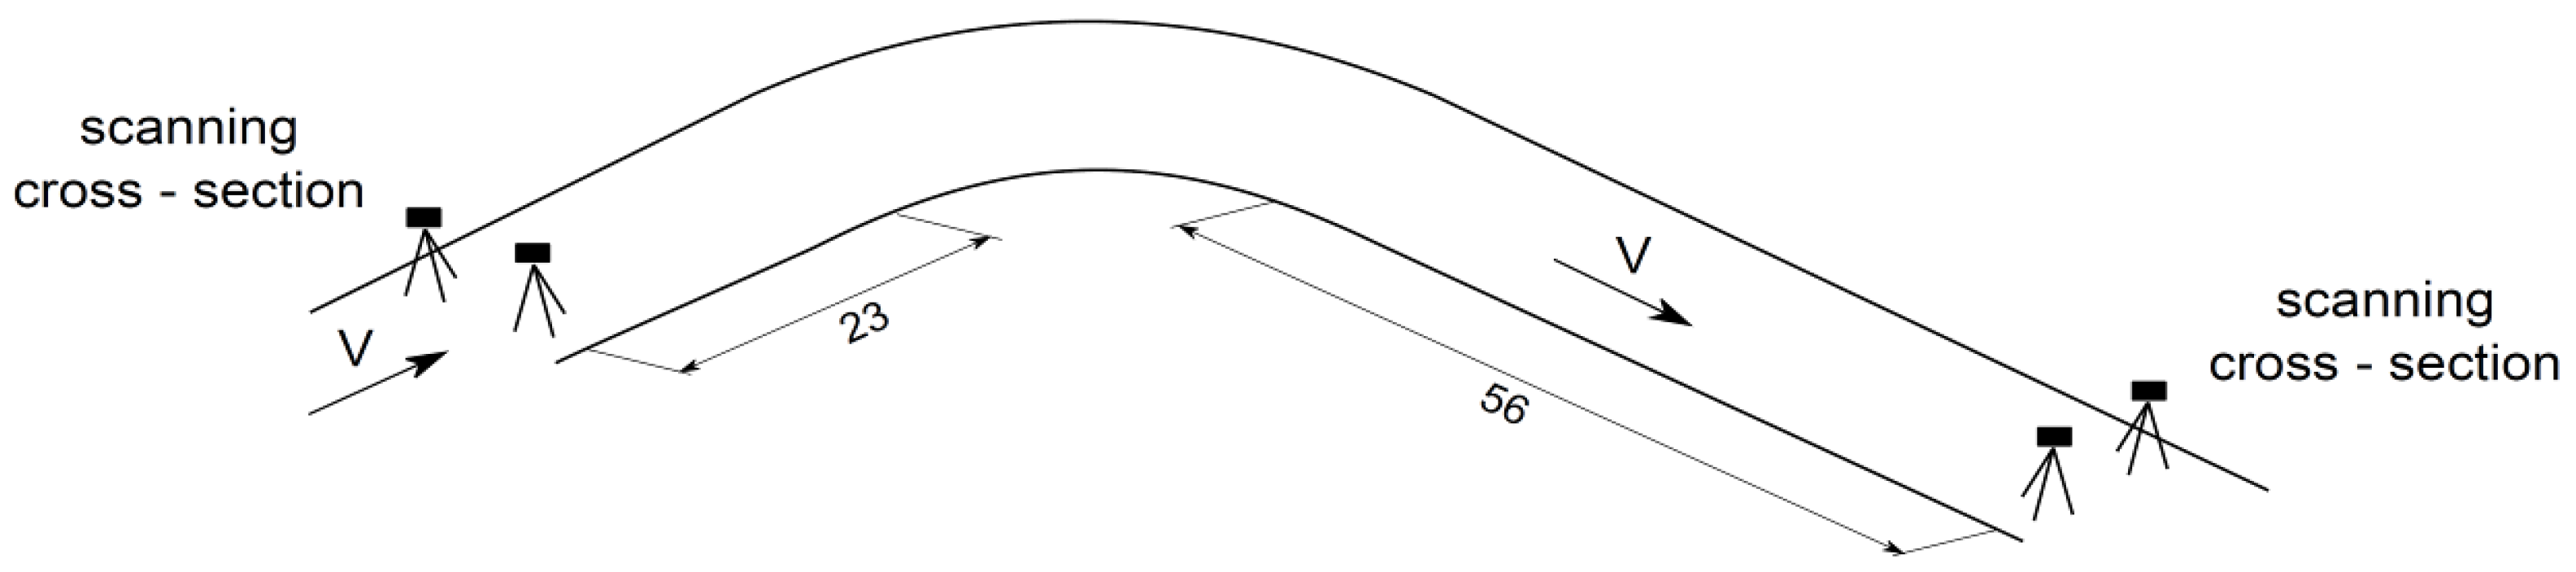
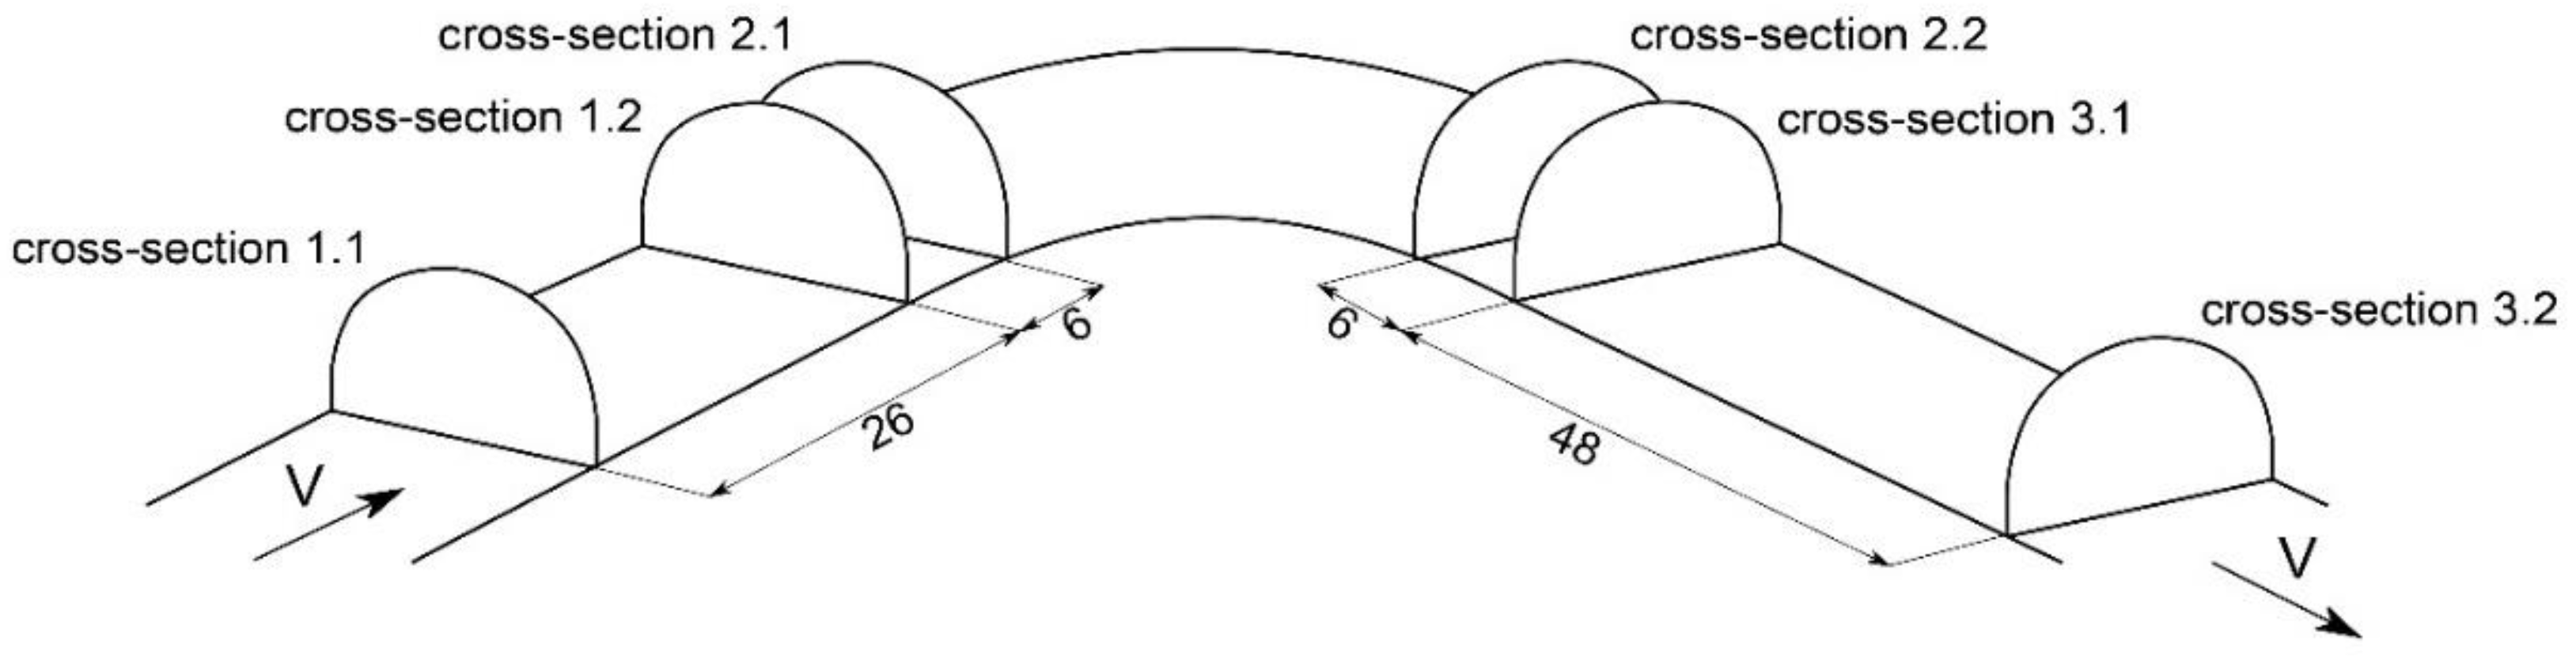
Section 1, before the turn;
Section 2, the turn;
Section 3, after the turn.
In each section, the authors chose two cross-sections for further analysis, the first cross-section at the beginning of the section and second at the end of the section (Figure 4). The reason for choosing measurement cross-sections was the fact that the distance between sections reached tens of meters. The cross-sections from Section 1 were located 29 m and 6 m before the turn. The cross-sections from Section 2 were at the entrance to and exit from the turn. The cross-sections from Section 3 were located 6 m and 54 m after the turn. Standard measurements of the mine tunnel’s height and width were taken.

3. Methods of Determining the Cross-Section Area of the Mine Tunnel

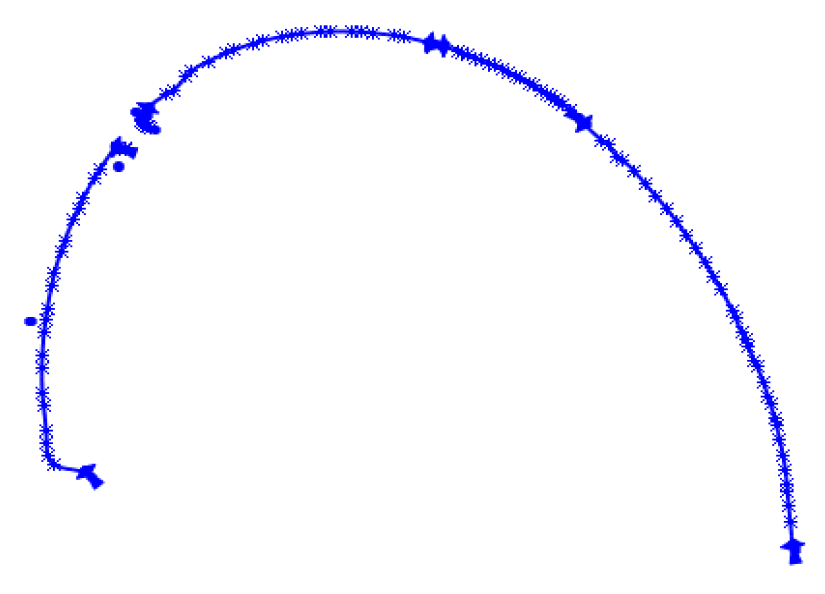
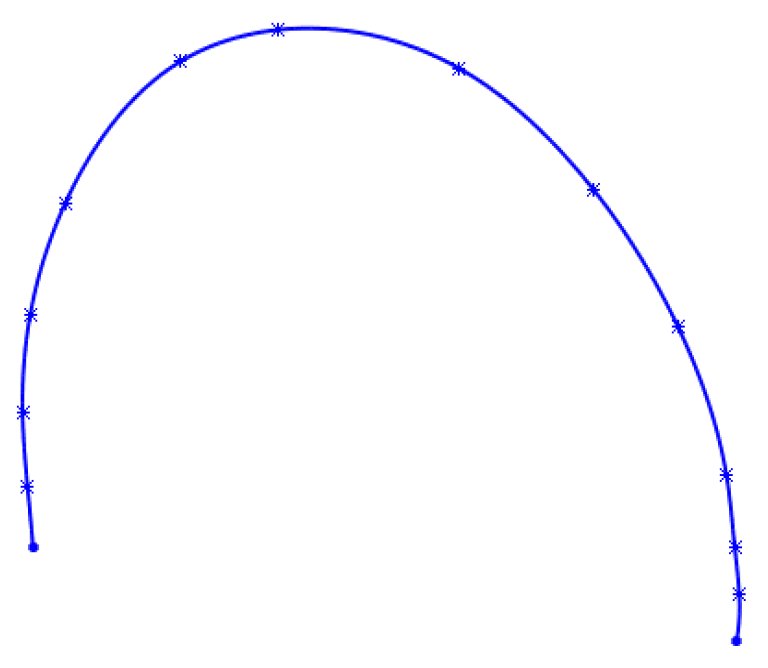
3.1. Reconstruction with Use of Point Cloud

To obtain accurate data on the mine tunnel’s cross-sectional area in selected measurement cross-sections, it was necessary to use reverse engineering [40,41], widely described in [17,42].
As a result of irregular deformation of the arch yielding supports, it was necessary to make cross-sections for each arch. This operation involves defining the vertical cross-section through the center of each arch. Next, the cross-section curve, consisting of several lines connecting the triangles obtained in the process of triangulation, was obtained (Figure 5). To obtain an accurate shape of the arch, based on the cross-section curve, the cross-section line was determined (Figure 6). Analogously, the shape line of the arch was determined using the horizontal cross-section. Using the “swept surface” function in the CAD software, after defining the arch shape line as a sketch profile and the cross-section line as a circular profile, it was possible to create the geometry of the arch support (Figure 7).
The floor and rails were mapped analogously to the arches. After obtaining the cross-section curves, the cross-sectional lines and shape lines of the floor and rails were determined, respectively. In the case of pipelines, a leading line was determined to map the arrangement of elements in the mine tunnel. Then, using the “swept surface” CAD function, the geometries of the floor, rails and pipelines were created.
As a result, the geometry of the 3D model was obtained with the exact representation of the shape of the real object (Figure 8), and with the exact values of the cross-sectional areas in the three measured cross-sections.

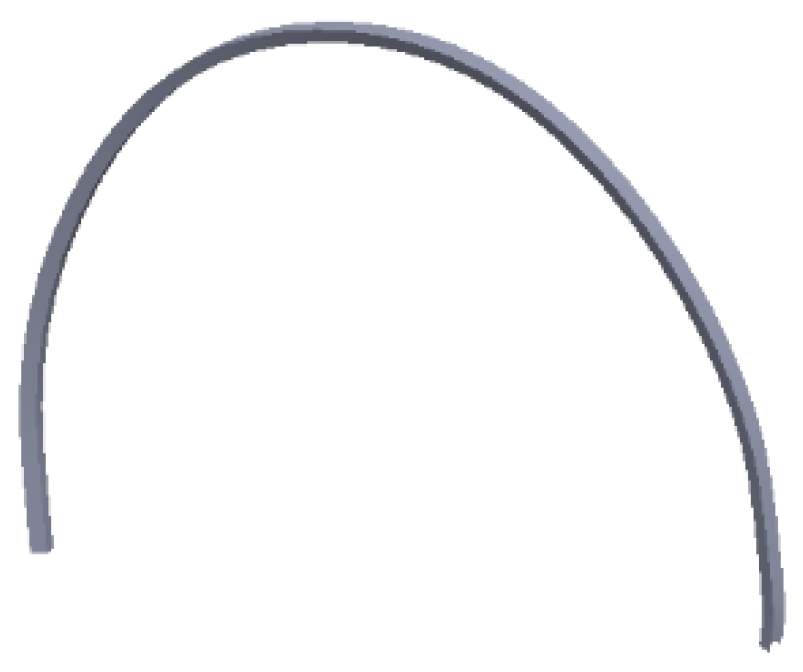
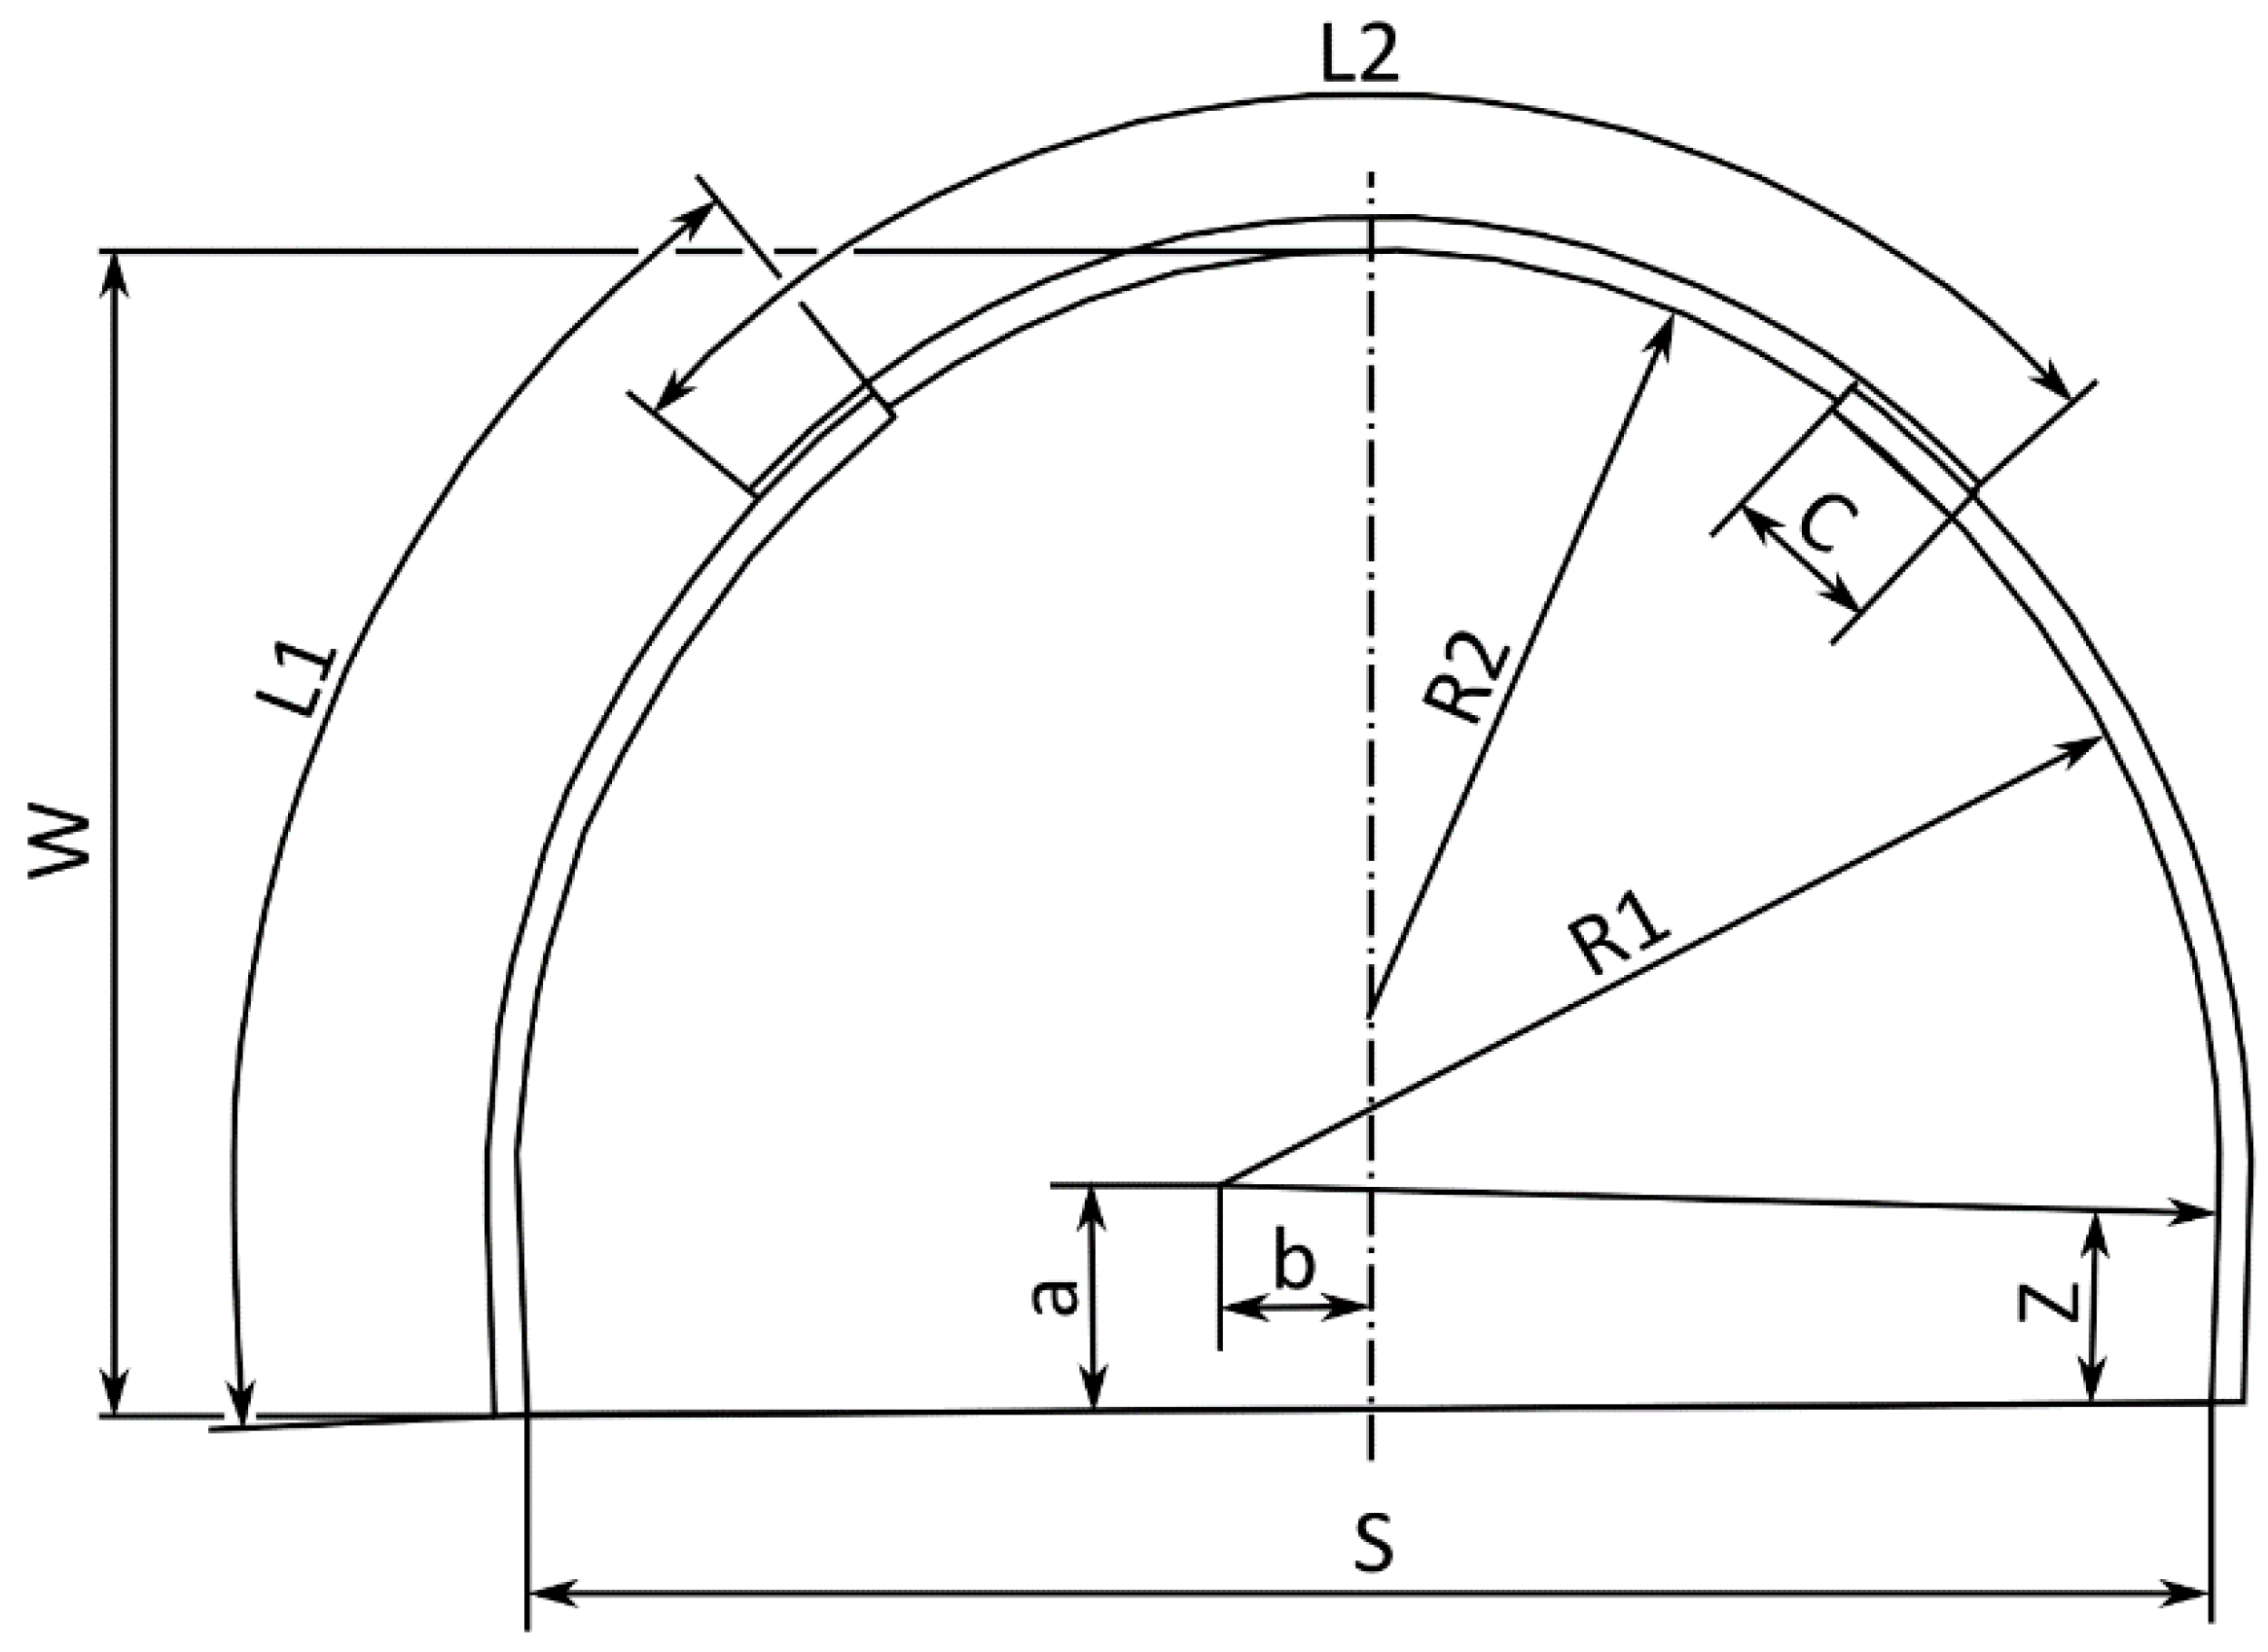
3.2. The Area as a Result of Parametric Sketch and Integration Method Using CAD

Usually, to calculate the air flow rate, it is necessary to reconstruct the shape of the mine tunnel at the place where the measurements were carried out with the SWPPP system. Then, catalog data, such as the length of the arch yielding support, are used and adapted in accordance with the susceptibilities of the supports.
For approximation of the shape of the cross-section, catalog data from the manufacturer of ŁP arch yielding supports with KS/KO sections were used (Figure 9). ŁP arch yielding supports were made according to the PN-G-15001:1973 standard [43]. The table below contains data corresponding to the analyzed case.
According to the catalog data (Table 1) the nominal width and height of this arch are 4.7 m × 3.3 m. Based on catalog data and the ability to define nodes and moving dimensions, the outlines of the cross-section area were delineated. Moving dimensions were limited values. The lengths of curves C and Z were taken as variable values. The input values were the height and width of the mine tunnel measured on the reference outline. The width was measured at a height 0.8 m under the floor. The floor was delineated as a straight line, due to the lack of sufficient information about its shape. The height was measured from the floor to the highest point on the arch.
where:
  • S—width of the arch
  • W—height of the arch
  • R1—radius of the side part of the arch
  • L1—length of the side part of the arch
  • Z—length of the straight section of the side part of the arch
  • R2—radius of the roof part of the arch
  • L2—length of the roof part of the arch
  • C—length of the arch’s tab
  • a, b—center coordinates of the arch’s side part. These values depend on the height and width during fitting of the arch to the actual shape of the mine tunnel

3.3. Analytical Methods

Methods of approximation of cross-sectional areas were analyzed in terms of accuracy relative to the reference method, namely the reconstruction of the real shape of the arch from many points obtained by the laser scanning method. Of the methods considered below, only the empirical method is used in daily ventilation measurements. The remaining methods are used for more complex air flow rate measurements, as in the SWPPP system. All of these methods, other than the empirical method, can be used to reconstruct the shape of a mine tunnel for the purpose of CFD numerical calculations.

3.3.1. Empirical Method

The most frequently used method for calculating cross-sectional areas in underground mining involves measuring the mine tunnel’s height and width, and multiplying their product by 0.8 [44]. The value 0.8 results from the shape of the arch yielding support, and is therefore called the cross-sectional shape coefficient. The height of the mine tunnel is measured in the middle of the tunnel’s width, from the highest point on the arch to the corresponding point on the floor. The width is measured by placing measuring points on the straight section of the side part of the arch. In some cases, just a part of the straight section is above the floor, and it sometimes happens that this straight section is much shorter or completely inaccessible. This makes it difficult to perform the measurement properly, and increases the uncertainty of the result.
A g = 0.8 H W
where:
  • H—height of mine tunnel
  • W—width of mine tunnel

3.3.2. Approximation by a Semi-Ellipse

Comparing the equations for the empirical method and the method based on approximation by a semi-ellipse, it is readily seen that they differ only in the cross-sectional shape coefficient: for the empirical method the coefficient is 0.8, and for approximation by a semi-ellipse the coefficient is 0.785.
At many measuring sites, it is found that a coefficient lower than 0.8 is more accurate in calculating the cross-sectional area. This applies to places with high rock stress, for example in walls. The relationship between the floor height and the cross-sectional shape coefficient is shown in the graph below. The floor height is understood as the depth of the arch’s side part in the floor.
Figure 10 shows the direction of change in the cross-sectional shape coefficient. It shows that approximation by a semi-ellipse should give better results in places with a higher floor. This applies to places where the side part of the arch is completely embedded in the floor. The equation for approximation by a semi-ellipse is given below.
A e = 1 4 π H W
where:
  • H—height of mine tunnel
  • W—width of mine tunnel

3.3.3. Approximation by a Semi-Ellipse with Attached Straight Sections

This method improves the approximation based on a semi-ellipse by moving the minor axis of the ellipse up to the level where the straight sections end. The lower part of the cross-section is approximated by a rectangle. Here, the straight sections are assumed to be parallel to each other, which is not the case with the ŁP arch yielding supports. Therefore, the approximation of this section by a rectangle gives rise to certain errors in this method. Greater accuracy would be obtained with approximation by a trapezoid.
The cross-section’s outline is approximated by a curve consisting of a semi-ellipse with straight sections attached at the ends.
A e z o p = 1 4 π W ( H Z ) + W Z
where:
  • H—height of mine tunnel
  • W—width of mine tunnel
  • Z—length of straight section of side part of arch
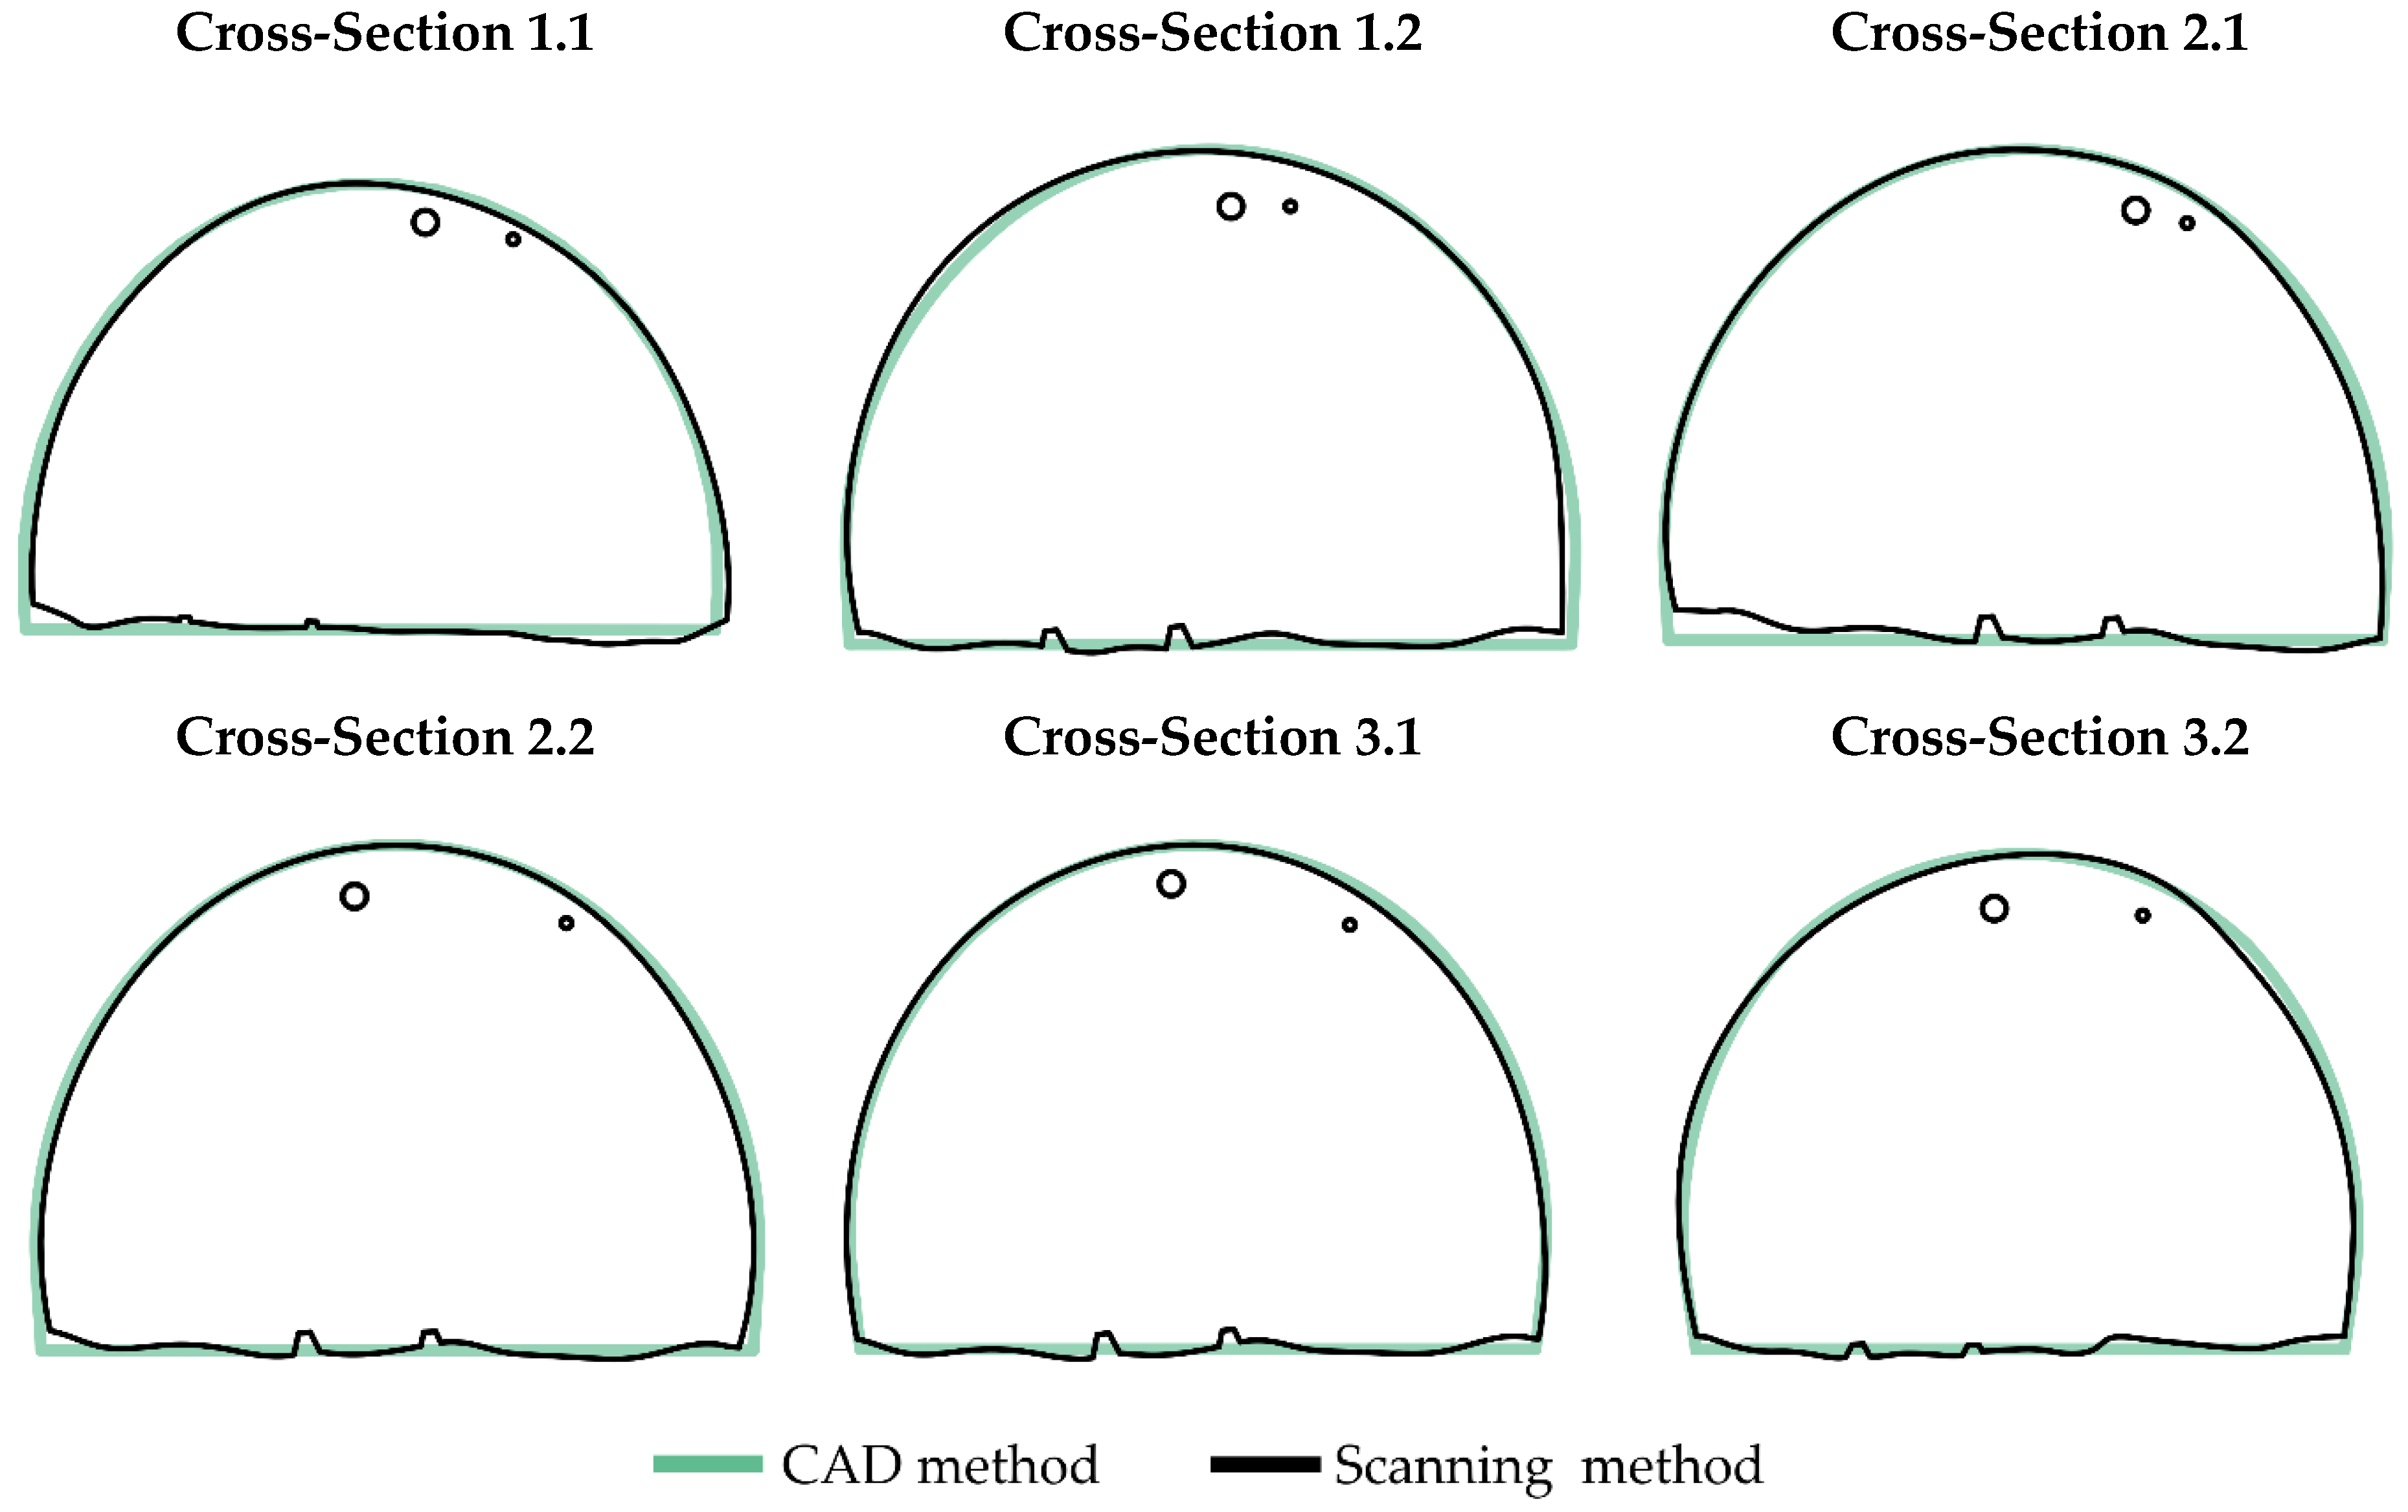
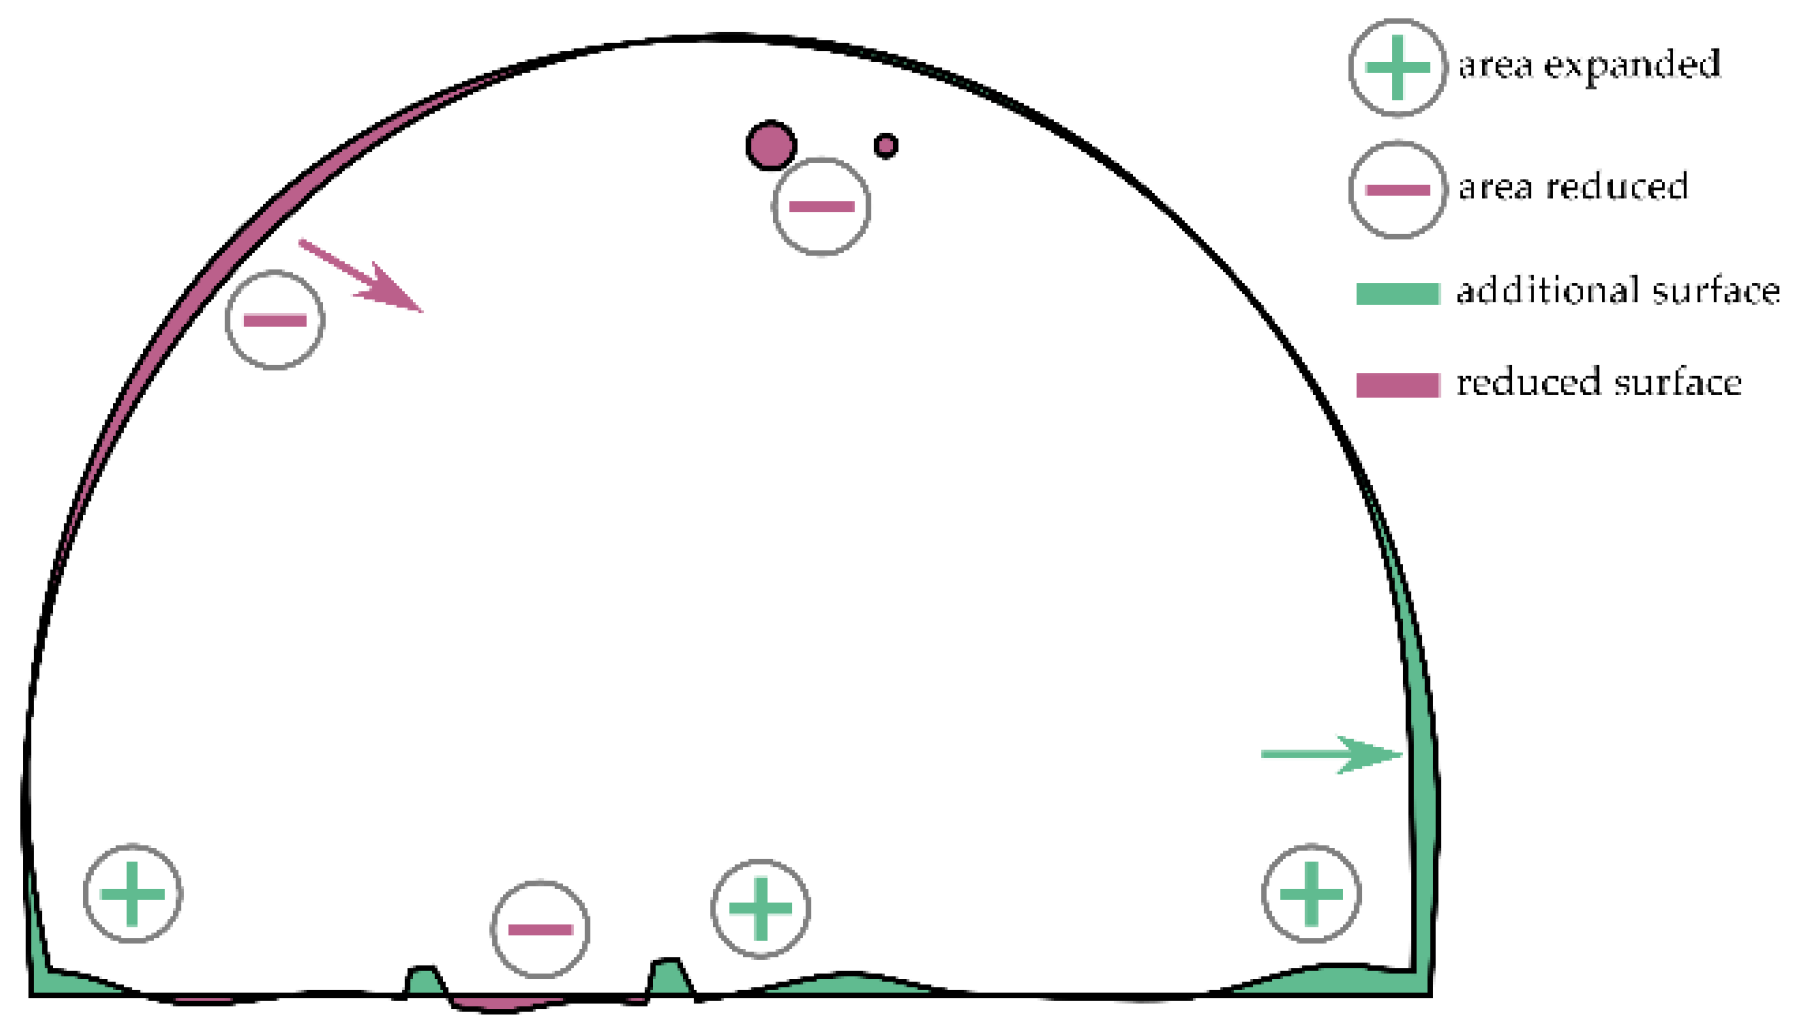
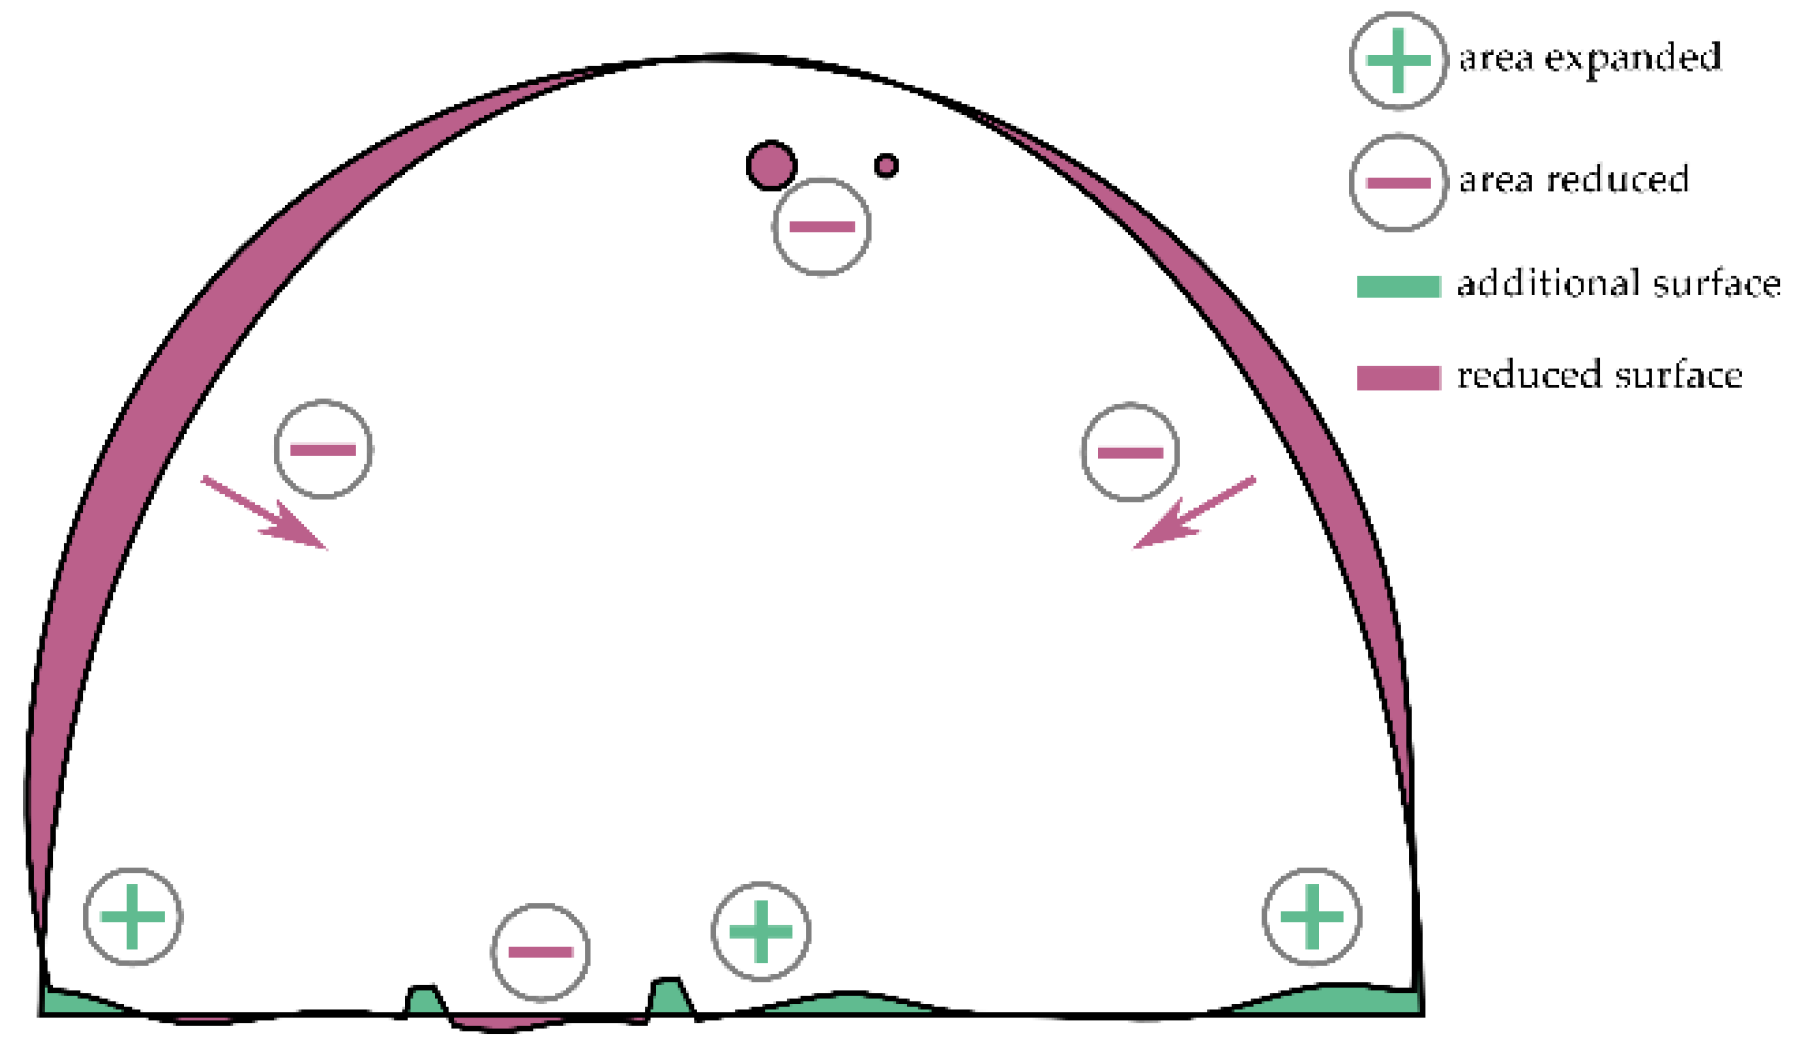
The value of Z was taken to be the nominal value of the straight section for the arch type 8-KS/KO-21, which, according to Table 1, is 0.5 m.

4. Results

Six outlines of cross-sections were obtained using the laser scanning method. Figure 11 shows the shape of each cross-section. On each of them, a nominal outline was marked according to the considered arch type (Table 1).
Table 2 and Table 3 give the results of cross-sectional area measurements calculated by four different methods. Each case was compared with the reference cross-sectional area obtained by laser scanning. The results include the cross-sections of the pipelines under the roof. The total cross-sectional area of the pipelines is 0.048 m2. This does not cause a significant difference in the cross-section of the mine tunnel; however, comparison of the results with the cross-sectional area obtained by laser scanning required their inclusion.
Figure 12, Figure 13 and Figure 14 show differences in the shape of cross-section 1.2. The differences are given for three methods: the CAD method (using catalog data), approximation by a semi-ellipse, and approximation by a semi-ellipse with attached straight sections. Using the empirical method, it was not possible to obtain outlines of cross-sections because there is no defined shape. In each of the figures, fragments that increase and decrease the result obtained for the cross-sectional area are marked. Regions that increase the cross-sectional area are marked in a green color, and those that decrease the cross-sectional area in a purple color.
Figure 12, Figure 13 and Figure 14 show a common feature: an identically mapped roof. In application of the surface, the symmetry line of cross-sections was used. This line was imposed on the symmetrical section connecting the top of the right and left part of the walls. Vertically, points were placed at the maximum height. This positioning of the two surfaces causes the bottom line to be determined at the same level in the case of each of the cross-sections.
Table 4 shows that out of the four methods analyzed, the smallest differences compared with the scanning method were obtained for the CAD method. It should be noted that the result obtained by this method was larger than the reference result, while in the other cases the results were smaller.
To present a quantitative assessment of used determining the cross-section area methods a decision was made to use a mean relative error measure, which is a sum of relative errors at each cross-section (Table 4) divided by the number of cross-sections:
δ ś r = 1 n i = 1 n | x x 0 | x 100 %
where:
  • n —cross-section number
  • x —calculated cross-section area using CAD and analytical methods
  • x 0 —measured cross-section area using scanning method
The results of mean relative errors, shown in Table 4, shows that the biggest differences of calculated cross-section area in competition with cross-section area measured by scanning methods is for approximation by a semi-ellipse method. The reason for such a result reaching almost 5% is bad representation of arch supports (Figure 13). The smallest differences of calculated cross-section area in competition with cross-section area measured by scanning methods is for approximation by a semi-ellipse method with attached straight sections and it is exactly 1.27% (Table 5).
Each method has some degree of difficulty in applying them. The easiest is empirical in which we can easily calculate the result during the measurements. The simple ellipse method is also easy to calculate, but it gives less accurate results. The method of ellipse plus straight sections is a reasonable compromise between more demanding methods and accuracy. The CAD method is only post-factum to use; it demands CAD software, and we need to know the arch type and choose the proper standard to draw the sketch of it. The most demanding and complicated method is the laser scanning method. It obviously demands a special device (laser scanner) and sometimes special permission for its use. Therefore, it is not possible to use it in every place of the mine and at all times. The laser scanning method gives the most accurate results and it can be applied to measure complicated cross-sections, especially in places where the convergence is significant. It works well as a reference method for comparing different measurement methods.
Comparing these results with the shape of chosen cross-sections, we noticed that all methods, except the scanning method, have problems with reflecting the correct shape of the arch support where any deformations appear (for example cross-section 3.2). The floor in these methods is always a straight line, so any unbalancing deformations increase measurement uncertainty.

5. Conclusions

Each of the presented methods is susceptible to inaccuracies caused by deformation of the arch supports and floor. The outline of the mine tunnel can be approximated using the semi-ellipse method, which gives a better approximation than the empirical method. In the analyzed cross-sections, the difference was reduced by more than half. The best approximation, however, is given by the CAD method. It is expected that the cross-sectional area measured by this method will be higher than the true value, because of the rock mass pressure on the arches. It is helpful to use nodes to determine the relationship, for example, the condition of contact at the connection of the arch’s side part and roof part, and the symmetry condition of the arch. This makes it possible to adjust the nominal height and width of the arch and automatically adjust the remaining dimensions. The results show differences between methods at maximum level 5.9% by the semi-ellipse approximation method according to the laser scanning method. This level of differences in determining of the mine tunnel cross-section area can gradually extend depending on the deformation degree of the object geometry.
The smallest differences between the scanning method and four other methods is for the CAD method and semi-ellipse approximation method with attached straight sections.
It is common in every method to reconstruct the floor shape as a straight line. In many cases this is not sufficient. To improve the accuracy of determination of the cross-sectional area in case of a deformed floor, the floor height can be included. This leads to adjustment of the length of the straight parts of the arch and allows better shape reconstruction.
Considering the time of carrying out the measurement and calculations determining the mine drift cross-sectional area, it is justified to use CAD methods. However, a decision should be made each time to choose the appropriate method. This decision should be dictated by the degree of mine drift deformation.

Author Contributions

Conceptualization, J.J. and P.O.; Methodology, J.J. and P.O.; Software, J.J. and P.O.; Validation, J.J. and P.O.; Formal Analysis, J.J. and P.O.; Investigation, J.J. and P.O.; Resources, J.J. and P.O.; Data Curation, J.J. and P.O.; Writing—Original Draft Preparation, J.J.; Writing—Review and Editing, J.J. and P.O.; Visualization, J.J. and P.O.; Supervision, J.J.; Project Administration, J.J.; Funding Acquisition, J.J. All authors have read and agreed to the published version of the manuscript.

Funding

This paper is financed from the statutory funds of the Strata Mechanics Research Institute of the Polish Sciences Academy.

Institutional Review Board Statement

Not applicable.

Informed Consent Statement

Not applicable.

Data Availability Statement

Not applicable.

Acknowledgments

This paper presents results of the statutory research of the Strata Mechanics Research Institute of the Polish Sciences Academy.

Conflicts of Interest

The authors declare no conflict of interest.

References

  1. Hasheminasab, F.; Bagherpour, R.; Aminossadati, S.M. Numerical simulation of methane distribution in development zones of underground coal mines equipped with auxiliary ventilation. Tunn. Undergr. Space Technol. 2019, 89, 68–77. [Google Scholar] [CrossRef]
  2. Wang, X.; Kulatilake, P.; Song, W.-D. Stability investigations around a mine tunnel through three-dimensional discontinuum and continuum stress analyses. Tunn. Undergr. Space Technol. 2012, 32, 98–112. [Google Scholar] [CrossRef]
  3. Wang, X.; Cai, M. Numerical modeling of seismic wave propagation and ground motion in underground mines. Tunn. Undergr. Space Technol. 2017, 68, 211–230. [Google Scholar] [CrossRef]
  4. Mo, S.; Sheffield, P.; Corbett, P.; Ramandi, H.L.; Oh, J.; Canbulat, I.; Saydam, S. A numerical investigation into floor buckling mechanisms in underground coal mine roadways. Tunn. Undergr. Space Technol. 2020, 103, 103497. [Google Scholar] [CrossRef]
  5. Ozturk, C. Support design of underground openings in an asphaltite mine. Tunn. Undergr. Space Technol. 2013, 38, 288–305. [Google Scholar] [CrossRef]
  6. Xie, H.; Zhao, J.; Zhou, H.; Ren, S.; Zhang, R. Secondary utilizations and perspectives of mined underground space. Tunn. Undergr. Space Technol. 2020, 96, 103129. [Google Scholar] [CrossRef]
  7. Gallwey, J.; Eyre, M.; Coggan, J. A machine learning approach for the detection of supporting rock bolts from laser scan data in an underground mine. Tunn. Undergr. Space Technol. 2021, 107, 103656. [Google Scholar] [CrossRef]
  8. Jiang, Q.; Zhong, S.; Pan, P.-Z.; Shi, Y.; Guo, H.; Kou, Y. Observe the temporal evolution of deep tunnel’s 3D deformation by 3D laser scanning in the Jinchuan No. 2 Mine. Tunn. Undergr. Space Technol. 2020, 97, 103237. [Google Scholar] [CrossRef]
  9. Xue, Y.; Liu, J.; Ranjith, P.G.; Zhang, Z.; Gao, F.; Wang, S. Experimental investigation on the nonlinear characteristics of energy evolution and failure characteristics of coal under different gas pressures. Bull. Eng. Geol. Environ. 2022, 81, 38. [Google Scholar] [CrossRef]
  10. Kukutsch, R.; Kajzar, V.; Konicek, P.; Waclawik, P.; Ptacek, J. Possibility of convergence measurement of gates in coal mining using terrestrial 3D laser scanner. J. Sustain. Min. 2015, 14, 30–37. [Google Scholar] [CrossRef] [Green Version]
  11. Khalymendyk, I.; Baryshnikov, A. The mechanism of roadway deformation in conditions of laminated rocks. J. Sustain. Min. 2018, 17, 41–47. [Google Scholar] [CrossRef]
  12. Dziurzyński, W.; Skotniczny, P.; Krawczyk, J.; Gawor, M.; Pałka, T.; Ostrogórski, P.; Kruczkowski, J.; Janus, J. Wytyczne Rozmieszczenia Anemometrów Stacjonarnych Wzdłuż Długości Wyrobiska Kopalni Jak I W Samym Polu Przekroju Poprzecznego Wyrobiska. In Zasady Pomiarów Przepływów Powietrza W Wyrobiskach Kopalnianych. Wybrane Sposoby Kontroli I Kalibracji Przyrządów Pomiarowych; Strata Mechanics Research Institute of the Polish Academy of Sciences: Kraków, Poland, 2017. [Google Scholar]
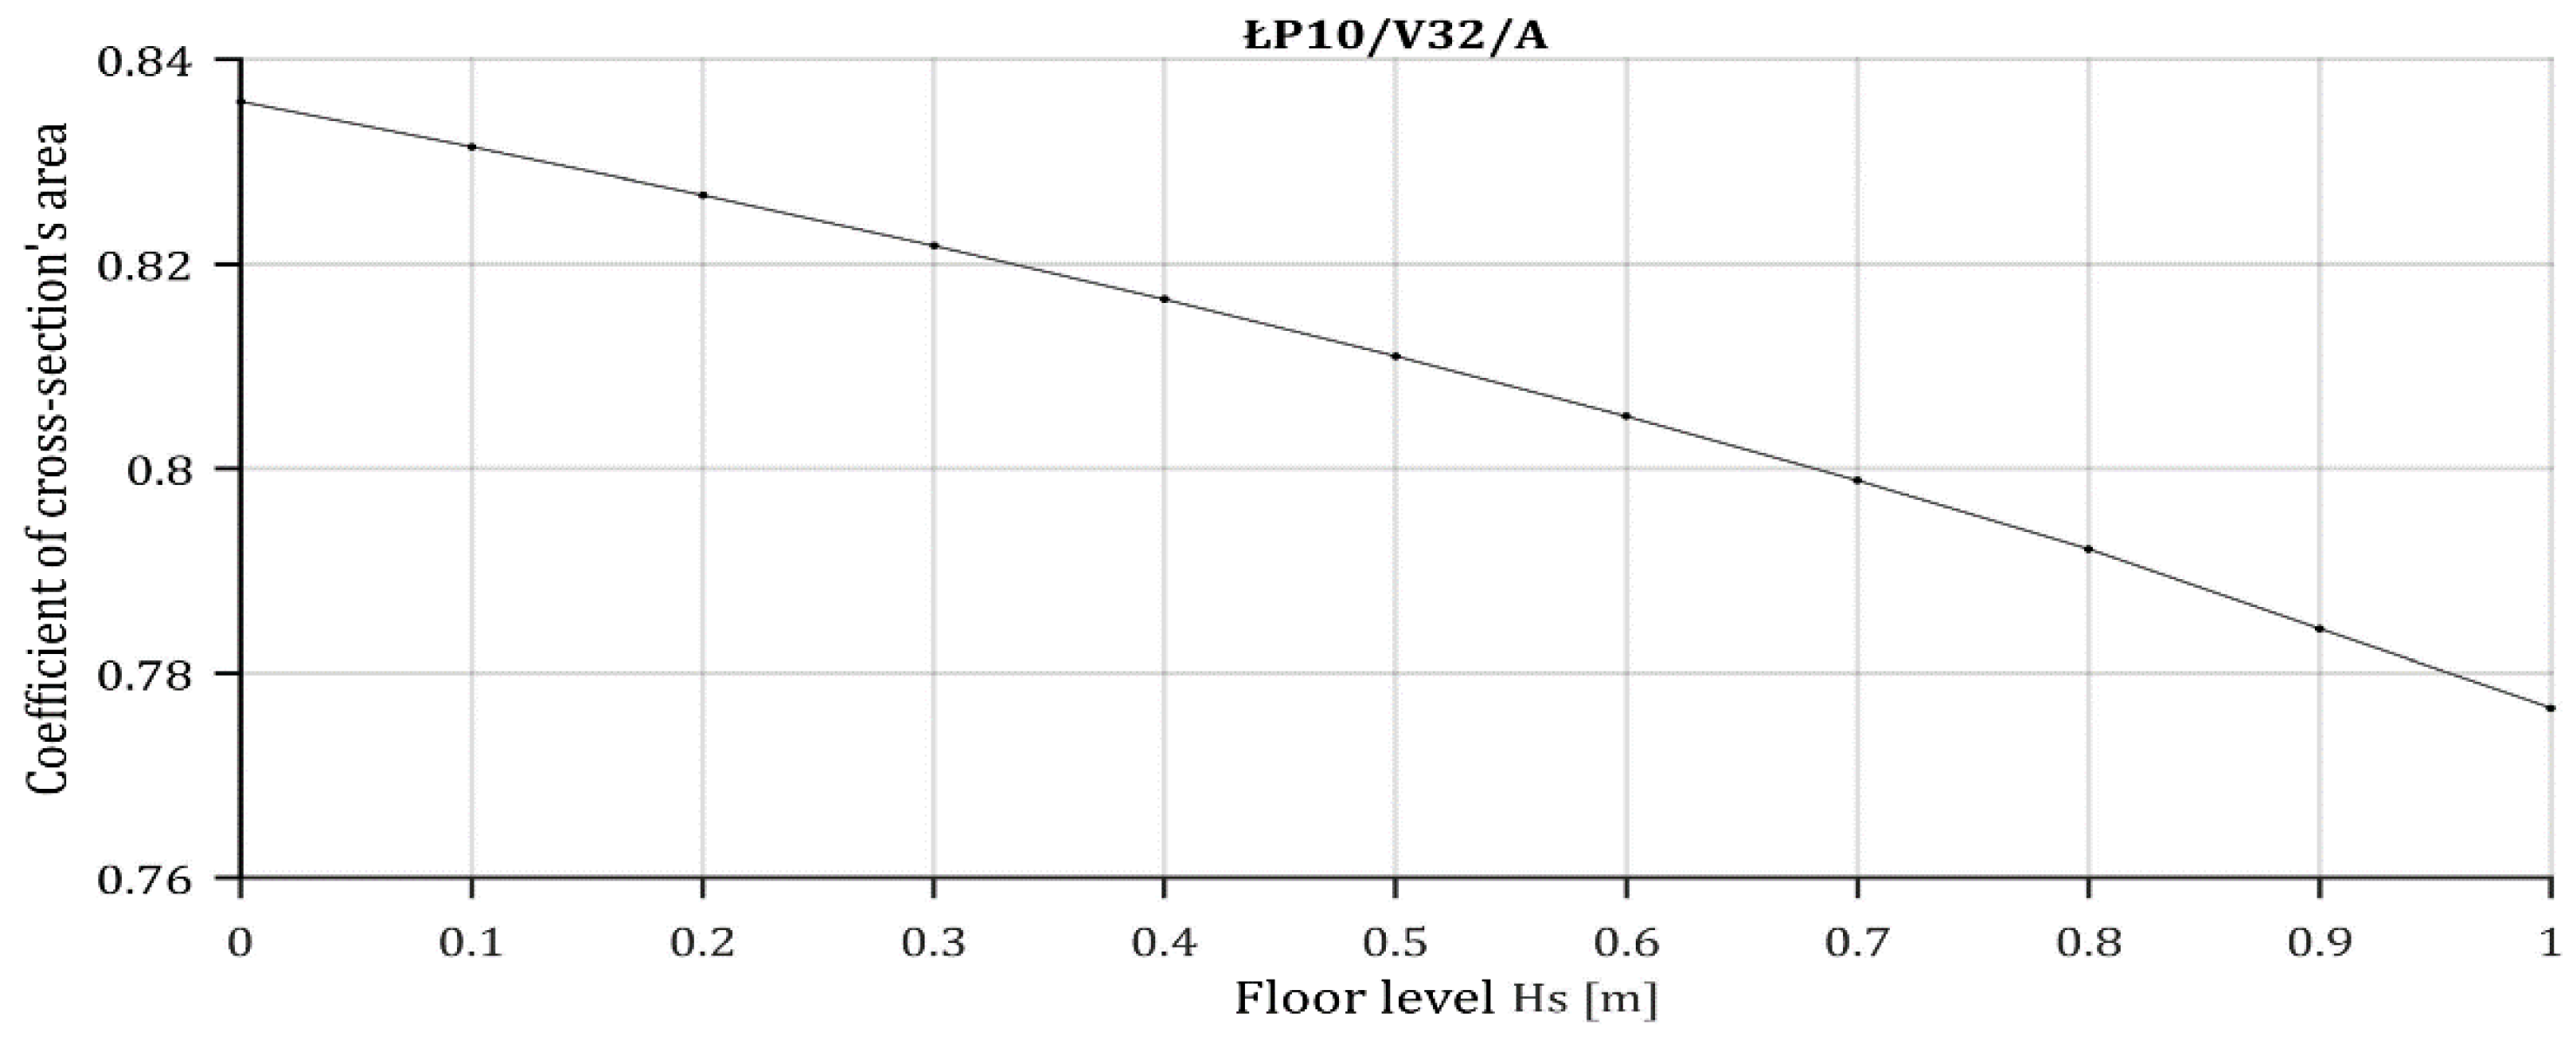
  13. Ostrogórski, P. Consideration of the shape and height of the floor in result of measuring the cross-sectional area for rings type ŁP. Trans. Strata Mech. Res. Inst. 2015, 17, 1–2. [Google Scholar]
  14. Krach, A.; Krawczyk, J.; Kruczkowski, J.; Pałka, T. Variability of the velocity field and volumetric flow rate in air ways of underground mines. Arch. Min. Sci. 2006, 1. [Google Scholar]
  15. Walentek, A.; Janoszek, T.; Prusek, S.; Wrana, A. Influence of longwall gateroad convergence on the process of mine ventilation network-model tests. Int. J. Min. Sci. Technol. 2019, 29, 585–590. [Google Scholar] [CrossRef]
  16. Pytlik, A. Comparative bench testing of steel arch support systems with and without rock bolt reinforcements. Arch. Min. Sci. 2019, 64, 4. [Google Scholar]
  17. Janus, J. The Application of Laser Scanning in The Process of Constructing A Mine Drift Numerical Model. In Proceedings of the 24th World Mining Congress-Underground Mining, Brazilian Mining Association, Rio de Janeiro, Brazil, 18–21 October 2016. [Google Scholar]
  18. Janus, J. Modelling of Flow Phenomena in Mine Drifts Using the Results of Laser Scanning. Ph.D. Thesis, Strata Mechanics Research Institute of Polish Academy of Sciences, Kraków, Poland, 2018. [Google Scholar]
  19. Wierzbiński, K. Wpływ geometrii chodnika wentylacyjnego i sposobu jego likwidacji na rozkład stężenia metanu w rejonie wylotu ze ściany przewietrzane sposobem U w świetle obliczeń numerycznych CFD. Zeszyty Naukowe Instytutu Gospodarki Surowcami Mineralnymi i Energią Polskiej Akademii Nauk. 2016, 94, 217–228. [Google Scholar]
  20. Janus, J.; Krawczyk, J. Numerical modeling of flow phenomena in mine drift using laser scan results. In Proceedings of the 11th International Mine Ventilation Congress; Science Press: Beijing, China, 2018. [Google Scholar] [CrossRef]
  21. Skotniczny, P. Three-dimensional numerical simulation of the mass exchange between longwall headings and goafs, in the presence of methane drainage in A U-type ventilated longwall. Arch. Min. Sci. 2013, 58, 705–718. [Google Scholar] [CrossRef]
  22. Klapa, P.; Mitka, B. Application of terrestrial laser scanning to the development and updating of the base map. Geodesy Cartogr. 2017, 66, 59–71. [Google Scholar] [CrossRef]
  23. Gargoum, S.A.; Karsten, L. Virtual assessment of sight distance limitations using LiDAR technology: Automated obstruction detection and classification. Autom. Constr. 2021, 125, 103579. [Google Scholar] [CrossRef]
  24. Cao, Z.; Chen, D.; Shi, Y.; Zhang, Z.; Jin, F.; Yun, T.; Xu, S.; Kang, Z.; Zhang, L. A flexible architecture for extracting metro tunnel cross sections from terrestrial laser scanning point clouds. Remote Sens. 2019, 11, 297. [Google Scholar] [CrossRef] [Green Version]
  25. Xu, L.; Gong, J.; Na, J.; Yang, Y.; Tan, Z.; Pfeifer, N.; Zheng, S. Shield tunnel convergence diameter detection based on self-driven mobile laser scanning. Remote Sens. 2022, 14, 767. [Google Scholar] [CrossRef]
  26. Jia, D.; Zhang, W.; Liu, Y. Systematic approach for tunnel deformation monitoring with terrestrial laser scanning. Remote Sens. 2021, 13, 3519. [Google Scholar] [CrossRef]
  27. Helming, P.; von Freyberg, A.; Sorg, M.; Fischer, A. Wind Turbine tower deformation measurement using terrestrial laser scanning on a 3.4 MW wind turbine. Energies 2021, 14, 3255. [Google Scholar] [CrossRef]
  28. Farahani, B.V.; Barros, F.; Sousa, P.; Cacciari, P.P.; Tavares, P.; Futai, M.M.; Moreira, P. A coupled 3D laser scanning and digital image correlation system for geometry acquisition and deformation monitoring of a railway tunnel. Tunn. Undergr. Space Technol. 2019, 91, 102995. [Google Scholar] [CrossRef]
  29. Michalak, D.; Gomez Herrero, J.A. Innovative solutions need an innovative approach–3D printing technology, example of use and conclusion from implementation in an organization. Min. Mach. 2020, 162, 2. [Google Scholar]
  30. Xu, J.; Ding, L.; Love, P. Digital reproduction of historical building ornamental components: From 3D scanning to 3D printing. Autom. Constr. 2017, 76, 85–96. [Google Scholar] [CrossRef]
  31. Pejić, M. Design and optimisation of laser scanning for tunnels geometry inspection. Tunn. Undergr. Space Technol. 2013, 37, 199–206. [Google Scholar] [CrossRef]
  32. Janus, J.; Krawczyk, J. Measurement and simulation of flow in a section of a mine gallery. Energies 2021, 14, 4894. [Google Scholar] [CrossRef]
  33. Rozmus, M.; Tokarczyk, J.; Michalak, D.; Dudek, M.; Szewerda, K.; Rotkegel, M.; Lamot, A.; Rošer, J. Application of 3D scanning, computer simulations and virtual reality in the redesigning process of selected areas of underground transportation routes in coal mining industry. Energies 2021, 14, 2589. [Google Scholar] [CrossRef]
  34. Faro Laser Scanner FOCUS 3D—Manual; FARO Technologies Inc.: Lake Mary, FL, USA, 2010.
  35. Roca-Pardiñas, J.; Argüelles-Fraga, R.; de Asís López, F.; Ordóñez, C. Analysis of the influence of range and angle of incidence of terrestrial laser scanning measurements on tunnel inspection. Tunn. Undergr. Space Technol. 2014, 43, 133–139. [Google Scholar] [CrossRef]
  36. Chen, B.; Deng, K.; Fan, H.; Hao, M. Large-scale deformation monitoring in mining area by D-InSAR and 3D laser scanning technology integration. Int. J. Min. Sci. Technol. 2013, 23, 555–561. [Google Scholar] [CrossRef]
  37. Monsalve, J.J.; Baggett, J.; Bishop, R.; Ripepi, N. Application of laser scanning for rock mass characterization and discrete fracture network generation in an underground limestone mine. Int. J. Min. Sci. Technol. 2018, 29, 131–137. [Google Scholar] [CrossRef]
  38. Olszyna, G.; Sioma, A.; Tytko, A. Laser measurement system for the diagnostics of mine hoist components. Arch. Min. Sci. 2014, 59, 337–346. [Google Scholar] [CrossRef] [Green Version]
  39. Chi, H.; Zhan, K.; Shi, B. Automatic guidance of underground mining vehicles using laser sensors. Tunn. Undergr. Space Technol. 2012, 27, 142–148. [Google Scholar] [CrossRef]
  40. Heyduk, A. Laser triangulation in 3-dimensional granulometric analysis. Arch. Min. Sci. 2016, 61, 15–27. [Google Scholar] [CrossRef] [Green Version]
  41. Lenda, G.; Lewińska, P.; Siwiec, J. Accuracy of merging point clouds at the maximum range of a scanner with limited pos-sibilities of target placement. Arch. Civ. Eng. 2019, 65, 4. [Google Scholar]
  42. Janus, J. Construction the Numerical Models Geometry by Using Terrestrial Laser Scanning; Selected Issues Related to Mining and Clean Coal Technology; AGH University of Science and Technology: Krakow, Poland, 2016. [Google Scholar]
  43. Horyl, P.; Šňupárek, R.; Maršálek, P.; Pacześniowski, K. Simulation of laboratory tests of steel arch support. Arch. Min. Sci. 2017, 62, 163–176. [Google Scholar] [CrossRef] [Green Version]
  44. Roszczynialski, W.; Trutwin, W.; Wacławik, J. Kopalniane Pomiary Wentylacyjne; Śląsk: Katowice, Poland, 1992. [Google Scholar]
Figure 1. Schematic diagram of the functioning of TLS.
Energies 15 02537 g001
Figure 2. Explored section of the mining tunnel.
Energies 15 02537 g002
Figure 3. Point cloud view of the mine tunnel straight section near the bend.
Energies 15 02537 g003
Figure 4. Measurement cross-sections.
Energies 15 02537 g004
Figure 5. Cross-section curve.
Energies 15 02537 g005
Figure 6. Cross-section line.
Energies 15 02537 g006
Figure 7. Arch yielding support geometry.
Energies 15 02537 g007
Figure 8. Obtained geometry model, view of the mine tunnel straight section near the bend.
Energies 15 02537 g008
Figure 9. Dimensions of arch yielding support 8-KS/KO-21.
Energies 15 02537 g009
Figure 10. Change of cross-sectional shape coefficient as a function of floor height [13].
Energies 15 02537 g010
Figure 11. Reference cross-section outlines obtained by the laser scanning method presented on the cross-section outlines obtained by CAD method.
Energies 15 02537 g011
Figure 12. Differences in cross-sections between reference method and CAD method; cross-section 1.2.
Energies 15 02537 g012
Figure 13. Differences in cross-sections between reference method and approximation by a semi-ellipse; cross-section 1.2.
Energies 15 02537 g013
Figure 14. Differences in cross-sections between reference method and approximation by a semi-ellipse with attached straight sections; cross-section 1.2.
Energies 15 02537 g014
Table 1. Data for arch yielding support 8-KS/KO-21.
S [m]W [m]R1 [m]L1 [m]Z [m]R2 [m]L2 [m]C [m]
4.73.32.83.20.52.23.80.45
Table 2. Results of cross-sectional area measurements.
Cross-Section 1.1 [m2]Difference [m2]Cross-Section 1.2 [m2]Difference [m2]Cross-Section 2.1 [m2]Difference [m2]
Scanning method11.26013.20012.660
CAD method11.380.1213.300.10113.000.34
Empirical method11.08−0.1812.65−0.54712.52−0.14
Semi-ellipse10.88−0.3812.42−0.77912.26−0.40
Semi-ellipse with straight sections11.390.1312.93−0.26612.770.11
Table 3. Results of cross-sectional area measurements.
Cross-Section 2.2 [m2]Difference [m2]Cross-Section 3.1 [m2]Difference [m2]Cross-Section 3.2 [m2]Difference [m2]
Scanning method13.18012.99013.180
CAD method13.490.3113.030.04613.490.31
Empirical method12.87−0.3112.53−0.46212.87−0.31
Semi-ellipse12.61−0.5712.30−0.69212.61−0.57
Semi-ellipse with straight sections13.12−0.0612.80−0.19313.12−0.06
Table 4. Percentage differences for each cross section, calculated by four methods compared with the scanning method.
CAD Method [%]Empirical Method [%]Approximation by a Semi-Ellipse [%]Approximation by a Semi-Ellipse with Attached Straight Sections [%]
Cross-Section 1.11.07−1.60−3.371.15
Cross-Section 2.12.35−2.35−4.32−0.46
Cross-Section 2.10.77−4.15−5.90−2.02
Cross-Section 2.22.69−1.11−3.160.87
Cross-Section 3.10.35−3.56−5.33−1.49
Cross-Section 3.21.00−3.78−5.55−1.63
Table 5. Mean relative errors for four methods compared with the scanning method.
CAD Method [%]Empirical Method [%]Approximation by a Semi-Ellipse [%]Approximation by a Semi-Ellipse with Attached Straight Sections [%]
Mean relative error1.372.764.611.27
Publisher’s Note: MDPI stays neutral with regard to jurisdictional claims in published maps and institutional affiliations.

