Article

Air Pollution and Limitations in Health: Identification of Inequalities in the Burdens of the Economies of the “Old” and “New” EU

by
Agnieszka Jakubowska
1,* and
Marcin Rabe
2
1
Faculty of Economic Science, Koszalin University of Technology, 75-343 Koszalin, Poland
2
Management Institute, University of Szczecin, 71-004 Szczecin, Poland
*
Author to whom correspondence should be addressed.
Energies 2022, 15(17), 6225; https://doi.org/10.3390/en15176225
Submission received: 26 July 2022 / Revised: 18 August 2022 / Accepted: 23 August 2022 / Published: 26 August 2022

Abstract

:
The aim of the present research is to assess the scale of the impact of air pollution on the level of burdening EU economies with the consequences of chronic diseases (non-communicable diseases—NCDs) in the context of limiting the potential productivity of human resources. This study attempts to identify inequalities in this area that occur in the territory of the European Union. The scale of the impact of environmental factors, and air pollution in particular, on the level of health limitations in the labor resources of EU countries was measured by the number of the years of healthy life lost (YLL and YLD) as a result of chronic diseases. The verification of the assumption of a persistently high level of dispersion was based on an analysis of the convergence process (β and σ) in the group of EU countries in 1990–2019. The results demonstrate that the level of health restrictions caused by air pollution is diverse in the group of EU-27 countries. The inequalities observed concern, in particular, the relationship between the old and the new EU, indicating a high burden of health consequences for the inhabitants of Central and Eastern Europe (EU-CEE).

1. Introduction

Currently, chronic diseases constitute the main cause of mortality and morbidity in developed countries. The main causes of this phenomenon include the aging of the population and the growing influence of risk factors such as environmental pollution and unhealthy lifestyle [1]. Chronic diseases caused by risk factors increasingly affect young people. Non-communicable diseases (NCDs) are characterized by high mortality and a high degree of disability, limiting the ability of people of working age to live and work effectively. The intensity of risk factors determining the incidence of chronic diseases in society is visible especially in highly developed countries, where the key problem is the growing share of the number of years of life with a disability in relation to the total life expectancy [2,3,4,5]. Currently, there occurs a large variation in the severity of chronic diseases between EU countries, determined both by differences in the incidence of individual diseases and their mortality [6]. This contributes to a significant diversification of the health life expectancy of the inhabitants of the EU countries and, as a consequence, it fundamentally determines the potential productivity of labor resources in individual economies [7]. Poor health is currently indicated as one of the main reasons for the deactivation of the workforce [8,9], and the relationship between the health of society and its productivity has become the subject of an increasing number of studies [10,11]. The growing problem of employees’ absence due to health reasons (absenteeism) or their reduced productivity due to poor health (presenteeism) forces employers to use mechanisms to secure the continuity of production processes [12,13]. In this context, the problem of the correct identification of the determinants of human resources health becomes of a key importance, which will enable the proper design and implementation of an effective disease prevention policy and their long-term social consequences. The research carried out in this area demonstrates that one of the most important determinants of the growing burden of chronic diseases is environmental factors, including air quality [14,15,16,17].
The aim of this research is to assess the scale of the impact of air pollution on the level of burdening EU economies with the consequences of chronic diseases (NCDs) in the context of limiting the potential productivity of human resources. The study attempts to identify inequalities in this area that occur in the territory of the European Union. The scale of the impact of environmental factors, and air pollution in particular, on the level of health limitations in the labor resources of EU countries was measured by the number of the years of healthy life lost (YLL and YLD) as a result of chronic diseases.

2. Literature Review

Air pollution is now the leading environmental cause of premature death and it is responsible for significant morbidity with short- and long-term health effects. It is the major environmental risk factor for health in the world and the fourth largest risk factor for mortality in the world [18]. Despite significant reductions in ambient PM 2.5 concentrations in North America and Europe, air pollution levels remain high in most countries of the world [19]. According to a report published by the European Environment Agency (EEA) [20], in 2018, about 49% of the European population and 42 % of the EU-28 population was exposed to PM10 annual average concentrations above the WHO AQG (20 µg/m3). The population exposure exceeding the EU limit value (40 µg/m3) was 9% for the population of the total European area considered and about 1% for the EU. In the case of exposed to PM 2.5, in 2018, around 76% of the population of the total European area considered (excluding Turkey) and 77% of the EU population were exposed to annual mean concentrations above the WHO Global Air Quality Guidelines (10 µg/m3). In addition, almost 5% of the total population and 3% of the EU population were exposed to concentrations above the EU limit value (25 µg/m3).
The two main forms of air pollution with serious health effects include ambient particulate matter pollution being less than 2.5 μm (PM 2.5) and household air pollution (HAP) from solid fuels [21,22]. The global burden of disease, which can be attributed to the presence of PM 2.5 in the environment, has increased from 70.5 million healthy life years lost (DALY-disability adjusted life-years) and 2.05 million deaths in 1990 to 118.2 million DALYs and 4.14 million deaths in 2019 [23]. According to the aforementioned EEA report [20], in 2018, in 41 European countries, 417,000 premature deaths were attributed to PM 2.5 exposure. In the EU-28, premature deaths attributable to PM 2.5 were 379,000. (in line with the changes in concentrations, the estimated deaths attributable to PM 2.5 increased compared to 2017). In the group of 41 European countries assessed, 4,805,800 prematurely lost years of life (YLL) are attributed to PM 2.5 exposure. In the EU-28, the YLL attributed to PM 2.5 exposure were 4,380,800.
Air pollution is a major public health problem generating a high level of disease burden [24]. Research in this area confirms that exposure to fine particulate matter (PM 2.5) and nitrogen dioxide (NO 2) increases the risk of non-communicable diseases (NCD) such as cardiovascular disease, respiratory disease and lung cancer [25], and it also causes exacerbations of existing diseases such as asthma and chronic obstructive pulmonary disease (COPD) [26,27,28]. Cohort studies in the United States and Europe have shown that exposure to PM 2.5 in ambient air is associated with an increased risk of death from chronic cardiovascular and respiratory diseases [29,30]. Relatively little research has been devoted to an analysis of the indirect costs of these diseases resulting, inter alia, from the loss of fitness of those affected by the disease. This problem is of particular importance in the case of people of working age, when the long-term effects of chronic diseases limit their effectiveness in the labor market. In addition to the burden on human health, morbidity and premature mortality from air pollution have significant economic and social costs. They include, among others, the social costs of premature death, healthcare costs for patients, loss of productivity of a sick person or a person forced to care for a sick family member [31,32,33]. An OECD study provides evidence that air pollution causes economy-wide reductions in market economic activity based on data for Europe [34]. These estimates show that a 1 μg/m3 increase in PM 2.5 concentration (or a 10% increase at the sample mean) causes a 0.8% reduction in real GDP that same year. 95% of this impact is due to reductions in output per worker, which can occur through greater absenteeism at work or reduced labor productivity.
Air pollution should also be seen as a crucial factor in health inequalities. As with the distribution of wealth and resources, environmental health problems are unevenly distributed among the population [35,36,37,38]. The available data shows that the health burden resulting from air pollution is visible especially in countries with a low level of development, and a significant part of the burden resulting from poor air quality concerns people of working age. In the model of “mechanisms of health inequalities”, F. Didierichsen lists the sources of these inequalities, which include, among others, social stratification resulting in differences in exposure to harmful health conditions and different accessibility to health care resources [39]. Recognition of the social costs of the impact of air pollution on the health of society, and that of the working-age population in particular, is an important area of empirical cognition from the perspective of understanding the causes of poor health and health inequalities, as well as understanding the mechanisms of long-term health investment effectiveness at the level of the entire society. This area should be seen as a source of opportunities to improve health, reduce health inequalities while increasing the potential for healthy work in the economy [40,41]. In the context of air pollution, an important issue is the need to build a low-emission future [42,43].

3. Materials and Methods

The Institute for Health Metrics and Evaluation (IHME) data from the Global Burden of Disease Study 2019 was used to assess the scale of the burden on the labor resources of EU economies with the consequences of chronic diseases caused by air pollution [23]. The spatial distribution of these indicators in relation to the EU-27 area was assessed. A detailed analysis of the scale of burdening EU economies with the impact of environmental factors causing chronic diseases, with a particular emphasis on air pollution, was based on the indicators defining the number of years lost (YLL) and the number of potential years of life with disability (YLD). The choice of the variables analyzed was made based on a review of the proposed methodology for the assessment of the phenomenon studied presented in the literature [44,45]. The adopted approach aims to illustrate the potentially lost time of effective work provided by working age people, while at the same time indicating the degree of burden on national economies with the effects of chronic diseases. In the definition of “health” adopted for the purposes of the analysis, the term “chronic diseases” generally refers to the group of non-communicable diseases (NCDs) comprising four main groups of diseases, i.e., cancer, cardiovascular diseases, diabetes and chronic respiratory diseases, and two specific risk factors:
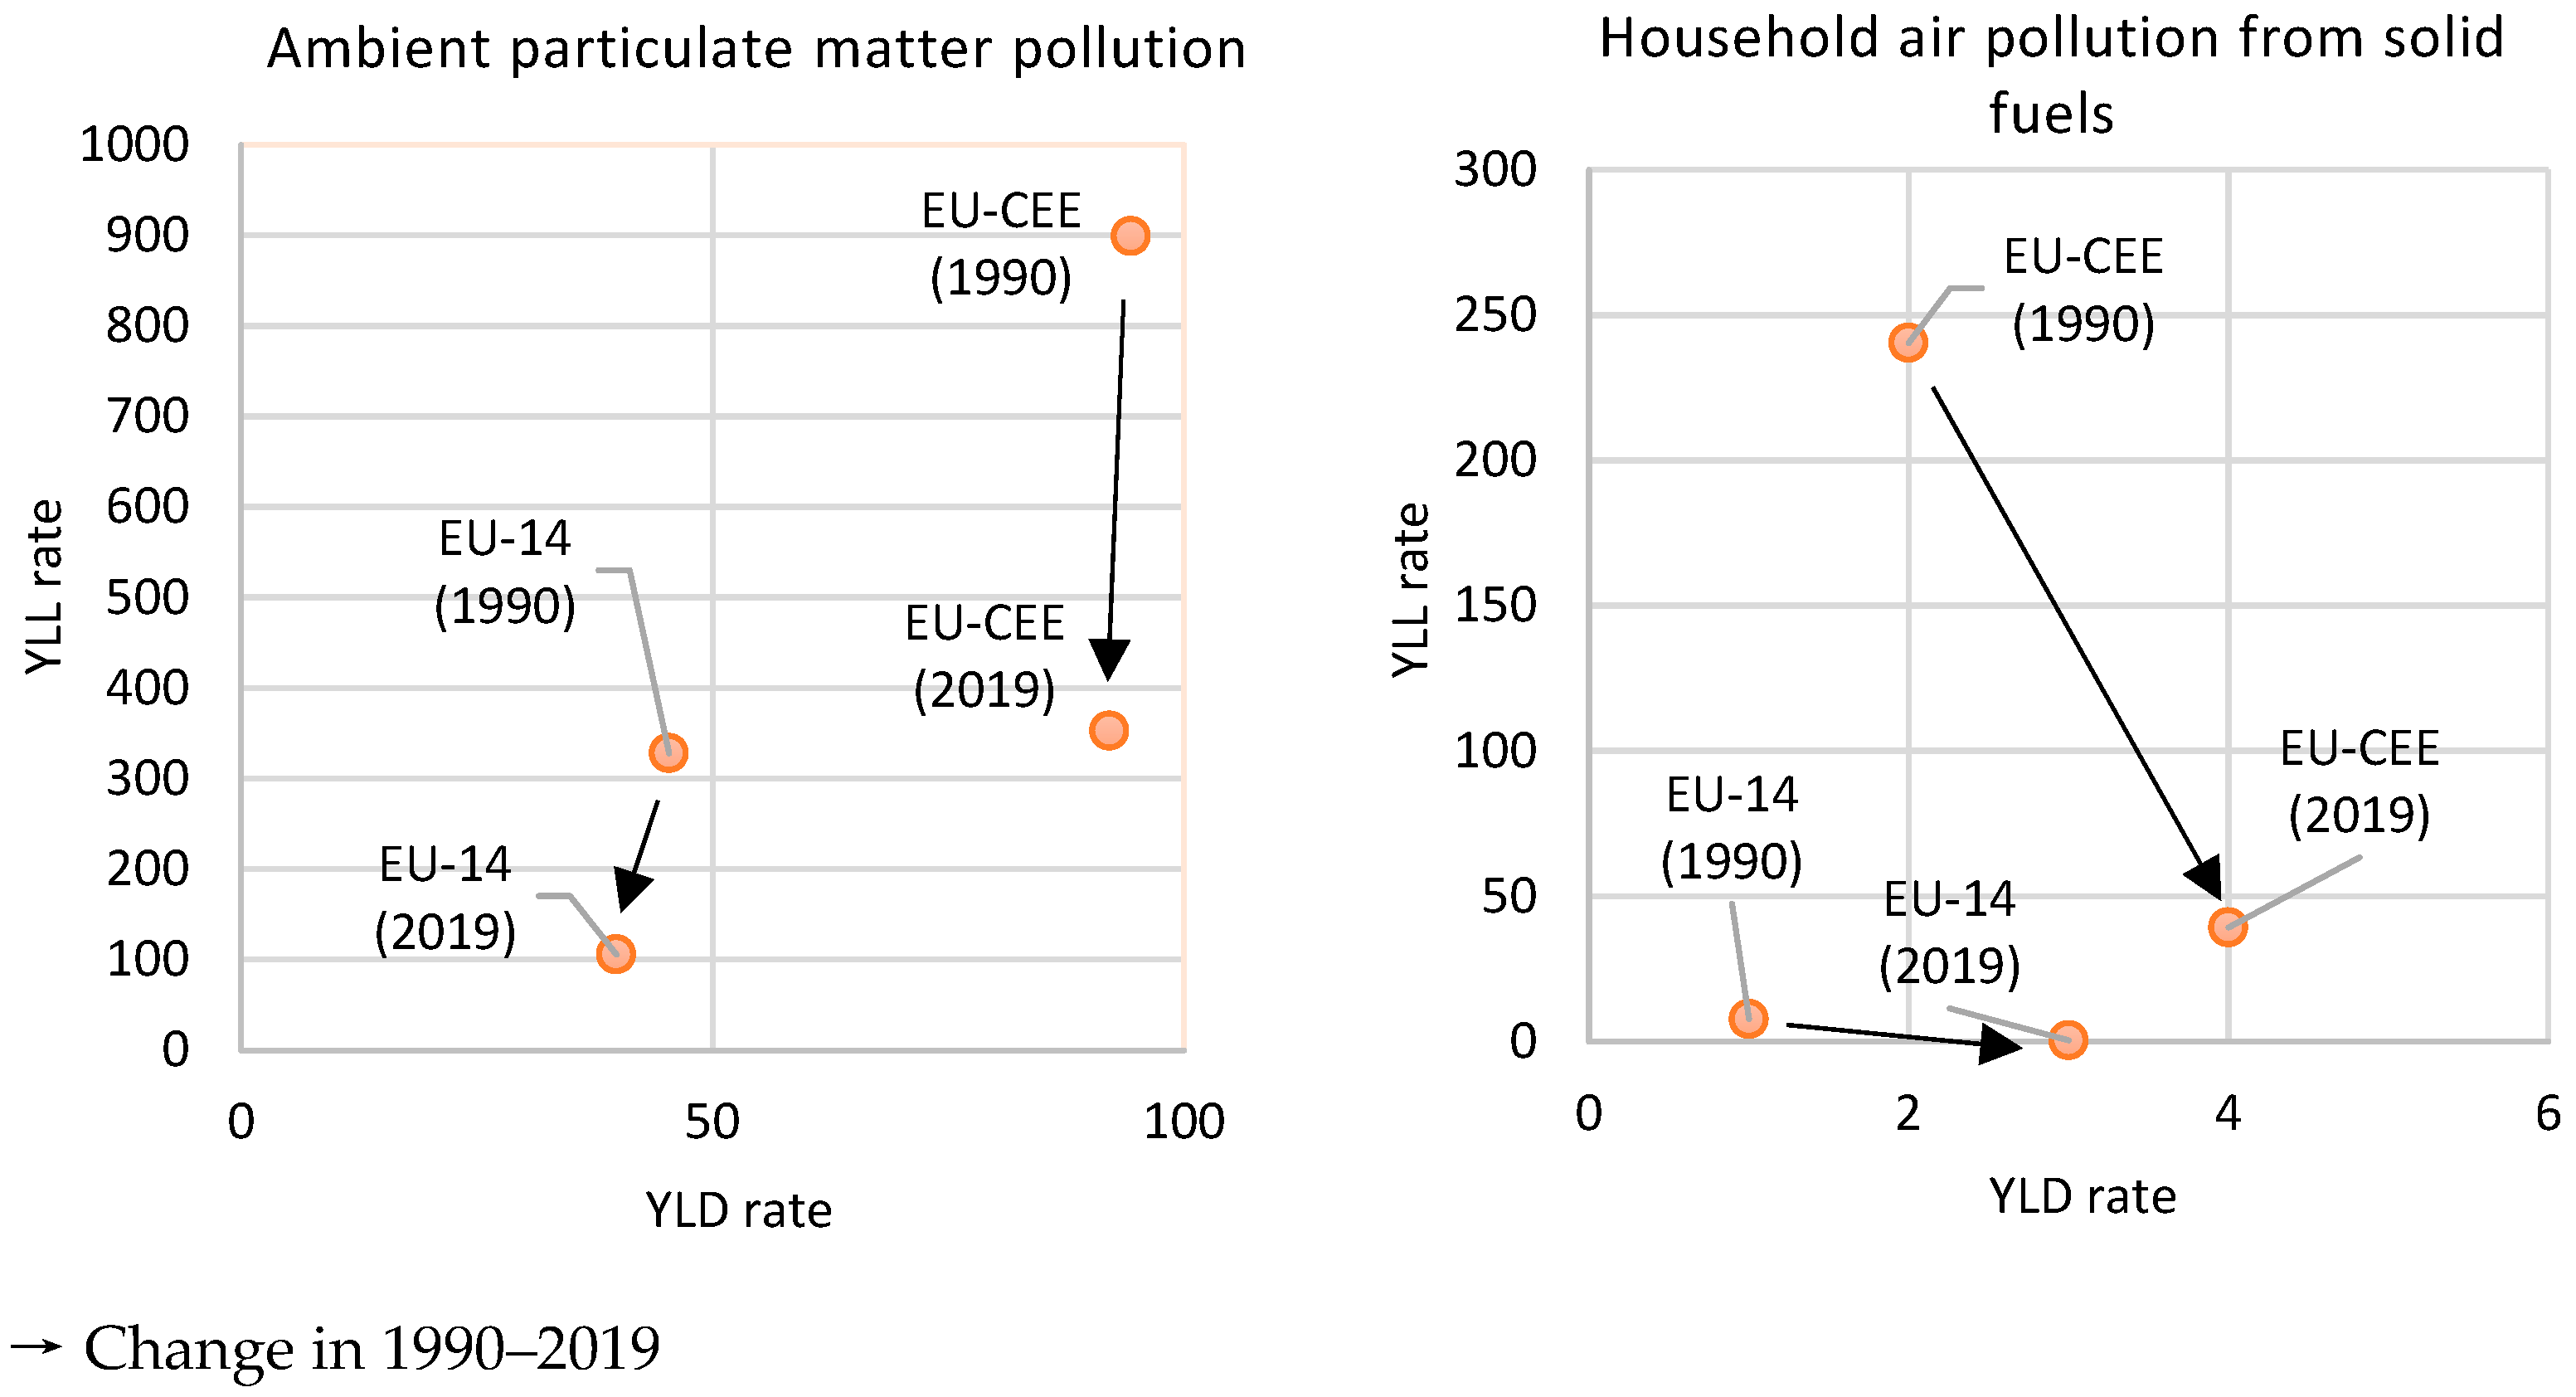
  • Ambient particulate matter pollution: annual average daily exposure to outdoor air concentrations of particulate matter with an aerodynamic diameter of ≤2.5 μm (PM 2.5), measured in μg/m³,
  • Household air pollution (HAP) from solid fuels: individual exposure to PM 2.5 due to use of solid fuels.
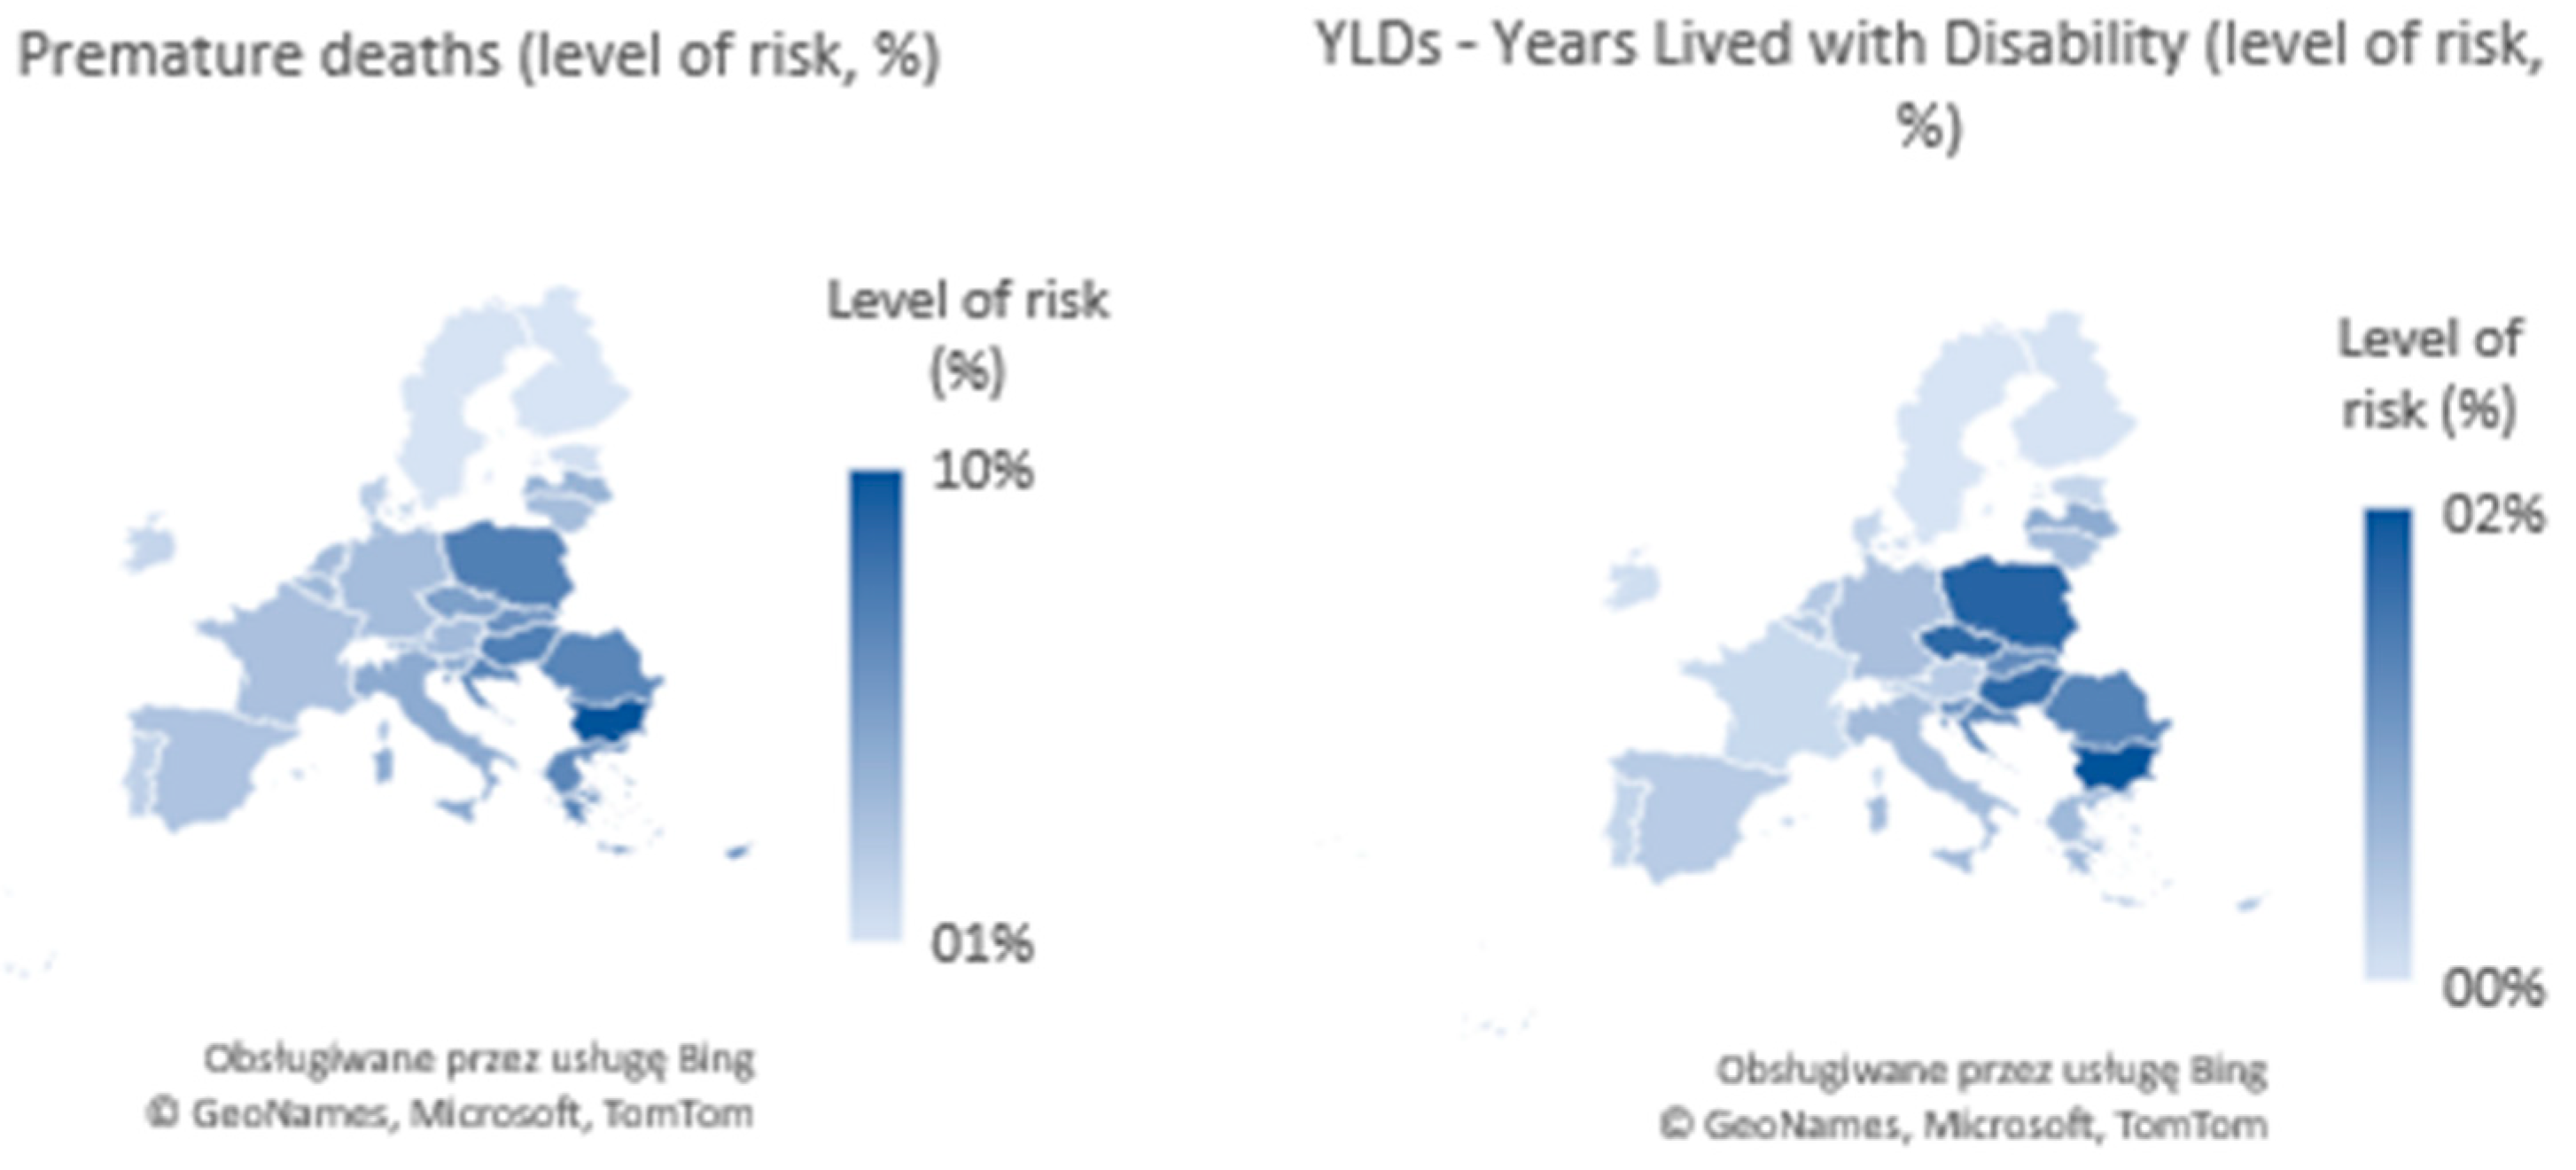
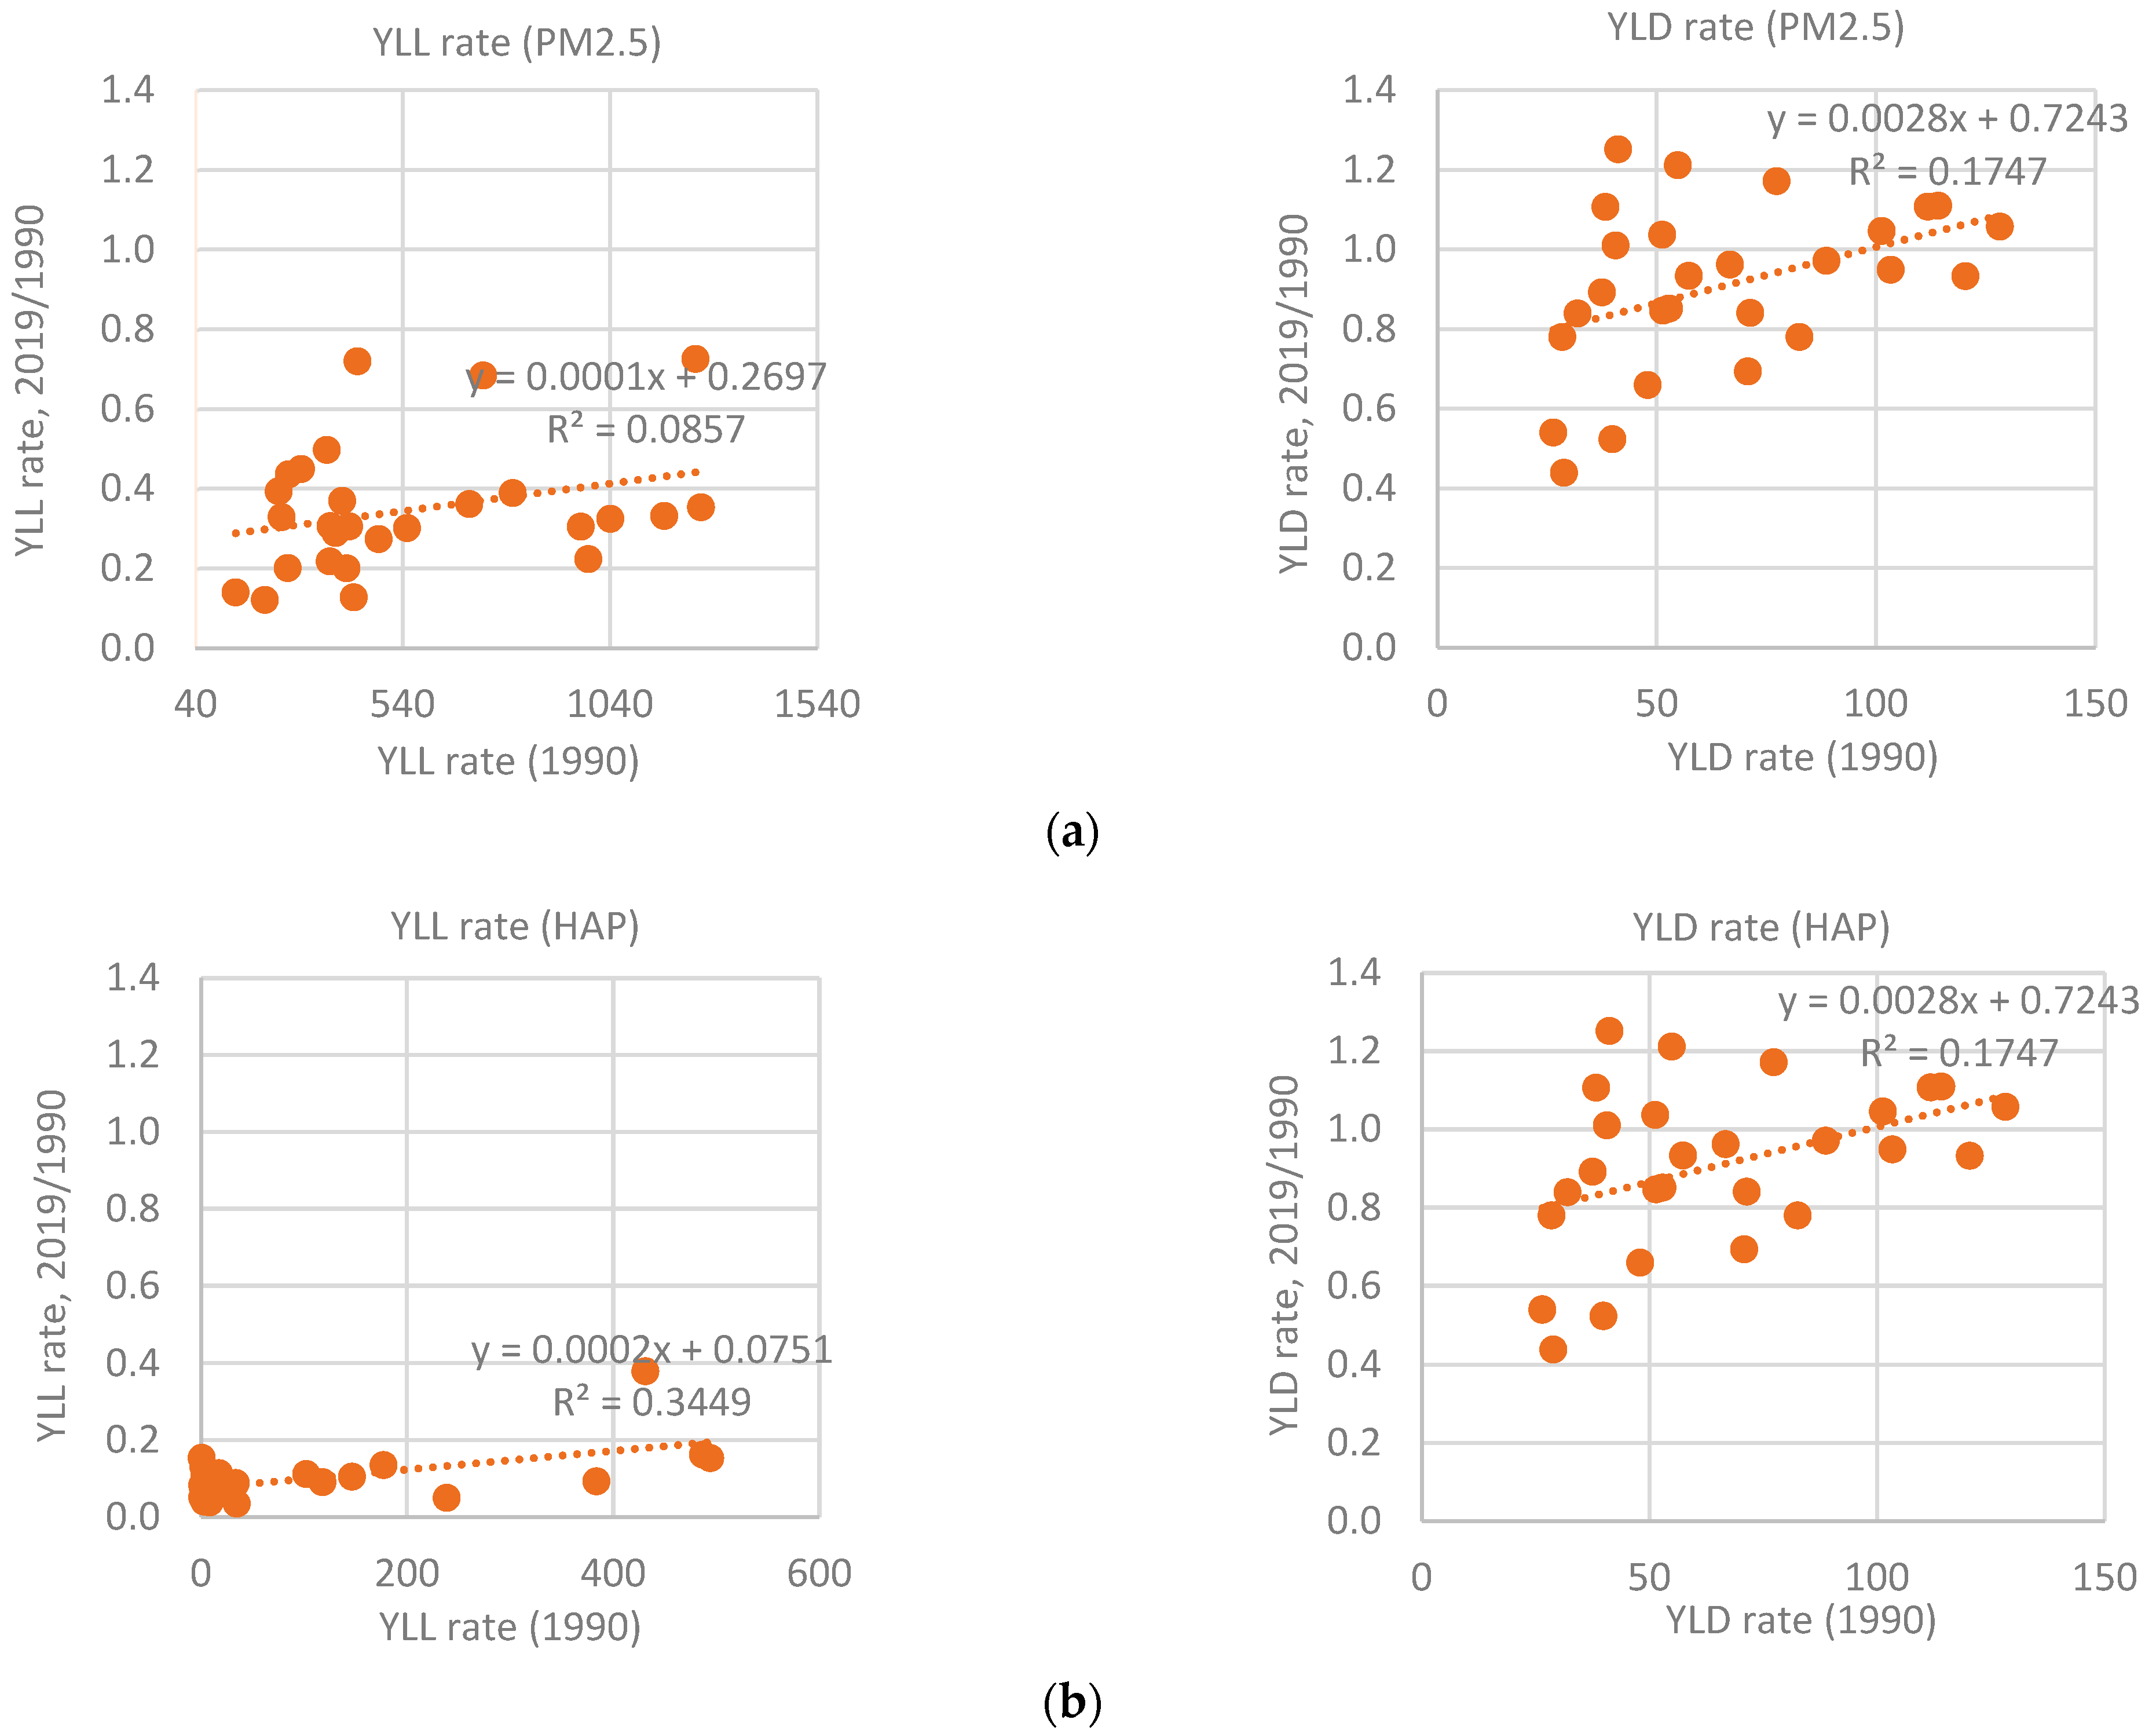
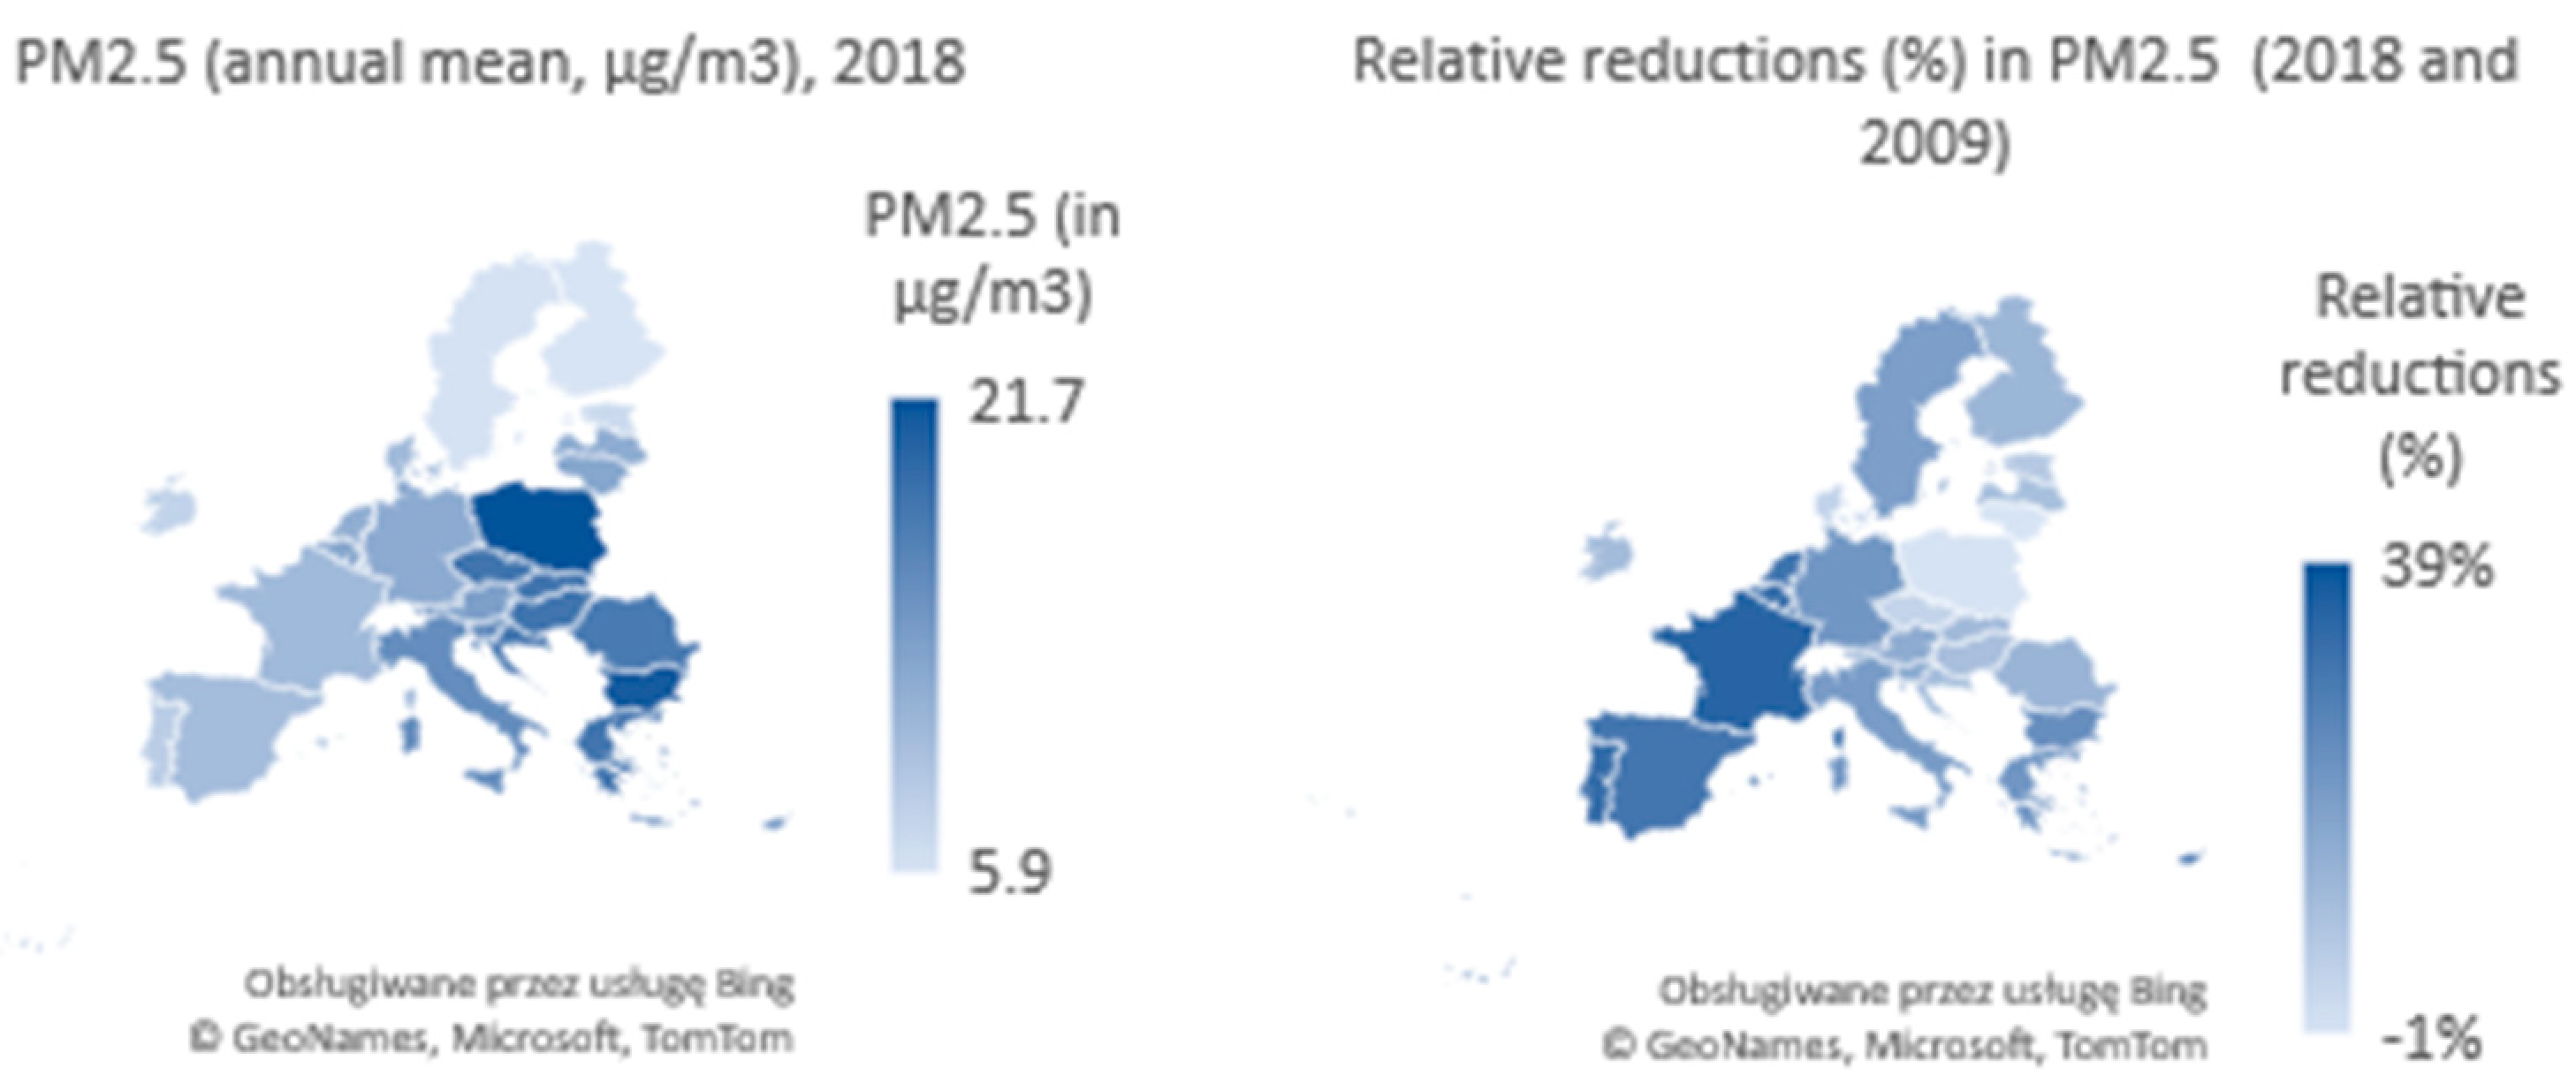
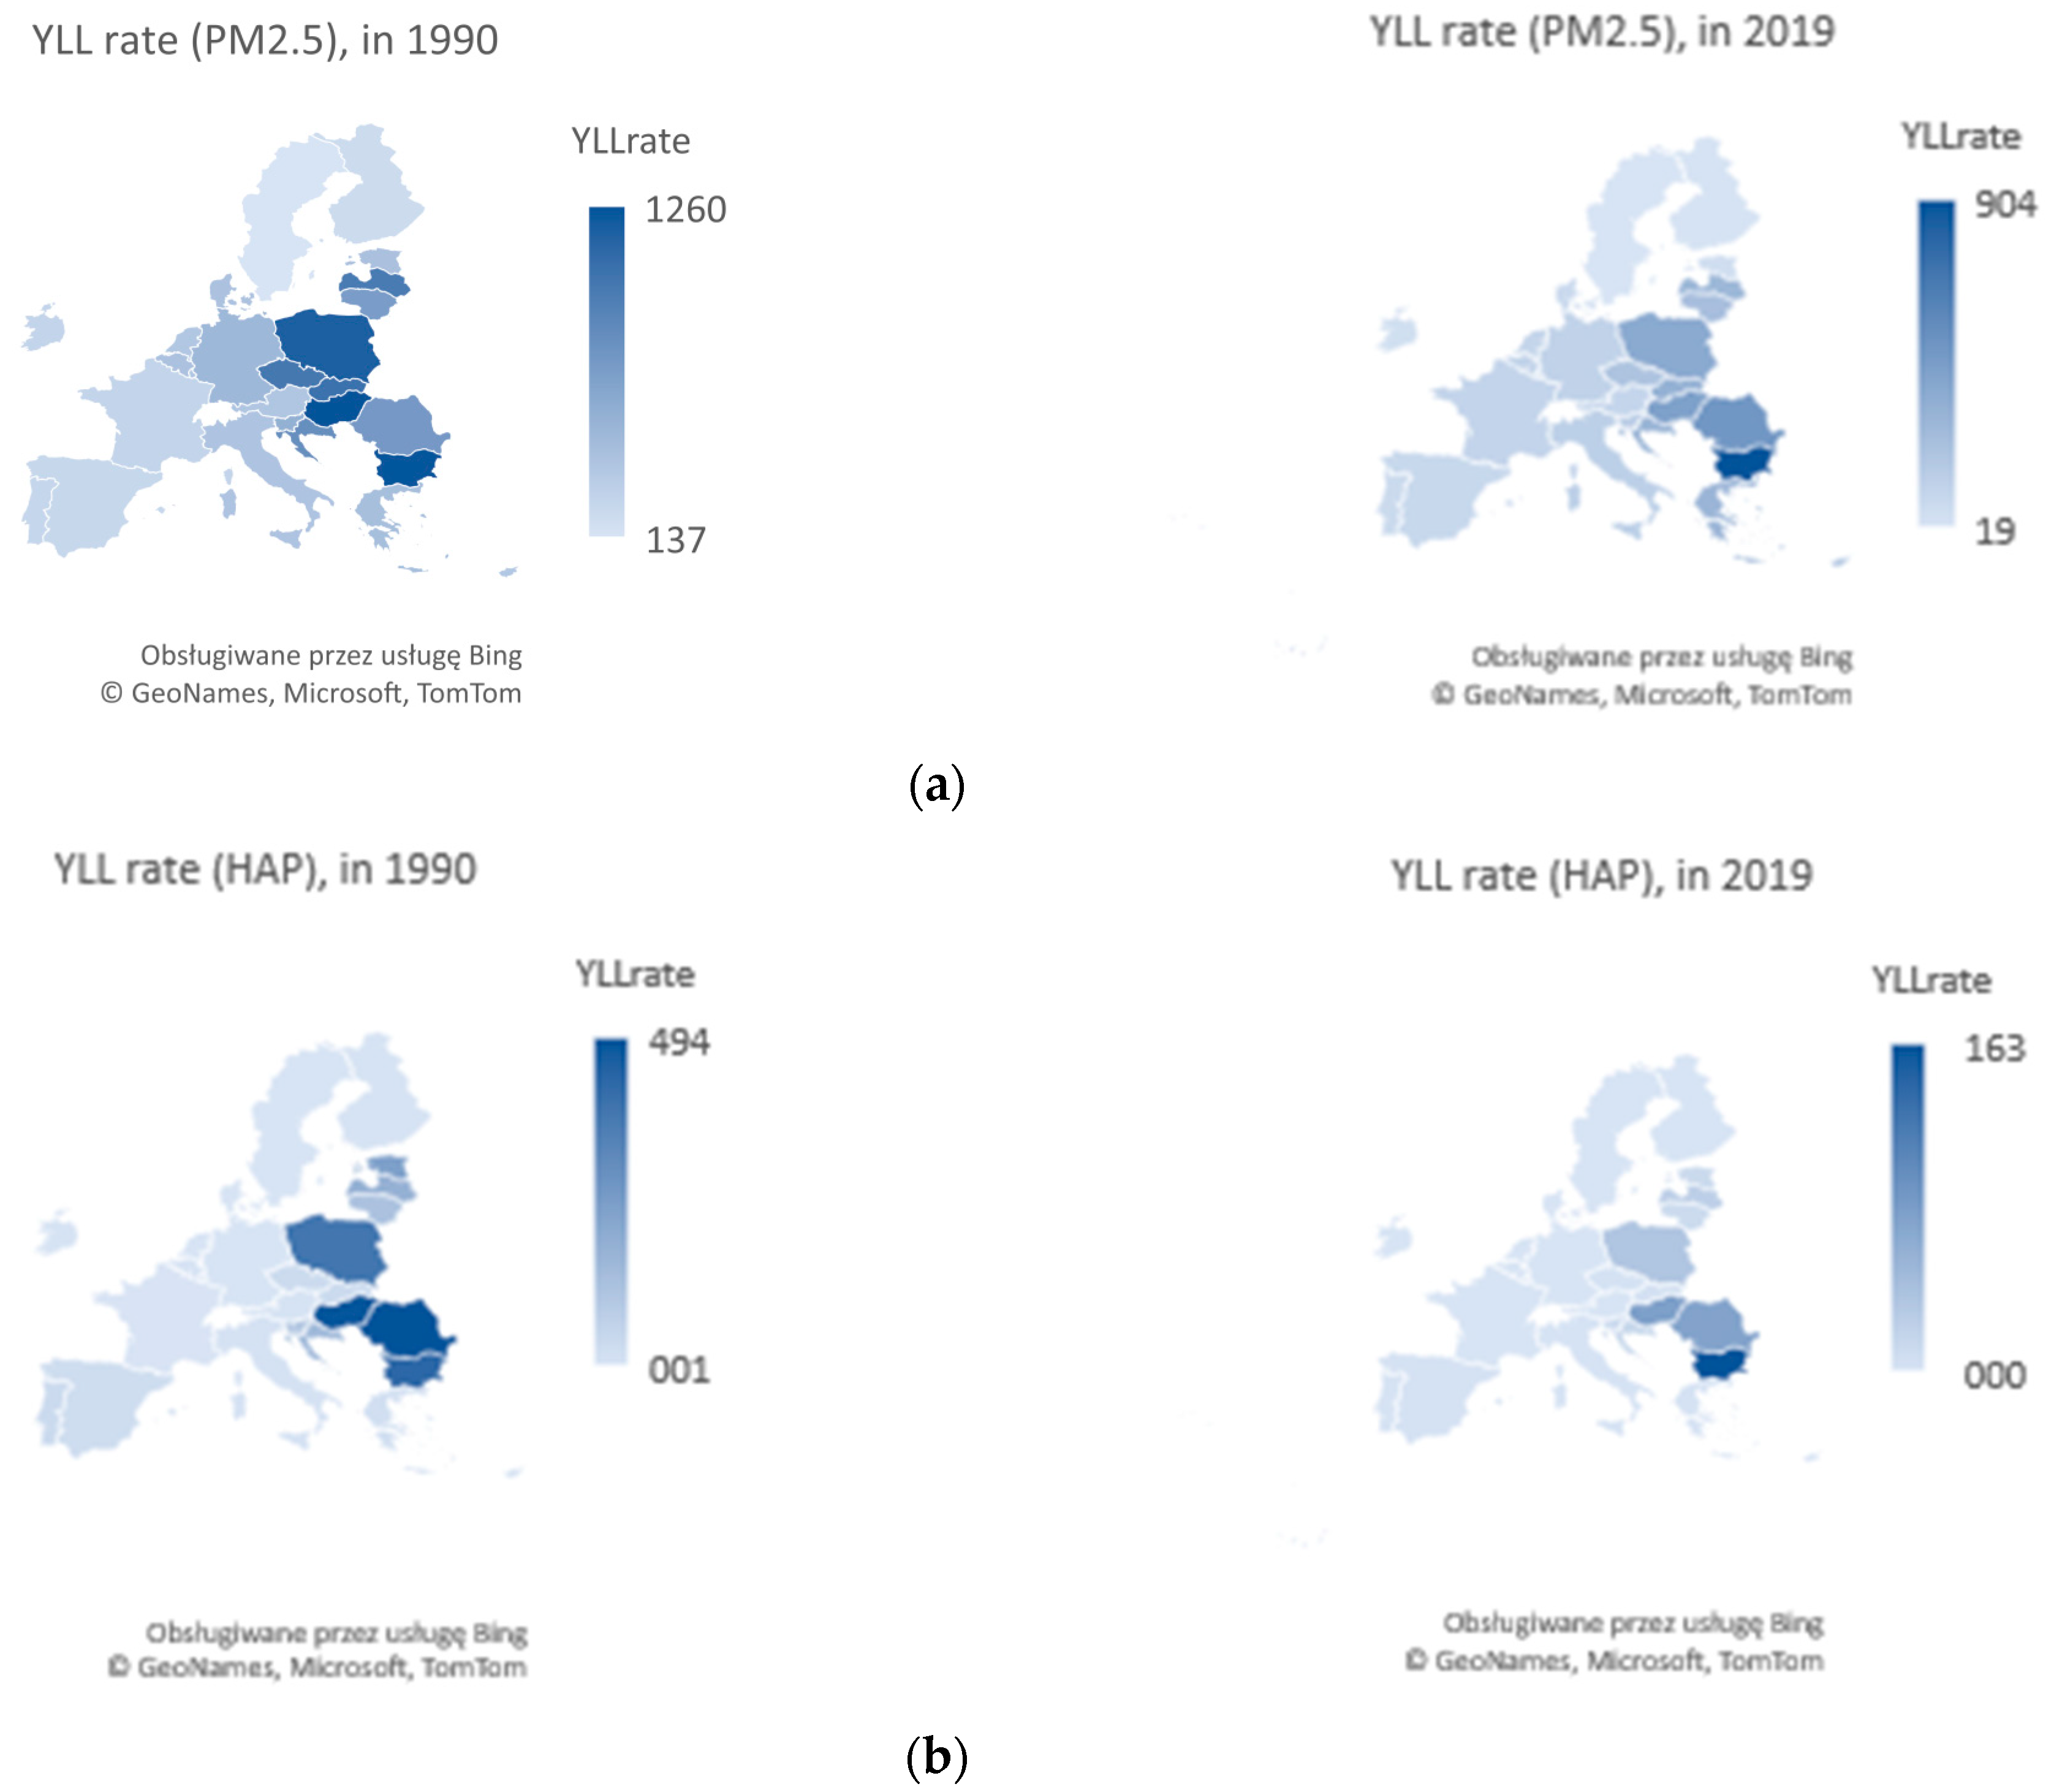
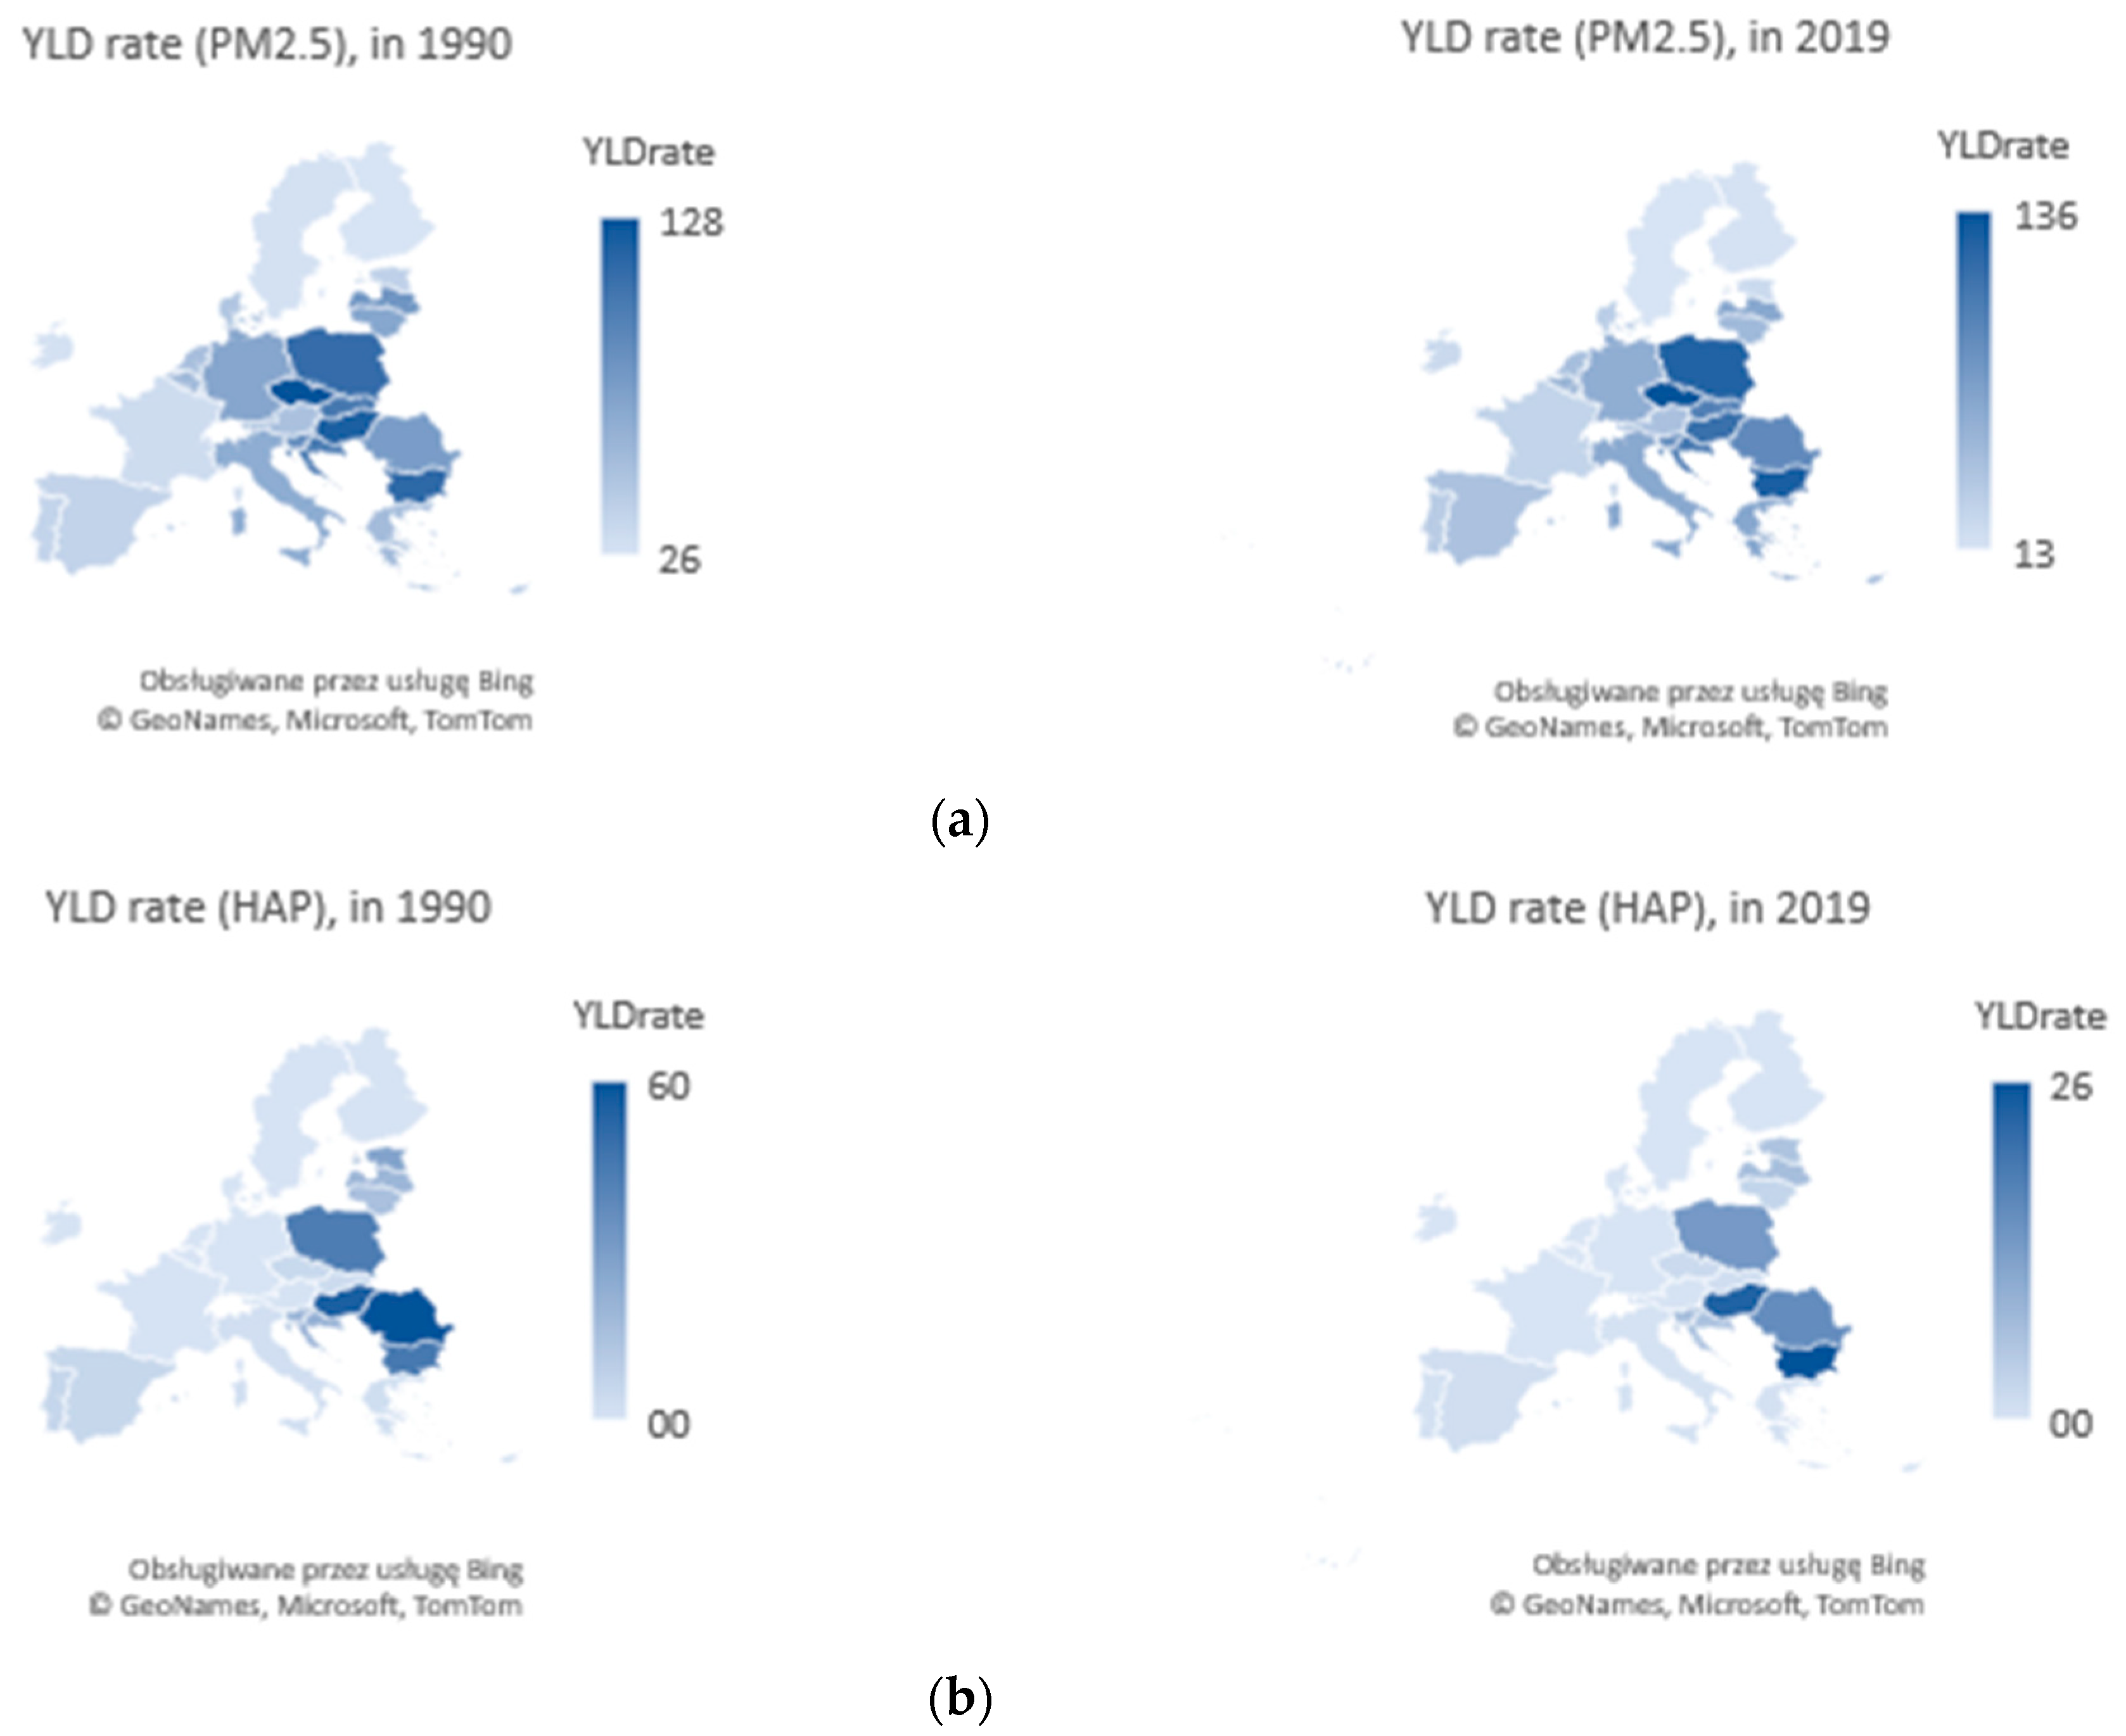
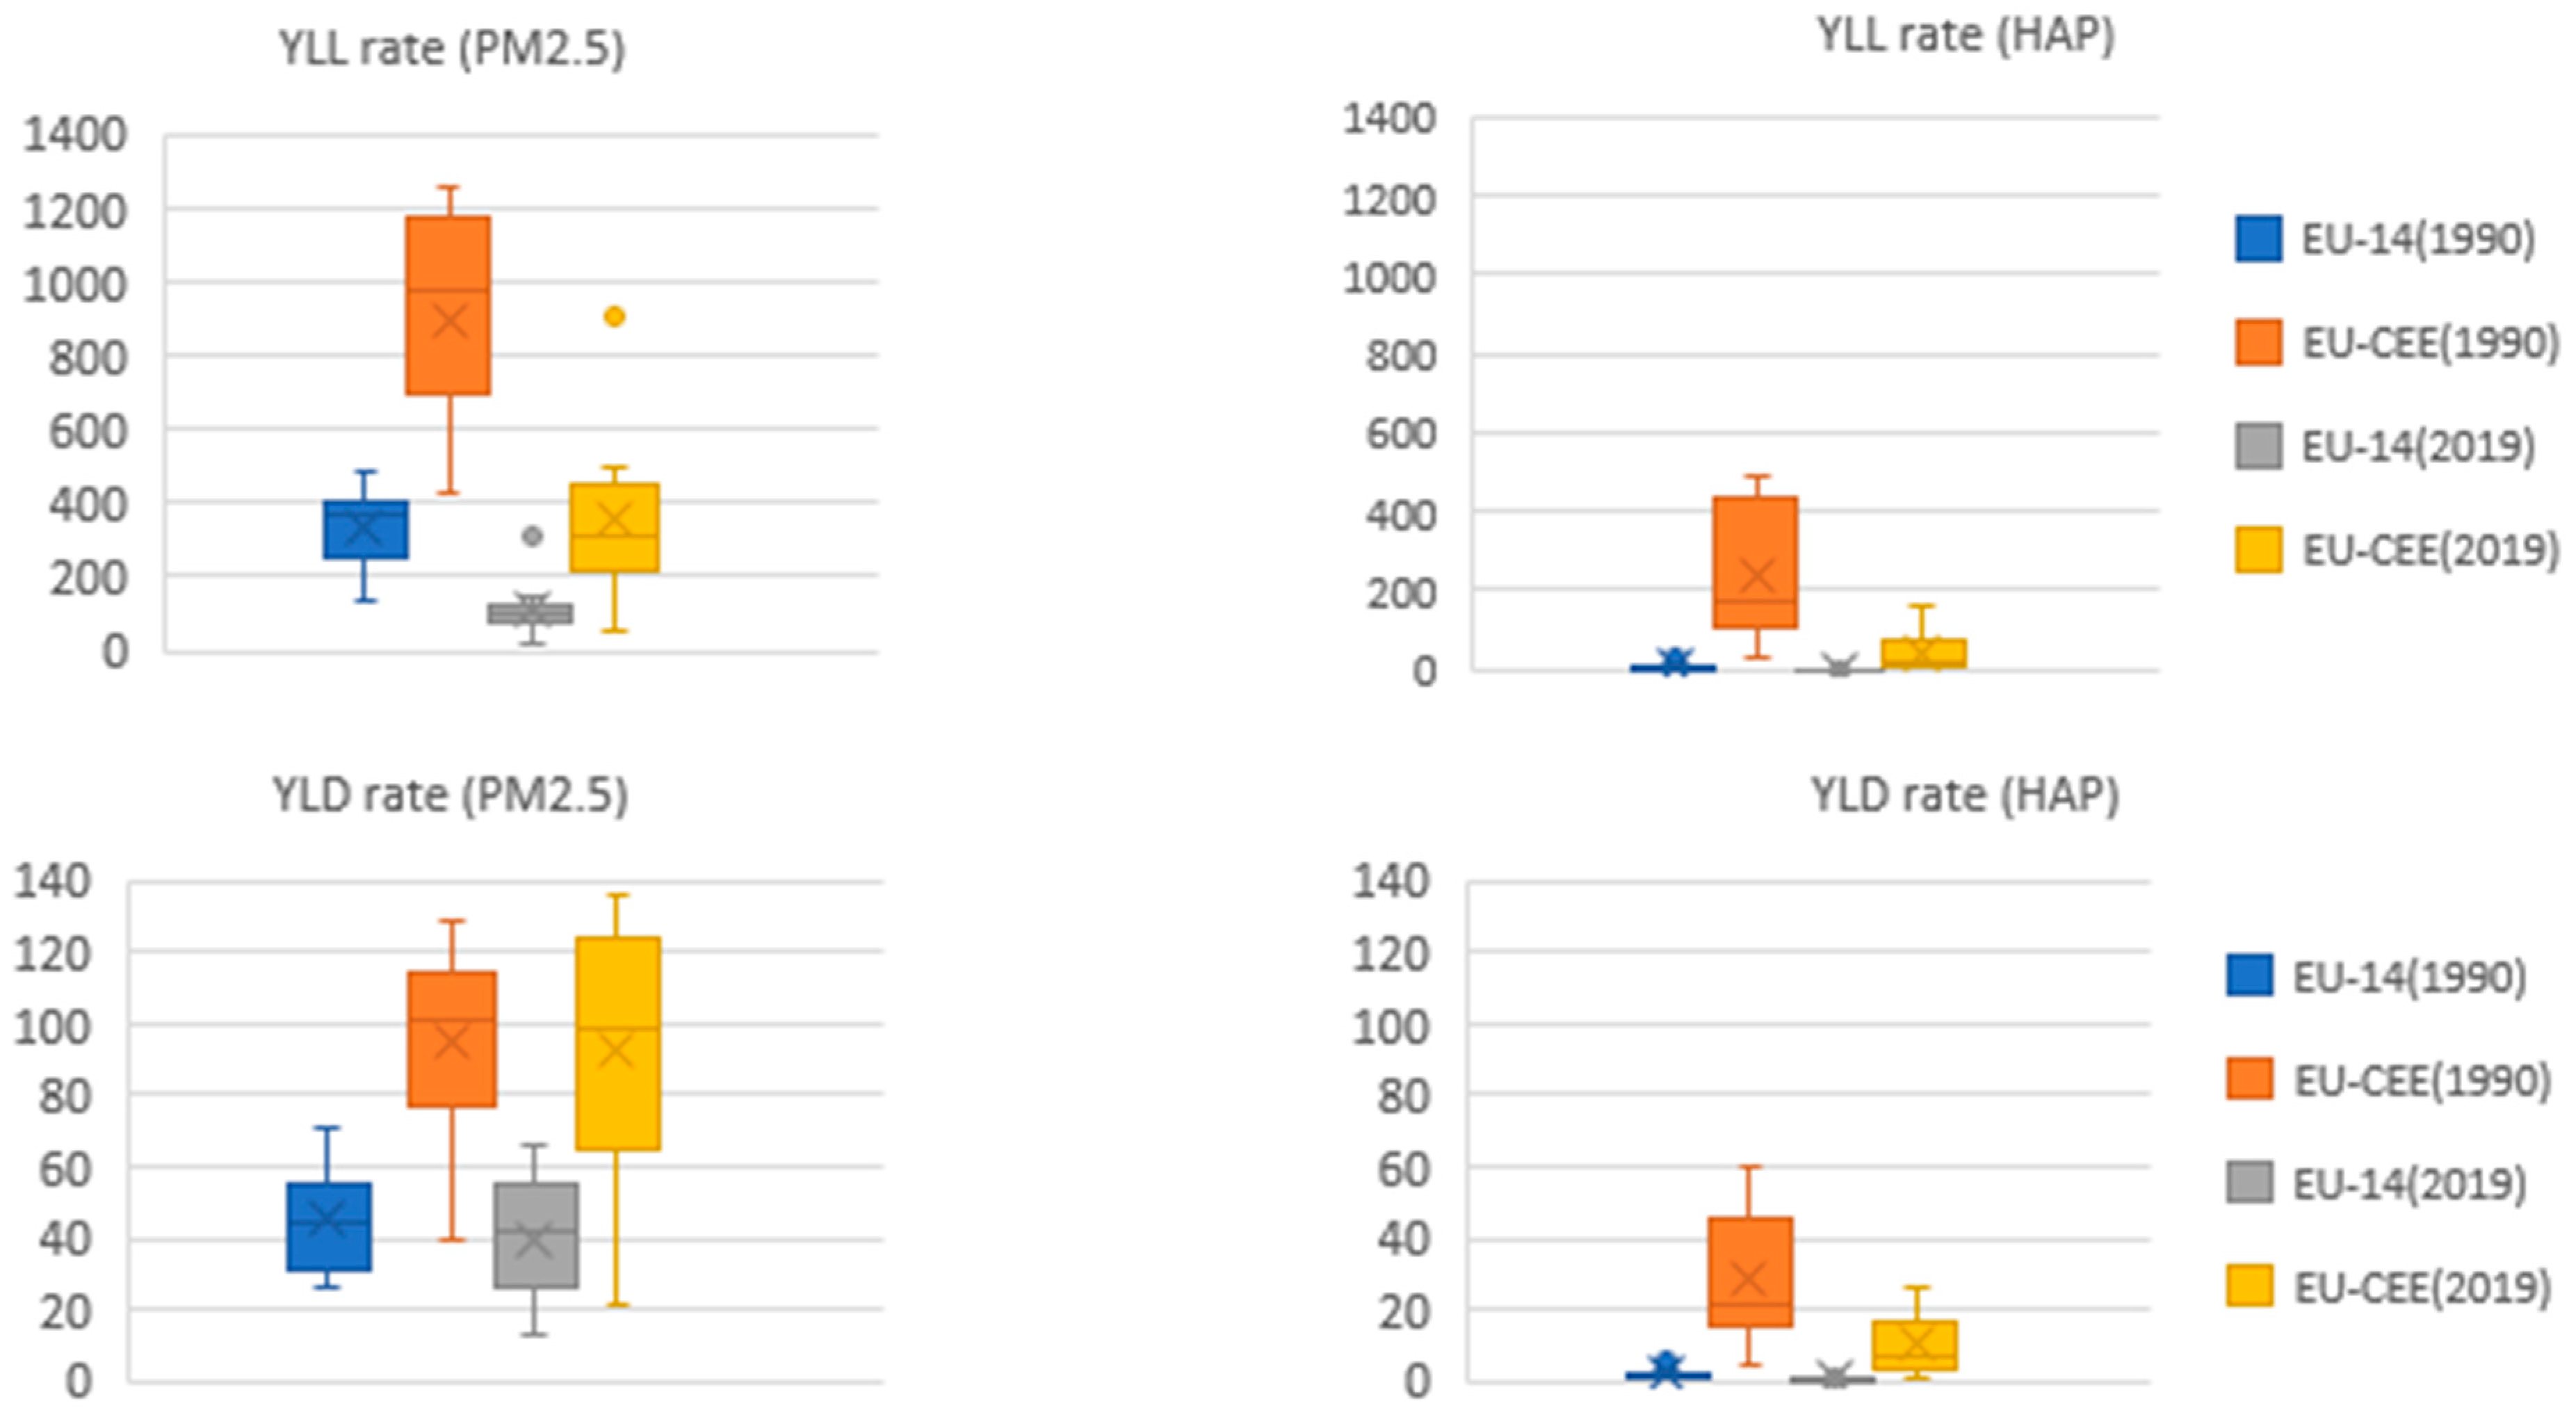
Considering the aim adopted by the research, the variables analyzed were aggregated for the population aged 20–54, assuming this age range as one characterized by maximum productivity. Data comparability between the EU Member States has been achieved using intensity indicators relating to the number of cases observed per population size (rate). Using statistical measures, the level of the differentiation of the parameters analyzed at the level of the EU-27 countries was determined.
In order to examine the level of inequality in the context of the “old” and “new” EU, two groups of countries were distinguished: (1) EU-14 countries representing highly developed economies with market traditions, admitted to the EU before 2004, and (2) EU-CEE countries, representing Central and Eastern Europe, admitted to the EU structures after 2004 with the experience of systemic transformation. To assess the level of inequality, the OR (odds ratio) indicator was used, which allows one to determine the statistical level of the “chance” of negative consequences of chronic diseases (premature death or loss of health) of the inhabitants of the Central and Eastern Europe region in relation to the inhabitants of the “old” EU. The estimation of the odds ratio (OR) determining the level of inequality between the groups studied was made according to the formula:
O R A x B = S ( A ) S ( B ) = P ( A ) 1 P ( A ) : P ( B ) P ( B )
where: S(A), S(B)—odds of the event in the exposed group A or group B, P(A), P(B)—the probabilities from group A or B.
Before starting the substantive assessment, the significance of the differences observed in the parameters examined between the selected groups of the EU-27 countries was assessed. It has been hypothesized that belonging to particular groups of EU countries has a significant impact on the level of the burden of chronic diseases (NCDs) resulting from air pollution in the working age group. As a consequence, there are significant differences between the EU-14 and EU-CEE groups studied in terms of the mean healthy life years lost due to air pollution (YLL rate, YLD rate) in the 20–54 age group.
The measurement of convergence occurring in the group of EU-27 countries in terms of the degree of burden with the effects of the impact of selected environmental factors (air pollution) on the number of the years of life (YLL) or health (YLD) lost among people of working age is part of the social convergence of the Member States, focusing on improving the working conditions and the living standard of the inhabitants. In this case, the expected effect of the convergence process is a reduction of the average level of the indicators examined with a simultaneous reduction in the level of their dispersion.
The analysis used the concept of conditional beta convergence taking into account various initial system conditions and the assumption that outliers catch up faster in relation to the target, as well as the concept of sigma convergence defined as a reduction in the dispersion of the results obtained in the period analyzed. The analysis assumes that beta convergence occurs in the area studied if countries with an initially worse value of the observed variable (the highest level of the YLL or YLD rate) make up for the gap, showing a faster transition to the expected state, i.e., reaching the lowest levels of relations of the parameters analyzed in the period assumed (t1/t0). The occurrence of the sigma convergence means that the expected reduction in the dispersion level of the feature examined (CV-coefficient of variation) has been achieved over time.
In order to show the basis of the studied phenomenon, data on the level of PM 2.5 (particulate matter with a diameter of 2.5 μm or less) in the studied EU-27 countries were collected. The level of reduction in PM 2.5 concentration achieved by these countries in 2009–2018 was estimated (Figure 1). The data presented are based on the European Environment Agency’s air quality report [20]. The indicated levels of annual average concentrations (in μg/m3) were expressed as population-weighted concentrations in accordance with the references described in the methodology by the European Topic Centre on Air Pollution, Noise, Transport and Industrial Pollution—ETC/ATNI (i.e., more widely than only from monitoring stations). The presented results indicate a high level of PM 2.5 pollution in the countries of Central and Eastern Europe. Moreover, in recent years, the countries of this region have not managed to achieve an appropriate reduction of PM 2.5. This indicates the persistence of the inequalities existing in this area and provides the basis for the assumption that the health inequalities existing within the EU, determined by environmental factors, will persist.

4. Results

According to the data from the Institute for Health Metrics and Evaluation on the burden of chronic diseases in global economies (GBD 2019), depending on the Member State, in the 20–54 age group, air pollution contributed to a development of chronic diseases, which caused from 0.6 (Finland) to 9.9% (Bulgaria) of premature deaths and 0.1% (Sweden) to 1.8% (Bulgaria) of healthy life years lost (Figure 2).
The analysis of the spatial distribution of the risk level of the impact of air pollution on the specified effects of chronic diseases indicates the existence of significant differences in the scale of this phenomenon observed in relation to individual EU-27 Member States; however, a particularly high risk of negative effects concerns the EU countries of Central and Eastern Europe. Consequently, in this group of EU countries, the rates of loss of healthy life as a result of premature death (YLL) or disability (YLD) as a result of environmental risk factors are much higher than in other EU countries (cf. Table 1 and Table 2).
In 2019, in the group of EU-27 countries, as a result of air pollution with particulate matter, the average number of life years lost as a result of premature death (YLL) per 100,000 people aged 20–54 amounted to 210. This factor in the group of EU economies resulted in a loss from 19.1 (Sweden) to 904.0 (Bulgaria) years of life per 100,000 people aged 20–54. A smaller scale of negative health effects was observed in relation to air pollution in households with solid fuels. This factor in the EU-27 group resulted in an average loss of 16.3 years per 100,000 people aged 20–54, with the highest value recorded in Bulgaria (163.3) and the lowest one in Sweden (2.0) (Table 1).
Over the period 1990–2019, the YLL rate level in the EU-27 group decreased by an average of 65.3% for the ambient particulate matter pollution factor and by 90.0% for the household air pollution from the solid fuels factor. In relation to the group studied of EU-27 countries, this change means on average an additional 350 years of healthy life per 100,000 people aged 20–54 as a result of reducing the negative impact of ambient particulate matter pollution on health and, analogically, an additional 86 years of life as a result of a limitation of household air pollution from solid fuels. This proves a positive tendency, in this respect, observed in the analyzed group of countries and it applies to all EU-27 countries.
The spatial distribution of the burden of air pollution effects in the population aged 20–54 indicates a particularly high risk of negative effects in the group of EU countries in Central and Eastern Europe (Figure 3). In the case of this group of countries, the rates of years lost as a result of premature death (YLL) are much higher than in other EU countries. In 2019, the average value of the YLL rate for ambient particulate matter pollution per 100,000 people aged 20–54 in the group of EU-CEE countries amounted to 352.6, which constitutes 330% of the value in the group of EU-14 countries (Table 1).
Despite large disproportions in the level of the burden of ambient particulate matter pollution between the groups, the average decrease rate of the YLL rate after 1990 in the group of Central and Eastern European countries was lower (a decrease by 62.5%) than in the corresponding period in the EU-14 group (a decrease by 69.3%). This indicates that disproportions persist in this respect. Similar changes were observed regarding the factor of air pollution in households with solid fuels, for which the average YLL rate for the population aged 20–54 in the EU-CEE group was 39.3, while the average in the EU-14 group was 0.53. In both groups, a significant decrease of the indicators examined was observed in the years 1990–2019. In the EU-14 group, this decrease was 91.7%, and in the EU-CEE group, this was 86.8%.
Years of healthy life lost as a result of disability (YLD) represent a smaller scale of the social costs of burdening the economies of the EU-27 with the effects of air pollution. In 2019, in the group of EU-27 countries as a result of air pollution with particulate matter, the average number of healthy life years lost as a result of disability (YLD) per 100,000 people aged 20–54 was 122.9. This factor in the group of EU economies resulted in the loss of healthy life years from 12.7 (Sweden) to 135.6 (Czechia) per 100,000 people aged 20–54. Furthermore, in this case, a smaller scale of negative health effects was observed in relation to air pollution in households with solid fuels. In the EU-27 group, this factor caused an average loss of 4.3 years of life per 100,000 people aged 20–54, with the highest value recorded in Bulgaria (26.1) and the lowest in Sweden (0.07) (Table 2).
Over the period 1990–2019, the YLD rate level in the EU-27 group decreased by 9.1% on average in the case of ambient particulate matter pollution and by 72.5% in the case of household air pollution from solid fuels. In relation to the group studied of EU-27 countries, this change means an additional 3.4 years of healthy life per 100,000 people aged 20–54 as a result of reducing the negative impact of ambient particulate matter pollution on health. Similarly, in the period analyzed, an average additional 8.2 years of life was obtained as a result of the reduction of household air pollution from solid fuels. This proves a positive tendency in this respect observed in the group studied of countries; however, in the case of some EU-27 countries, the ambient particulate matter pollution factor caused an increase in the YLD rate (cf. Table 2).
The spatial distribution of the level of air pollution in the population aged 20–54 proves that also in the case of the resulting health limitations and healthy life years lost as a result of this (YLD) in the group of EU-CEE countries, there are significantly higher levels of indicators than in other EU countries. In 2019, the average YLD value for ambient particulate matter pollution per 100,000 people aged 20–54 in the EU-CEE group was 92.1, which is over 230% of the value recorded in the EU-14 group (the mean value in the EU-14 group was 39.8) (Figure 4). In the period from 1990 to 2019, the average decrease rate of the YLD rate estimated for the ambient particulate matter pollution in the group of Central and Eastern European countries amounted to 6.0%, with analogous values in the EU-14 group at the level of 14.9%. This indicates a growing disproportion in this respect. Regarding the air pollution index in households using solid fuels, the average YLD rate for the population aged 20–54 in the EU-CEE group was 10.2, while the average in the EU-14 group was 0.28. It should be emphasized that in both groups there was a significant decrease in the indicators analyzed in the years 1990–2019. In the EU-14 group, the average decrease was 75.0%, and in the EU-CEE group it was 66.6%.
In order to confirm the measurability of the differences observed between the groups studied, the statistical significance was assessed. Based on the assessment of the normality of the distribution of the variables studied (the Shapiro–Wilk test), a scheme for testing the significance of differences was selected. When the normality of the distribution of variables was confirmed, the t-test was used to assess the significance of the distribution of differences for the independent samples tested or when the variances of the variable analyzed differed significantly, Welch’s test was used. For the variables for which the normality of the distribution was not confirmed, the non-parametric Mann–Whitney test was used to evaluate the differences. The calculations were performed in the Statistica 13 program. The values obtained using the test probability p (for α = 0.05) allowed for the rejection of the null hypothesis in all the cases, which means that the differences in the mean levels of all the parameters examined are statistically significantly different (cf. Table 3 and Table 4).
The observations presented above confirm that the burden of the EU-CEE countries with the social effects of air pollution significantly exceeds the level recorded in the countries of the “old” EU. In the case of both environmental factors analyzed, the risk of premature death or long-term illness in people of working age was significantly higher in the group of EU countries in Central and Eastern Europe. This proves that the gap existing in this area in 1990 did not decrease significantly in the period analyzed, including the period of the integration of the “new” EU into the structures of the European community. A summary of the results for both groups of member states is presented in Figure 5, at the same time presenting the path of “catching up” by the countries of Central and Eastern Europe with highly developed Western economies.
The indicated trends of decreasing parameters in both groups over time have a positive impact on the global level of burdening the EU area with the health effects of air pollution. However, the too-low decline rate of the parameters examined in the group of EU-CEE countries (with an initially worse position) as compared to the EU-14 countries causes the disproportions observed to persist over time (Figure 6).
The level of inequality in the scale of burdening the economies of EU countries with the effects of air pollution is confirmed by the “odds ratio”: OR estimated in the context of old and new EU countries. This allowed a determination of the level of the “chance” of the negative consequences of chronic diseases (premature death or loss of health) caused by air pollution among the inhabitants of Central and Eastern Europe in relation to people living in the countries of the “old” EU. The OR (YLL rate) results obtained indicate that the “chance” for an EU-CEE resident aged 20–54 to be adversely affected by chronic diseases (premature death) caused by air pollution is much greater than in the case of EU-14 residents. Their level of the “chance” of the loss of life years as a result of premature death due to particulate matter pollution was 2.3 (OR = 2.3). Much larger disproportions between the two groups of EU countries were observed in the case of the OR (YLL rate) analysis for the air pollution index for solid fuels in households. The “chance” level in this case was 34 (OR = 34). The “chance” indicator for the potential years of the disability of the EU-CEE inhabitants compared to the EU-14 inhabitants amounted to 3.3 (OR = 3.3) for the ambient particulate matter pollution and 78.6 (OR = 78.6) for household air pollution from solid fuels. A characteristic feature of the risk of both environmental factors analyzed is the level of the “chance” of negative health consequences in the group of the EU-CEE countries in relation to the EU-14 being increased in the years 1990–2019 (Table 5).
The assessment of the convergence process taking place in the group of EU-27 countries in the area of health and the related expected reduction of disproportions in the scale of the negative impact of the environmental factors studied on the burden of chronic diseases in people of working age was based on an assessment of changes in the YLL rate and the YLD rate, defining the number of health years lost per 100,000 people. Assuming different initial conditions for individual EU countries, determined by the level of YLL and YLD variables in 1990, the rate of changes of the parameters analyzed in individual countries over the years 1990–2019 was determined (relation 2019/1990). It was assumed that in the case of Member States with difficult initial conditions (high levels of YLL and YLD), this relationship should be as low as possible, indicating a rapid decline in the parameter analyzed, resulting in catching up with the group (beta convergence). The results obtained for the environmental risk factors tested are shown in Figure 7.
The results obtained for beta convergence indicate that no downward trend was observed in any of the systems examined, which would confirm the expected decrease in the level of this parameter with partial compensation of the distance by outlier countries. This proves the lack of significant convergence effects in the process analyzed. An additional analysis of changes in the dispersion level of the indicators studied in the years 1990–2019, conducted with the use of the variability index (sigma convergence), confirmed the sustained high level of the variability of the parameters studied in the period analyzed (Table 6).

5. Conclusions

The results of the analysis of the impact of environmental risk factors on the level of social burdens in the economies of EU countries confirm that these factors still constitute an important determinant of the health condition of their inhabitants. The long-term consequences lead to the loss of health or life, including for working age people. The results obtained confirmed the disproportionately large share of Central and Eastern European countries in this phenomenon. The high level of the inequality between the countries of the “old” and “new” EU, diagnosed in terms of the impact of environmental risk factors, occurred both in relation to the health effects of ambient particulate matter pollution and air pollution in households from solid fuels. The relatively high mortality rate determined by the negative impact of air pollution proved to be a significant problem for the EU-CEE countries. The analysis of the catching-up process by the countries with the least favorable situation (i.e., the highest level of health burden caused by air pollutants) carried out in the EU-27 group did not show a positive effect of convergence in this respect. In all of the systems tested, no real effect of reducing the disproportions in the levels of the indicators examined over time was observed. Despite the cohesion policy implemented in the EU, the phenomenon analyzed is still highly dispersed.
The obtained results go beyond the framework presented so far in the literature on health effects of exposure to air pollution [20,34] and introduce the perspective of the existing inequalities in the study area observed between EU economies. Showing the environmental conditions in the context of the limitations of the potential productivity of labor resources provides the basis for estimating the measurable economic effects of reducing the observed disproportions between the EU-CEE and EU-14 areas.
The results obtained indicate that the problem of the influence of environmental factors on the level of health identifies a number of challenges necessary to understand the role of universally comprehended determinants of health in the process of achieving equality in health by society. The cause–effect pathways linking these factors with health, as well as the existence of many additional variables related to the phenomenon of health inequalities, significantly limit the possibilities of studying these factors through scientific experiments. The scale of the problem outlined in the presented research, as well as the scope of the consequences (loss of health or life) suggest that the issue of possible actions reducing the existing inequalities in this area should become part of a rational cohesion policy. The results obtained from the assessment of the convergence process taking place among the EU countries in health inequalities constitute a real basis for designing actions in the field of a rational cohesion policy and estimating the economic costs of the phenomenon of the limited productivity of human resources. The results presented from the analysis constitute the authors’ own contribution to the discussion on the scale, causes, and costs of socio-economic health inequalities observed in the context of the old and new EU.

Author Contributions

Conceptualization, A.J. and M.R.; Formal analysis, A.J.; Funding acquisition, A.J.; Investigation, A.J. and M.R.; Methodology, A.J.; Resources, A.J. and M.R.; Validation, M.R.; Visualization, A.J.; Writing–original draft, A.J.; Writing–review & editing, A.J. All authors have read and agreed to the published version of the manuscript.

Funding

This research received no external funding.

Institutional Review Board Statement

Not applicable.

Informed Consent Statement

Not applicable.

Data Availability Statement

Global Burden of Disease Collaborative Network. Global Burden of Disease Study 2019 (GBD 2019) Results. Seattle, United States: Institute for Health Metrics and Evaluation (IHME), 2020. Available from https://vizhub.healthdata.org/gbd-results/ (accessed on 26 May 2022).

Conflicts of Interest

The authors declare no conflict of interest.

References

  1. Busse, R.; Blümel, M.; Scheller-Kreinsen, D.; Zentner, D. Tackling Chronic Disease in Europe. In Strategies, Interventions and Challenges; World Health Organization: Geneva, Switzerland, 2010; Available online: https://apps.who.int/iris/handle/10665/326484 (accessed on 10 May 2022).
  2. Bartley, M.; Sacker, A.; Clarke, P. Employment status, employment conditions, and limiting illness: Prospective evidence from the British household panel survey 1991–2001. J. Epidemiol. Community Health 2004, 58, 501–506. [Google Scholar] [CrossRef] [PubMed]
  3. Haan, P.; Myck, M. Dynamics of health and labor market risks. J. Health Econ. 2009, 28, 1116–1125. [Google Scholar] [CrossRef] [PubMed]
  4. Aghion, P.; Howitt, P.; Murtin, F. The relationship between health and growth: When Lucas meets Nelson-Phelps. Natl. Bur. Econ. Res. 2010, w15813, 94–126. [Google Scholar] [CrossRef]
  5. Jakubowska, A.; Horváthová, Z. Economic Growth and Health: A Comparative Study of the EU Countries. Econ. Sociol. 2016, 9, 158–168. [Google Scholar] [CrossRef] [PubMed]
  6. Jakubowska, A.; Bilan, S.; Werbiński, J. Chronic diseases and labour resources: “Old and new” European Union member states. J. Int. Stud. 2021, 14, 129–138. [Google Scholar] [CrossRef]
  7. William, J.; Lewis, M. Health Investments and Economic Growth: Macroeconomic Evidence and Microeconomic Foundations. In World Bank Policy Research Working Paper Series; World Bank: Washington, DC, USA, 2009. [Google Scholar]
  8. Van Rijn, R.M.; Robroek, S.J.; Brouwer, S.; Burdorf, A. Influence of poor health on exit from paid employment: A systematic review. Occup. Environ. Med. 2014, 71, 295–301. [Google Scholar] [CrossRef]
  9. Rice, N.E.; Lang, I.A.; Henley, W.; Melzer, D. Common health predictors of early retirement: Findings from the English Longitudinal Study of Ageing. Age Ageing 2011, 40, 54–61. [Google Scholar] [CrossRef]
  10. Bloom, D.E.; Canning, D.; Fink, G. Disease and development revisited. J. Political Econ. 2014, 122, 1355–1366. [Google Scholar] [CrossRef]
  11. Abegunde, D.; Stanciole, A. An Estimation of the Economic Impact of Chronic Noncommunicable Diseases in Selected Countries; Working paper; WHO Department of Chronic Diseases and Health Promotion (CHP): Geneva, Switzerland, 2006. [Google Scholar]
  12. Brown, S.; Sessions, J.G. The economics of absence: Theory and evidence. J. Econ. Surv. 1996, 10, 23–53. [Google Scholar] [CrossRef]
  13. Radlińska, K.; Klonowska-Matynia, M.; Jakubowska, A.; Kwiatkowski, G. Labor hoarding: An old phenomena in modern times? Case study for EU countries. J. Bus. Econ. Manag. 2020, 21, 872–889. [Google Scholar] [CrossRef]
  14. Mannino, D.M.; Buist, A.S. Global burden of COPD: Risk factors, prevalence, and future trends. Lancet 2007, 370, 765–773. [Google Scholar] [CrossRef]
  15. Brownson, R.C.; Haire-Joshu, D.; Luke, D.A. Shaping the context of health: A review of environmental and policy approaches in the prevention of chronic diseases. Annu. Rev. Public Health 2006, 27, 341–370. [Google Scholar] [CrossRef] [PubMed]
  16. Rosário Filho, N.A.; Urrutia-Pereira, M.; d′Amato, G.; Cecchi, L.; Ansotegui, I.J.; Galán, C.; Pomés, A.; Murrieta-Aguttes, M.; Caraballo, L.; Rouadi, P.; et al. Air pollution and indoor settings. World Allergy Organ. J. 2021, 14, 100499. [Google Scholar] [CrossRef] [PubMed]
  17. Łyszczarz, B.; Sowa, K. Production losses due to mortality associated with modifiable health risk factors in Poland. Eur. J. Health Econ. 2022, 23, 33–45. [Google Scholar] [CrossRef]
  18. Roth, G.A.; Mensah, G.A.; Johnson, C.O.; Addolorato, G.; Ammirati, E.; Baddour, L.M.; Barengo, N.C.; Beaton, A.Z.; Benjamin, E.J.; Benziger, C.P.; et al. Global Burden of Cardiovascular Diseases Writing Group. Global burden of cardiovascular diseases and risk factors, 1990–2019: Update from the GBD 2019 study. J. Am. Coll. Cardiol. 2020, 76, 2982–3021. [Google Scholar] [CrossRef]
  19. Hammer, M.S.; van Donkelaar, A.; Li, C.; Lyapustin, A.; Sayer, A.M.; Hsu, N.C.; Levy, R.C.; Garay, M.J.; Kalashnikova, O.V.; Kahn, R.A.; et al. Global estimates and long-term trends of fine particulate matter concentrations (1998–2018). Environ. Sci. Technol. 2020, 54, 7879–7890. [Google Scholar] [CrossRef]
  20. European Environment Agency; González Ortiz, A.; Guerreiro, C.; Soares, J. Air Quality in Europe: 2020 Report; European Environment Agency, Publications Office: Copenhagen, Denmark, 2020. [CrossRef]
  21. Stanaway, J.D.; Afshin, A.; Gakidou, E.; Lim, S.S.; Abate, D.; Abate, K.H.; Abbafati, C.; Abbasi, N.; Abbastabar, H.; Abd-Allah, F.; et al. Global, regional, and national comparative risk assessment of 84 behavioural, environmental and occupational, and metabolic risks or clusters of risks for 195 countries and territories, 1990–2017: A systematic analysis for the Global Burden of Disease Study 2017. Lancet 2018, 392, 1923. [Google Scholar] [CrossRef]
  22. Murray, C.J.; Aravkin, A.Y.; Zheng, P.; Abbafati, C.; Abbas, K.M.; Abbasi-Kangevari, M.; Abd-Allah, F.; Abdelalim, A.; Abdollahi, A.; Abdollahpour, I.; et al. Global burden of 87 risk factors in 204 countries and territories, 1990–2019: A systematic analysis for the Global Burden of Disease Study 2019. Lancet 2020, 396, 1223–1249. [Google Scholar] [CrossRef]
  23. Global Burden of Disease Collaborative Network. Global Burden of Disease Study 2019 (GBD 2019) Results; Institute for Health Metrics and Evaluation (IHME): Seattle, WA, USA, 2020; Available online: https://vizhub.healthdata.org/gbd-results/ (accessed on 26 May 2022).
  24. Pimpin, L.; Retat, L.; Fecht, D.; de Preux, L.; Sassi, F.; Gulliver, J.; Belloni, A.; Ferguson, B.; Corbould, E.; Jaccard, A.; et al. Estimating the cross of air pollution to the National Health Service and social care: An assessment and forecast up to 2035. PLoS Med. 2018, 15, e1002602. [Google Scholar] [CrossRef]
  25. Krewski, D.; Jerrett, M.; Burnett, R.T.; Ma, R.; Hughes, E.; Shi, Y.; Turner, M.C.; Pope, C.D., III; Thurston, G.; Calle, E.E.; et al. Extended Follow-Up and Spatial Analysis of the American Cancer Society Study Linking Particulate Air Pollution and Mortality; Health Effects Institute: Boston, MA, USA, 2009; Volume 140. [Google Scholar]
  26. Qiu, H.; Tan, K.; Long, F.; Wang, L.; Yu, H.; Deng, R.; Long, H.; Zhang, Y.; Pan, J. The burden of COPD morbidity attributable to the interaction between ambient air pollution and temperature in Chengdu, China. Int. J. Environ. Res. Public Health 2018, 15, 492. [Google Scholar] [CrossRef]
  27. Mills, I.C.; Atkinson, R.W.; Kang, S.; Walton, H.; Anderson, H.R. Quantitative systematic review of the associations between short-term exposure to nitrogen dioxide and mortality and hospital admissions. BMJ Open 2015, 5, e006946. [Google Scholar] [CrossRef] [PubMed]
  28. Burnett, R.T.; Pope, C.A., III; Ezzati, M.; Olives, C.; Lim, S.S.; Mehta, S.; Shin, H.H.; Singh, G.; Hubbell, B.; Brauer, M.; et al. An integrator risk function for estimating the global burden of disease attributable to ambient fine particulate matter exposure. Environ. Health Perspect. 2014, 122, 397–403. [Google Scholar] [CrossRef] [PubMed]
  29. Analitis, A.; De’Donato, F.; Scortichini, M.; Lanki, T.; Basagana, X.; Ballester, F.; Astrom, C.; Paldy, A.; Pascal, M.; Gasparrini, A.; et al. Synergistic effects of ambient temperature and air pollution on health in Europe: Results from the PHASE project. Int. J. Environ. Res. Public Health 2018, 15, 1856. [Google Scholar] [CrossRef] [PubMed]
  30. Goldberg, M.A. systematic review of the relation between long-term exposure to ambient air pollution and chronic diseases. Rev. Environ. Health 2008, 23, 243–298. [Google Scholar] [CrossRef] [PubMed]
  31. Holland, M. Cost-Benefit Analysis of Final Policy Scenarios for the EU Clean Air Package; European Maritime Safety Agency: Lisbon, Portugal, 2014. Available online: https://policycommons.net/artifacts/1955087/cost-benefit-analysis-of-final-policy-scenarios-for-the-eu-clean-air-package/2706855/ (accessed on 10 May 2022).
  32. Martinez, G.S.; Spadaro, J.V.; Chapizanis, D.; Kendrovski, V.; Kochubovski, M.; Mudu, P. Health impacts and economic costs of air pollution in the metropolitan area of Skopje. Int. J. Environ. Res. Public Health 2018, 15, 626. [Google Scholar] [CrossRef] [PubMed]
  33. Hanly, P.; Soerjomataram, I.; Sharp, L. Measuring the societal burden of cancer: The cost of lost productivity due to premature cancer-related mortality in Europe. Int. J. Cancer 2015, 136, E136–E145. [Google Scholar] [CrossRef]
  34. Dechezleprêtre, A.; Rivers, N.; Stadler, B. The Economic Cost of Air Pollution: Evidence from Europe. In OECD Economics Department Working Papers; No. 1584; OECD Publishing: Paris, France, 2019. [Google Scholar] [CrossRef]
  35. Gouveia, N. Addressing Environmental Health Inequalities. Int. J. Environ. Res. Public Health 2016, 13, 858. [Google Scholar] [CrossRef]
  36. Ashraf, Q.H.; Lester, A.; Weil, D.N. When Does Improving Health Raise GDP? NBER Macroecon. Annu. 2008, 23, 157–204. [Google Scholar] [CrossRef] [Green Version]
  37. Briggs, D. Environmental pollution and the global burden of disease. Br. Med. Bull. 2003, 68, 1–24. [Google Scholar] [CrossRef]
  38. Lahelma, E. Health inequalities—The need for explanation and intervention. Eur. J. Public Health 2006, 16, 339. [Google Scholar] [CrossRef]
  39. Diderichsen, F. Resource Allocation for Health Equity: Issues and Methods; World Bank: Washington, DC, USA, 2004. [Google Scholar]
  40. Mushkin, S.J. Health as an Investment. J. Political Econ. 1962, 70 Pt 2, 129–157. [Google Scholar] [CrossRef]
  41. Grossman, M. The Human Capital Model. In Handbook of Health Economics; Culyer, A.J., Newhouse, J.P., Eds.; Elsevier: New York, NY, USA, 2000; Volume 1A. [Google Scholar]
  42. Lechtenböhmer, S.; Barthel, C.; Merten, F.; Schneider, C.; Schüwer, D.; Seifried, D. Redesigning urban infrastructures for a low-emission future. An overview of urban low-carbon technologies. SAPI EN. S. Surv. Perspect. Integr. Environ. Soc. 2010, 3, 1–16. Available online: https://journals.openedition.org/sapiens/1042 (accessed on 12 May 2022).
  43. Rabe, M. Energetyka Rozproszona w Polityce Regionalnej; CeDeWu: Warszawa, Poland, 2021. [Google Scholar]
  44. Williams, A. Calculating the global burden of disease: Time for a strategic reappraisal? Health Econ. 1999, 8, 1–8. [Google Scholar] [CrossRef]
  45. Murray, C.J.; Lopez, A.D. Measuring the global burden of disease. N. Engl. J. Med. 2013, 369, 448–457. [Google Scholar] [CrossRef] [PubMed] [Green Version]
Figure 1. Spatial distribution of the level of PM 2.5 and relative reductions (%) in PM 2.5 in 2009–2018 (EU-27 Member States).
Energies 15 06225 g001
Figure 2. Spatial distribution of the level of risk of air pollution impact on specific consequences of chronic diseases, population aged 20–54 (EU-27 Member States, in 2019).
Energies 15 06225 g002
Figure 3. Spatial distribution of parameters YLL rate, population aged 20–54 (EU-27, in 1990 and 2019). (a) Ambient particulate matter pollution (PM 2.5). (b) Household air pollution from solid fuels (HAP).
Energies 15 06225 g003
Figure 4. Spatial distribution of YLD rate parameters, population aged 20–54 (EU-27, in 1990 and 2019). (a) Ambient particulate matter pollution (PM 2.5). (b) Household air pollution from solid fuels (HAP).
Energies 15 06225 g004
Figure 5. Changes in the burden of air pollution in 2000–2019, YLL and YLD per 100,000 people (groups of EU-27 countries).
Energies 15 06225 g005
Figure 6. Distribution of the parameters of healthy life years lost (YLL and YLD) due to chronic diseases caused by air pollution per 100,000 population aged 20–54 (by EU-27 groups, 1990 and 2019).
Energies 15 06225 g006
Figure 7. Catching-up effect in EU-27 of YLL and YLD per 100,000 people aged 20–54 in 2019 and change in 1990–2019 (beta convergence). (a) Ambient particulate matter pollution (PM 2.5). (b) Household air pollution from solid fuels (HAP).
Energies 15 06225 g007
Table 1. Number of years of life lost (YLL) due to chronic diseases as a result of air pollution per 100,000 people aged 20–54 (EU-27 countries, in 2019 and change in 1990–2019).
EU Member StatesGroups of EUAmbient Particulate Matter PollutionHousehold Air Pollution from Solid Fuels
YLL Rate (2019)Percentage Change
1990–2019
RankingsYLL Rate (2019)Percentage Change
1990–2019
Rankings
2019199020191990
BulgariaEU-CEE904.0−27.5%12163.35−62.1%13
RomaniaEU-CEE501.8−31.6%2875.48−84.7%31
HungaryEU-CEE444.8−64.7%3178.98−83.8%22
PolandEU-CEE388.0−66.9%4335.52−90.7%44
SlovakiaEU-CEE337.8−67.6%543.00−91.2%1011
CroatiaEU-CEE313.2−61.1%6715.37−89.5%67
GreeceEU-14310.0−28.1%7122.02−88.6%1214
LatviaEU-CEE295.7−69.5%8623.84−86.6%56
LithuaniaEU-CEE253.0−63.9%9910.69−90.9%98
CzechiaEU-CEE220.5−77.7%1052.57−91.8%1112
Cyprus-177.6−50.3%11200.32−96.2%1815
SloveniaEU-CEE165.9−69.9%121011.39−88.9%89
ItalyEU-14145.7−63.0%13160.68−90.9%1516
Malta-132.5−55.1%14210.33−94.9%1717
GermanyEU-14131.9−72.6%15110.13−84.7%2527
BelgiumEU-14125.3−69.5%16140.20−92.0%2021
FranceEU-14115.7−56.4%17220.30−86.7%1922
NetherlandsEU-14112.3−69.4%18180.13−92.1%2424
AustriaEU-14109.3−71.1%19170.37−89.0%1620
SpainEU-1494.7−60.7%20251.75−93.2%1313
PortugalEU-1481.6−67.1%21241.20−96.6%1410
DenmarkEU-1480.8−80.0%22150.12−91.7%2625
LuxembourgEU-1479.1−78.3%23190.17−91.6%2223
EstoniaEU-CEE53.8−87.3%241311.85−95.0%75
IrelandEU-1452.6−79.9%25230.18−95.6%2118
FinlandEU-1425.1−87.9%26260.14−96.0%2319
SwedenEU-1419.1−86.0%27270.07−94.9%2726
Selected statistics
AverageEU-27210.1−65.3% 16.30−90.0%
Interval884.8 163.28
AverageEU-14105.9341−69.3%0.53−91.7%
Interval290.9 1.94
AverageEU-CEE352.6−62.5%39.8−86.8%
Interval850.2 151.5
Table 2. Number of years lived with disability (YLD) due to chronic diseases as a result of air pollution per 100,000 people aged 20–54 (EU-27 countries, in 2019 and change in 1990–2019).
EU Member StatesGroups of EUAmbient Particulate Matter pollutionHousehold Air Pollution from Solid Fuels
YLD Rate (2019)Percentage Change
1990–2019
RankingsYLD Rate (2019)Percentage Change
1990–2019
Rankings
2019199020191990
CzechiaEU-CEE135.65.7%111.87−61.7%1012
BulgariaEU-CEE126.711.0%2326.15−42.0%13
PolandEU-CEE123.810.7%3413.76−68.3%44
HungaryEU-CEE112.2−6.8%4223.65−57.0%22
CroatiaEU-CEE106.04.6%566.25−71.2%76
SlovakiaEU-CEE98.1−5.1%651.08−73.3%1213
RomaniaEU-CEE90.617.1%7916.08−73.0%31
SloveniaEU-CEE86.2−2.9%877.32−62.9%57
GreeceEU-1466.521.1%9140.56−80.5%1414
LatviaEU-CEE64.4−22.0%1086.85−63.9%68
ItalyEU-1464.2−3.8%11120.50−76.7%1515
GermanyEU-1460.0−16.0%12100.08−53.2%2427
BelgiumEU-1453.5−6.7%13130.11−75.2%2221
Malta-53.13.6%14170.18−87.3%1716
Cyprus-51.625.1%15190.13−89.3%1817
LithuaniaEU-CEE49.1−30.7%16112.89−80.8%99
NetherlandsEU-1445.0−14.9%17150.07−78.4%2725
AustriaEU-1443.6−15.4%18160.21−66.6%1618
SpainEU-1442.410.7%19221.20−78.8%1111
LuxembourgEU-1441.11.0%20200.12−62.6%1924
PortugalEU-1433.5−10.8%21230.63−89.9%1310
DenmarkEU-1431.6−34.1%22180.07−71.1%2626
FranceEU-1426.9−16.1%23240.10−73.7%2323
IrelandEU-1422.3−22.0%24260.11−80.9%2120
EstoniaEU-CEE20.9−47.6%25215.98−78.1%85
FinlandEU-1414.3−46.0%26270.12−80.1%2019
SwedenEU-1412.7−56.1%27250.07−81.6%2522
Selected statistics
AverageEU-2762.1−9.1% 4.30−72.5%
Interval122.9 26.09
AverageEU-1439.8−14.9%0.28−75.0%
Interval53.8 7.24
AverageEU-CEE92.1−6.0%10.17−66.6%
Interval114.7 14.2
Table 3. Parameters of a Normal Distribution.
ParametersMean EU-14Mean EU-CEEt-TestWelch’s TestBrown—Forsy the Test
tdfptdfpBrn-Fors F(1.df)df Brn-Forsp Brn-Fors
YLDrate (PM 2.5) 199045.377294.4288−6.04802230.000004−5.6621814.820360.0000472.44880230.131271
YLDrate (PM 2.5) 201939.825492.1480−4.86778230.000065−4.5080113.784290.0005103.70073230.066852
Table 4. Parameters of a non-normal distribution.
ParametersMann–Whitney U Test
Sum.Rang EU-14Sum.Rang EU-CEEUZpZ Correc.p
YLLrate (PM 2.5) 1990107.0000218.00002.00000−4.078490.000045−4.078490.000045
YLLrate (PM 2.5) 2019120.0000205.000015.00000−3.366810.000761−3.366810.000761
YLLrate (HAP) 1990107.0000218.00002.00000−4.078490.000045−4.078490.000045
YLLrate (HAP) 2019105.0000220.00000.00000−4.187980.000028−4.187980.000028
YLDrate (HAP) 1990109.0000216.00004.00000−3.969000.000072−3.969000.000072
YLDrate (HAP) 2019106.0000219.00001.00000−4.133240.000036−4.133240.000036
Table 5. OR index: “odds” on the occurrence of negative consequences of chronic conditions (premature death or health loss) as a result of air pollution among the inhabitants of Central and Eastern Europe compared to the inhabitants of the EU-14 countries (in 1990 and 2019).
1990201919902019
PM 2.5HAP
OR (YLD rate)2.12.319.134.0
OR (YLL rate)2.83.330.978.6
Table 6. Coefficient of the variation of CV in EU-27, YLL and YLD per 100,000 people aged 20–54 in 1990 and 2019 (sigma convergence).
1990201919902019
PM 2.5HAP
CV (YLD rate)46.5%56.7%142.2%152.6%
CV (YLL rate)59.9%88.7%153.6%217.4%
Publisher’s Note: MDPI stays neutral with regard to jurisdictional claims in published maps and institutional affiliations.

