Article

Experiment and Application of Wax Deposition in Dabei Deep Condensate Gas Wells with High Pressure

1
School of Petroleum Engineering, China University of Petroleum (East China), Qingdao 266580, China
2
PetroChina Tarim Oilfield Company, Korla 841000, China
3
State Key Laboratory of Oil and Gas Reservoir Geology and Exploitation, Southwest Petroleum University, Chengdu 610500, China
*
Author to whom correspondence should be addressed.
Energies 2022, 15(17), 6200; https://doi.org/10.3390/en15176200
Submission received: 6 August 2022 / Revised: 22 August 2022 / Accepted: 23 August 2022 / Published: 26 August 2022
(This article belongs to the Special Issue Advanced Petroleum and Nature Gas Exploration Technology)

Abstract

:
The Dabei deep high-pressure condensate gas field occupies the paramount position in the Tarim Oilfield in China, the exploration and developments of which have been progressing. Since the initial development, the wax deposition and plugging in the wellbore and gathering pipeline have been the most bothering issues, resulting in the reduction or even shutdown of condensate gas well production. Therefore, the wax appearance temperature of Dabei condensate oil was studied using the capillary viscometer, differential scanning calorimetry (DSC), and polarizing microscope observation. The wax content was tested by using the DSC and crystallization separation test method. Finally, the wax appearance temperatures of degassed condensate oil and equilibrium condensate oil under different pressures were tested. Experimental results show that the wax appearance temperature measured by polarizing microscope observation was higher than that measured by the DSC and capillary viscometer, the lag of which can be recorded as the cloud point. The wax appearance temperature measured by polarizing microscope observation is of high accuracy. Secondly, the DSC method is not sufficient for measuring wax precipitation at low temperatures, showing a lower wax content than the crystallization separation test method. Thus, the wax content of Dabei condensate oil can be better measured by using the crystallization separation test method. Additionally, the wax precipitation law of equilibrium condensate oil is opposite to that of degassed condensate oil. The wax appearance temperature of equilibrium condensate oil increases as the pressure decreases. The results of wax appearance temperature of equilibrium condensate oil provide a useful and quick index to judge the potential risk of wax precipitation in the Tarim Oilfield, which can provide an efficient strategy for the development of waxy condensate gas reservoirs and the optimization of wax prevention and treatment technology.

1. Introduction

The Kuqa depression is one of the most important natural gas bases of the West to East Gas project in China, which is located in the north of the Tarim Basin. Bozi, Dabei, and other blocks are rich in condensate gas resources. Owing to the phase changes during the development, a huge amount of waxy condensate oil often generates during gas production, causing severe wax plugging of condensate gas wells [1,2]. Dabei and Bozi condensate fields are the dominant blocks in Kuqa, which experience severe wax deposition and plugging in the wellbore and pipeline (Figure 1), leading to a declining supply of natural gas.
To reduce or avoid wax plugging in the wellbore, it is necessary to figure out the wax appearance temperature [3,4,5]. This wax appearance temperature is often used to determine the critical conditions for wax crystal precipitation of waxy fluids. Currently, the commonly used experimental methods include viscometer, differential scanning calorimetry (DSC), polarizing microscope observation, laser, and ultrasonic. Mark et al. [6] used cross-polarized microscopy to monitor changes in wax crystal size and morphology. Japper et al. [7] compared wax appearance temperatures obtained using micro differential scanning calorimeter, cross-polarized microscopy, and controlled stress rheometer and discussed the effects of cooling rate on the wax appearance temperature and wax aggregation. Hans et al. [8], Mustafa et al. [9] measured the wax appearance temperatures of crude oils using viscometer, DSC, and polarizing microscope observation. They found that a capillary viscometer and DSC were likely to underestimate the onset temperature of initial wax deposition. Moreover, they tested the wax appearance temperature of crude oil using different experimental methods, while the abovementioned experiments were conducted under atmospheric pressure. Meray et al. [10], Hammami et al. [11], and Jiang et al. [12] used laser and ultrasonic methods to study the wax appearance temperature of crude oil saturated with gas. This method can test the wax appearance temperature under a high pressure; however, the formation of wax crystals cannot be observed. Wang et al. [13] used the self-designed microscopic solid deposition tester to analyze the wax precipitation characteristics of condensate gas wells in the Bozi block of Tarim; however, the wax appearance temperature test results were unable to identify the wax precipitation risk of field wellbore or surface pipeline. Juyal et al. [14] tested wax precipitation on condensate oil by using high-pressure DSC, and the wax appearance temperature obtained under the high-pressure conditions showed a certain hysteresis.
Although there are several methods for the wax appearance temperature measurement, the accuracy of the experimental results varies. Specifically, a unified understanding is lacking in the wax appearance temperature testing methods for waxy condensate oil in condensate gas fields, and a method for testing the condensate under high pressure is needed. To solve the wax problems of the condensate oil of the Dabei condensate gas field, different experimental methods were used to test the wax appearance temperature and wax content, and the accuracy and applicability of each test method were evaluated. Finally, an efficient method combining the field production data to judge the risk of wax precipitation was proposed. This study provides an efficient strategy for the development of waxy condensate gas reservoirs and the optimization technology of wax prevention.

2. Experiment

2.1. Experimental Samples

The experimental samples are obtained from the condensate oil from wells A and B in the Dabei condensate gas field. To understand the basic properties of the test condensate oil, we tested the components using a gas chromatograph, and the results are shown in Table 1. The wax, resins, and asphaltenes contents of condensate oil are tested using the standard SY/T 7550-2012 determination of wax, resins and asphaltenes in crude oil, which is called the crystallization separation test method [15]. The experiment proceeds as follows: (a) Use n-heptane to dissolve the condensate oil and precipitate asphaltene, then use toluene to dissolve asphaltene and remove the solvent to obtain the asphaltene content. (b) When the temperature drops to −20 °C, the wax content in crude oil is determined using freezing crystallization method, and the resin content is calculated by subtracting wax and asphaltene content. The results are shown in Table 2. The heavy components of the Dabei condensate oil are high, and the C11+ components exceed 69%. In addition, the content of wax and resins is high while the content of asphaltenes is extremely low. According to the classification standard for wax content of crude oil (low wax crude oil with wax content of 0.5–2.5%, medium wax crude oil with a wax content of 2.5–10%, and high wax crude oil with a wax content exceeding 10%), the experimental condensate oil falls under medium wax crude oil and low resin oil. The organic macerals of source rocks in the Dabei block are mainly exinite and sapropelinite, and the contents of vitrinite and inertinite are low. They lead to medium wax content and low asphaltene content of the Dabei condensate oil [16].

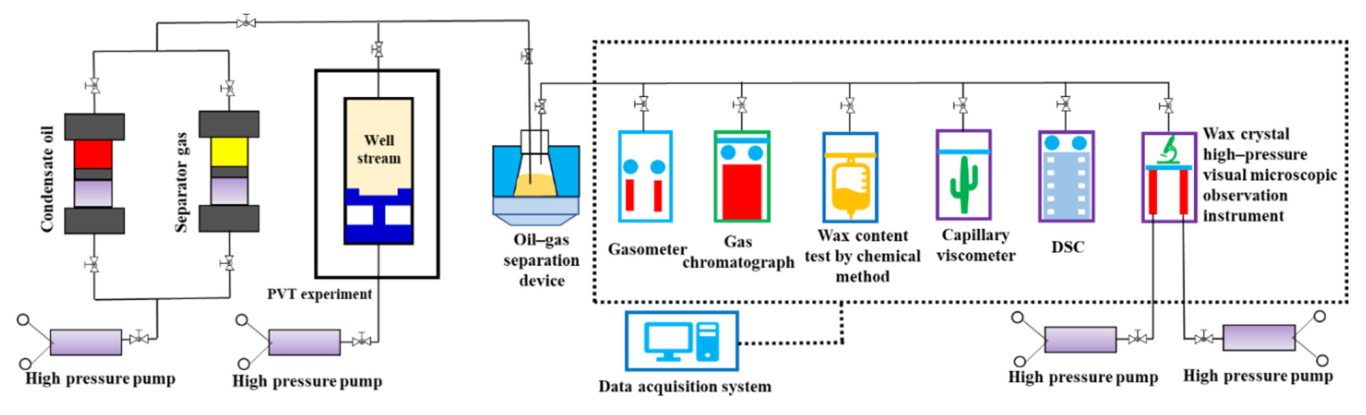
2.2. Experimental Instruments and Process

Figure 2 shows the sketch for condensate gas PVT and wax precipitation process. The experiments mainly include tests for dew point pressure, constant mass expansion, and degassed and equilibrium condensate oil wax precipitation. The degassed condensate oil is obtained after flash separation; the equilibrium condensate oil is separated during constant mass expansion and pressure reduction, and so is the saturated condensate gas. Several experimental determination methods can be used for condensate oil wax precipitation, among which the three common and simple experimental methods are the capillary viscometer, DSC, and polarizing microscope observation. Herein, these methods are used to test the condensate oil wax precipitation of wells A and B to obtain the corresponding wax appearance temperature or wax precipitation amount, and the accuracy of these methods is studied.
(1)
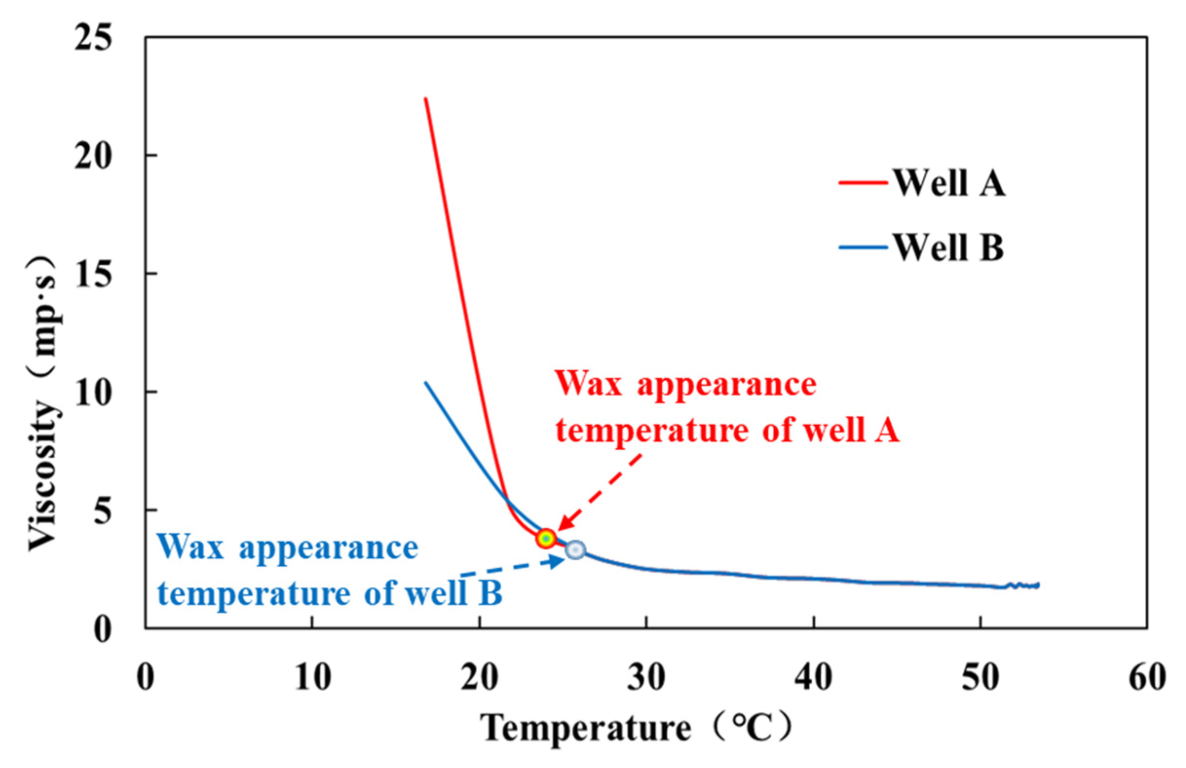
Capillary viscometer method: The experimental instrument is an Ubbelohde glass capillary viscometer, and the inner diameter of the capillary is 0.63 mm. The capillary viscometer method can determine the wax appearance temperature by measuring the viscosity–temperature curve during the cooling of crude oil. With reference to the method adopted in GB/T 30515-2014 [17], the experiment proceeds as follows: (a) When the liquid flows in an upright capillary at experimental temperature, its viscosity is proportional to the flow time. (b) The viscosity of the condensate can be obtained by measuring the time that the condensate flows out of the viscometer. (c) Changing the experimental temperature to obtain the corresponding viscosity under different temperature conditions. (d) When wax crystals precipitate in the crude oil, the slope of viscosity–temperature curve begins to increase, and this point is identified as the wax appearance temperature.
(2)
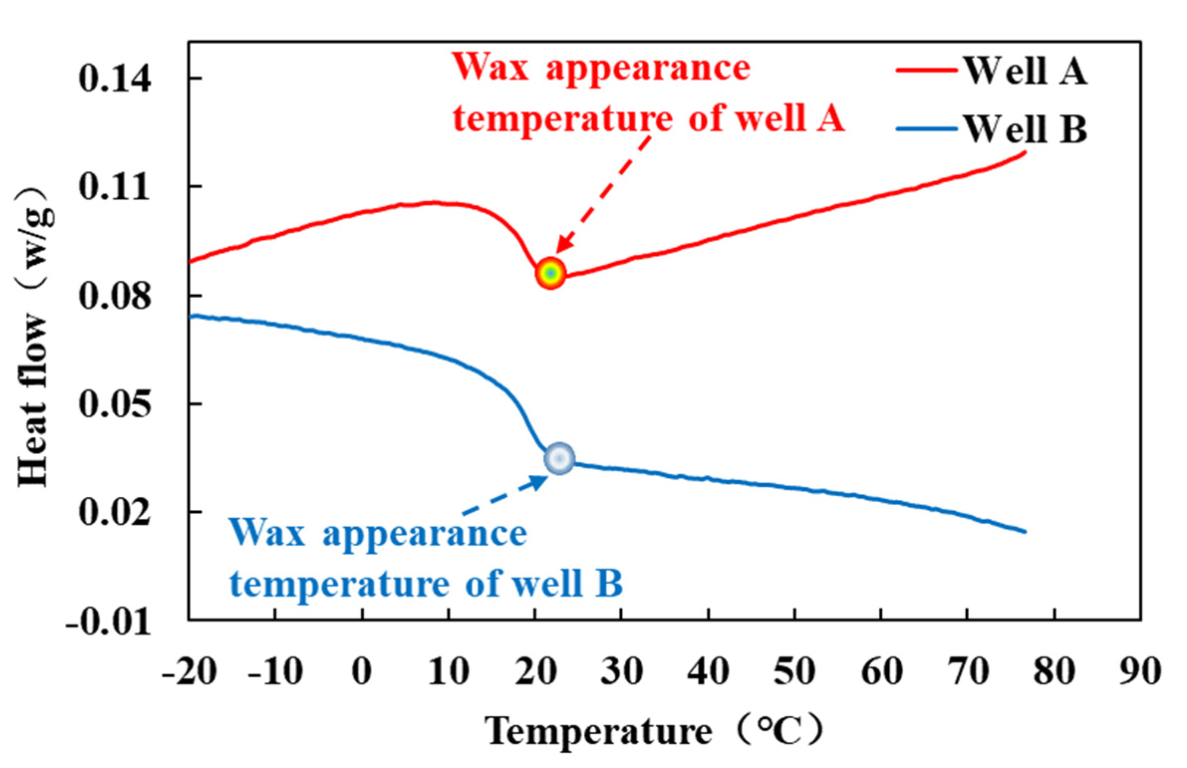
DSC method: The experimental instrument is a Mettler Toledo DSC823 thermal analyzer with sensitivity of 0.04 μw. The measuring temperature range is −50–700 °C, and the temperature accuracy is ±0.02 °C. In this method, air is selected as the reference material. When no wax precipitation occurs in the waxy condensate oil, the condensate oil and air change according to the programmed temperature, and their difference is ΔT = 0. When the temperature is lower than the wax appearance temperature, the latent heat of crystallization in the condensate oil is released, causing a change in the temperature difference between the condensate oil and air. To maintain the temperature difference ΔT = 0, the instrument automatically supplements the temperature and expresses it in the form of heat flow. With reference to the standard SY/T0545-2012 determination of thermal characteristic parameters of wax precipitation in crude oil using DSC [18], the experiment proceeds as follows: (a) The crude oil sample is heated to above the wax appearance temperature and then cooled at a constant rate. (b) The differential heat flow of the sample and reference material at each temperature are monitored. A relationship curve is drawn between differential heat flow and temperature, which is called the wax precipitation DSC curve. (c) When wax crystals precipitate, the DSC curve deviates from the original baseline to form an exothermic peak. (d) When the temperature drops to −20 °C, all the wax crystals reach a stable solid phase and wax precipitation is completed.
(3)
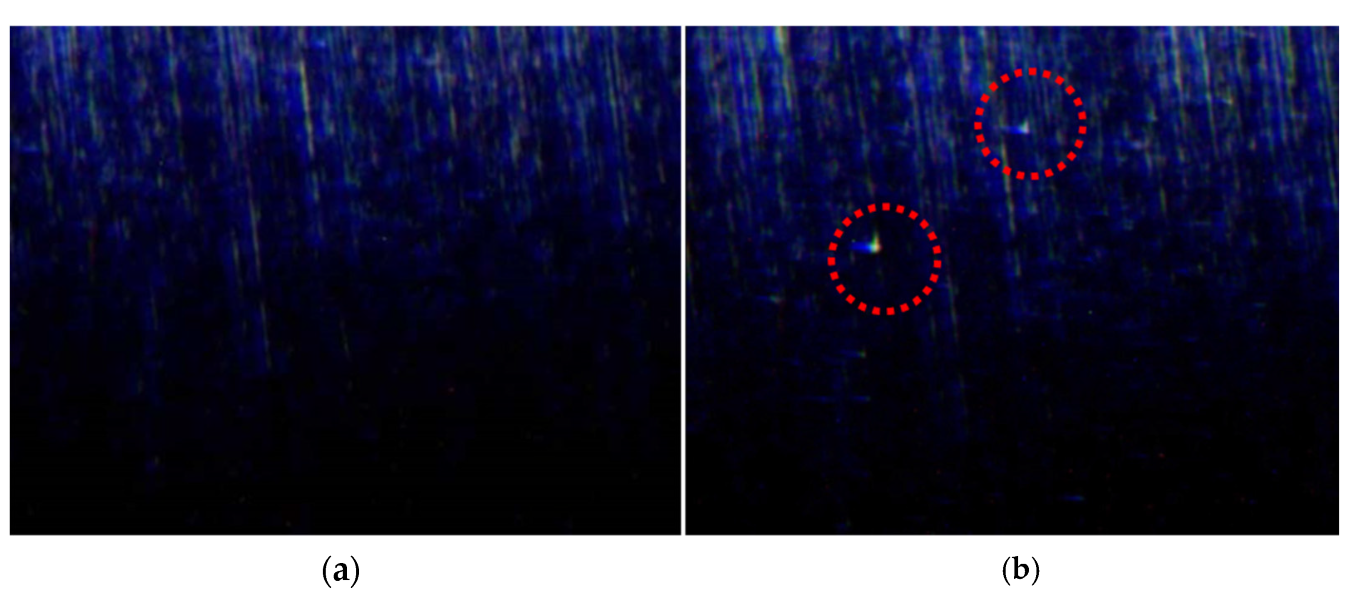
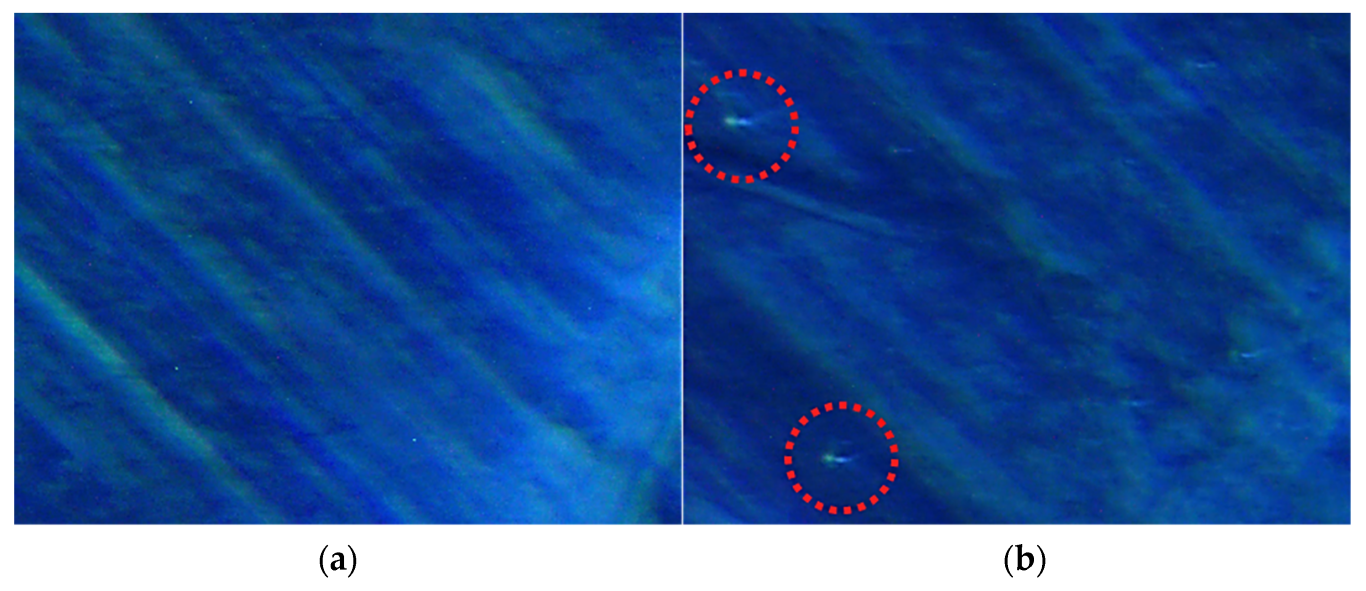
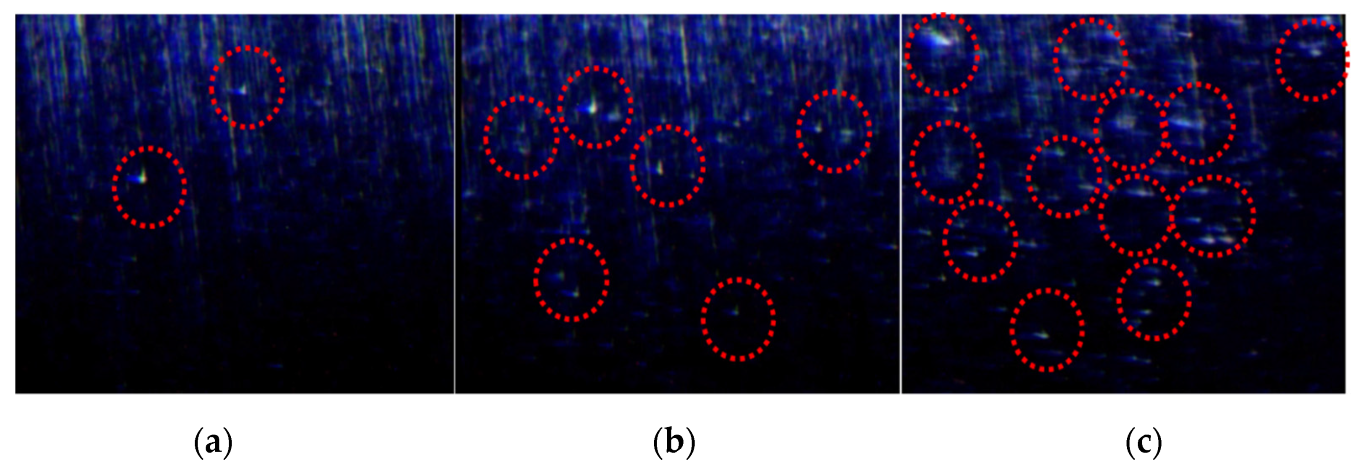
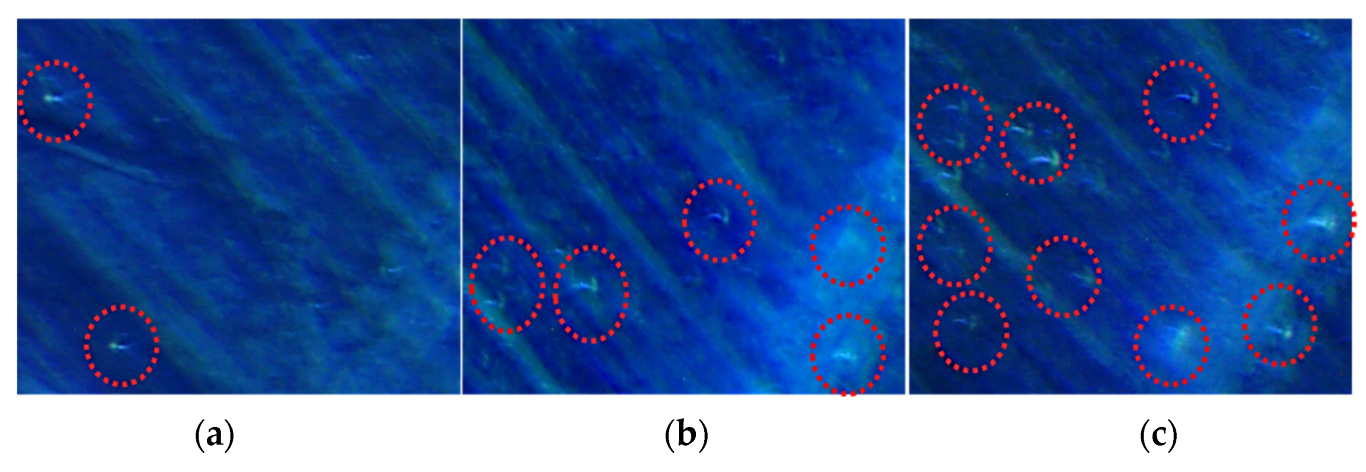
Polarizing microscopic observation: The experimental instrument is a self-designed wax crystal high-pressure visual microscope. The test temperature range is −30–300 °C, and the maximum test pressure is 100 MPa. The polarizing microscope can be used to observe roughly 1 micron crystal size. Among all wax appearance temperature testing methods, polarizing microscope observation is the only one that can directly observe the entire process of wax precipitation. The principle is to observe the precipitation using the optical property of double refraction of the wax crystal. With reference to the standard SY/T0521-2008 microscopic observation method for the determination of wax appearance temperature of crude oil [19], the experiment proceeds as follows: (a) The crude oil sample is placed on the microscopic observation platform for heating, and the wax is melted in the crude oil completely and then cooled at a constant cooling rate. (b) When small wax crystals first appear in the image acquisition system, the crude oil temperature at this point is the wax appearance temperature.

3. Experimental Results and Discussion of Wax Precipitation

3.1. Capillary Viscometer Method

Figure 3 shows the viscosity–temperature curve of the Dabei condensate oil tested using the Ubbelohde glass capillary viscometer. When the temperature decreased from 53.45 °C to 16.75 °C, the slope of viscosity–temperature curve clearly increased in the range of 20–30 °C. After the numerical derivation of the test data points, the maximum point of slope change was the wax appearance temperature of the condensate oil, which was 24.8 °C for well A and 25.3 °C for well B.

3.2. Differential Scanning Calorimetry (DSC) Method

Figure 4 shows the results of the wax precipitation of the Dabei condensate oil tested using the Mettler Toledo DSC823 thermal analyzer. When the temperature decreased from 76.5 °C to −22 °C, the point on the DSC curve that deviated from the baseline was the wax appearance temperature of the waxy condensate oil, which was 22.55 °C for well A and 23.65 °C for well B.
After the DSC thermograms of the two wells are obtained from the experimental test, the wax precipitation amount can be further calculated. Figure 4 shows that the inverse extension of the straight line above the wax appearance temperature of the two wells is considered the baseline, which is integrated with the peak area enclosed by the DSC curve to obtain the wax precipitation enthalpy of the sample. The wax content of crude oil is the ratio of its precipitation enthalpy to the average crystallization heat, which is taken as 200 J/g [20,21]. Considering the wax appearance temperature as the initial temperature, the curve of wax precipitation amount per unit temperature drop (1 °C) and cumulative wax precipitation amount with temperatures of the two wells is obtained, as shown in Figure 5 As the temperature decreases, the unit temperature drop of the condensate oil wax precipitation amount first increases and then decreases, and the cumulative wax precipitation amount first slowly increases, then rapidly increases, and finally tends to plateau. Table 3 shows the characteristic parameters of condensate oil wax precipitation. The wax contents of wells A and B are 4.48% and 3.96%, respectively.

3.3. Polarizing Microscope Observation Method

The wax appearance temperature of the Dabei condensate oil is tested by using the self-designed wax crystal high-pressure visual microscope observer, as shown in Figure 6 and Figure 7. The temperatures of the condensate in wells A and B start to decrease from 55 °C; the wax in the crude oil is completely melted at this point, and no wax crystals are observed in the polarizing microscopic image. With the decrease of temperature, wax crystals in the condensate oil begin to precipitate. The wax appearance temperature of condensate oil in well A and well B is 32.4 °C and 34.1 °C, respectively.

4. Comparison of Wax Precipitation Test Methods

Table 4 shows the wax appearance temperatures obtained through the three wax precipitation test methods. The wax appearance temperature measured using the polarizing microscope is approximately 10 °C higher than that measured using DSC, and approximately 8 °C higher than that measured using the capillary viscometer.
The accuracy and applicability of the three methods are further clarified. The wax crystals begin to precipitate observed by the polarizing microscope method and then continue to cool down, as observed in polarizing microscopic images of the wax appearance with temperature measured using the capillary viscometer and DSC. Figure 8 and Figure 9 show the comparison of the polarizing microscopic images corresponding to the wax appearance temperatures measured using the three test methods. More wax crystals can be observed when the temperature decreases to the wax appearance temperature measured by the capillary viscometer and DSC.
According to the experimental testing principle of wax appearance temperature, the testing methods can be divided into the direct and indirect methods. The former includes polarizing microscope observation, while the latter includes the capillary viscometer, DSC. Table 5 shows the characteristics of each test method. Wax appearance temperature is defined as the point at which the crystals in the waxy fluid begin to precipitate. The wax appearance temperature measured using the capillary viscometer and DSC can be recorded as cloud point, defined as the temperature at which the condensate oil is cooled to the beginning of turbidity [22]. The wax appearance temperature obtained through indirect testing (capillary viscometer and DSC) is the cloud point, and thus, the measurement using the polarizing microscope observation method is of high accuracy.
Table 6 shows that there is a major difference in the wax content between DSC and crystallization separation test methods. The wax content measured using DSC is lower than that measured using the crystallization separation test method.
In summary, the polarizing microscope observation method can be used to test the wax appearance temperature of the Dabei condensate oil, and the crystallization separation test method could be used for testing the wax content of the Dabei condensate oil instead of the DSC.

5. Wax Appearance Temperature Test of Condensate Oil under Different Pressures

The comparison of wax appearance temperature test methods shows that the polarizing microscope observation is of the highest accuracy. At the same time, the polarizing microscope observation method can directly study the wax appearance temperature of condensate oil under high pressure. The following is the wax appearance temperature test of degassed and equilibrium condensate oils under different pressures. The degassed condensate oil is the condensate oil after flash separation. The test pressure ranges from the wellhead tubing pressure to atmospheric pressure, and the results show that the dew point pressures of wells A and B are 35.63 MPa and 40.55 MPa, respectively. The equilibrium condensate oil separates during constant mass expansion for the wax appearance temperature test, and the experimental test pressure ranges from dew point pressure to atmospheric pressure. Table 7 shows the wax appearance temperature data of the experimental test, and Figure 10 compares the experimental results.
The wax precipitation law of degassed condensate oil is the opposite of that of equilibrium condensate oil. The wax appearance temperature of the degassed condensate oil increases linearly as the pressure increases, indicating that the higher the pressure, the easier the wax precipitation of the degassed condensate oil. The wax precipitation temperature range of the degassed condensate oil in wells A and B at 70–0.1 MPa is 45.7–32.4 °C and 46.6–34.1 °C, respectively.
The wax appearance temperature of equilibrium condensate oil decreases as the pressure increases. The main reason for this is that the higher the pressure, the more dissolved gas is in the equilibrium condensate oil, and the solubility of wax crystals in equilibrium condensate oil increases, which does not easily lead to wax precipitation. The wax precipitation temperature range of equilibrium condensate oil in well A is 25.8–32.4 °C at 35–0.1 MPa, and that of equilibrium condensate oil in well B is 26.2–34.1 °C at 40–0.1 MPa.

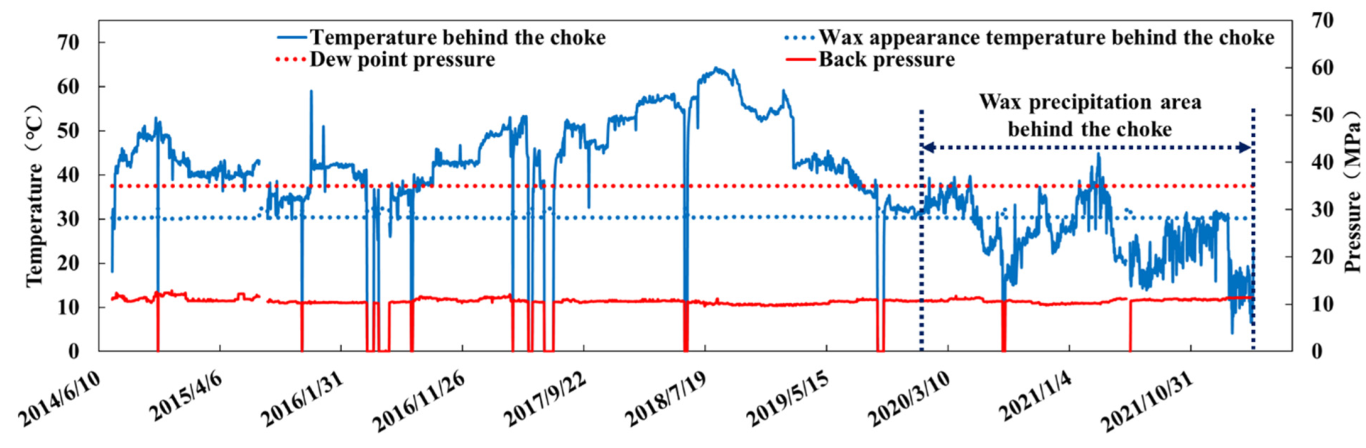
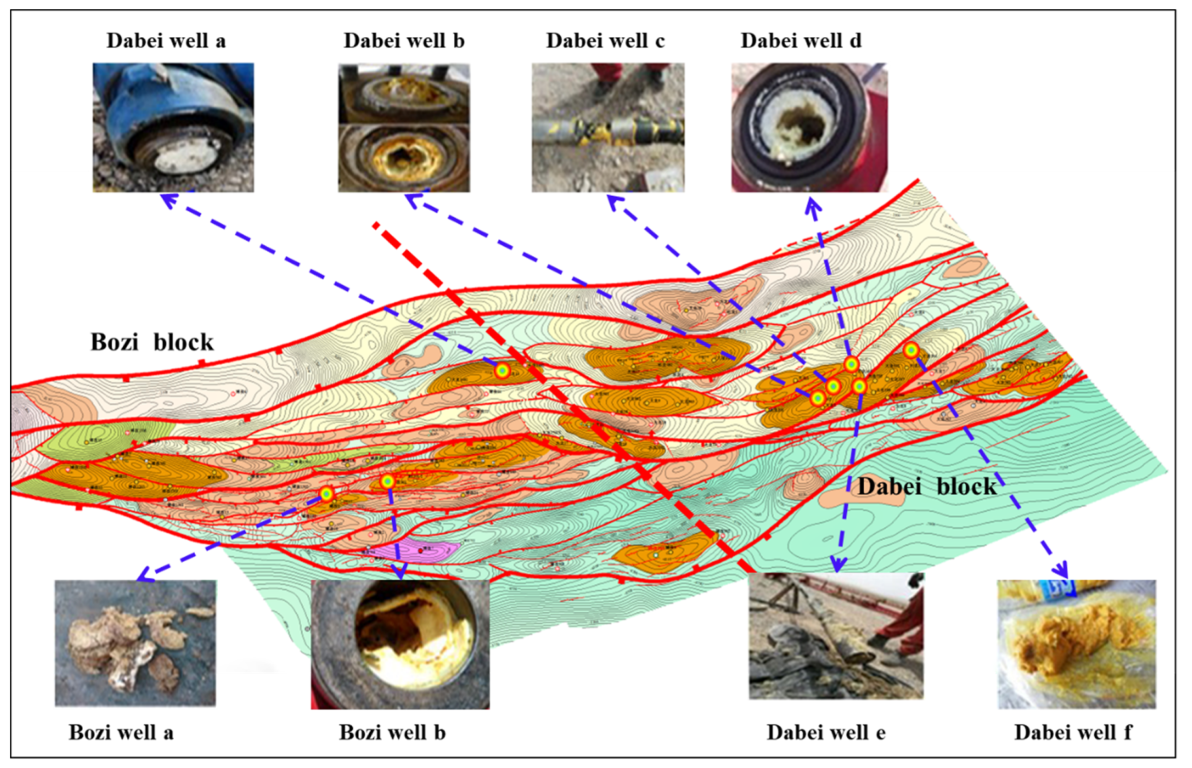
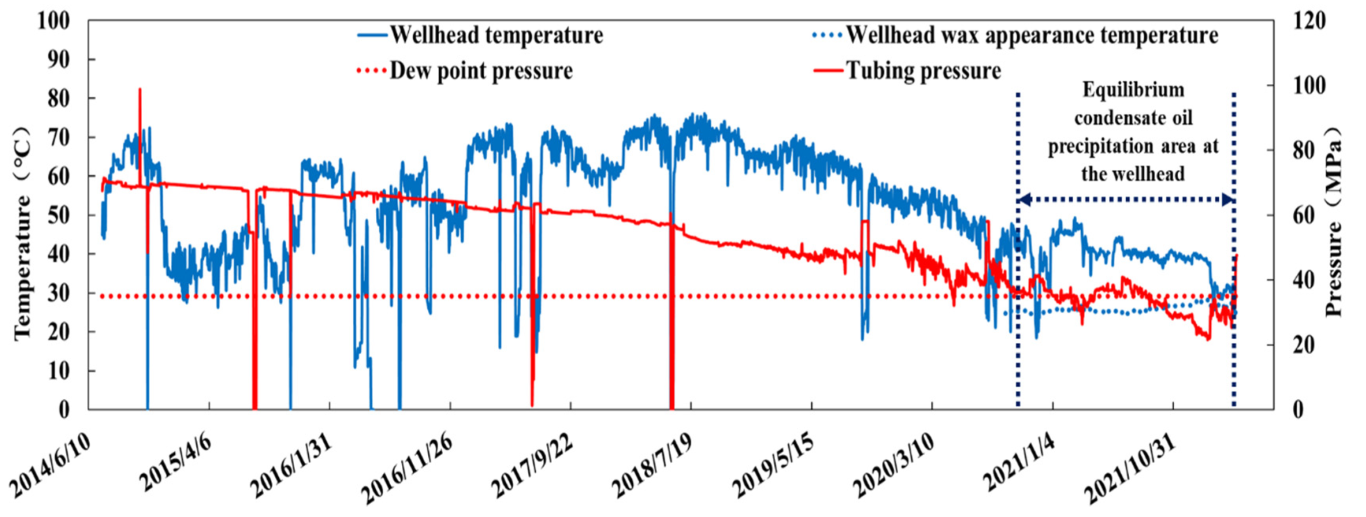
6. Field Application

According to the results obtained by testing the equilibrium condensate oil under different pressures, the corresponding wellhead and behind the choke wax appearance temperature can be obtained by interpolating the tubing and back pressures (pressure of the ground oil pipeline close to the oil tree). The discrimination diagram of the two wells can be obtained by combining the dew point pressures, as shown in Figure 11, Figure 12, Figure 13 and Figure 14.
With the progress of production, the tubing pressures of wells A and B continuously decrease until they are lower than the dew point pressure, and an equilibrium condensate oil interval occurs at the wellhead in Figure 11 and Figure 12. Figure 11 shows that the wellhead temperature is higher than the wax appearance temperature in the equilibrium condensate oil precipitation area of well A after 23 October 2020, and thus, condensate oil precipitates instead of wax. However, under the current production system, the temperature is very close to the wax appearance temperature at the wellhead. If the wellhead temperature further decreases, a risk of wax plugging occurs. Figure 12 shows that, the wellhead temperature is probably lower than the wax appearance temperature in the equilibrium condensate oil precipitation area of well B after 26 February 2018, and thus, a risk of wax precipitation plugging can be triggered.
Figure 13 and Figure 14 show that the temperature behind the choke of wells A and B is always lower than the dew point pressure, and thus, condensate oil precipitation occurs. Comparing the temperature behind the choke with that of the wax appearance, we can obtain a wax precipitation interval behind the choke. Figure 13 shows that in well A, the temperature behind the choke is probably lower than the corresponding wax appearance temperature after 9 October 2019, and thus, wax precipitates in the gathering and transmission pipelines behind the choke. Figure 14 shows that in well B, the temperature behind the choke always fluctuates above and below that of the wax appearance since its production, and a risk of wax plugging occurs in the gathering and transmission pipelines behind the choke. However, for wells A and B, the field production data show no wax plugging in the gathering and transmission pipelines of the two wells. The reason is the different conditions of wax precipitation and deposition. Under a certain condition, wax precipitation may not necessarily lead to wax deposition, which may not completely plug the flow pipe. If the well is operated for a long time under conditions of wax precipitation, the gathering and transmission pipelines behind the choke are plugged by wax deposition. Therefore, wax prevention measures are necessary, and wax removal must be conducted regularly. Since the well has been put into production, the temperature behind the choke has always fluctuated above and below the wax appearance temperature, and thus, a risk of wax plugging occurs in the gathering and transmission pipelines behind the choke.

7. Conclusions and Future Work

7.1. Conclusions

(1)
The Dabei condensate oil is rich in heavy components, more than 69% of C11+ components, moderate wax, and resins and less asphaltenes. The wax appearance temperature test can be divided into direct and indirect methods. The polarizing microscope observation can be regarded as the direct method, and the other methods are the indirect methods. The wax appearance temperature measured using the indirect method can be regarded as the cloud point. The wax appearance temperature measured using the polarizing microscope observation method is more accurate, and the polarizing microscope observation can be used to measure the wax appearance temperature of the Dabei condensate oil.
(2)
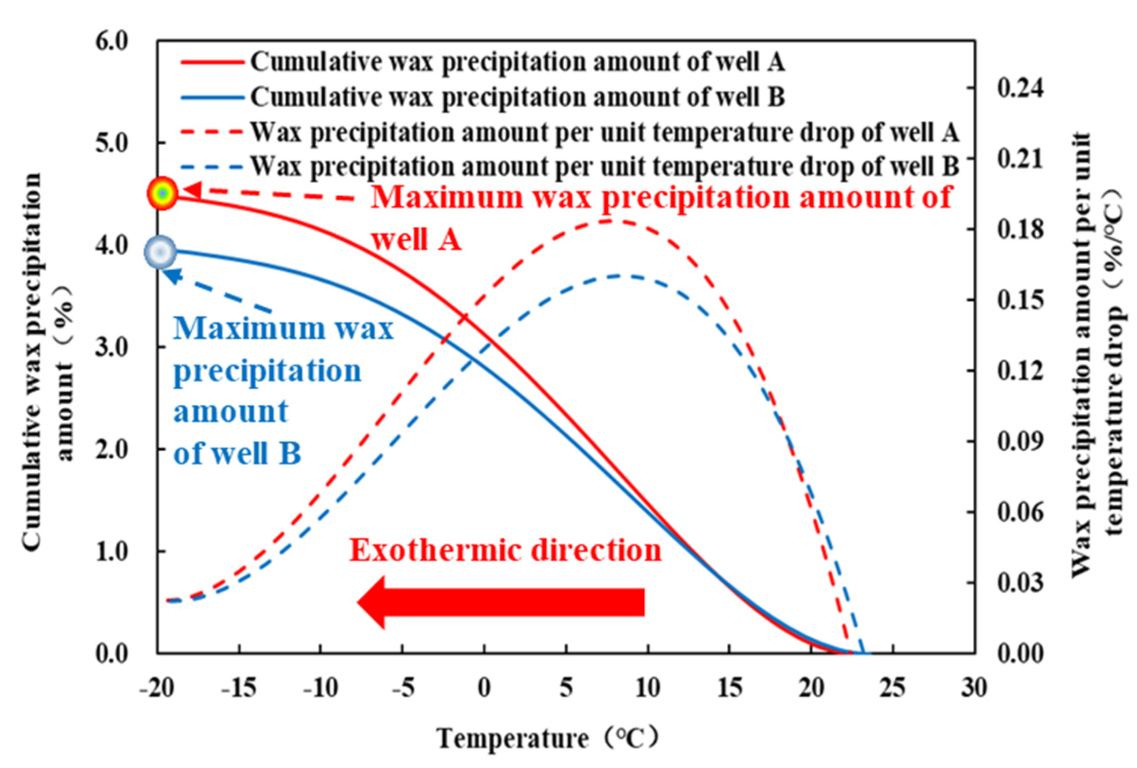
The wax contents of wells A and B measured using the DSC method are 4.48% and 3.96%, respectively, and those measured using the crystallization separation test method are 9.01% and 6.78%, respectively. The DSC adopts continuous cooling, which leads to insufficient wax precipitation of the Dabei condensate oil. This results in the wax content tested using DSC being lower than that of the one using crystallization separation test method.
(3)
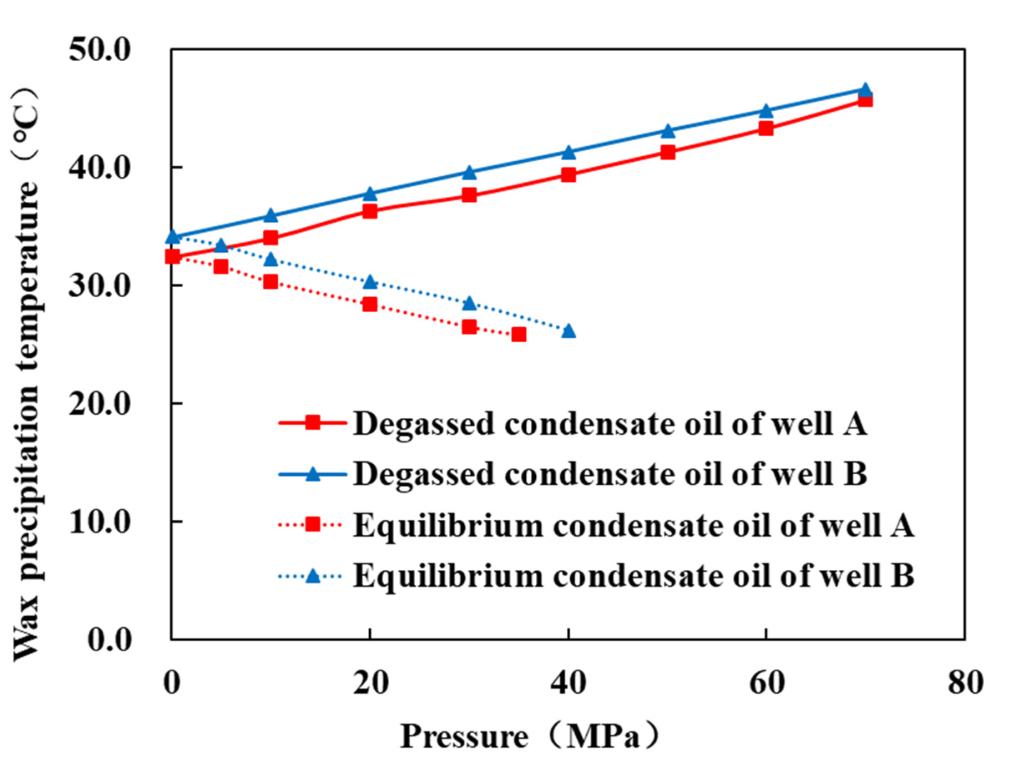
The wax precipitation temperature of the equilibrium condensate oil increases with pressure drop. The lower the pressure, the faster the wax precipitation temperature rises. The wax precipitation law of the equilibrium condensate oil is opposite to that of the degassed condensate oil. The reason can be that more gas would dissolve in the equilibrium condensate oil under a higher pressure, which could prevent wax precipitation.
(4)
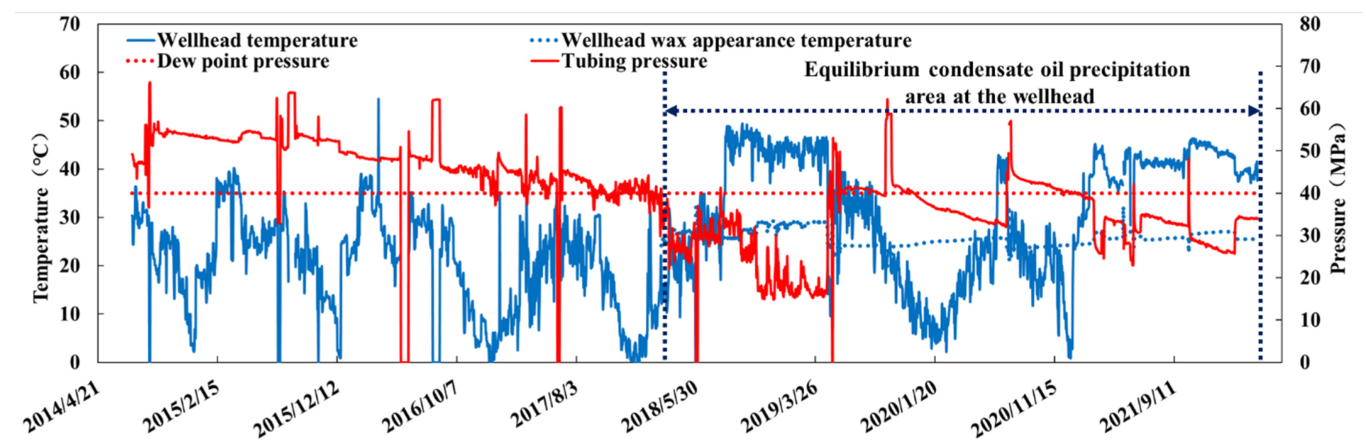
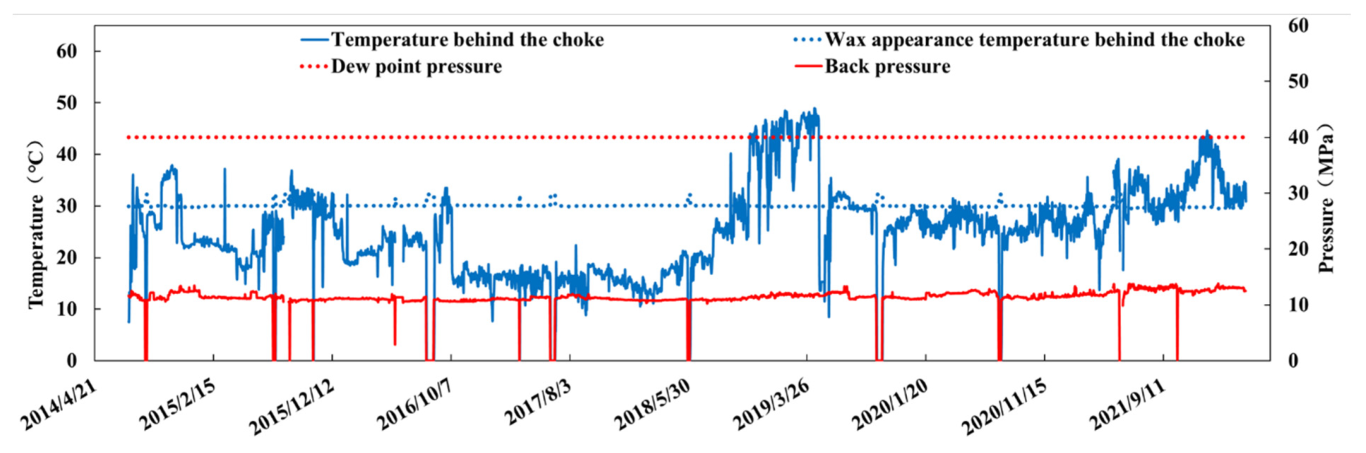
Although wax precipitates in the wellbore and gathering pipeline, wax deposition does not necessarily occur. Even if wax deposits occur, pipeline plugging does not necessarily occur completely. Whether it is the wellbore or gathering and transmission pipelines, long-term production under the condition of wax precipitation could lead to wax deposition and plugging, and thus, wax prevention measures and regular wax removal are necessary.

7.2. Future Work

This research has completed laboratory wax precipitation testing of condensate oil and applied the results to judge the wax precipitation potential risk in the wellbore and gathering pipeline. The conclusions could be useful for future researchers selecting lab testing methods for wax deposition in various condensate oil samples. Finally, research efforts to optimize wax prevention and treatment technology according to the wax deposition testing results will continue in the future.

Author Contributions

Conceptualization, L.C. and J.S.; methodology, L.C. and J.S.; software, L.C. and J.L. (Jiquan Liu); validation, J.S., J.L. (Jianyi Liu) and J.L. (Jiquan Liu); formal analysis, J.L. (Jiquan Liu); investigation, L.C.; resources, J.L. (Jianyi Liu); data curation, J.L. (Jiquan Liu); writing—original draft preparation, L.C.; writing—review and editing, J.L. (Jiquan Liu); visualization, J.L. (Jianyi Liu); supervision, J.S.; project administration, J.S. and J.L. (Jianyi Liu); funding acquisition, L.C. and J.S. All authors have read and agreed to the published version of the manuscript.

Funding

This research was funded by the National Science and Technology Major Project for the development of large oil and gas fields and coalbed methane, demonstration project for the development of deep-ultra deep nat-ural gas fields in Kuqa depression (grant number 2016ZX05051); the Major Scientific and Technological Projects of CNPC, Study on the theory and key technology of deep oil and gas exploration and development in Tarim Basin (grant number ZD2019-183-005); Key R & D Program of Shandong Province, R & D and industrialization of key materials of green and efficient wellbore working fluid (grant number 2020ZLYS07).

Institutional Review Board Statement

Not applicable.

Informed Consent Statement

Not applicable.

Data Availability Statement

Not applicable.

Conflicts of Interest

The authors declare no conflict of interest.

References

  1. Dan, V.N.; Goual, L.; Firoozabadi, A. Wax precipitation in gas condensate mixtures. SPE Prod. Facil. 2001, 16, 250–259. [Google Scholar]
  2. Carnahan, N.F. Paraffin deposition in petroleum production. J. Pet. Technol. 1989, 41, 1024–1025. [Google Scholar] [CrossRef]
  3. Karan, K.; Ratulowski, J.; German, P. Measurement of waxy crude properties using novel laboratory techniques. In Proceedings of the SPE Annual Technical Conference and Exhibition, Dallas, TX, USA, 1–4 October 2000; p. 62945. [Google Scholar]
  4. Vieira, L.C.; Buchuid, M.B.; Lucas, E.F. Effect of pressure on the crystallization of crude oil waxes II. Evaluation of crude oil and condensate. Energy Fuels 2009, 24, 2213–2220. [Google Scholar]
  5. Barker, K.M.; Bigler, J.M.; Hake, K.; Sallee, D.C. Paraffin problems in gas systems. In Proceedings of the SPE Eastern Regional Meeting, Pittsburgh, PA, USA, 6–10 September 2003. [Google Scholar]
  6. Mark, M.B.; Laura, B.R.Z. Optimizing paraffin and naphthene wax-treatment options using cross-polarized microscopy. In Proceedings of the SPE International Symposium on Oil Field Chemistry, Woodlands, TX, USA, 9–11 April 2011. [Google Scholar]
  7. Japper-Jaafar, A.; Bhaskoro, P.T.; Mior, Z.S. A new perspective on the measurements of wax appearance temperature: Comparison between DSC, thermomicroscopy and rheometry and the cooling rate effects. J. Pet. Sci. Eng. 2016, 147, 672–681. [Google Scholar] [CrossRef]
  8. Hans, P.R.; Brit, B.; Asger, B.H.; Walther, B.P. Wax precipitation from North Sea crude oils: 1. Crystallization and dissolution temperatures, and Newtonian and non-Newtonian flow properties. Energy Fuels 1991, 5, 895–908. [Google Scholar]
  9. Mustafa, V.K.; Létoffé, J.M.; Pierre, C. Comparison of wax appearance temperatures of crude oils by differential scanning calorimetry, thermomicroscopy and viscometry. Fuel 1996, 75, 787–790. [Google Scholar]
  10. Meray, V.R.; Volle, J.L.; Schranz, C.J.P. Influence of light ends on the onset crystallization temperature of waxy crudes within the frame of multiphase transport. In Proceedings of the SPE Annual Technical Conference and Exhibition, Houston, TX, USA, 3–6 October 1993. [Google Scholar]
  11. Hammami, A.; Raines, M.A. Paraffin deposition from crude oils: Comparison of laboratory results with field data. SPE J. 1999, 4, 9–18. [Google Scholar] [CrossRef]
  12. Jiang, B.; Xue, L.I.; Yang, S.; Ke, L.I.; Chen, H. Measurement of the wax appearance temperature of waxy oil under the reservoir condition with ultrasonic method. Pet. Explor. Dev. 2014, 41, 509–512. [Google Scholar] [CrossRef]
  13. Wang, J.; Zhou, F.; Zhang, L.; Huang, Y.; Yao, E.; Zhang, L. Experimental study of wax deposition pattern concerning deep condensate gas in Bozi block of Tarim Oilfield and its application. Thermochim. Acta 2019, 671, 1–9. [Google Scholar] [CrossRef]
  14. Juyal, P.; Cao, T.; Yen, A.; Venkatesan, R. Study of live oil wax precipitation with high-pressure micro-differential scanning calorimetry. Energy Fuels 2011, 25, 568–572. [Google Scholar] [CrossRef]
  15. State Energy Administration. SY/T 7550-2012; Determination of Wax, Resins and Asphaltenes in Crude Oil. Petroleum Industry Press: Beijing, China, 2012.
  16. Su, Z.; Zhang, H.F.; Han, J.F.; Liu, Y. Origin and controlling factors of Mesozoic-Cenozoic gas condensates with high wax content and high-gravity oil in Kuqa Depression. Oil Gas Geol. 2018, 39, 1255–1269. [Google Scholar]
  17. Standardization Administration of the People’s Republic of China. GB/T 30515-2014; Petroleum Products–Transparent and Opaque Liquids–Determination of Kinematic Viscosity and Calculation of Dynamic Viscosity. Standards Press of China: Beijing, China, 2014.
  18. State Energy Administration. SY/T 0545-2012; Determination of Thermal Property Parameters of the Wax Precipitation in Crude Oil. Test Method by Differential Scanning Calorimetry. Petroleum Industry Press: Beijing, China, 2012.
  19. National Development and Reform Commission. SY/T 0521-2008; Determination of Wax Appearance Temperature in Crude Petroleum. Test Method by Microscopic Observation. Petroleum Industry Press: Beijing, China, 2008.
  20. Letoffe, J.M.; Claudy, P.; Garcin, M.; Volle, J.L. Evaluation of crystallized fractions of crude oils by differential scanning calorimetry Correlation with gas chromatography. Fuel 1995, 74, 92–95. [Google Scholar] [CrossRef]
  21. Claudy, P.; Létofféc, J.M.; Chaguéa, B.; Orritb, J. Crude oils and their distillates: Characterization by differential scanning calorimetry. Fuel 1988, 67, 58–61. [Google Scholar] [CrossRef]
  22. Standardization Administration of the People’s Republic of China. GB/T 6986-2014; Standard Test Method for Cloud Point of Petroleum Products. Standards Press of China: Beijing, China, 2014.
Figure 1. Tectonic unit map of Bozi and Dabei blocks in the Tarim Oilfield and wax plugging condition.
Energies 15 06200 g001
Figure 2. Condensate gas PVT and wax precipitation tests.
Energies 15 06200 g002
Figure 3. Viscosity–temperature curve of the Dabei condensate oil.
Energies 15 06200 g003
Figure 4. DSC thermogram of the Dabei condensate oil.
Energies 15 06200 g004
Figure 5. Wax precipitation amount curve of the Dabei condensate oil.
Energies 15 06200 g005
Figure 6. Polarizing microscope observer test results of Dabei well A: (a) starts to cool (55.0 °C); (b) starts to precipitate (32.4 °C).
Energies 15 06200 g006
Figure 7. Polarizing microscope observer test results of Dabei well B: (a) starts to cool (55.0 °C); (b) starts to precipitate (34.1 °C).
Energies 15 06200 g007
Figure 8. Experiment diagram of wax appearance temperature obtained by three test methods of Dabei well A: (a) polarizing microscope; (b) capillary viscometer; (c) DSC.
Energies 15 06200 g008
Figure 9. Experiment diagram of wax appearance temperature obtained by three test methods of Dabei well B: (a) polarizing microscope; (b) capillary viscometer; (c) DSC.
Energies 15 06200 g009
Figure 10. Wax precipitation temperature obtained by testing degassed and balance condensate oils under different pressures.
Energies 15 06200 g010
Figure 11. Discrimination diagram of wax precipitation at the wellhead of well A.
Energies 15 06200 g011
Figure 12. Discrimination diagram of wax precipitation at the wellhead of well B.
Energies 15 06200 g012
Figure 13. Discrimination diagram of wax precipitation behind the choke of well A.
Energies 15 06200 g013
Figure 14. Discrimination diagram of wax precipitation behind the choke of well B.
Energies 15 06200 g014
Table 1. Components of the Dabei condensate oil.
Dabei Well ADabei Well B
ComponentsMolar
Composition
(mol%)
ComponentsMolar
Composition
(mol%)
C20.160C2/
C30.034C30.070
IC40.044IC40.060
NC40.089NC40.136
IC50.170IC50.204
NC50.177NC50.219
C60.842C61.076
C74.317C74.790
C85.977C89.910
C96.27C96.954
C106.325C107.457
C11+75.595C11+69.124
Table 2. Wax, resins, and asphaltenes contents in the Dabei condensate oil.
Experimental SampleWax Content
(w%)
Resins Content
(w%)
Asphaltenes Contents
(w%)
Dabei well A9.012.240.74
Dabei well B6.783.140.07
Table 3. Characteristic parameters of condensate oil wax precipitation.
Well NameTemperature Corresponding to Maximum Wax Precipitation Rate
(°C)
Maximum Wax Precipitation Amount per Unit Temperature Drop
(%/°C)
Wax Content
(%)
A7.550.184.48
B8.650.163.96
Table 4. Comparison of wax appearance temperatures obtained through three methods.
Well NameWax Appearance Temperature by DSC
(°C)
Wax Appearance Temperature by Capillary Viscometer
(°C)
Wax Appearance Temperature by Polarizing Microscope
(°C)
A22.5524.832.4
B23.6525.634.1
Table 5. Characteristics of various wax precipitation test methods.
Test Method for Wax Appearance TemperatureCharacteristics
Direct testing methodPolarizing microscope observation The initial precipitation temperature of wax crystal can be observed directly.
Indirect testing methodCapillary viscometerSufficient wax crystals must be precipitated, such that the viscosity can obviously deviate from the normal change trend with the decrease of temperature, and the viscosity–temperature curve can have an obvious turning point.
DSCWhen a certain amount of wax crystals are precipitated, the thermal effect changes, and the differential heat flow of crude oil sample and reference material can be formed. At this point, the DSC curve deviates from the original baseline and forms an exothermic peak.
Table 6. Comparison of wax content obtained using different test methods.
Well NameWax Content Tested by DSC (%)Wax Content Tested by Crystallization Separation Test Method (%)
Well A4.489.01
Well B3.966.78
Table 7. Wax precipitation temperature obtained by testing degassed and equilibrium condensate oils under different pressures.
Condensate Oil TypeWell AWell B
Pressure
(MPa)
Solution Gas-Oil
Ratio (S m3/m3)
Wax Precipitation Temperature (°C)Pressure
(MPa)
Solution Gas-Oil
Ratio (S m3/m3)
Wax Precipitation Temperature (°C)
Degassed condensate oil0.1032.40.1034.1
1003410035.9
20036.320037.8
30037.630039.6
40039.440041.3
50041.350043.1
60043.360044.8
70045.770046.6
Equilibrium condensate oil0.1032.40.1034.1
525.831.6538.333.4
1059.430.31075.832.2
20120.628.420133.230.3
30219.126.530240.428.5
35264.225.840322.526.2
Publisher’s Note: MDPI stays neutral with regard to jurisdictional claims in published maps and institutional affiliations.

