Article

Multiphysics Simulation of the NASA SIRIUS-CAL Fuel Experiment in the Transient Test Reactor Using Griffin

1
Nuclear Design Discipline, TerraPower, Bellevue, WA 98005, USA
2
Reactor Physics Methods and Analysis, Idaho National Laboratory, Idaho Falls, ID 83415, USA
*
Author to whom correspondence should be addressed.
Formerly of Idaho National Laboratory, Idaho Falls, ID 83415, USA.
Energies 2022, 15(17), 6181; https://doi.org/10.3390/en15176181
Submission received: 15 June 2022 / Revised: 18 August 2022 / Accepted: 19 August 2022 / Published: 25 August 2022
(This article belongs to the Special Issue State-of-Art in Nuclear Reactor Physics)

Abstract

:
After approximately 50 years, NASA is restarting efforts to develop nuclear thermal propulsion (NTP) for interplanetary missions. Building upon nuclear engine tests performed from the late 1950s to the early 1970s, the present research and testing focuses on advanced materials and fabrication methods. A number of transient tests have been performed to evaluate materials performance under high-temperature, high-flux conditions, with several more experiments in the pipeline for future testing. The measured data obtained from those tests are being used to validate the Griffin reactor multiphysics code for this particular type of application. Griffin was developed at Idaho National Laboratory (INL) using the MOOSE framework. This article describes the simulation results of the SIRIUS-CAL calibration experiment in the Transient Reactor Test Facility (TREAT). SIRIUS-CAL was the first transient test conducted on NASA fuels, and although the test was performed with a relatively low core peak power, the test specimen survived a temperature exceeding 900 K. Griffin simulations of the experiment successfully matched the reactor’s power transient after calibrating the initial control rod position to match the initial reactor period. The thermal-hydraulics model largely matches the time-dependent response of a thermocouple located within the experiment specimen to within the uncertainty estimate. However, the uncertainty range is significant and must be reduced in the future.

1. Introduction

Nuclear thermal propulsion (NTP) uses a nuclear reactor to heat a gas to a large enthalpy concomitant with high nozzle exit velocities providing thrust to propel a spacecraft for extraterrestrial operations [1]. NTP is very similar to hydrogen/oxygen chemical rockets, in which the exothermic reaction of hydrogen and oxygen provides the energy used to heat the reaction product, i.e., gaseous H2O, to generate thrust. However, in an NTP engine, molecular hydrogen (H2) is heated in a high temperature nuclear reactor and upon exit is used as the propellant, allowing for a higher exit velocity for the same nozzle entry temperature [2].
The advantage of nuclear thermal rockets over chemical rockets is their significantly higher specific impulse (900 vs. 450 s), enabling the generation of roughly twice the impulse using the same amount of propellant. However, the National Academy of Sciences noted that an aggressive program for the development of NTP technologies will be necessary to deploy them for manned missions to Mars prior to 2040 [3]. The report further indicated that the two technologies under consideration (i.e., NTP [4] and nuclear electric propulsion [NEP] [5]) face significant challenges with respect to technology readiness levels (TRLs). Low TRLs must be significantly elevated before usage in such a mission is possible. However, relative to chemical rocket technologies, such systems significantly (a) reduce the travel time and/or (b) increase the payload mass for a mission to Mars. The National Academy of Sciences report indicated that NTP faced fewer TRL challenges than NEP. This is consistent with ongoing efforts at the National Aeronautics and Space Administration (NASA), whose investment in nuclear propulsion technology is centered around NTP, as they continue to examine requirements for NEP subsystem maturation.
NASA is collaborating with several U.S. national laboratories—principally Idaho National Laboratory (INL), Los Alamos National Laboratory and Oak Ridge National Laboratory—to develop nuclear fuel and structural materials that can withstand the extreme environments created within NTP engines. This research is intended to determine the materials and corresponding manufacturing methods that will result in the production of stable, robust, economically viable solutions for NTP application.
Nuclear testing of these materials under prototypical conditions is being performed at the Transient Reactor Test Facility (TREAT) [6], located at INL, and at the Nuclear Thermal Rocket Element Environmental Simulator (NTREES) and the Compact Fuel Element Tester (CFEET), both located at NASA’s Marshall Space Flight Center [7]. NTREES was designed to provide up to 1.2 MW of heating to simulate an NTP thermal environment by capturing exposure to hydrogen heated to temperatures of up to 3000 K or more. Numerous tests have been completed in NTREES; however, the facility is non-nuclear and cannot produce the intense neutron and gamma fluxes present in an NTP engine. TREAT allows for testing advanced materials under rapidly changing, extreme power/temperature conditions accompanied by an intense radiation field. In 2015, the first partial-length fuel elements were tested in NTREES. In June 2019, the experiment designated as SIRIUS-CAL represented the first test of an NTP-type fuel specimen in TREAT. As with NTREES, a number of tests with representative fuel specimens have been completed or remain ongoing.
Fuel materials for NTP applications must withstand extremely high temperatures and multiple fast temperature ramps over the service life of the core, as well as be compatible with hot hydrogen. To economize the use of hydrogen to the greatest extent possible, NTP engines will be expected to, in a very short time (i.e., on the order of a minute or less), go from warm (∼300 K) zero power conditions to full operational power, with a core exit fuel temperature on the order of 2700–3000 K. This will introduce significant thermomechanical stresses. In current design concepts, the fueled region of the core is less than 1 m long and, during operation, will see a temperature rise of about 2400–2700 K over this length. Furthermore, even though the core will only operate for tens of minutes before shutting down for weeks or months, multiple fuel duty cycles will take place over the life of the core.
The current research direction of the U.S. NTP program is to use uranium nitride (UN) kernels either in a CERMET or CERCER fuel form [8]. CERMET and CERCER fuels have lower TRL ratings than the dispersed graphite fuel that the Nuclear Engine for Rocket Vehicle Application (NERVA) project focused on in the 1960s and 1970s [9], and require more extensive qualification prior to deployment. CERMET is a ceramic fuel in a metal matrix, while CERCER is a ceramic fuel in a ceramic matrix. The CERMET fuel concepts of interest include W / UO 2 , Mo / UO 2 , W/UN and Mo/UN, while ZrC/UN and ZrC / UO 2 are the currently envisaged CERCER concepts. All these materials require high-temperature processing to achieve the required densities [10]. Both CERMET- and CERCER-fueled reactors are attractive candidates for high-performance advanced space power systems because of their temperature stability and compatibility with hot hydrogen. In 2021, NASA decided to place greater emphasis on CERCER-based fuel concepts moving forward, though a number of CERMET-based fuel experiments are in the testing pipeline over the next few years. Compared to CERMET, CERCER fuel requires approximately seven times less high-assay low-enriched uranium fuel, has lower maximum fuel meat stresses, and is lighter [8]. Furthermore, compared to CERMET systems, CERCER fuels with coated fuel particles offer the potential for increased margins with respect to fuel matrix melting, but are currently at a lower TRL.
The SIRIUS experiment series in TREAT is being performed to evaluate material performance, the fuel material’s compatibility with the insulator and cladding, and the effect of various fabrication processes on future CERMET and CERCER fuel forms. SIRIUS-1 was the first full-power test of the series. An uncooled CERMET specimen was subjected to six successive high-power bursts (each followed by a return to room temperature), mimicking anticipated thermal cycles. The sample was ultimately subjected to post-irradiation examination (PIE). The SIRIUS-1 specimen was rapidly heated to prototypical conditions (>2500 K) via fission reactions mainly created by the TREAT reactor transient. The temperature ramps during the power bursts targeted a rate of 95 K/s, followed by a hold at temperatures of 2500 K or more for a predetermined period. The data acquired from the test series are intended to support Environmental Impact Studies, applicable licensing requirements and NTP system performance margins. The tests were also used to determine whether operational startup ramps would exceed the thresholds for adverse transient phenomena such as fuel fragmentation/cracking [11].
This work revolves around the SIRIUS-CAL experiment performed as a low-power calibration test prior to commencing the SIRIUS-1 experiments. Following standard TREAT methods for conducting transient tests, a low-power calibration test was performed to provide an experimentally measured calibration factor (CF) for determining the transient prescription required in order to meet the SIRIUS-1 experiment goals. CFs, also known as power coupling factors, are described in greater detail in [12].
The reactor multiphysics code Griffin is developed by Idaho National Laboratory (INL) and Argonne National Laboratory (ANL) to serve as the future analysis tool for advanced nuclear reactors [13] including nuclear thermal propulsion systems [2]. Griffin was originally developed by the merger of the MOOSE applications MAMMOTH [14] and Rattlesnake [15], with ANL teaming with INL to add capabilities from its own codes PROTEUS [16] and MC2-3 [17]. Griffin supports the solution of transport problems for a variety of different types of neutral radiation: neutron, thermal photon, high-energy photon and phonon, with different transport solution options including first and second order discrete ordinates (Sn) formulations, spherical harmonics (Pn) and diffusion. Griffin is built with the MOOSE framework, and therefore it has access to many of the predefined physics modules within MOOSE, including the Thermal Hydraulics, Heat Conduction, Tensor Mechanics and Fluid Properties modules [18].
In addition, Griffin is developed to provide more fine-grained, predictive analysis of TREAT experiments. An initial validation effort of Griffin’s capabilities for modeling TREAT is reported in Ref. [19]. However, the development of a predictive capability for TREAT experiments requires additional verification and validation of both TREAT core models and experiment models, based on relevant TREAT transients, as well as careful assessment of the uncertainties and their impacts on the predictions of the available model. SIRIUS-CAL was selected as the next validation step for two reasons. First, SIRIUS-1 PIE data were not yet available at the time of this work. Second, SIRIUS-CAL provides excellent validation data for both the Griffin core model and the coupled, multiphysics, fuel specimen models, as both the core power and fuel specimen temperatures from the SIRIUS-CAL experiment are available.
This paper is organized as follows. We provide an overview of the TREAT reactor, describe the SIRIUS-CAL experiment, outline the modeling approach, and finally present the calculation results, which will then be discussed in the context of the experimentally observed quantities and the identified uncertainties present in the current model. We conclude with the significant of this work and a discussion of upcoming SIRIUS-series experiments in TREAT.

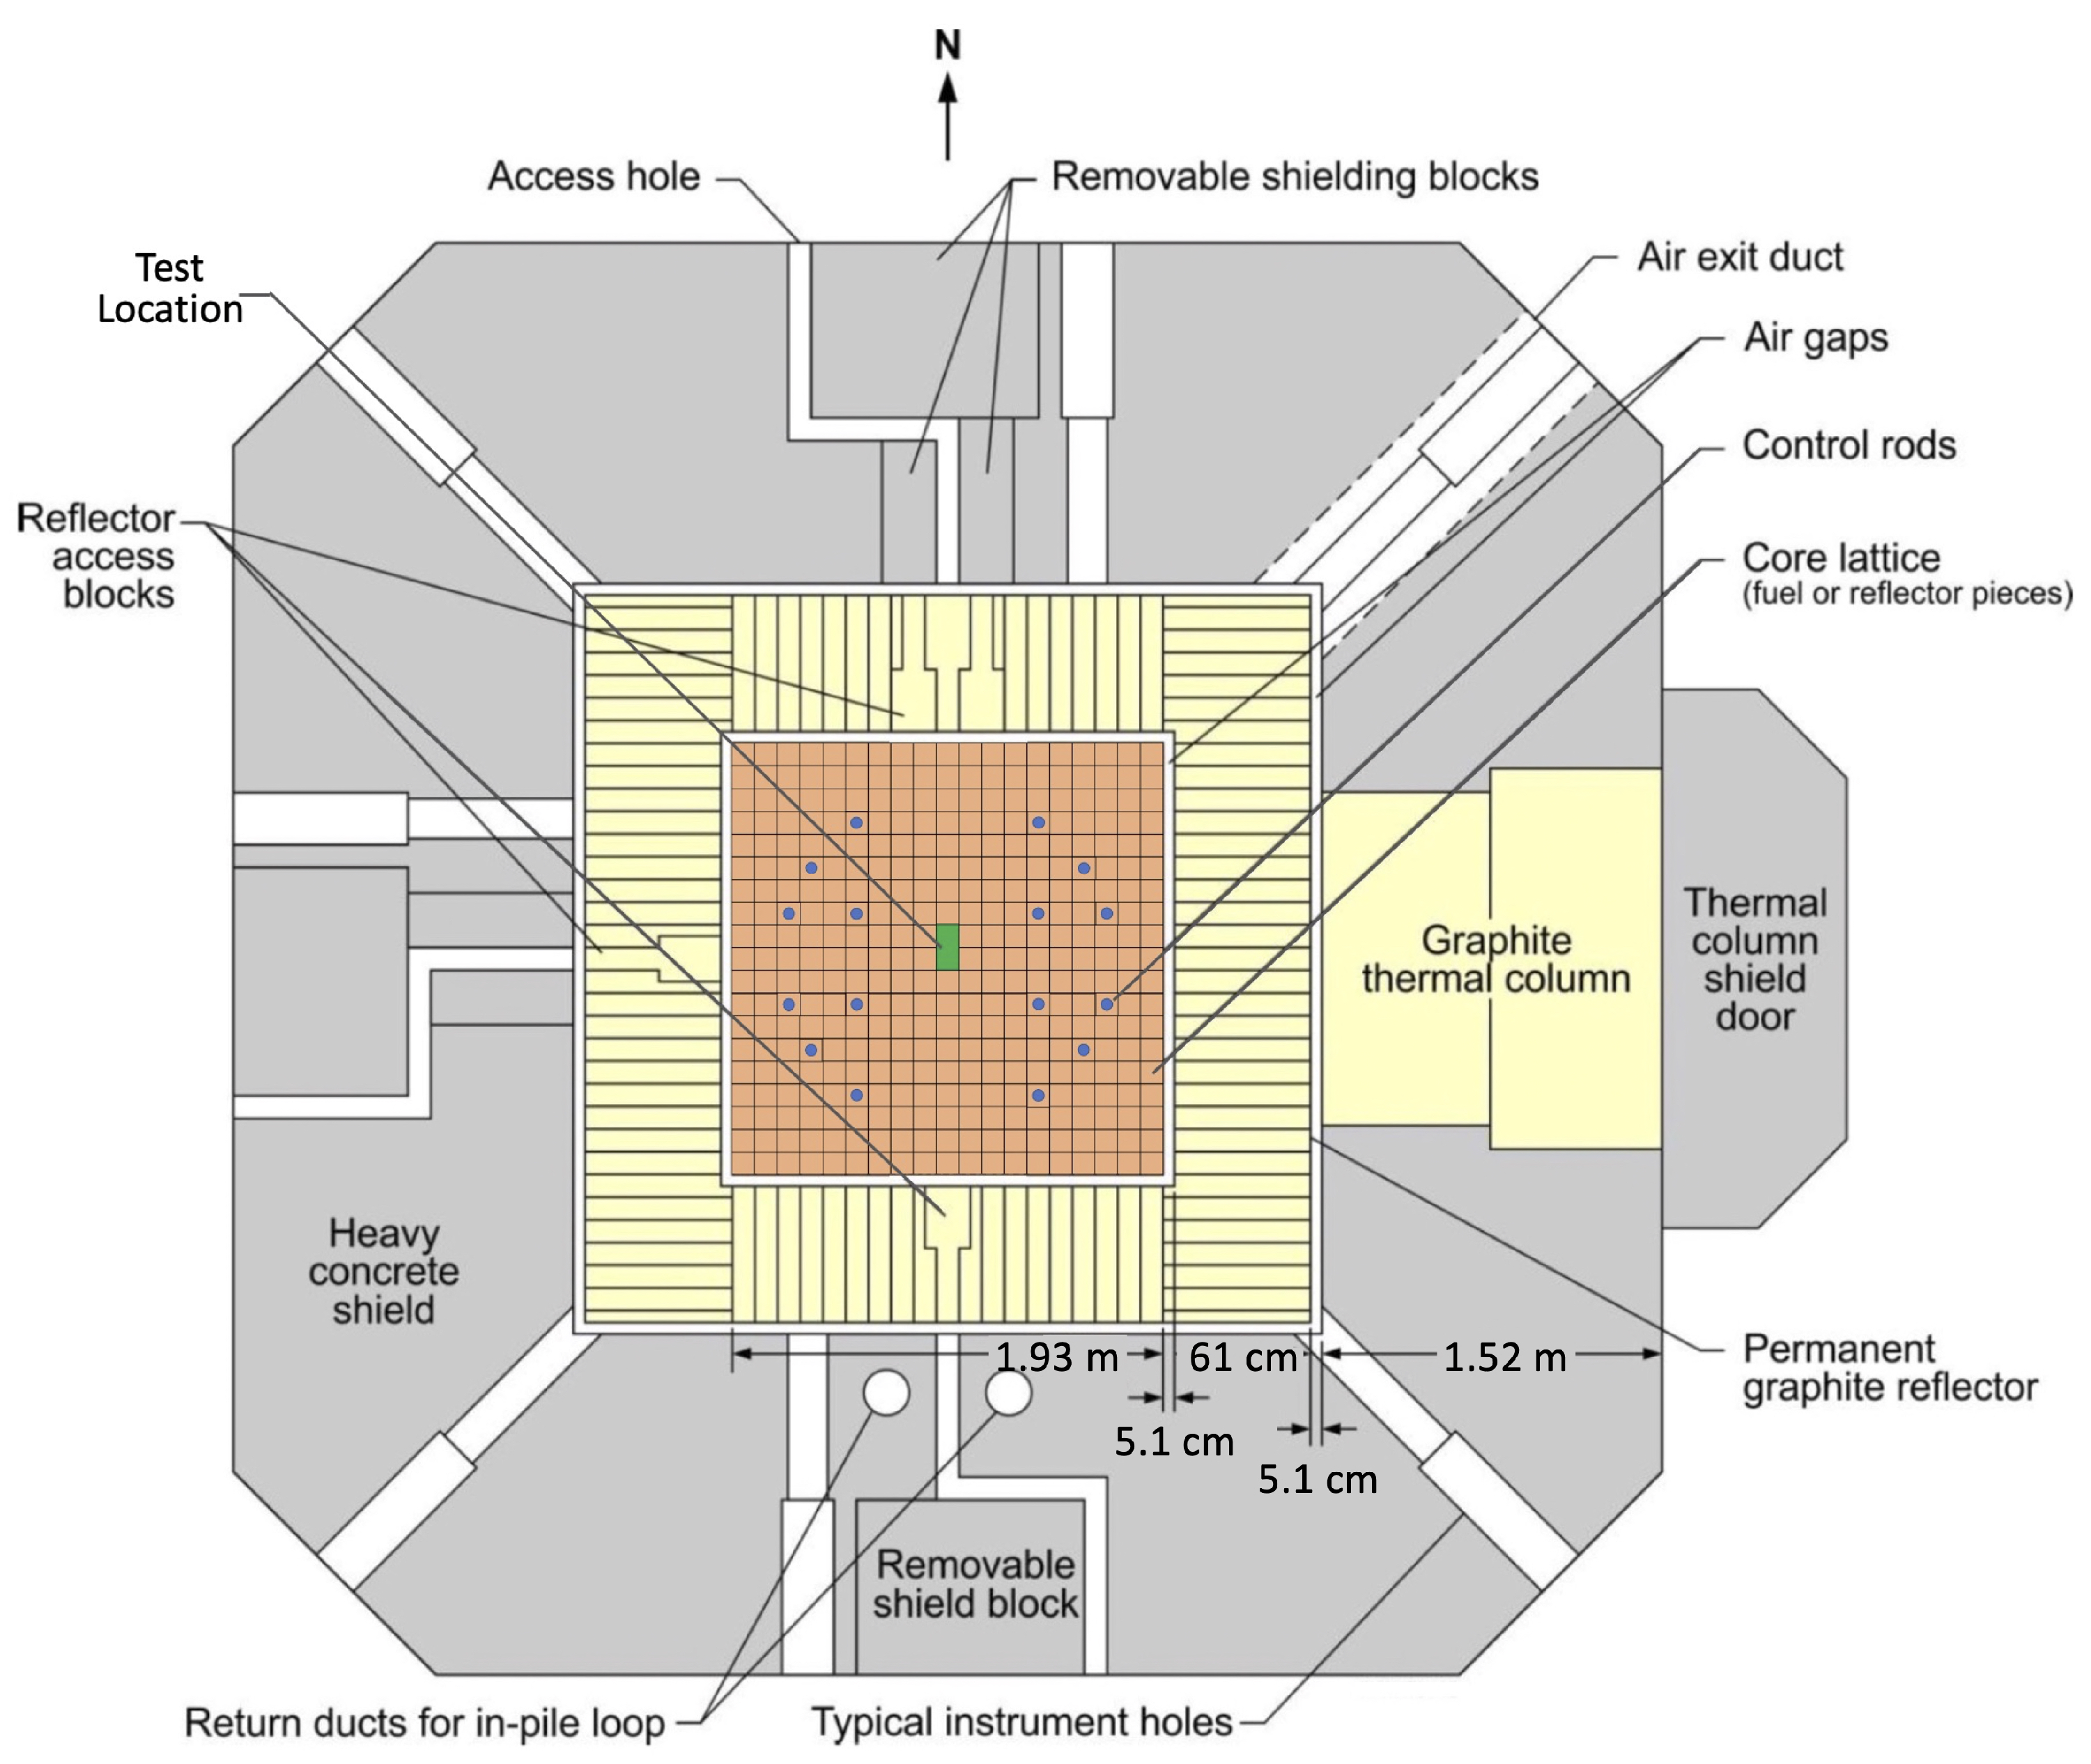
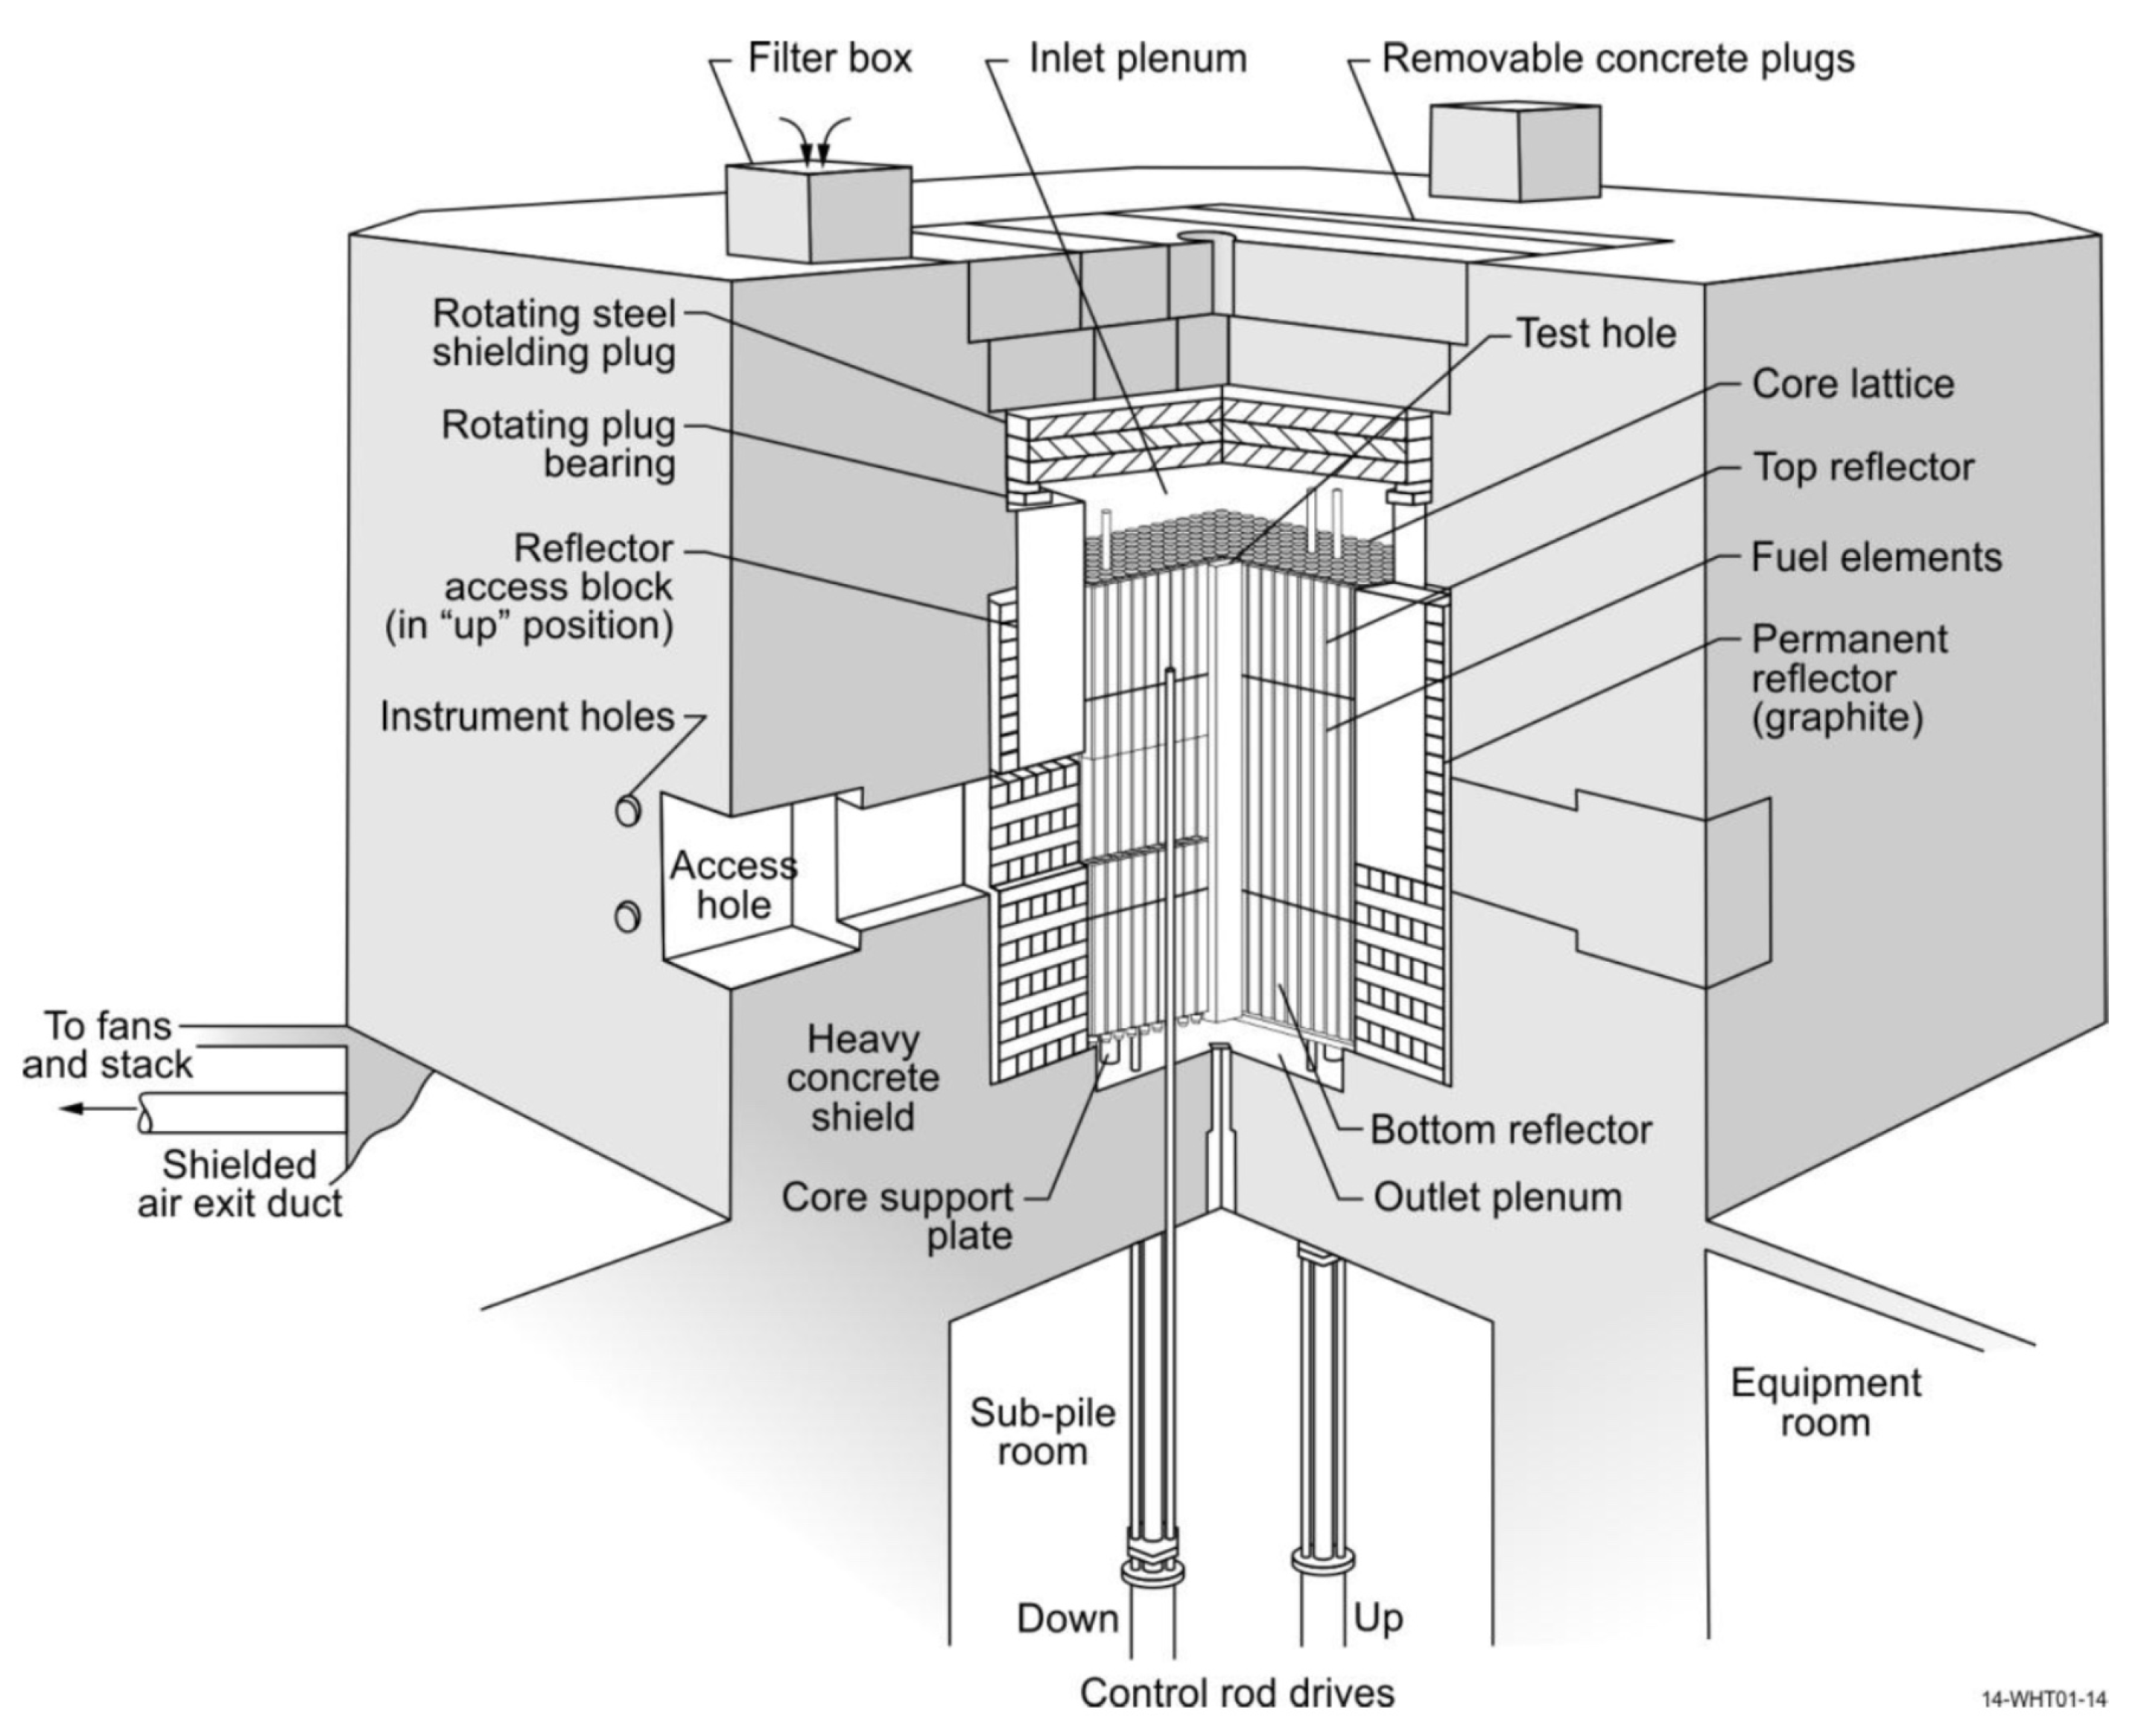
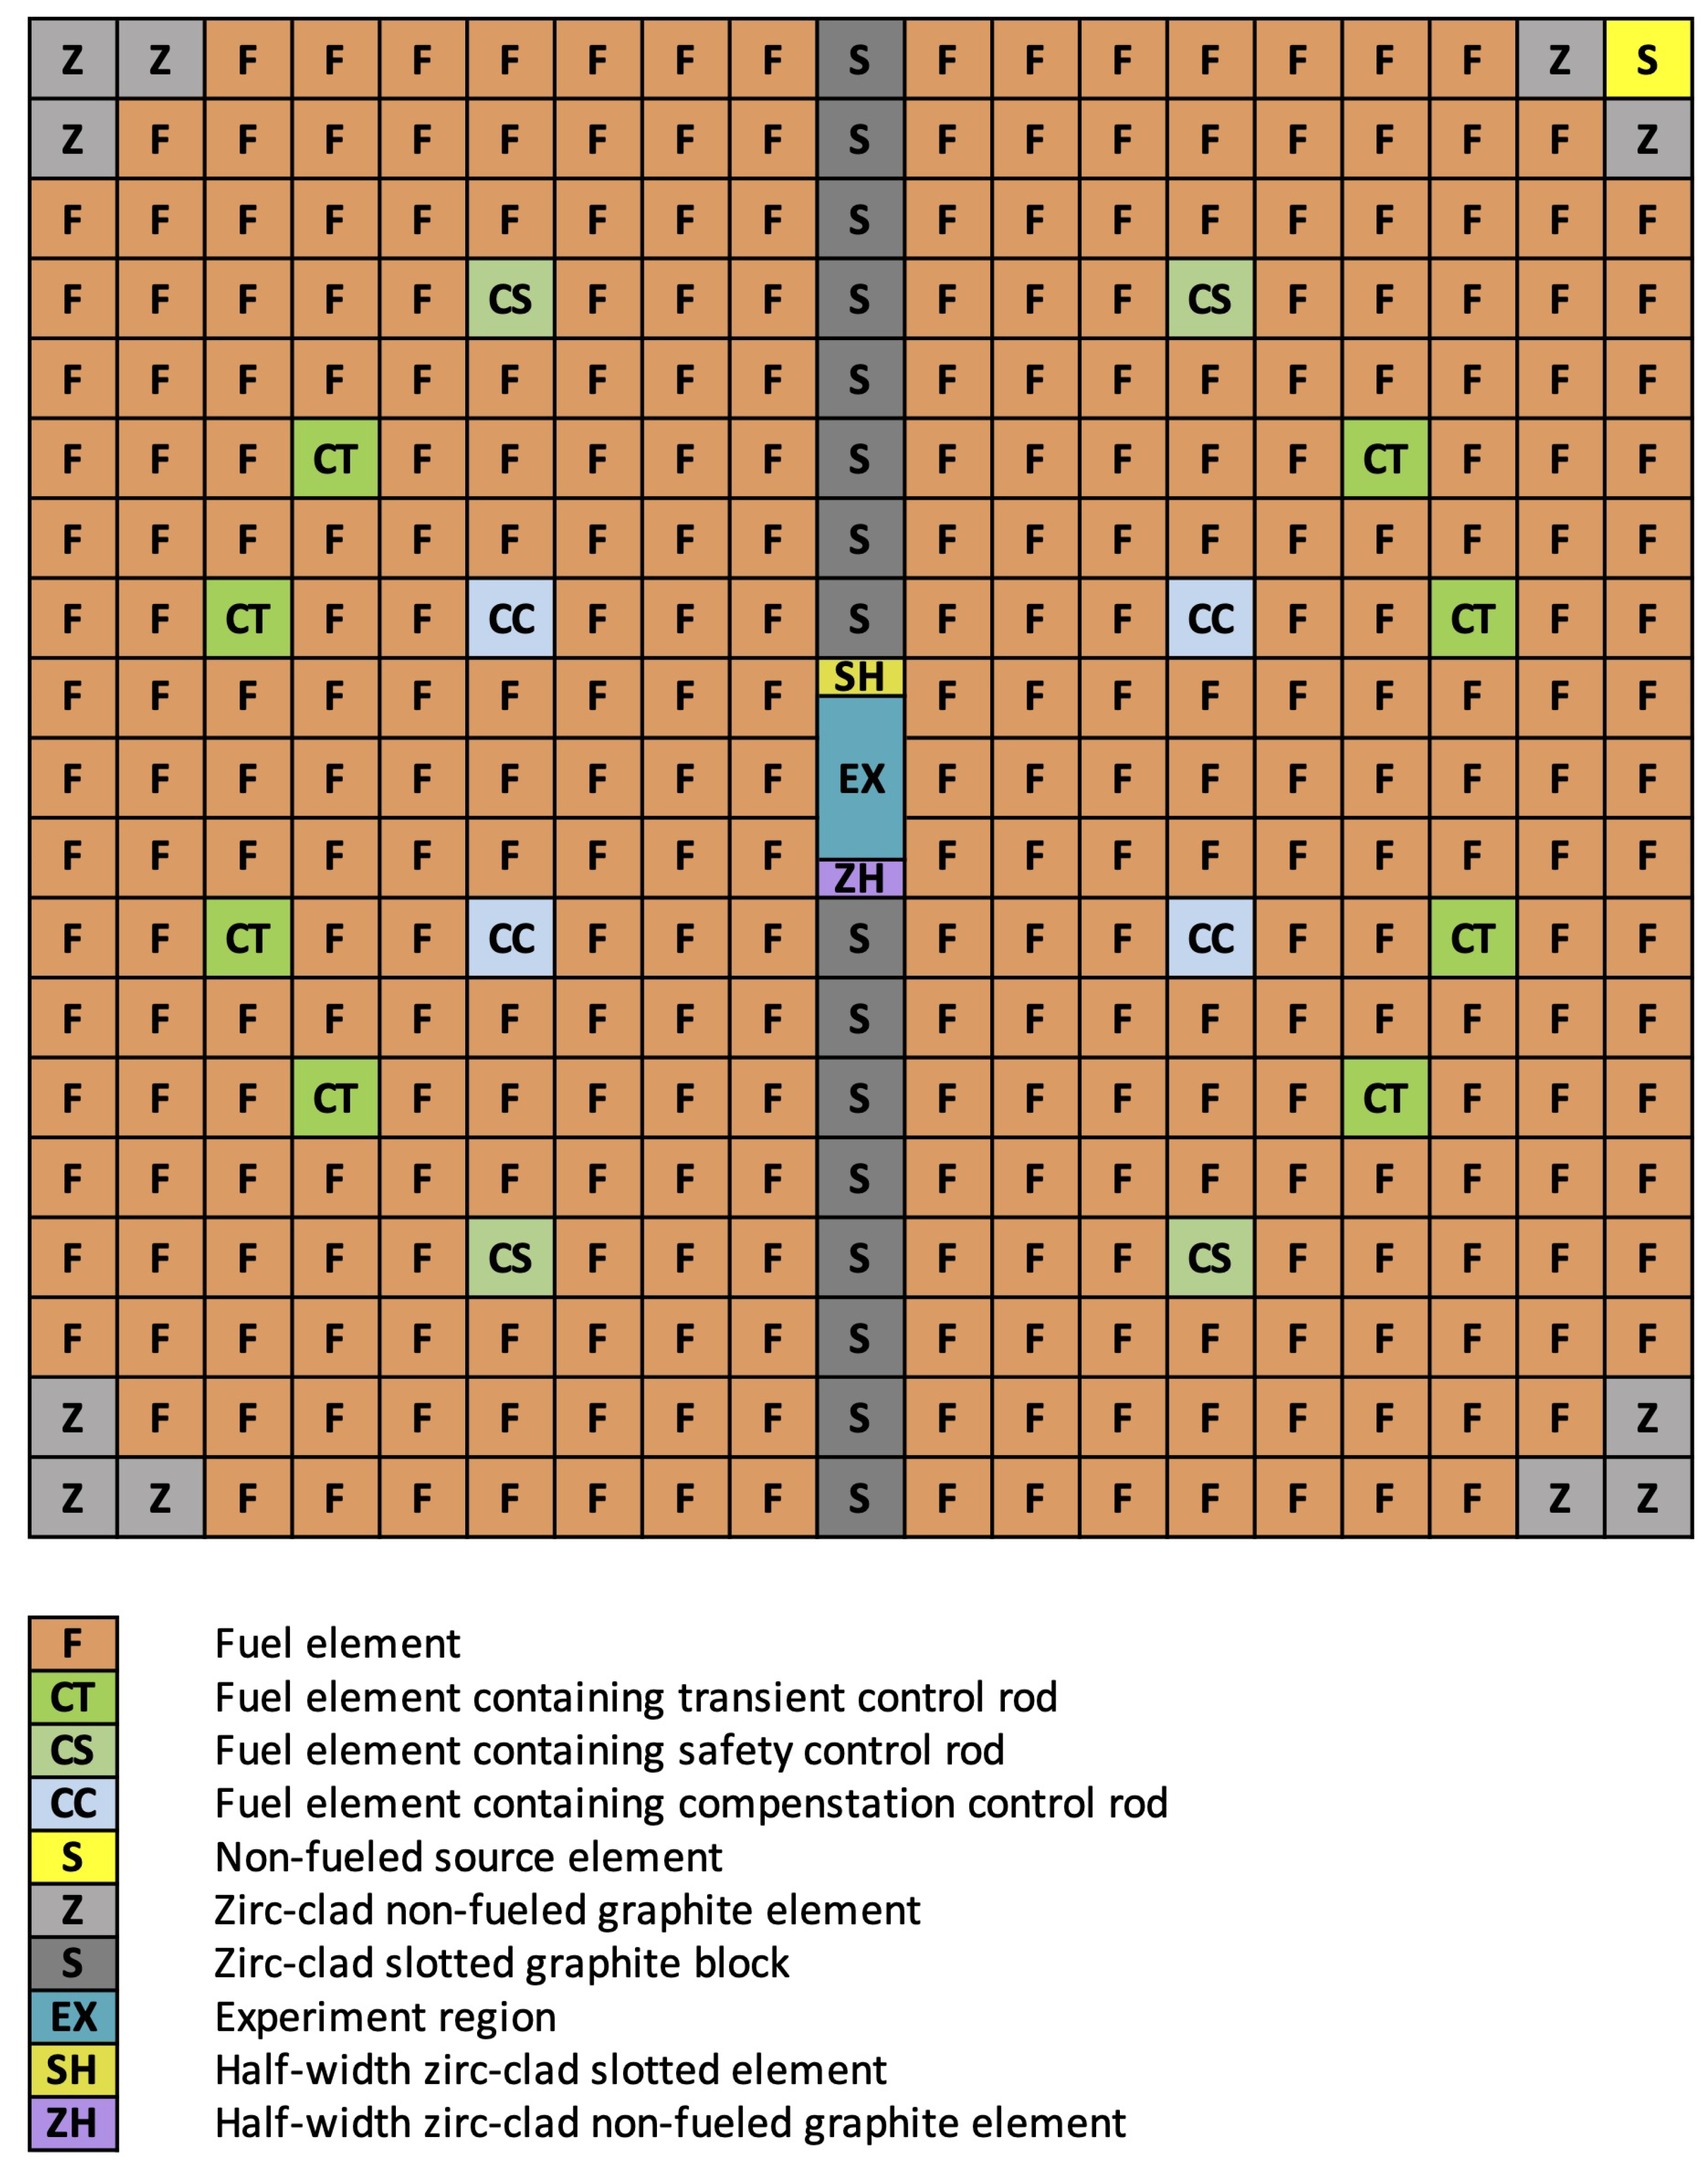
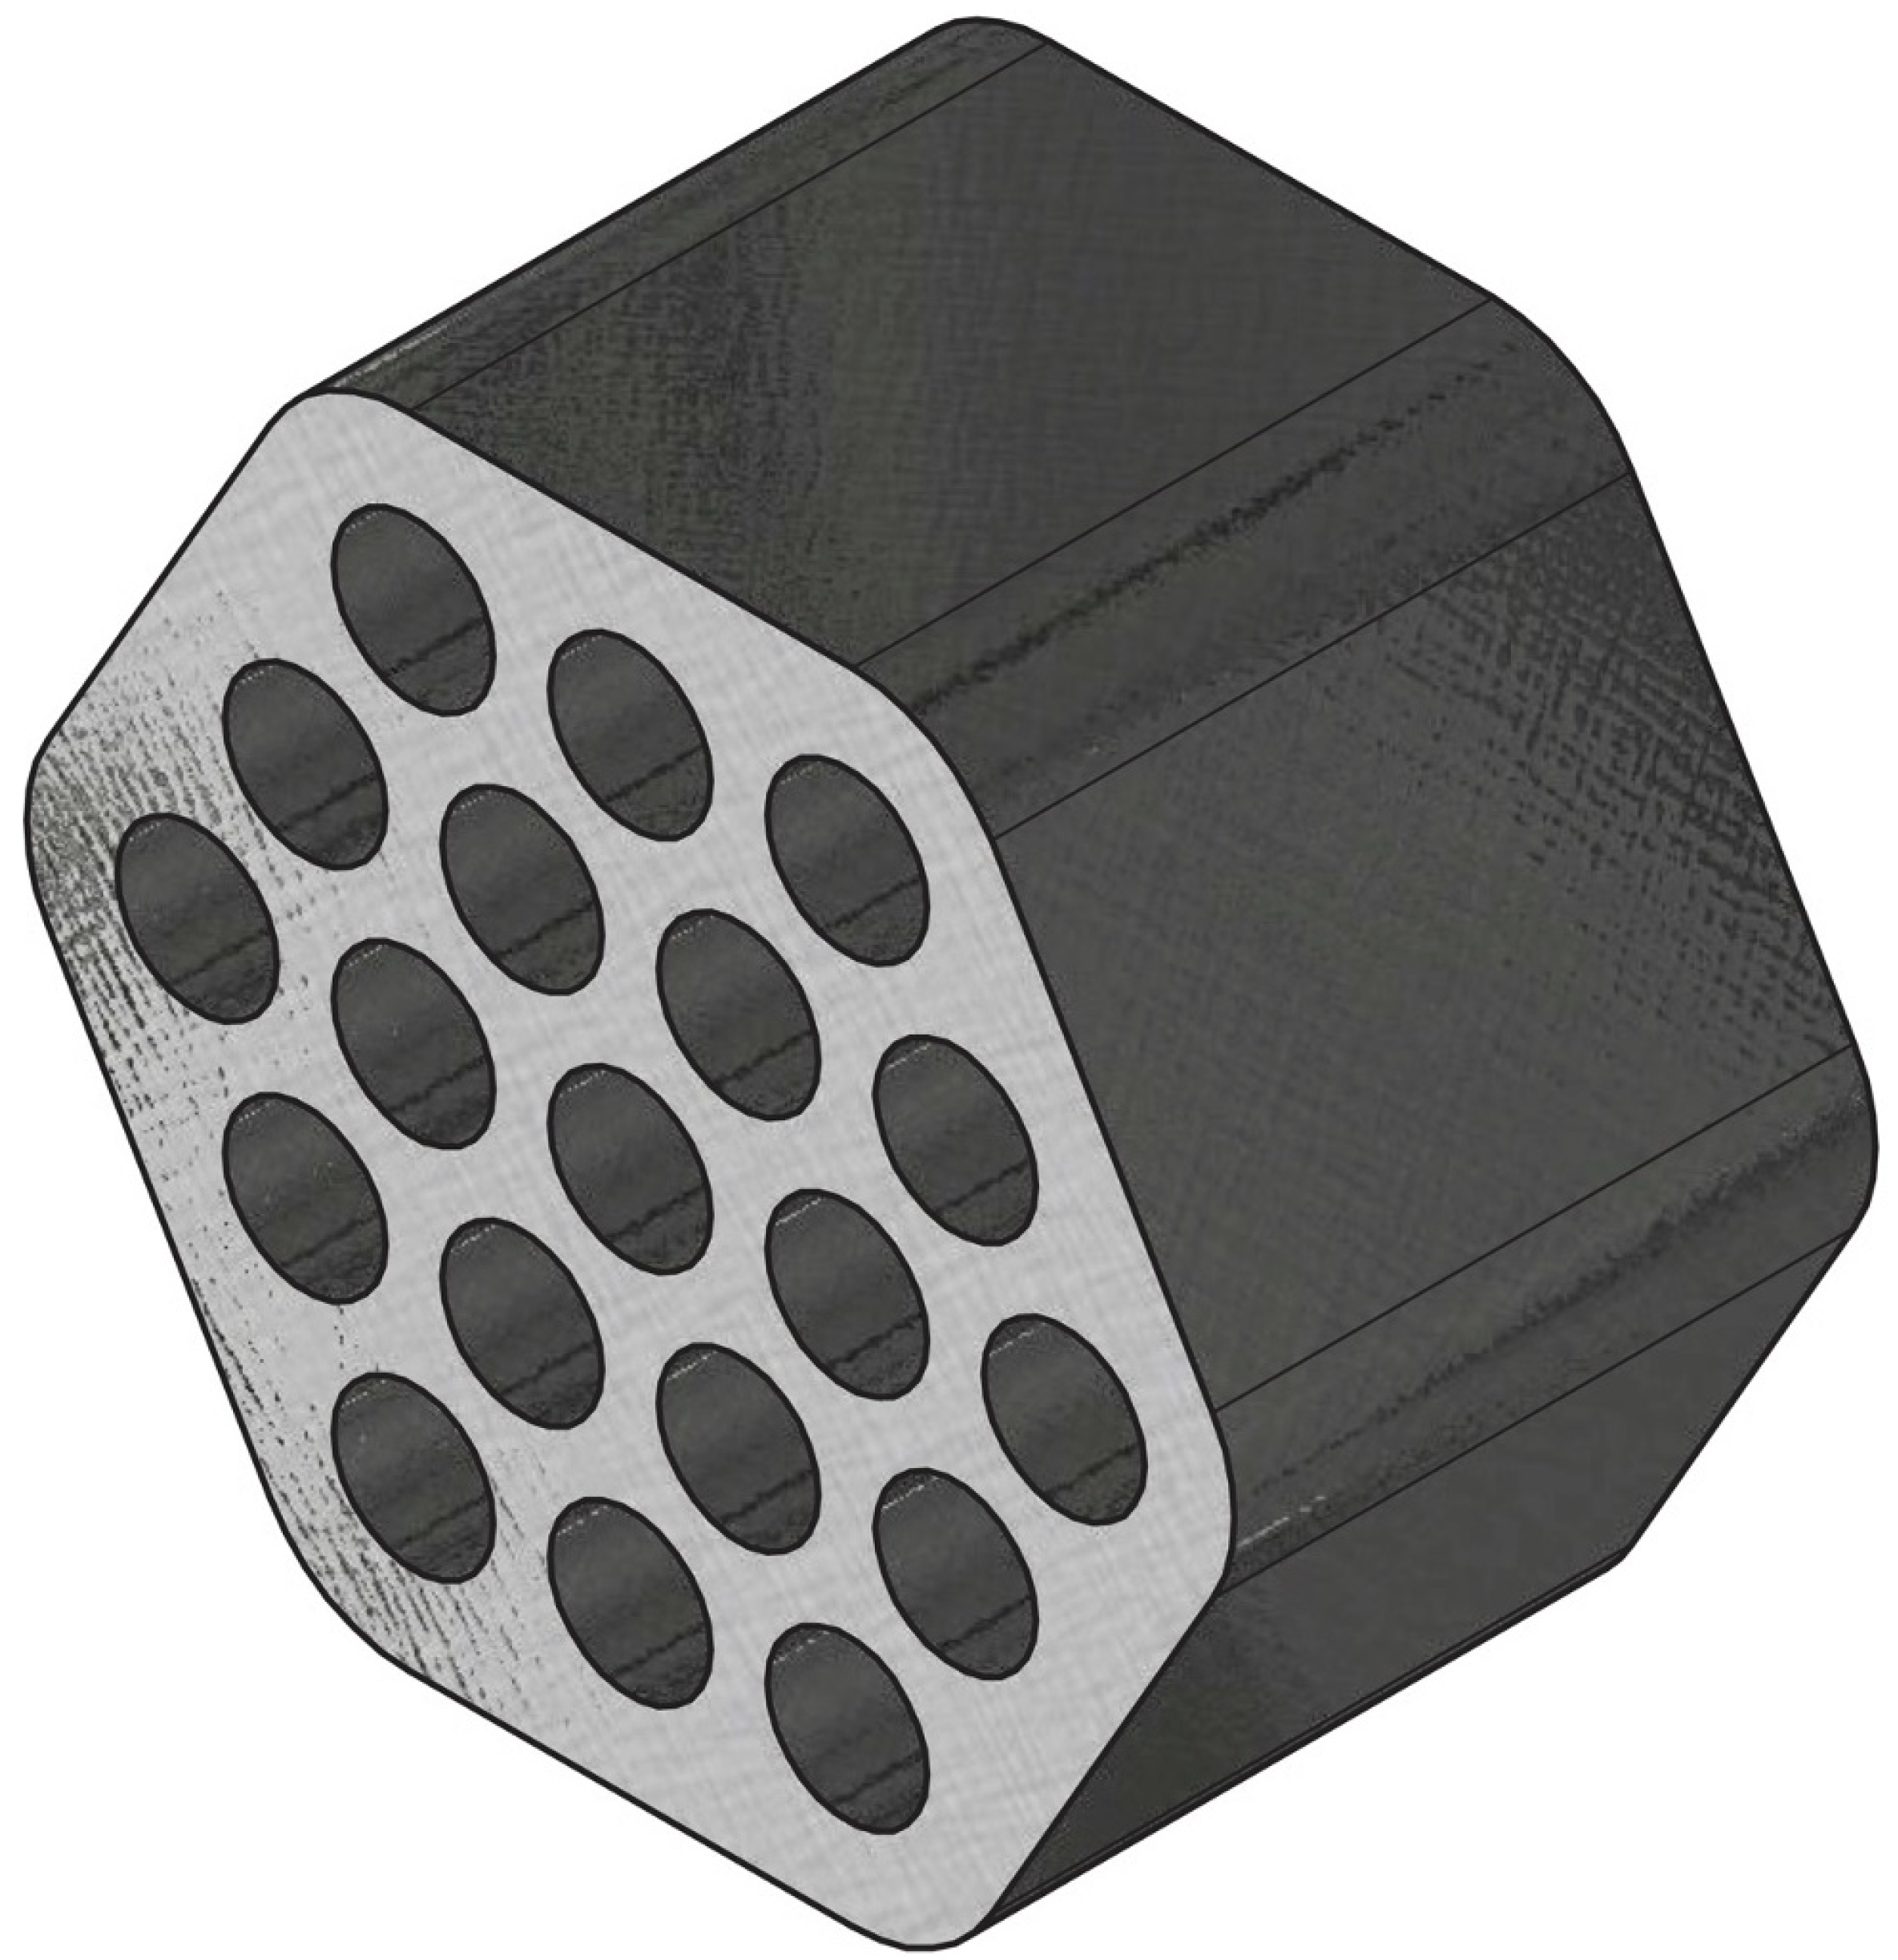
2. Overview of the TREAT Facility

TREAT is an air-cooled, thermal-spectrum test facility designed for evaluating reactor fuels and structural materials under simulated nuclear excursions and transient power/cooling mismatch situations in a nuclear reactor [20]. Such testing involves placing fuel into the TREAT core and subjecting it to short bursts of intense, high-power neutron radiation. After the experiment is completed, the fuel and/or associated material is analyzed to determine the effects of the power burst. The resulting information is then used to guide the development and improvement of advanced nuclear fuel designs, and to validate computer models of fuel and core behavior.
The reactor core is loaded within a 19 × 19 square lattice, filled with fuel and reflector elements; the lattice region is fully reflected by approximately 61 cm (2 ft) of graphite on all sides. In its normal operation as a pulsed engineering test reactor, there is typically a vertical central hole containing a test sample, with a large slot containing non-fueled access hole fuel assemblies running horizontally from the core center out through the reflector. The 48-inch (121.92 cm) access hole fuel assembly, or slotted fuel assembly, is similar to a standard fuel assembly, but with a 122-cm-high air-filled window created in the center to allow for horizontal access through portions of the core. The graphite reflector regions remain above and below the slot. These assemblies are primarily utilized between the experiment and a fast neutron hodoscope located outside the core [21], in what is commonly referred to as the half-slotted core configuration. A full-slotted core has access hole fuel assemblies running the full north–south width of the core, from the hodoscope on the north side of the core to the fixed reflector on the south side of the core. The size of the core is adjusted to provide the excess reactivity necessary to run the various transients required for test operations [22]. The reactor cavity is designed to accommodate a total of 361 assemblies (e.g., fuel, fuel/control, reflector, slotted) arranged in a 10.16-cm (4 in)-square lattice, with a maximum active core size of 193.04 cm (76 in) square by 121.92 cm (4 ft) high [20]. A top view of the core is provided in Figure 1. Figure 2 shows a cutaway view of the full facility. The 16 control rod locations are fixed; however, other fuel elements can be reconfigured as needed.
The TREAT core is driven by highly enriched uranium (HEU) dispersed in a graphite matrix (1:10,000 235U/C atom ratio). TREAT’s design provides experimental flexibility and inherent safety during neutron pulsing. Such safety stems from the graphite in the driver fuel having a strong negative temperature coefficient of reactivity resulting from a thermal Maxwellian shift; this shift results in reduced fission in 235U, in turn allowing increased leakage as the core heats up. This is complemented by graphite’s heat capacity, acting as a heat sink.
TREAT has three sets of control rods: compensation, safety and transient rods. Figure 3 shows the rod locations; this illustration also shows the full-slotted core configuration discussed earlier. Compensation rods are located closest to the experiment, would have the strongest effect on an experiment, and are therefore always fully out during transients. The transient rods are set partially inserted at a height that will yield the desired reactivity insertion upon full withdrawal. The transient is then initiated by rapid withdrawal of these rods. The safety rods are partially inserted to bring the core to a critical state prior to the transient, and remain in a fixed position during the transient. Each rod is located within an annular tube inset within a number of specially designed fuel elements, and a graphite follower is attached below the poisoned length of each rod. All rod positions are measured based on the rods’ fully inserted state, and the rods are pushed up out of the core from the bottom (see Figure 2).
TREAT transient power shapes are driven by a computer control system called the automatic reactor control system (ARCS). ARCS controls the TREAT transient rods in order to produce power histories shaped to meet the requirements set by the experimenter. The ability of ARCS to control the TREAT reactor power in a well-prescribed manner from neutronics conditions, such as temperature feedback and control rods, is critical to TREAT’s mission of creating shaped transients [23]. For the SIRIUS-CAL transient, a natural transient was planned, i.e., a transient in which the peak power was determined solely by temperature feedback from the TREAT fuel assemblies.
For the SIRIUS-CAL measurement, a low-power transient was desired, requiring the transient rods to be positioned in a largely withdrawn state prior to the transient; the safety rods would be set such that the core was critical prior to transient rod removal. Details on the initial state for the SIRIUS-CAL measurement are provided in the next section, including control rod positioning data.

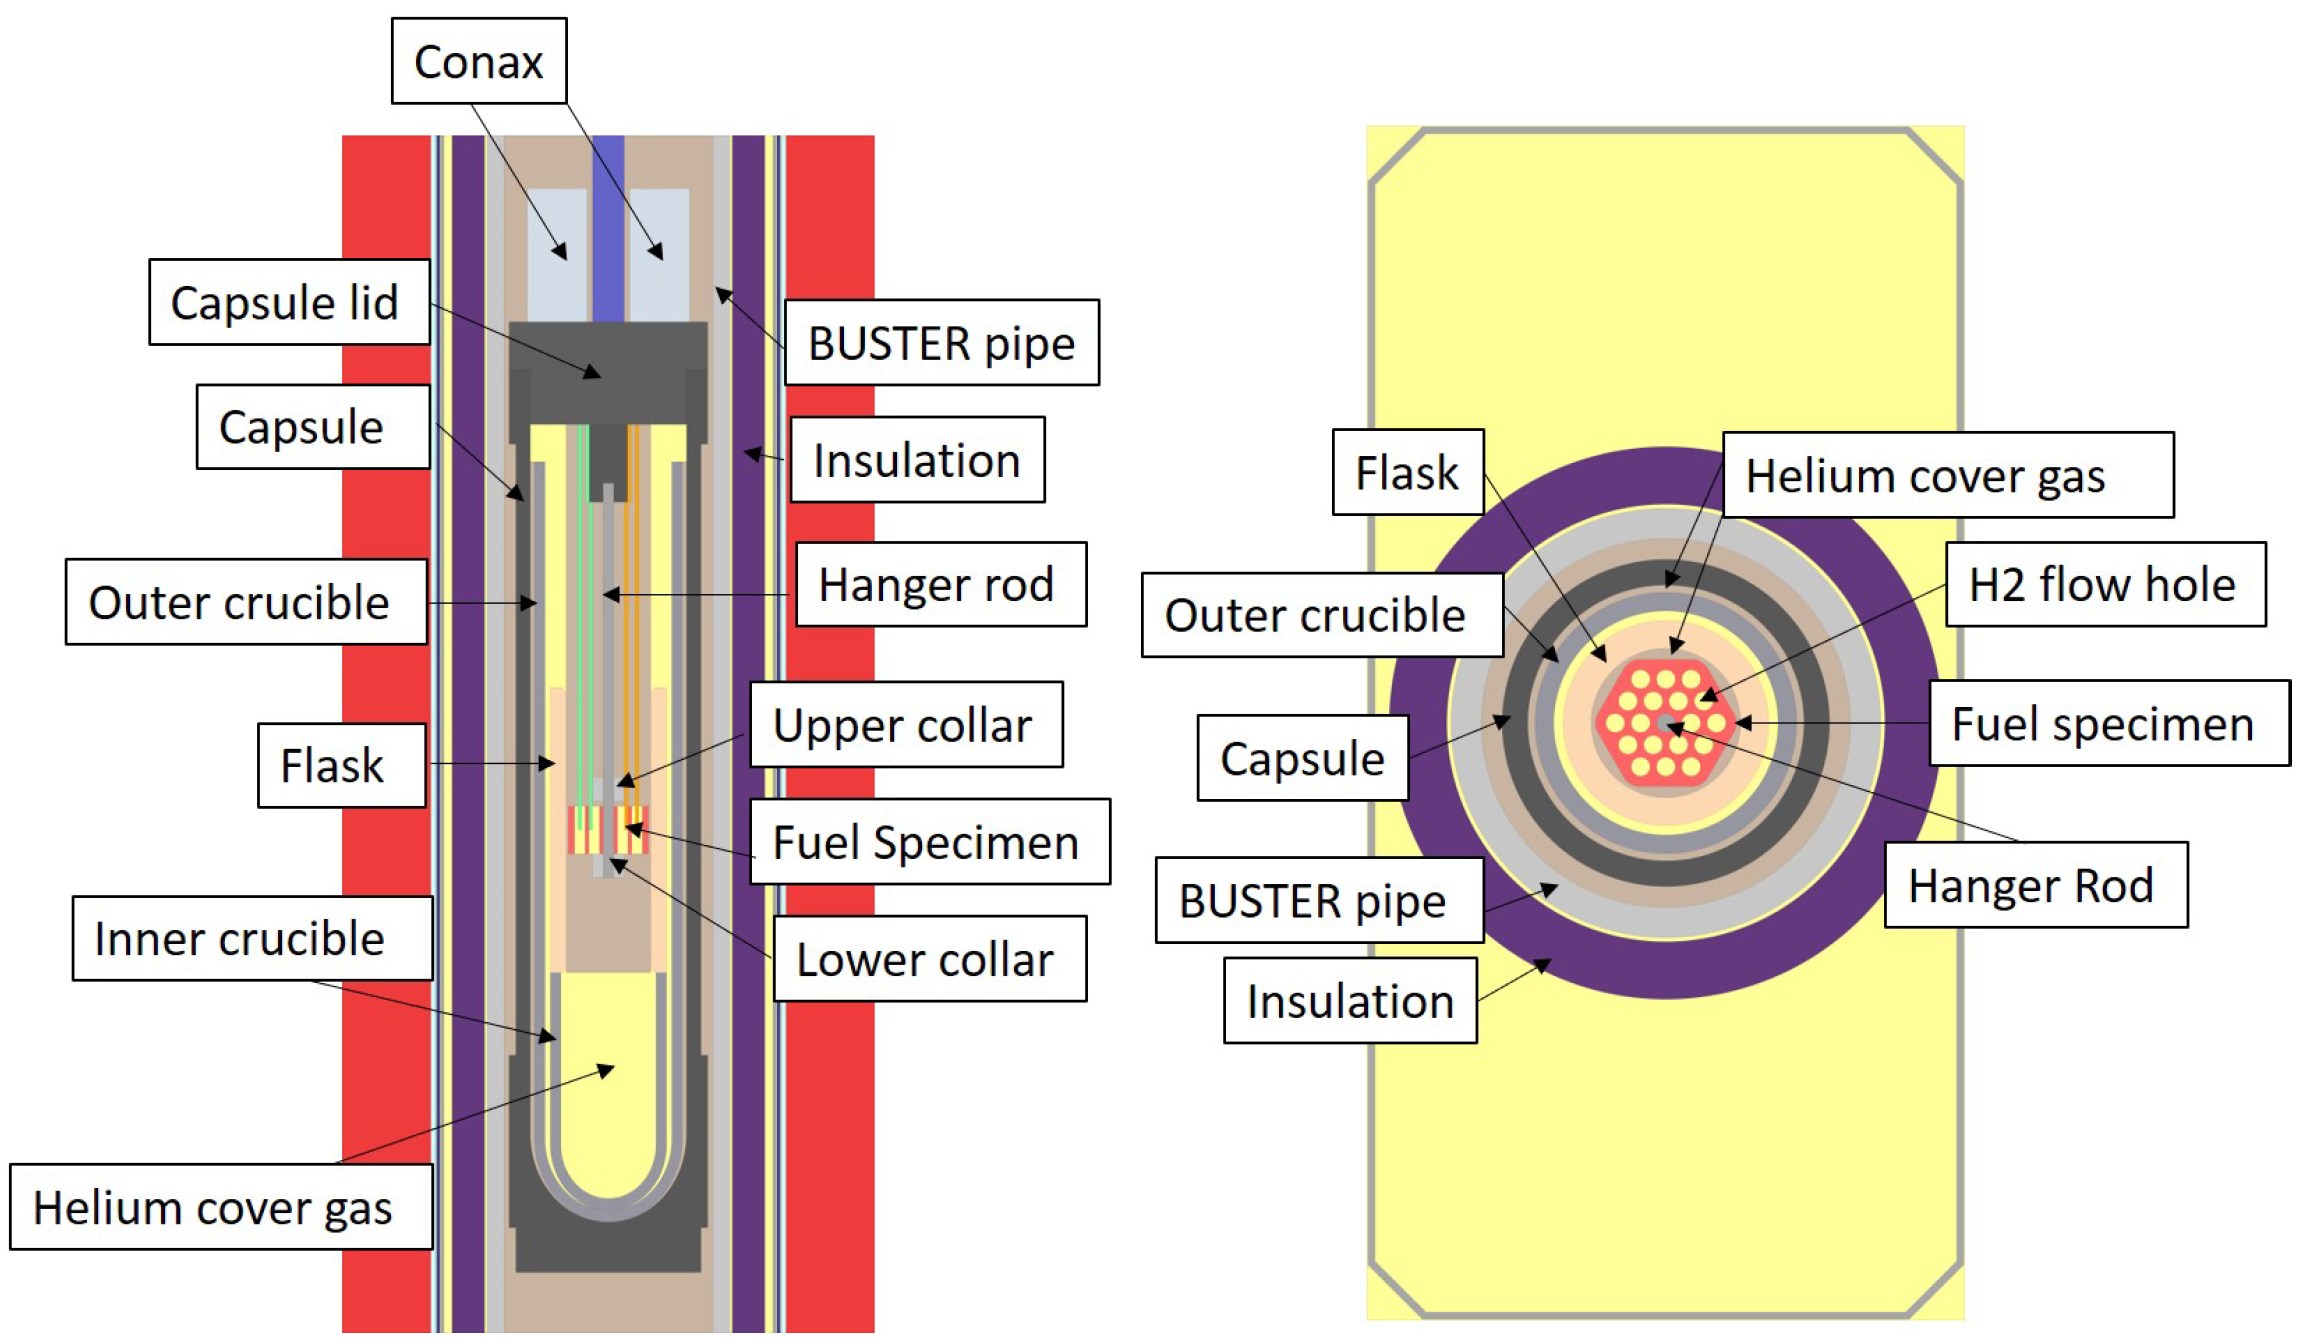
3. The SIRIUS-CAL Experiment

The SIRIUS-CAL experiment was the first of the SIRIUS campaign experiments to be irradiated for the testing of candidate fuel samples in order to characterize fuel performance in an NTP-like environment. It utilizes the Minimal Activation Retrievable Capsule Holder (MARCH) irradiation vehicle system, along with a Separate Effects Test Holder (SETH) capsule [24]. The MARCH system uses a modular approach in which an outer containment structure provides the safety containment barrier for specimens within. This containment structure, termed the Broad Use Specimen Transient Experiment Rig (BUSTER), can house various different modules. Figure 4 illustrates the SIRIUS-CAL experiment. With the exception of the specimen and the instrumentation attachments, SIRIUS-CAL utilized hardware similar to that used in the earlier SETH experiment series for accident-tolerant fuel tests [25]. Subsequent SIRIUS tests also utilized BUSTER for secondary containment, although specially designed SIRIUS-specific capsules were developed for those experiments. SIRIUS-CAL, as well as the subsequent experiments performed to date, have all used the full-slotted core, as shown in Figure 3.
The fuel sample itself (shown in yellow in Figure 4) is hexagonal with rounded corners, with a 3.39 cm flat-to-flat or inner diameter. It is 1.27 cm in height and has 19 flow holes, each 0.32 cm in diameter. The specimen is shown in isometric perspective in Figure 5. It was positioned inside the SETH module and suspended by a hanger rod with collars to hold it in place. Once the SETH module was loaded into the BUSTER container and the full assembly had been placed in the core, the specimen was axially centered 2.13 cm above the fuel center line. The specimen was fabricated using UN with 21% 235U enrichment, mixed to 55 vol% in a W-25Re matrix. The specimen was instrumented with four type-K thermocouples and two pyrometers for measuring specimen surface temperatures. Specimen temperatures were measured by placing the junction region of the thermocouples and the ends of the pyrometers halfway into the fuel specimen’s coolant channels [26].
The SIRIUS-CAL transient experiment was initiated at 10:29 AM on 19 June 2019. Per standard procedure, the compensation rods were fully withdrawn from the core for the entire transient, at 148.6 cm (58.5 in). The safety/shutdown rods were set at 71.6 cm (28.2 in) and the transient rods at 85.8 cm (33.7 in) to establish the pre-transient critical state. The initial core power at critical was approximately 8 kW, and the core itself was at room temperature.
At full withdrawal to initiate the transient, the transient rods had a height of 101.6 cm (40 in), or 4.8 cm (1.9 in) above the top of the fueled height of the core. Hence, for this transient, the transient rods traveled 16 cm (6.3 in), requiring 0.08 s, resulting in a multiplication factor of 1.0055 (0.55% Δ K/k) and a 1.8262 s period. All rods were driven back into the core at 32.04 s after the beginning of the transient. The experimental sample was instrumented to acquire the transient temperature response of the sample. These data will be described further in Section 6.
The following section describes the modeling approach to simulate this transient. More importantly, the simulation includes the SIRIUS fuel sample described above. In this work, we will show a simulation of the TREAT transient power excursion, but we focus on the response of the SIRIUS fuel specimen, driven by the TREAT transient. The results of the simulation are provided in Section 6.

4. Modeling Approach

In this work, analyses were performed using the Griffin reactor multiphysics application, which is described in detail in the literature [15,19,27,28]. The present analysis is based on the use of an accurate generalized equivalence theory method based on full-core solutions using the SuperHomogenization (SPH) approach [29]. In general, the following steps are used in generating equivalent homogenized cross-sections:
  • A detailed Monte Carlo transport solution is used to generate region-homogenized cross-sections and reference fluxes from full 3-D core simulations.
  • These cross-sections are converted to the ISOXML format used by Griffin [15]. This cross-section file also carries the reference flux computed in the previous step.
  • The ISOXML library is used in a Griffin SPH solver to generate SPH correction factors for each homogenization equivalence region and each energy group.
  • Correction factors are added to the ISOXML file.
  • Griffin reads cross-sections and correction factors from the ISOXML file, internally computes corrected cross-sections or diffusion coefficients, as appropriate, and performs the transport or diffusion calculation on the homogenized mesh.
All neutronics solutions in this work use a continuous finite element method (FEM) diffusion discretization. The Griffin diffusion solver is the primary solution method used for the k-eigenvalue, adjoint, SPH and time-dependent solutions. An available improved quasi-static method [30] and point kinetics equations solver are useful to compute and verify the effective kinetic parameters. The former is also used to accelerate the calculation, as is discussed later.

4.1. Cross-Section Generation

In the current work, preparation of the neutron data used in TREAT simulations requires the use of two computer codes: Serpent [31] and Griffin. Serpent is a 3D continuous-energy Monte Carlo reactor physics code developed by the VTT Technical Research Centre of Finland. It was selected early on in the TREAT modeling/simulation efforts because it offers 3D spatial homogenization and group constant generation for deterministic reactor simulator calculations. At the same time, Serpent provides a detailed reference calculation without energy, angular, or spatial discretization approximations. In this work, Serpent 2.1.28 was used with cross-sections based on the MCNP ENDF/B-VII.r1 library [32]. The Serpent calculations were performed using 4 million histories per cycle with 20 inactive and 2000 active cycles, resulting in a statistical uncertainty of about 1 pcm for the eigenvalue.
The energy group structure and number of homogenized cross-section regions were assumed based on previous experience with TREAT core modeling [33,34,35]. Table 1 presents the 10-group structure used for generating multigroup cross-sections for Griffin calculations. The details of the SIRIUS-CAL experiment are illustrated in Figure 6. For simulating the experiment, spatially homogenized regions were used in the radial direction.
The cross-sections were parameterized at different core fuel temperatures and transient rod positions. State points of 300, 320 and 340 K were applied to the core fuel temperature, and transient rod positions of 85.8 (initial position), 90.0 and 101.6 cm (fully out) were used. Because the transient rods are fully withdrawn before sensible temperature changes occur in the fuel, the control rod positions vary only for the 300 K fuel temperature, while higher temperatures are paired with the fully out state only. Thus, only five state point pairs are required; one Serpent calculation was performed for each. These state points are based on measured reactor data and bound the limits of core operation for this transient. Because SIRIUS-CAL was a low-power transient, the core temperature range and travel length of the transient rod are both much smaller than would be seen in a nominal transient test.

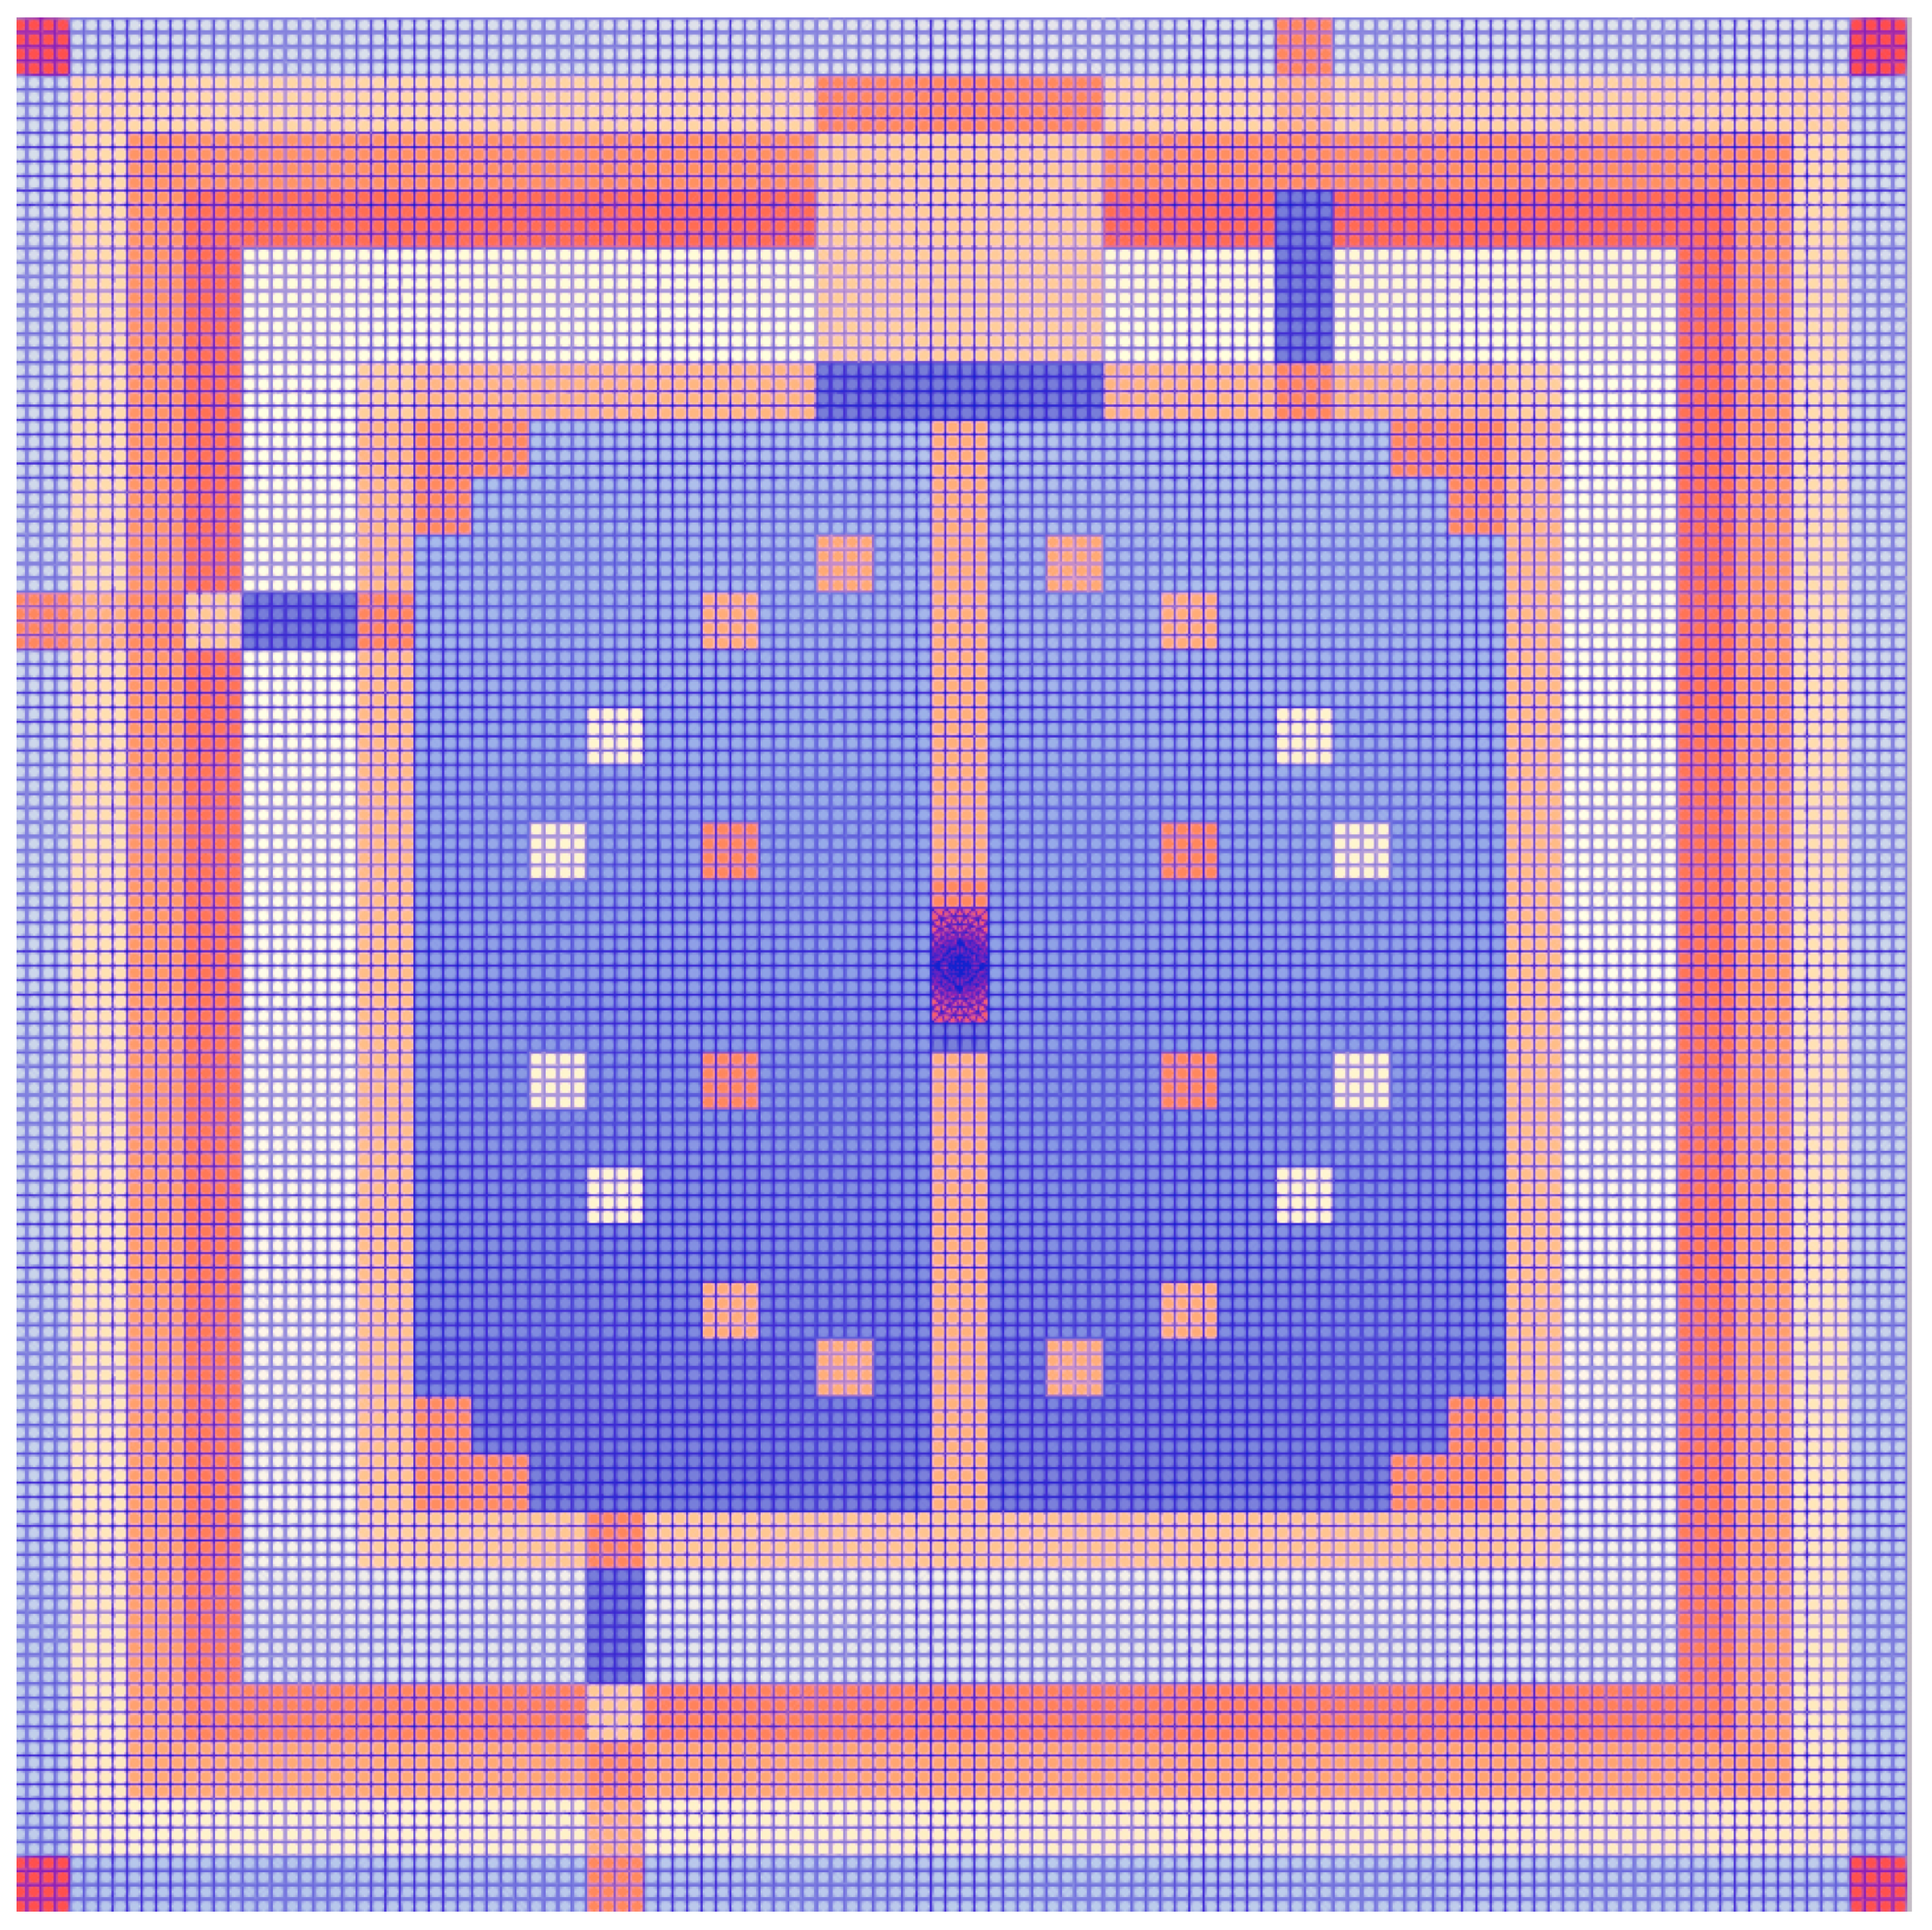
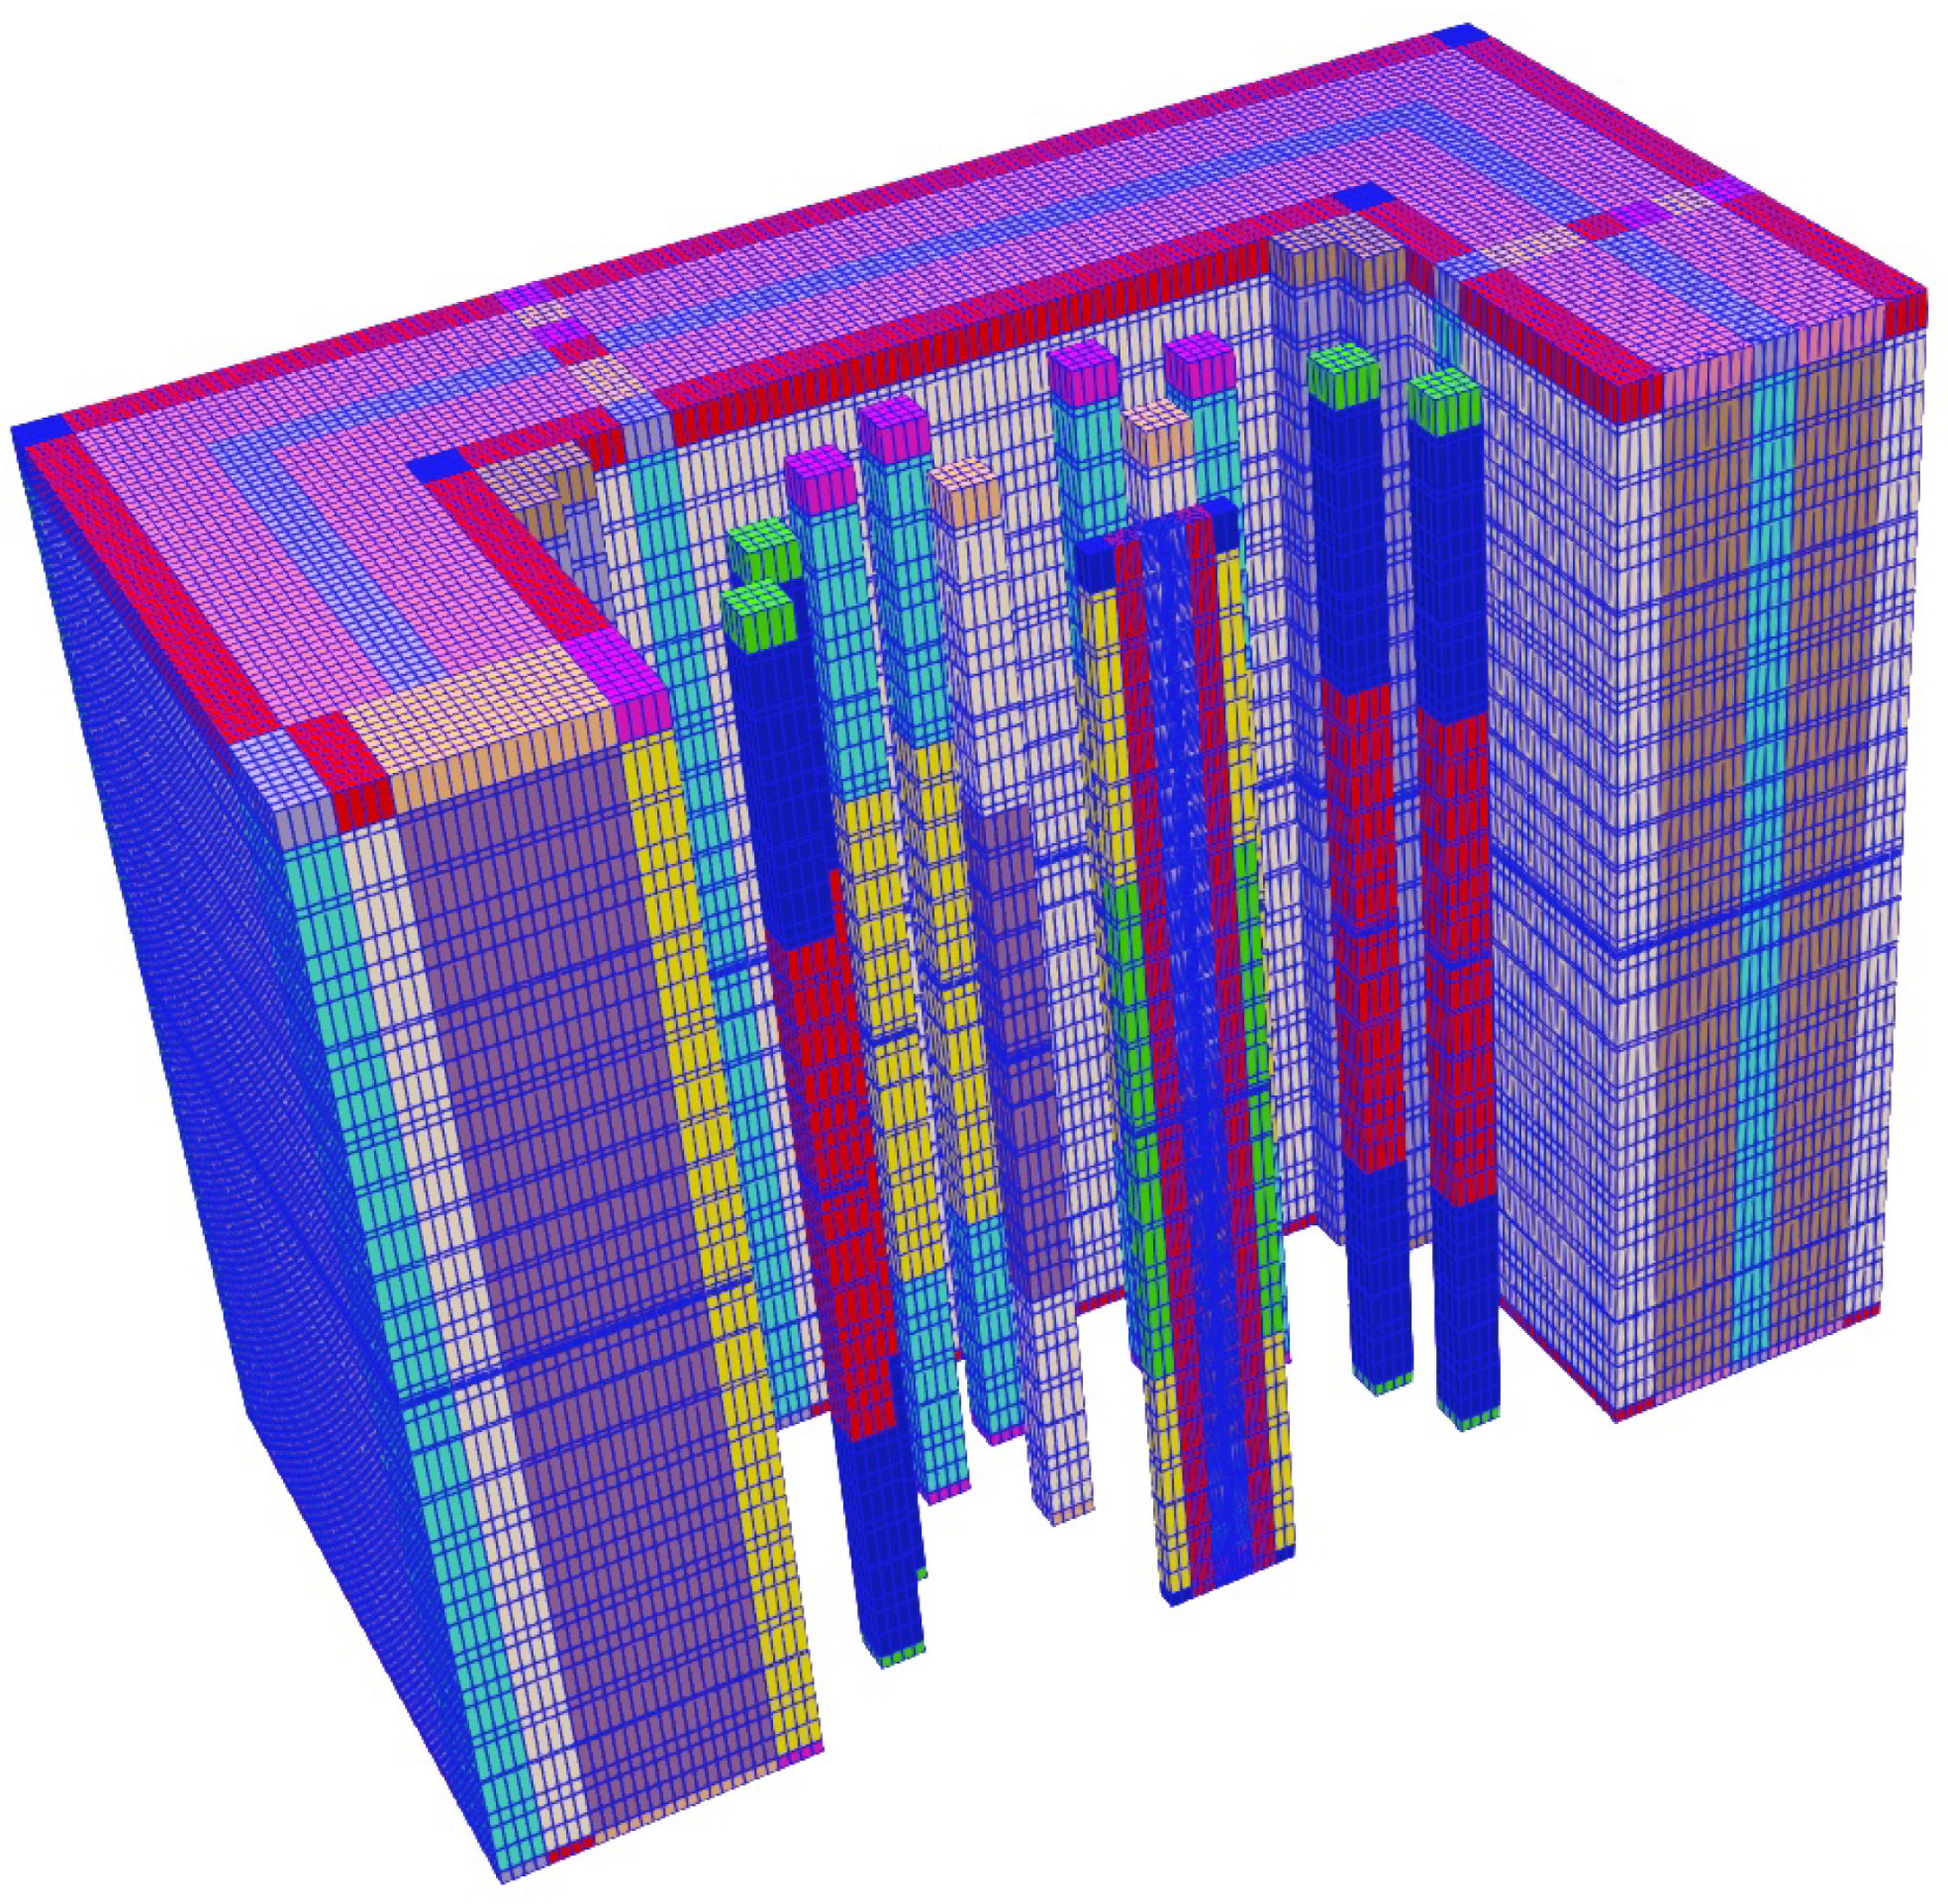
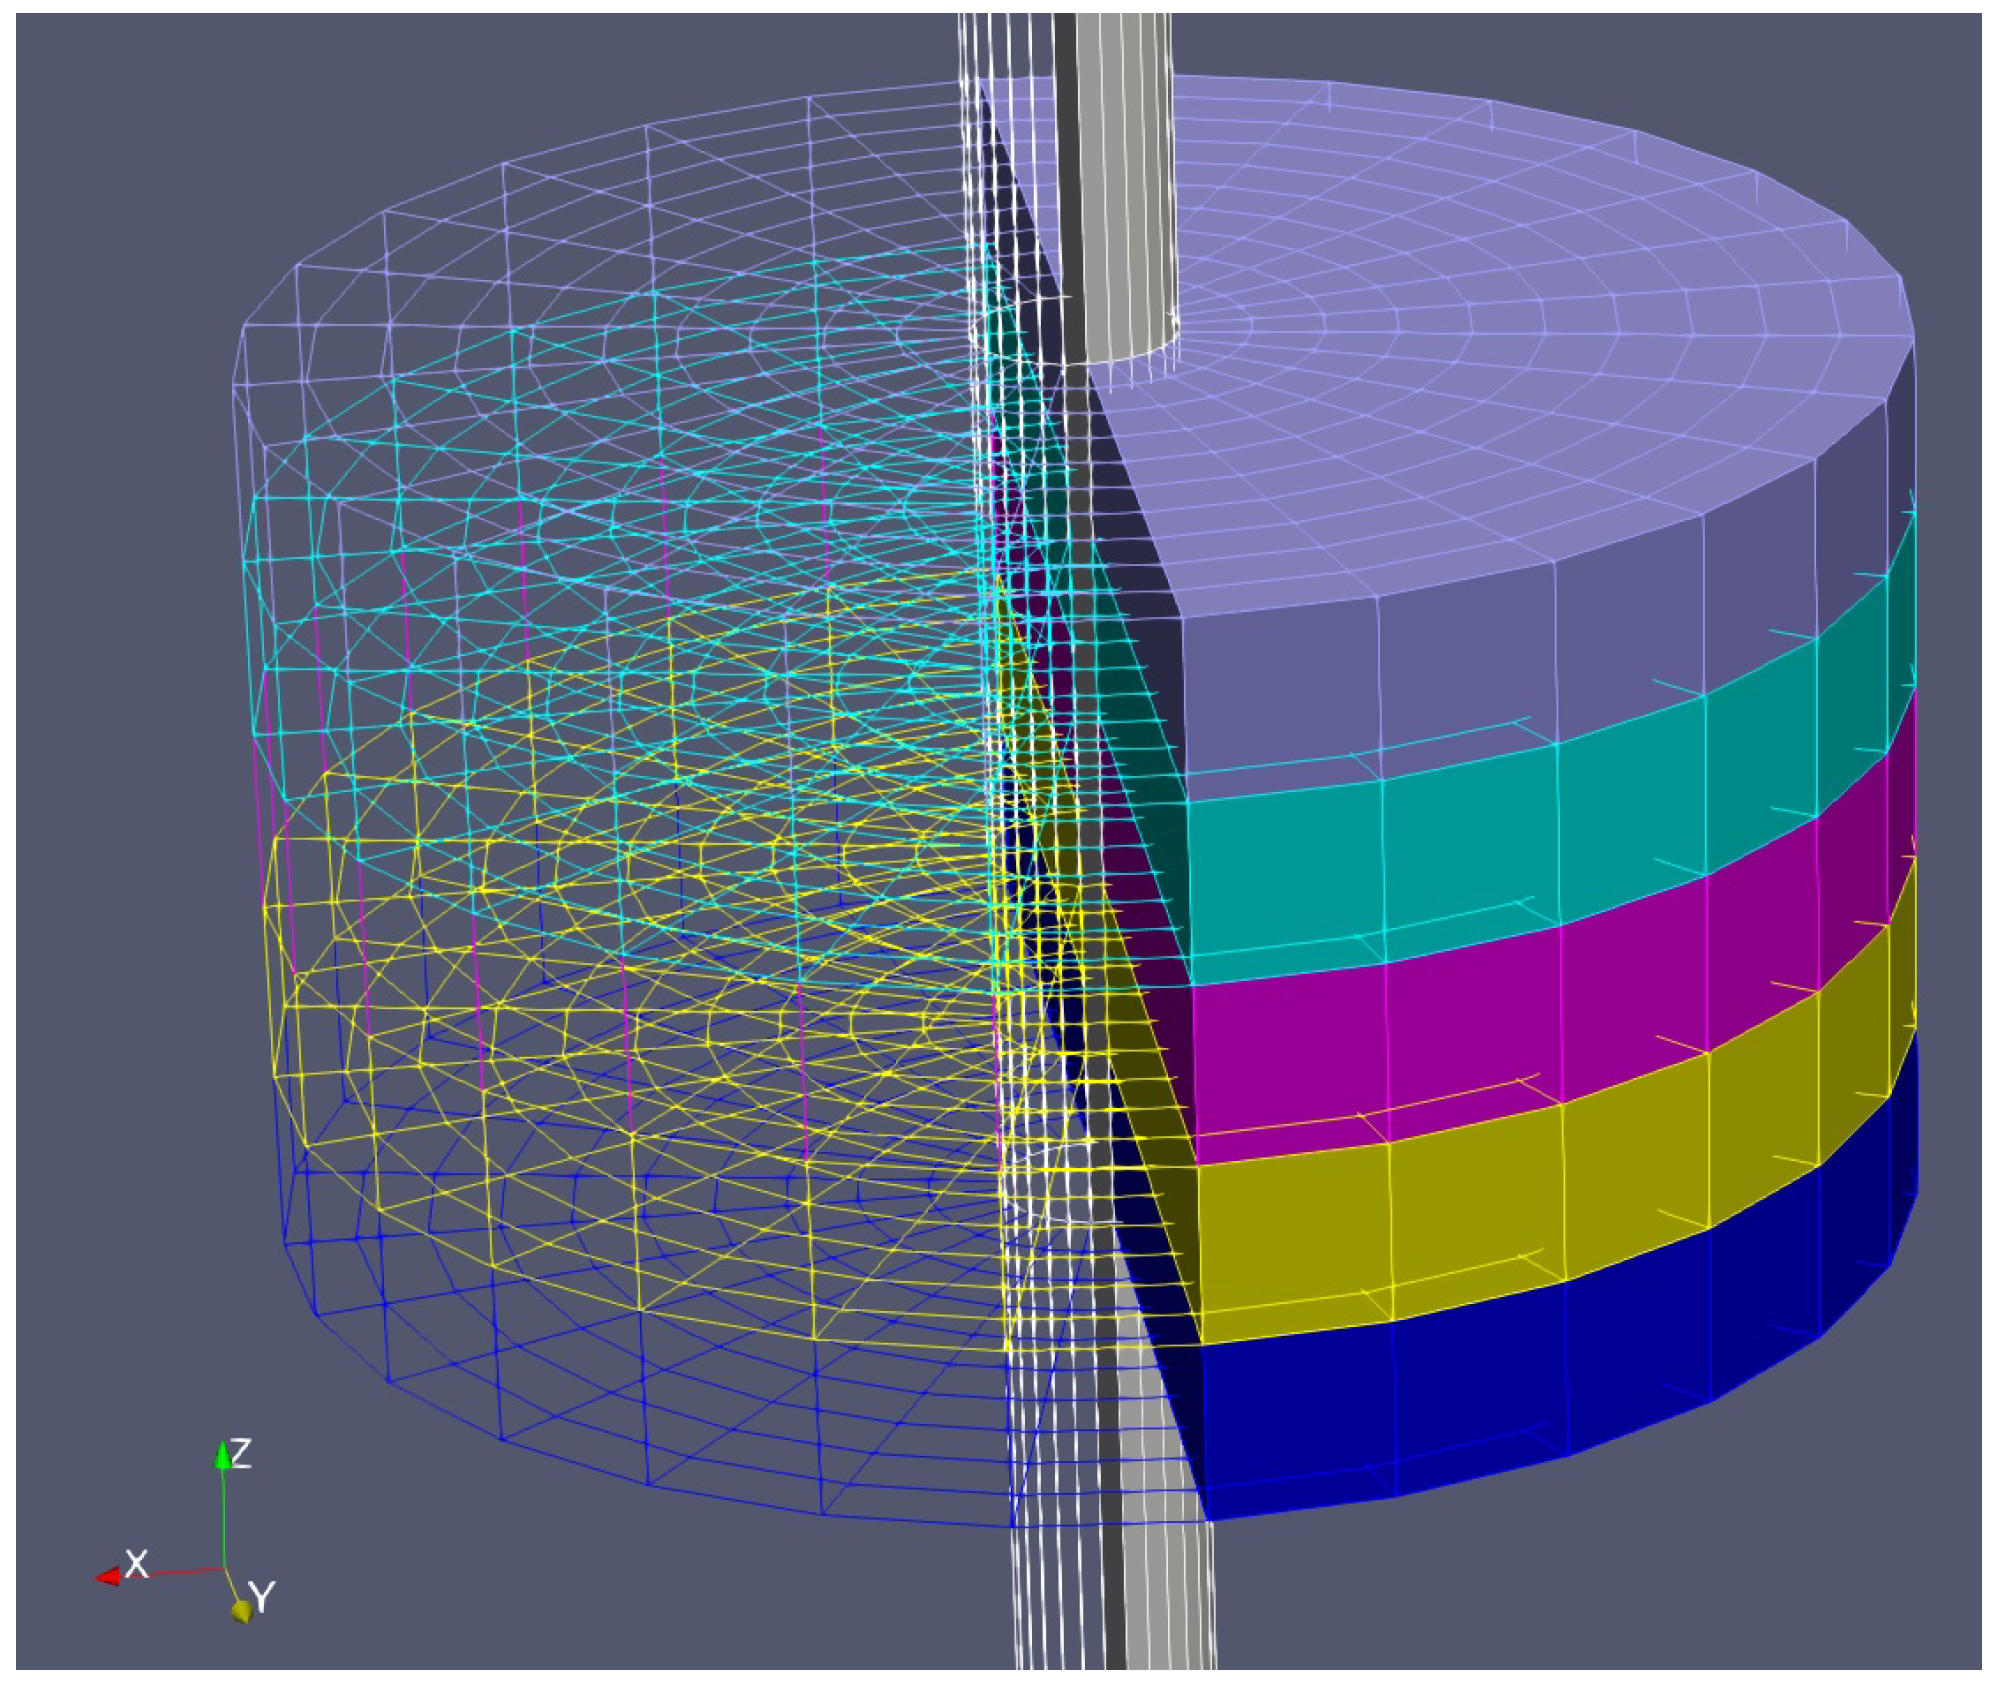
4.2. Mesh Development

A Python framework developed at INL and later assembled and packaged as Neutronics Enhanced Meshing Operations (NEMO) [36] accesses the Cubit [37] application programming interface (API) and produces both a mesh file and a consistent Serpent detector input file referred to as overlay file. This enables consistent tallying of fluxes and cross-sections. Cubit was designed to create either structured or unstructured mesh elements in both 2D and 3D. For the purposes of this work, the finite element models are in the EXODUS-II format [38]. This format is used for efficient data storage and enables problem definition, visualization and data extraction, as well as code-to-code data transfer within a single mesh file. Because of this capability, models for multiphysics reactor analysis in Griffin simulations that couple heat transfer and energy deposition with neutronics can be performed on a single mesh file. An example of the Griffin mesh prepared for the SIRIUS-CAL experiment is shown in Figure 7 and Figure 8.
The Serpent overlay file created by NEMO includes the definition of the separate homogenization regions (i.e., Serpent universes) and the flux or current tallies later used in SPH calculations. These cross-section regions are identified by the user when defining the homogenized geometry in the NEMO input. Conversely, the regions used in SPH are automatically assigned by NEMO. NEMO adds both a material and equivalence identification variable to the output mesh. These variables are then loaded by Griffin to automatically map the cross-section and SPH region identification to those provided in the Griffin data files generated by Serpent. Serpent cross-sections are converted by a Griffin utility into the ISOXML format used by Griffin. This process guarantees that the homogenization zones used in Serpent are identical to those included in the mesh.
The number of homogenized cross-section regions in the radial and axial directions was identified in past studies [33,34,35] to better capture the axial material transitions. Since the TREAT core employs HEU fuel, the effects stemming from spectral changes in the core are minimal.
One significant advantage of Griffin is the ability to solve multiphysics equations on an unstructured mesh. This enables the study of neutronic and thermal behavior, not only in the core but also within the experiment. A depiction of the mesh for the SIRIUS-CAL experiment neutronics model is shown in Figure 9 (note that the experiment neutronics mesh is much coarser than the experiment thermal-hydraulics mesh).
The FEM mesh for the homogenized geometries of the core and experiment regions was utilized by Griffin for both the neutronics and the simple adiabatic thermal model used for the core. In the coupled neutronics and thermal models of the core, the neutron transport and heat conduction equations were solved simultaneously on the same mesh to capture the thermal feedback from the fuel/graphite matrix.

4.3. SIRIUS-CAL Steady-State Calculation

Griffin steady-state calculations were executed to determine the reactivity difference between the pre-transient and transient-rod-fully-out configurations. For the critical pre-transient configuration, the compensation rods were placed in the out-of-core position, while the control/shutdown rods and transient rods were placed in their reported pre-transient positions, with the SIRIUS-CAL experiment and containment present in the experiment slot. No multiphysics calculations were executed for the two steady-state solutions, as calculations were performed at uniform temperatures of 300 K.
The Griffin model was observed to produce a significantly different reactivity insertion than the reported value based on the reported initial transient rod position and measured control rod worth curves. In previous studies [39,40], similar behavior during other TREAT transient experiments was observed, and it was suggested that this is due to the uncertainties in measuring the control rod positions, the lack of accurate information on the poison content in the control absorber, and some potential uncertainty in the kinetics parameters used by TREAT reactor engineering. These uncertainties are discussed in Section 5.
In this work, we follow the procedure recommended in [19] to adjust the initial control rod positions so as to match the experimental reactor period. For the SIRIUS-CAL simulation, the initial transient rod position (85.6 cm withdrawn) was adjusted to 87.9 cm (+2.3 cm). The criticality search function in Griffin was used to find the initial transient rod position that resulted in the desired reactivity insertion, which was obtained by solving the Inhour equation with the measured asymptotic period and the kinetic parameters obtained from Griffin. This approach is not predictive and current efforts are ongoing to remove this pre-transient calibration step from the TREAT neutronics analysis workflow.
After the initial transient rod position was determined by matching the measured asymptotic period of the SIRIUS-CAL transient, both steady-state forward and adjoint calculations were performed by using Griffin to generate the forward and adjoint fluxes as initial conditions for the Griffin transient calculations.
The NonlinearEigen solver in the MOOSE Executioner System was used for all steady-state eigenvalue calculations [41]. Two free power iterations were conducted to ensure that the initial estimation was close enough to the fundamental mode that the solution would not converge to a higher harmonic. The convergence was set to require that the L2 norm of the finite element residual be smaller than 10 12 .

4.4. Griffin Transient Calculation

The SIRIUS-CAL transient was initiated by moving the transient rods from their critical, pre-transient positions to the fully out positions, introducing 0.55 % Δ k / k . As the power increases, the core heats up and provides negative feedback, counteracting the initial reactivity insertion. This makes the transient TREAT simulation a coupled multiphysics simulation of neutronics and thermal feedback from the core’s temperature increase.
The IQS method in Griffin [42] was used to simulate the time-dependent reactor power. Using the IQS method, the time-dependent spatial flux was factored into a time-dependent amplitude function and time-dependent spatial shape function. A smaller time step size was used for amplitude, and a larger one was used for shape, under the assumption that the shape is only weakly dependent on time. Compared with directly solving the spatial kinetic equations by using a small time step size, the IQS method can improve efficiency without sacrificing the accuracy of the solution. This is because at each amplitude time step, the point kinetics equations are solved, which is computationally much cheaper than solving for the shape.
A simple adiabatic thermal model was adopted to compute the temperature feedback from the core. In the adiabatic thermal model, heat conduction in the core is neglected and power is deposited locally. For short transients (i.e., tens of seconds), this is a reasonable approximation. Thermal properties (e.g., mass density, heat conduction coefficient and heat capacity) for standard fuel blocks are provided in Table 2. Based on [43], this data should be valid in the 300–1200 K range.

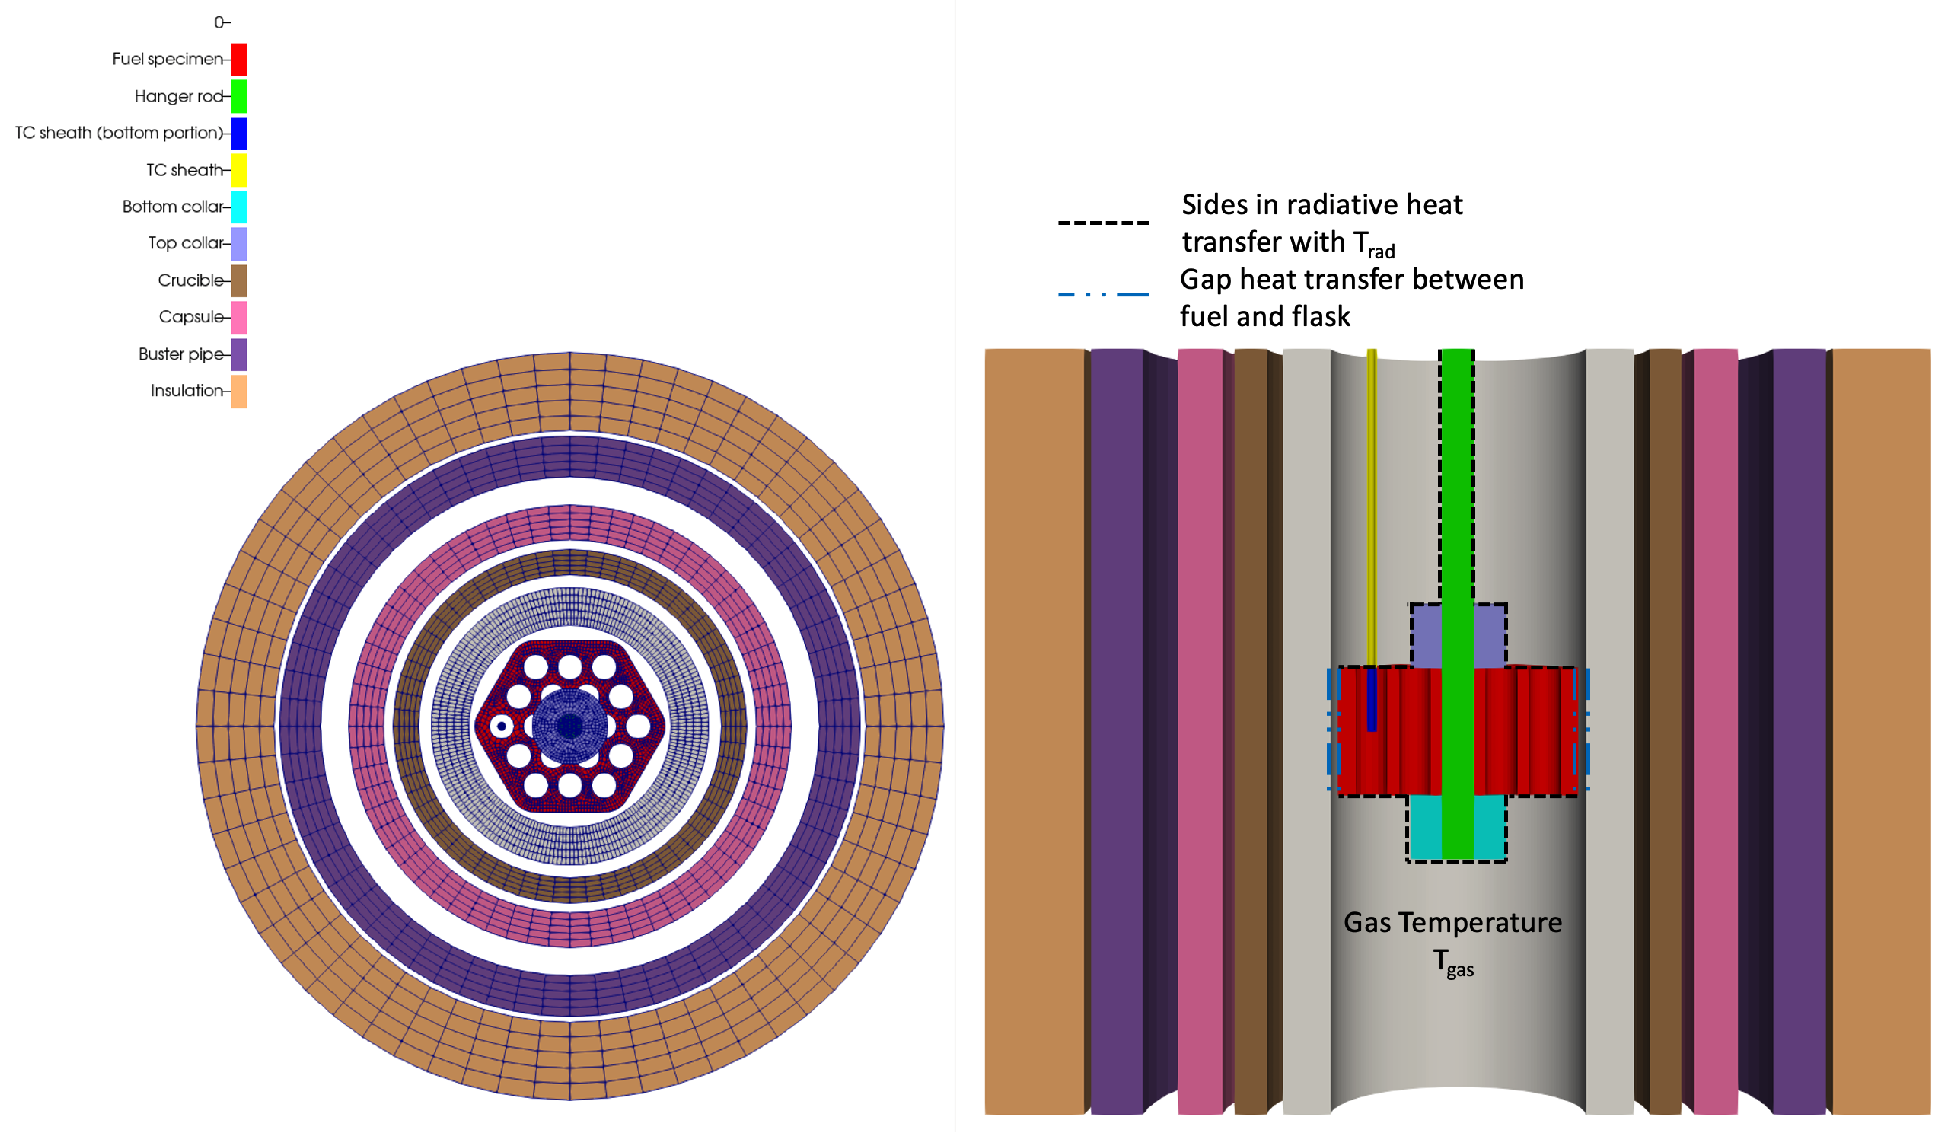
4.5. Thermal Calculation for the Specimen

The core-wide neutronics mesh is too coarse for computing detailed temperature distributions in the experiment. Therefore, a separate mesh was developed for the detailed geometry of the important experiment regions for simulating the temperature of the specimen. The problem domain for the experiment thermal model was reduced to eliminate the regions outside the radial insulation, as well as those regions above and below the axial range of the experiment flask. A geometry sensitivity study showed that including a larger radial problem domain did not noticeably affect the specimen temperature. The geometry and finite element mesh for the thermal model of the SIRIUS-CAL experiment was generated following a two-step procedure. First, a 2D mesh for the cross-sectional cut of the specimen and surrounding components was generated using Cubit. Second, the 2D mesh was extruded into a 3D mesh, followed by deletion of unused blocks and reassigning others. For this second step, the mesh system in the MOOSE framework was used. A 2D cross-section and the 3D geometry of the experiment thermal model is shown in Figure 10. The complete mesh has a total of 382,044 first-order elements. A mesh sensitivity study indicated that refining this mesh in either the radial or axial direction had a negligible effect on the resulting specimen temperature. Griffin has the capability to automatically refine the mesh by a factor of two, four, eight, etc. The mesh was doubled (all the elements halved) to test the spatial convergence.
For the SIRIUS-CAL experiment, the temperature feedback of the specimen has a negligible effect on the TREAT core neutronics, the core power simulation and the specimen temperature calculation. Therefore, we modeled the interaction between the specimen and the core as a one-way coupling in which the core response drives the specimen transient.
This one-way coupling was modeled in MOOSE using the multiapp system [44]. The multiapp system is used by the Griffin TREAT core model to create a multi-scale heat conduction model, as depicted in Figure 10. This multi-scale model was comprised of all the components within the BUSTER pipe. Information exchange between the multi-scale specimen model and the core model is facilitated by MOOSE’s multiapp transfers. It is noted that the multiapp system allows two-way coupling with Picard iterations used to obtain convergence between the primary and secondary apps. This capability is expected to be used for simulating larger experiment specimens that significantly affect the core physics.
The multi-scale specimen model was coupled to the Griffin core model by the heat generation rate density, which is driven by the computed core power. Using CF values, the reactor power was related to the heat generation rate densities in the experiment components. A CF is defined as the power generated in 1 g of specimen material per MW of power generated in the core. The CF values used in this study were taken from a steady-state MCNP [45] calculation based on the initial critical core configuration, and are provided in Table 3. Two sets of values are provided: the low density indicates CFs for the specimen at 70% theoretical density, while high density corresponds to 95% theoretical density; the two densities originate from an uncertainty in the theoretical density reported in Ref. [46]. These factors were computed at room temperature, which is not unreasonable for this experiment because of the lower temperature core, which operated between 294 and 313 K, on average. The energy depositions from both the neutron and gamma heating were accounted for in the total CF values. The power density in the experiment components, which was used as input for the heat source for the specimen thermal model, was calculated using Equation (1).
p i = P · C F i · ρ
where:
p i is the power density in composition i ( W / m 3 ),
P is the core power ( M W ),
C F i is the calibration factor for composition i ( W / ( g · M W c o r e ),
and
ρ is the density of the fuel ( g / m 3 ).
In contrast to Ref. [19], this work uses CFs computed via MCNP instead of directly computing energy deposition in the experiment from cross-sections and neutron fluxes. This is sufficiently accurate for the purpose of this work, because the neutronics are considered a driver for the prediction of the experiment conditions. The effect of all uncertainties that affect the power is treated as a lumped effect in terms of the relationship between the power deposition and the experiment.
In the thermal model, the heat conduction equation was solved on the 3D mesh of experiment components (see Figure 10), using the MOOSE heat conduction physics module [18]. Radiation and conduction heat transfer through the gas gaps between the components was modeled via the gap heat transfer system [18]. A fixed-temperature boundary condition of 294 K was applied to the outer surface of the insulation; however, this study determined that the specimen temperature was insensitive to the outer boundary condition. The specimen was surrounded by helium cover gas without forced flow of helium. However, natural circulation is not necessarily negligible. In this study, convective natural circulation was modeled using a Robin boundary condition with a constant heat transfer coefficient and fluid temperature.
The heat transfer in the cavity includes the following mechanisms:
  • Convective heat transfer of all surfaces around the gas gap with a gas temperature T gas ( t ) that depends on time, but not on space.
  • Radiative heat transfer between surfaces indicated by the black dashed line in Figure 10 with a surface of temperature T rad ( t ) that depends on time, but not on space. The radiative heat transfer coefficient is computed by assuming that all surfaces indicated in Figure 10 are surrounded by a large enclosure held at temperature T rad ( t ) .
  • Gap heat transfer model (radiation and conduction) [47] between the periphery of the fuel specimen and a portion of the flask wall. These surfaces are indicated by a blue dash-dotted line in Figure 10.
We assume that T gas ( t ) = T rad ( t ) = T BC ( t ) , where T BC ( t ) is computed as an average over the TREAT surfaces facing the experiment cavity. The concentric cylinders of flask, crucible, capsule, buster and insulation (from inside to outside) exchange heat through the gas gaps via MOOSE’s gap heat transfer model.
The origin of the densities, thermal conductivities and specific heat correlations used for the materials in the experiment item are as follows:
  • CERMET with a volume fraction of 55% UN, 45% W-Re-25:
    -
    Density: Law of mixtures from UN density 14.33 g / cm 3 [48], tungsten density 19.25 g / cm 3 [48] and rhenium density 21.02 g / cm 3 [49]. The density is reduced by the fraction of theoretical density specified in Ref. [46].
    -
    Thermal conductivity: The thermal conductivity is taken from Ref. [48] and the thermal conductivity is fitted to the data provided in Ref. [50]. The thermal conductivity of the CERMET are computed using Maxwell’s rule [51].
    -
    Specific heat: Law of mixtures (weight fraction weighted) from specific heat of UN [48], tungsten [48] and rhenium [52].
  • Stainless steel 304: All material properties are taken from Ref. [48].
  • Stainless steel 316: All material properties are taken from Ref. [53].
  • Inconel 718: All material properties are taken from Ref. [48].
  • Ti-6Al-4V: All material properties are taken from Ref. [48].
  • Microsil insulation: All material properties are taken from Ref. [54].
  • Mullite (crucible): Mullite properties depend on its porosity and porosity can vary somewhat. Thermal conductivities vary between 4 and 6 W/m K [55] and densities vary between 2.8 and 3 g / cm 3 for commercial mullite [55,56]. The specific heat is of the order of 250 J/kg K [56]. We adopt a thermal conductivity of 6 W/m K, a density of 2.8 g / cm 3 .
The thermal conductivity of the helium cover gas is computed using the correlation:
k He = 2.639 × 10 3 T 1 K 0.7085 W m - K ,
which is taken from Ref. [57].
We do not explicitly model the temperature response of the thermocouple inserted in a corner hole of the SIRIUS-CAL specimen. Instead, the average temperature of the channel surface is taken to be indicative of the thermocouple reading. A response time of 4 s for a 95% response for the type-K thermocouple was applied to the time-dependent temperature results, based on INL experience with this type of thermocouple in this temperature range.

5. Input Uncertainties

Uncertainty is the notion that the true value of a parameter is not known exactly but can be found within a certain parameter range with a certain probability. We often use uncertainty loosely in this work to refer to the width of the interval that to a high degree of likelihood contains the true parameter value. Uncertainties are present in the input parameters of the discussed SIRIUS-CAL model and therefore quantities predicted by the model are also uncertain. In contrast, a bias is the difference between the computed mean value (i.e., the best estimate) of a quantity and the true value of this quantity.
The ultimate goal of the Griffin-based TREAT modeling effort is to enable predictive simulations of TREAT experiments during transients. In addition to verification and validation (V&V), establishing the predictivity of computational models requires the quantification of prediction uncertainties resulting from uncertainties in the input parameters and modeling assumptions, referred to as uncertainty quantification (UQ). Related to the UQ is the ranking of the importance of input parameters (i.e., the impact of their uncertainties on output uncertainties) which is referred to as sensitivity analysis (SA).
SA and UQ are essential for predictive modeling for three reasons. First, UQ is an essential part of the validation exercise. The best estimate computed by the computational model can never match the measured validation data exactly, and only by establishing a confidence interval around the best estimate and the validation data is it possible to decide whether computation and reality match with a sufficient level of confidence. Second, the size of the confidence interval is essential for assessing how robust a prediction for critical parameters of an experiment is. Third, SA allows identification of the main drivers of uncertainty in the predictions directing future data gathering, model refinement and experiment characterization efforts.
The purpose of this section is to identify uncertain input parameters that significantly affect the prediction of the transient experiment temperature. We focus on the uncertainty of input parameters for the thermal experiment model. However, a short summary of uncertainties in the neutronics model is provided as well. For the UQ, the uncertainties of the neutronics simulation are are included by considering the power deposition to be uncertain. We do not determine a detailed breakdown of the contribution of the neutronics uncertainties to the prediction uncertainties.

5.1. Neutronics Uncertainties

A summary of identified effects on reactivity is provided in Table 4. These uncertainties originate from Refs. [21,58]. The uncertainties are divided into two groups. The first group constitute unknown biases to the core reactivity that do not change with control rod position, while the second group comprises biases that changes with control rod position. The latter group is much more detrimental because it cannot be quantified using a single critical TREAT core state. In addition, control rod position-dependent reactivity biases result in a misprediction of reactivity insertion when control rods move; the effect of this uncertainty on transient power is magnified by the exponential change of the power immediately following reactivity insertions (A change of reactivity of 0.01% Δ k / k (100 pcm) for a reactivity insertion of 0.5% Δ k / k , i.e., 2%, leads to a change in the reactor period of 50%). In Table 4, parameters that depend on control rod position are identified as V (variable), while those that do not are labeled with a C (constant).
Further, the existing methods to compute and process delayed neutron data during the SPH procedure introduces significant uncertainties [59]:
  • The value of the first delayed neutron precursor group in ENDF/B-VII.1 and ENDF/B-VIII.0 is 0.013336 s 1 , which is different from the measured value of 0.012456 s 1 .
  • The delayed fission neutron spectrum produced by Serpent is averaged over all delayed neutron groups.
  • The adjoint flux used for preparing kinetics parameters should not be SPH-corrected.
  • The raw data (i.e., the evaluated nuclear data) used by Serpent as well as the method Serpent uses for computing reactor physics parameters from the raw data create uncertainties for the input data of Griffin.
Based on a compilation of historical transient data, TREAT is believed to have fissioned approximately 37 g of 235U (a standard fuel assembly contains roughly 34 g of 235U [21]). This level of burnup is roughly 0.4% of the total core inventory, indicating a possible but small bias due to burnup and fission product absorption.

5.2. Experiment Thermal-Hydraulics Uncertainties

We have identified 12 uncertain parameters that we consider important and list them, along with their respective ranges, in Table 5. The ranges are considered to be upper and lower bounds for the parameter values, and the probability distribution function of the value in the range are assumed to be uniform. The uncertainties listed in Table 5 are explained in detail:
  • Cover gas and cavity temperature: The temperature at the boundary of the domain and the temperature of the cover gas are assumed to be uniform in space and equal to the temperature averaged over the surfaces of the TREAT assemblies facing the experiment. The main source of uncertainty is expected to be neglecting temperature distribution in the cover gas and the difference in TREAT and cover gas temperature. Given the relatively low temperature of the experimental peak temperature during this transient, we conservatively assume the cover gas temperature is within ± 30 K, or approximately ± 10 %.
  • CERMET thermal conductivity: The thermal conductivity of the CERMET is computed from the thermal conductivity of the components WRe25 and UN using Maxwell’s model for the thermal conductivity [51]. The uncertainties are thus made up of the uncertainties of the thermal conductivity of the components, and the uncertainty in using the Maxwell model of thermal conductivity. The range of thermal conductivity for UN is estimated to be ± 5 % about the regression [48] and the range of WRe25 thermal conductivity is estimated to be ± 10 % about the regression [50]. From Ref. [51] we estimate the range of thermal conductivities computed with different models for spheres in a matrix to be 10% for the relevant range of volume fractions. The overall thermal conductivity is computed to be ± 20 % of the nominal value.
  • CERMET specific heat: The CERMET specific heat is computed from the specific heat of the constituent materials tungsten, rhenium and UN using the law of mixture. We assume that the law of mixtures does not introduce additional uncertainty for computing specific heat. The upper and lower bounds for CERMET specific heat are computed from the range of measured data for tungsten and UN both of which are around 5% [48] about the regression. No values for rhenium are available, so we assume that rhenium introduces a similar uncertainty as W and UN. The upper and lower bounds for CERMET specific heat are therefore estimated to be 5%.
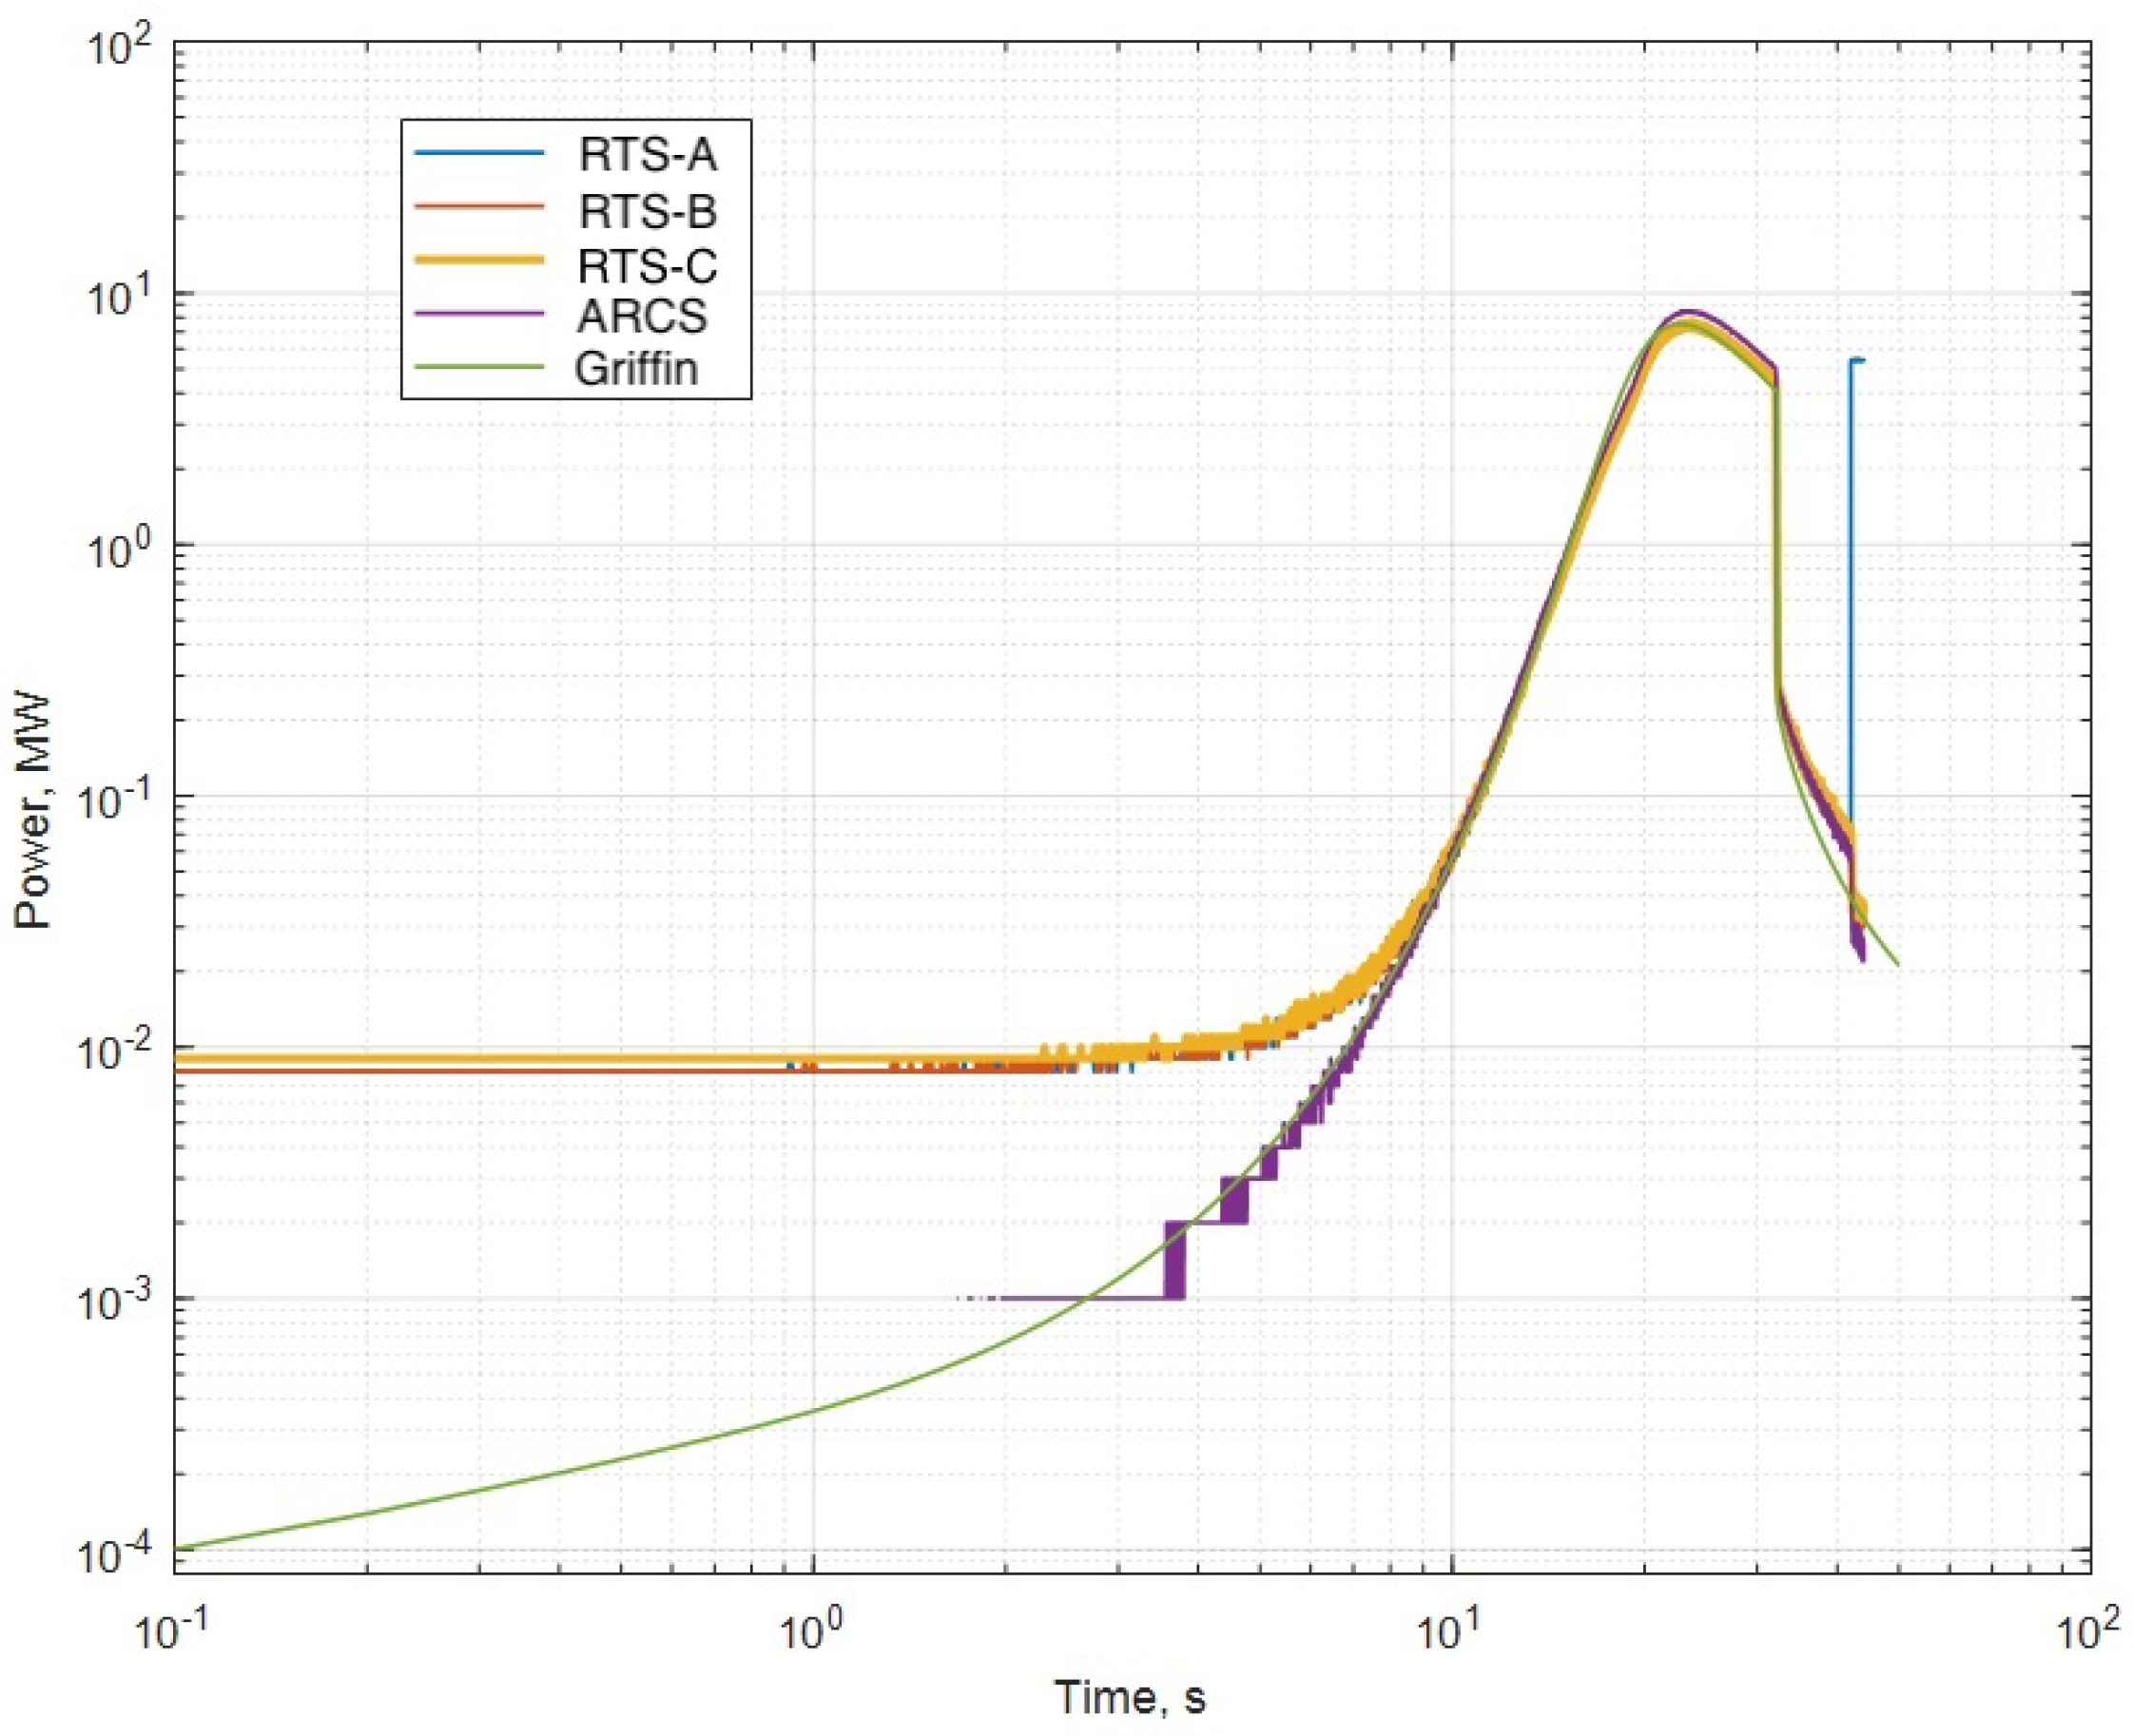
  • Specimen power: The specimen power is uncertain because (1) the TREAT reactor power is uncertain and (2) the CFs may change with specimen and TREAT power. We consider specimen power an input parameter for this study and do not break it down into more atomic sources of uncertainty. For simplicity, the specimen power is bounded between the largest and smallest power curves either computed or measured by any of the TREAT detectors.
  • Natural convection heat transfer coefficient: convection heat transfer coefficients for vertical and horizontal surfaces in the experiment cavity are computed using correlations from Ref. [60] for the “isothermal vertical and horizontal surfaces of length l”, respectively. For assessing typical uncertainties in natural heat transfer coefficients, we compare Churchill and Cho’s correlation for vertical plates [61] with the corresponding correlation in Ref. [60] between Rayleigh of 10 4 and 10 9 and find that relative differences are between 10 and 15%. We opted to use a range of ± 20 % for the heat transfer correlations because they are used for geometries that differ somewhat from a vertical plate.
  • CERMET density: The percent theoretical density of the experiment specimen is between 70% and 95% according to Ref. [46]. The change in density changes thermal properties and CF values.
  • CERMET emissivity: The emissivity of CERMET is assumed to be bounded by the emissivity of pure tungsten taken from Ref. [62] on the low end and the emissivity of pure uranium nitride at small wavelength. Note that the emissivity of uranium nitride is somewhere between 0.7 and 0.8, but for this study the bounding value of 0.8 is assumed.
  • Metal emissivities: Stainless steel emissivities are adopted from Ref. [62], the range of Inconel® emissivities are adopted from Ref. [63] and titanium grade 5 emissivities are adopted from [64]. The difference between the upper and lower bound of metal surface emissivities is mostly caused by the surface finish (polished versus oxidized).
  • Mullite emissivity: The emissivity of mullite is well characterized in Ref. [65] to within 0.05 .
  • Cover gas conductivity: The uncertainty of the cover gas thermal conductivity is driven by not knowing the temperature of the cover gas well. The upper and lower limits are obtained by evaluating the thermal conductivity correlation Equation (2) at 300 and 1000 K.
Finally, there is a bias in the measured temperature response due to the delayed response of the thermocouple relative to the specimen itself, and the fact that the thermocouple is heated by gas convection and radiation heat transfer. We have not modeled the thermocouple explicitly and have assumed a four second bias due to the delayed thermocouple response. This is consistent with computed data, but has its own associated uncertainty.

6. Simulation Results

In this section, the results of the MOOSE multiphysics models are discussed. The neutronics conditions in the core drive the experiment thermal-hydraulics conditions. Therefore, we discuss steady-state and transient neutronics solutions first. The thermal-hydraulics results of the specimen are discussed with a heavy emphasis on the uncertainty of the results.

6.1. Neutronics Solutions

As a first step, steady-state eigenvalue calculations are performed using Griffin, then compared to the corresponding configurations modeled via Serpent 2 to verify that the SPH homogenization treatment of these regions in the core provide a consistent solution. We verify that the SPH factors are properly computed by matching the eigenvalue computed by the homogenized Griffin model with the reference Serpent solution.
As discussed in Section 4.3, the transient rod worth resulting from the Griffin simulation did not produce a reactivity that matched the measured reactor period. To obtain the correct reactor period, uncertainties in control rod positioning and composition required a correction to the initial transient rod positions. Study of this issue and improvement of modeling alignment with actual rod positioning is ongoing, but is outside the scope of this article.
The reactivity insertion and asymptotic periods resulting from transient rod withdrawal from different calibrated initial rod positions are shown in Table 6. If the reported transient rod position is used, the reactivity insertion estimated from the Griffin model exceeds the reported value by around 15% and the reactor period is much smaller. The difference in predicted reactivity insertion is conjectured to result from the uncertainties reported in Section 5.1.
If the transient rod position is adjusted to match the reactivity of the experiment, the Griffin-predicted reactor period will significantly differ from the measured period. To match the reported reactivity insertion, the initial transient rod position was adjusted from 85.598 to 87.075 cm. The resulting asymptotic period was then determined to be 1.46 s, which is still significantly smaller than the measured value of 1.826 s. This is because the kinetic parameters obtained from the Griffin IQS calculation differ from the values reported by TREAT staff for deriving the reactivity insertion that corresponds to the measured period. As shown in Table 7, the total delayed neutron fraction, β e f f , and neutron mean generation time, Λ , obtained from the Griffin model are both slightly less than those used by the TREAT staff. This demonstrates why, despite the same amount of reactivity insertion, the Griffin model results in a smaller reactor period than the value reported from TREAT calculations.
Following [19], it is more important for accurate TREAT simulations to match the measured reactor period than the reactivity insertion. The measured period is to be much better quantified than control rod positions. To match the reactor period (i.e., the value actually measured by the TREAT instrumentation), the transient rod position was adjusted to 87.878 cm for the initial, pre-transient position.
It was noted that the adjustment made to the initial transient rod position to match the reactor period was about 2.3 cm—larger than the reported uncertainty of 0.762 cm (0.3 in) in the rod position measurement [39].
Figure 11 compares the measured and simulated power histories for the SIRIUS-CAL transient. The core power increases exponentially during the first ∼20 s after the transient was initiated, reaching a peak value of around 7.5 MW at 22 s, which is very close to the measured power of around 8 MW (ARCS). As shown in Figure 12, after about 16 s into the transient, the Griffin-calculated average fuel temperature first begins to noticeably increase, introducing negative reactivity feedback that, in turn, begins to compensate for the initial reactivity insertion from transient rod withdrawal. The reactor was scrammed at 32 s into the transient (with rapid insertion of the transient rods to the fully-in position), and the total power sharply dropped to around 0.2 MW, as is consistent with typical core behavior. The remaining control rods were inserted by motor-driven screw drives at about 15 cm/min to fully shut down the core. When the reactor was scrammed, the maximum and average core temperatures in the simulation reached peak values of 328 and 314 K, respectively, at 32 s into the transient. These results suggest that the Griffin model when fed the nuclear data generated using Serpent can accurately predict the power behavior and the thermal feedback phenomena using the presented analysis workflow.
The uncertainty of the reactor power trace can be estimated by comparing the spread of the power traces recorded by the different detectors and the computed Griffin power trace. Griffin and the reactor trip system (RTS) detectors agree well with a peak power of 7.5 and 7.2 MW, respectively, while the ARCS system indicates a larger peak power of 8 MW. This trend is observed over the duration of the transient. Therefore, we assume that the true power density is located between the minimum and maximum of the five power traces in Figure 11 and the nominal power trace is the average of the minimum and maximum power traces. The power traces are used as inputs for the quantification of the uncertainty of the specimen temperature using the thermal-hydraulics model.

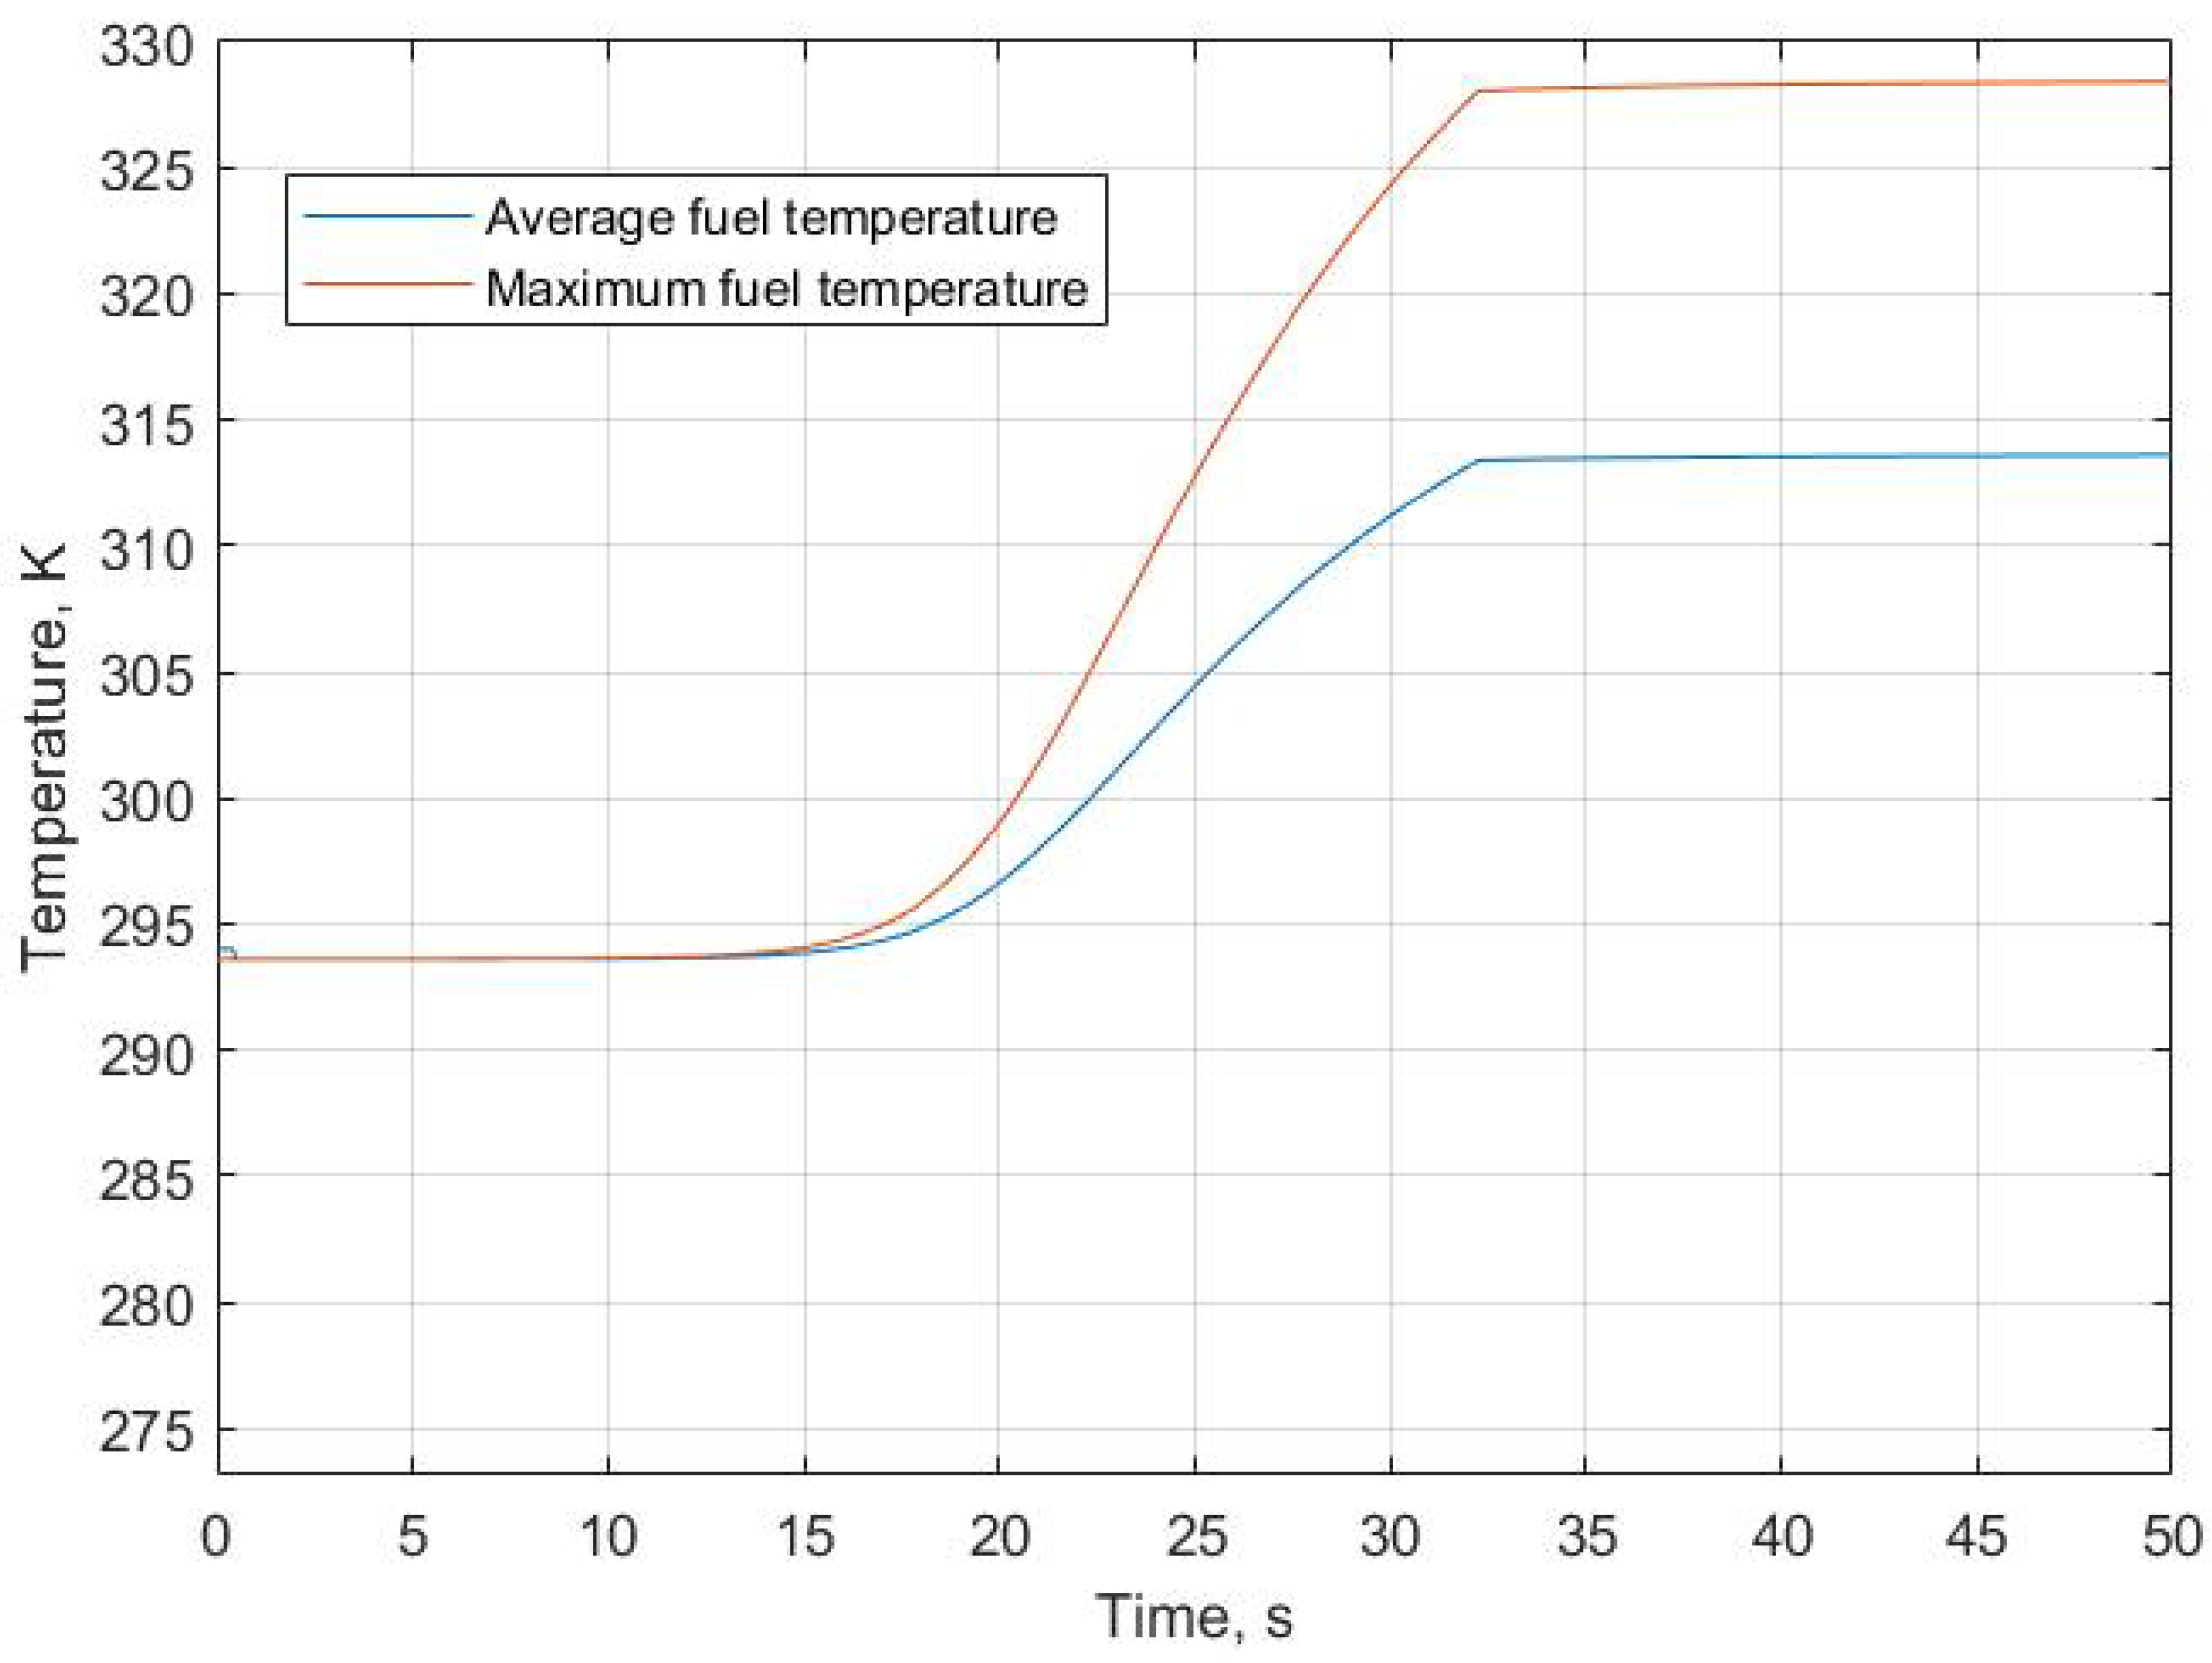
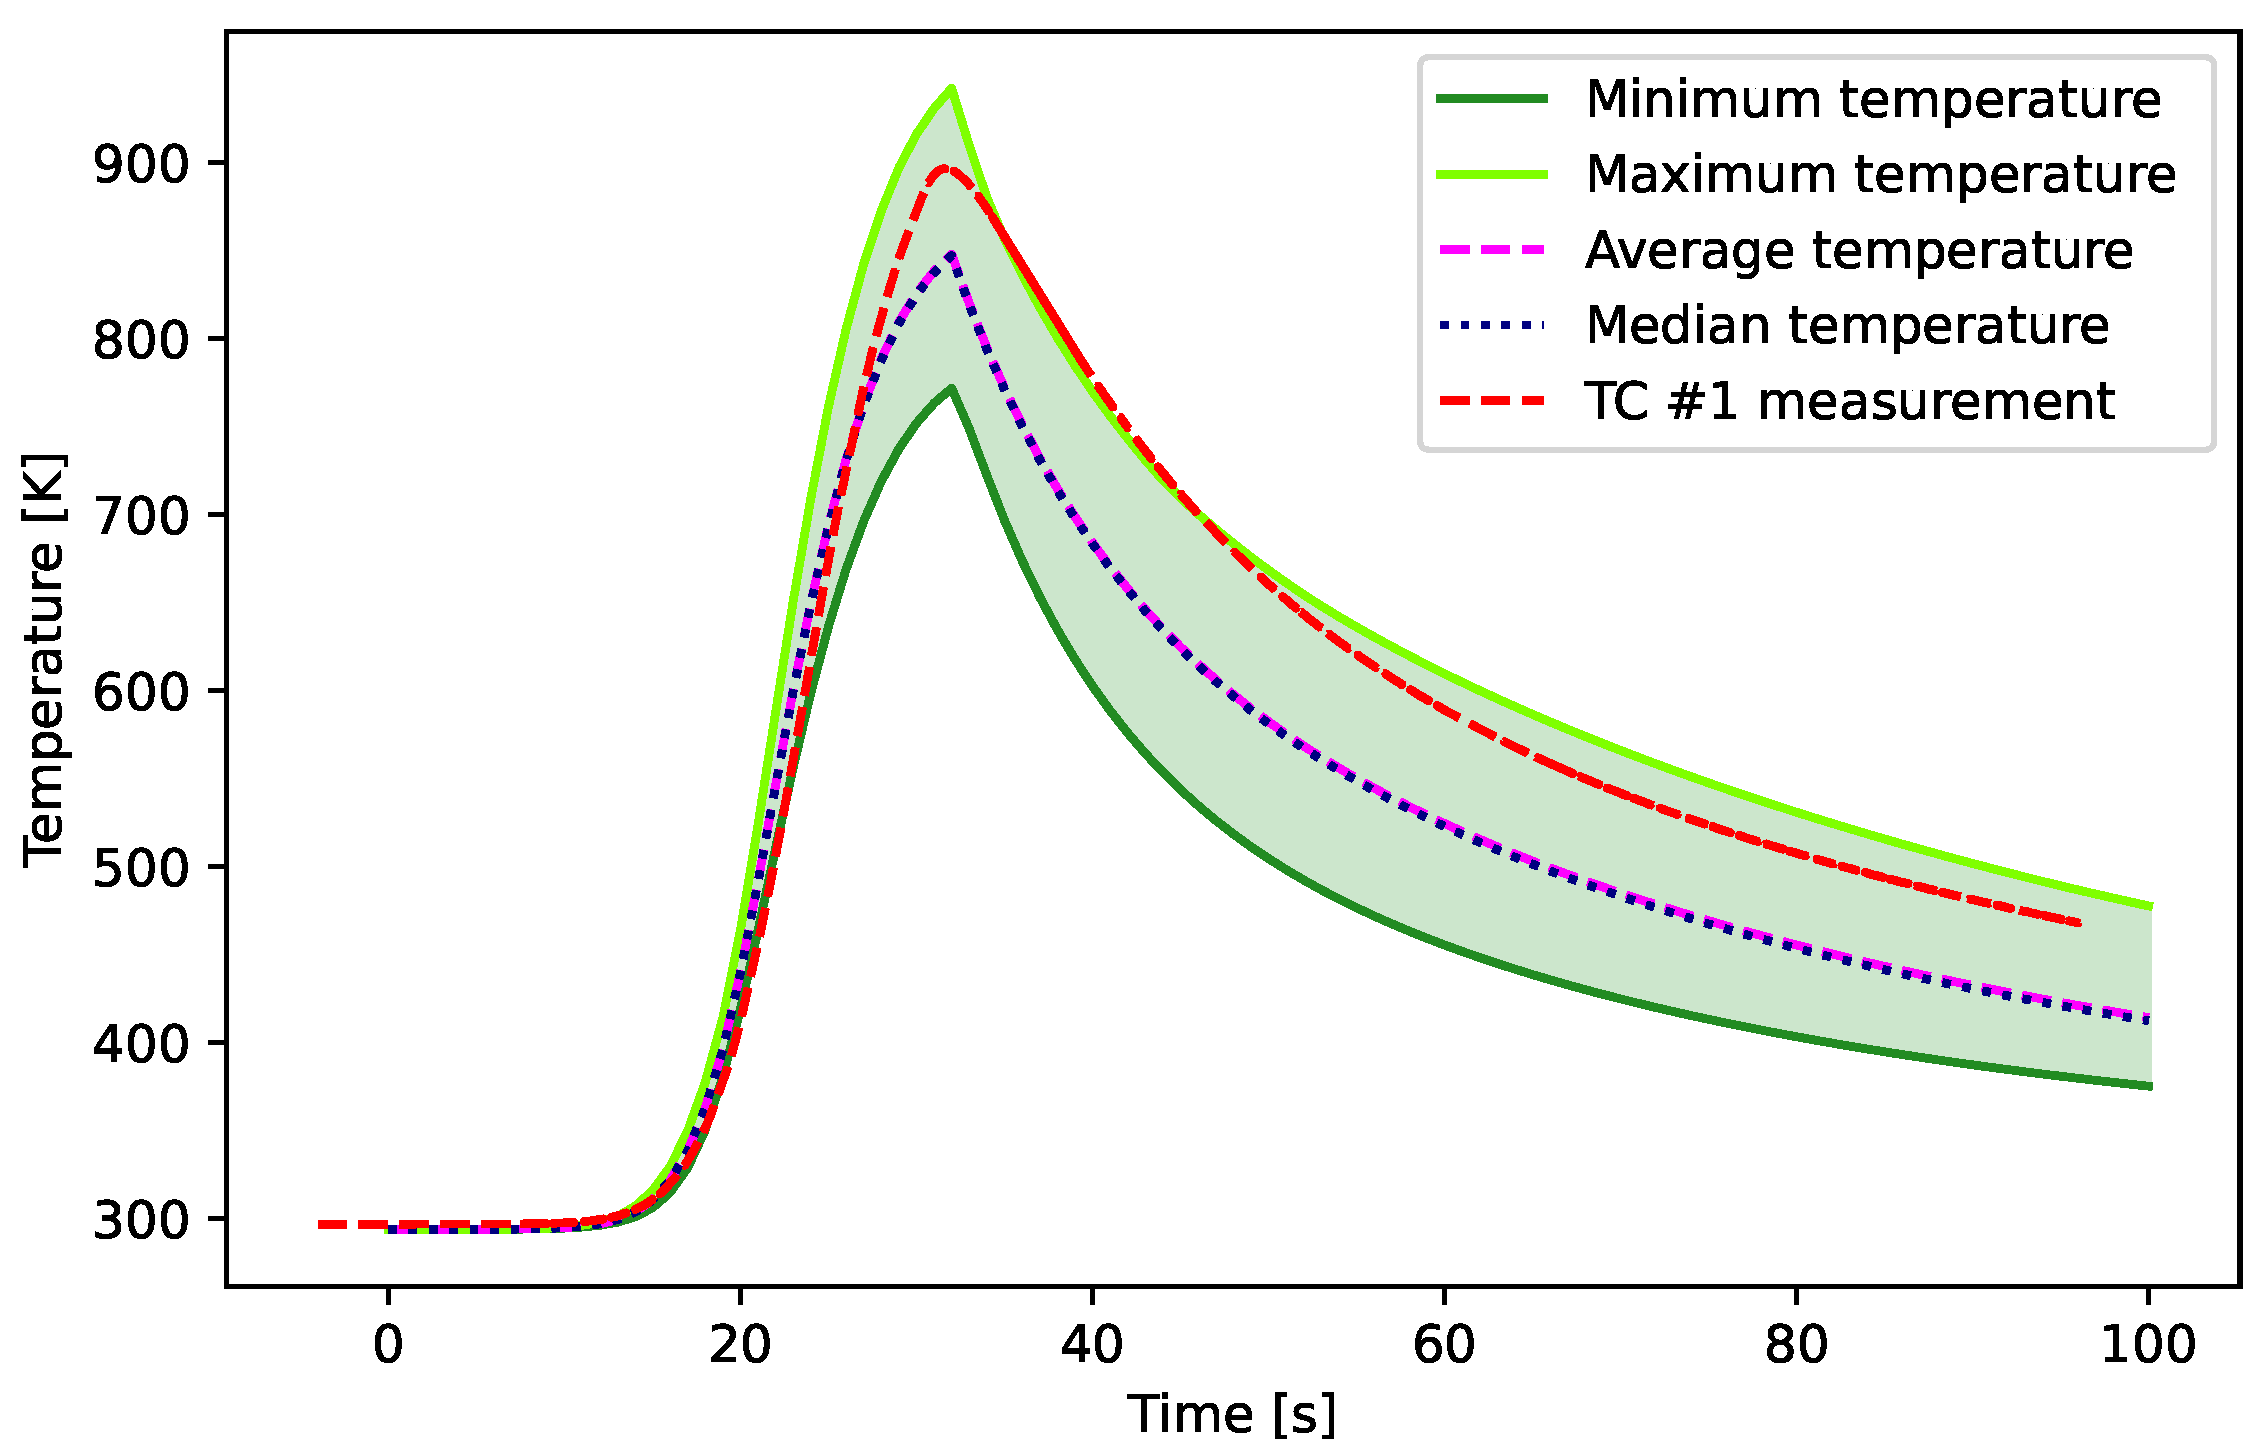
6.2. Specimen Temperature Transient

In this subsection, we explore the effect of known uncertainties present in neutronics, thermal and thermal-hydraulics conditions on the prediction of the SIRIUS-CAL specimen. As discussed earlier, 12 thermal and thermal-hydraulics uncertainties were identified that we deem most important for the evolution of the SIRIUS-CAL temperature transient, as provided in Table 5. In addition, we identified the magnitude of discrepancy between measured and predicted reactor power in Section 5. We take this discrepancy as representative of the accuracy that Griffin simulations of TREAT’s power distribution can attain.
The ultimate goal of MOOSE-based TREAT simulations is to accurately predict the evolution of relevant figures of merit for the experiment. The prediction of the reactor behavior is only important insofar as it influences the experiment. For the SIRIUS experiment series, as well as most other TREAT experiments, the experiment temperature distribution in space and time is of importance. The temperature distribution is affected by local and global conditions such as:
  • Local: Experiment power driven by reactor power (i.e., the power coupling factor), experiment thermal properties, thermal-hydraulics conditions such as heat transfer coefficients.
  • Global: Reactor power as a function of time, temperature at the outside of the containment (TREAT fans operate during a transient, drawing air from the building above the top of the reactor and blowing down through the fuel elements).
Uncertainties in any quantity directly or indirectly affecting these conditions lead to uncertainties in the prediction of experiment temperatures or other figures of merit relevant to the particular experiment.
The ultimate goal of this subsection is threefold. First, determine if the model predictions match the measured temperatures to within the uncertainties (i.e., model validation); second, identify the major drivers of uncertainties of the specimen temperature (SA/UQ); third, devise a strategy to reduce uncertainties and remove biases to achieve superior predictive modeling capabilities for TREAT experiments.
The thermal model developed for this work was described earlier in Section 4.5. Figure 10 illustrates the placement of the thermocouple within the SIRIUS-CAL specimen; it is centered in the left-most gas hole.

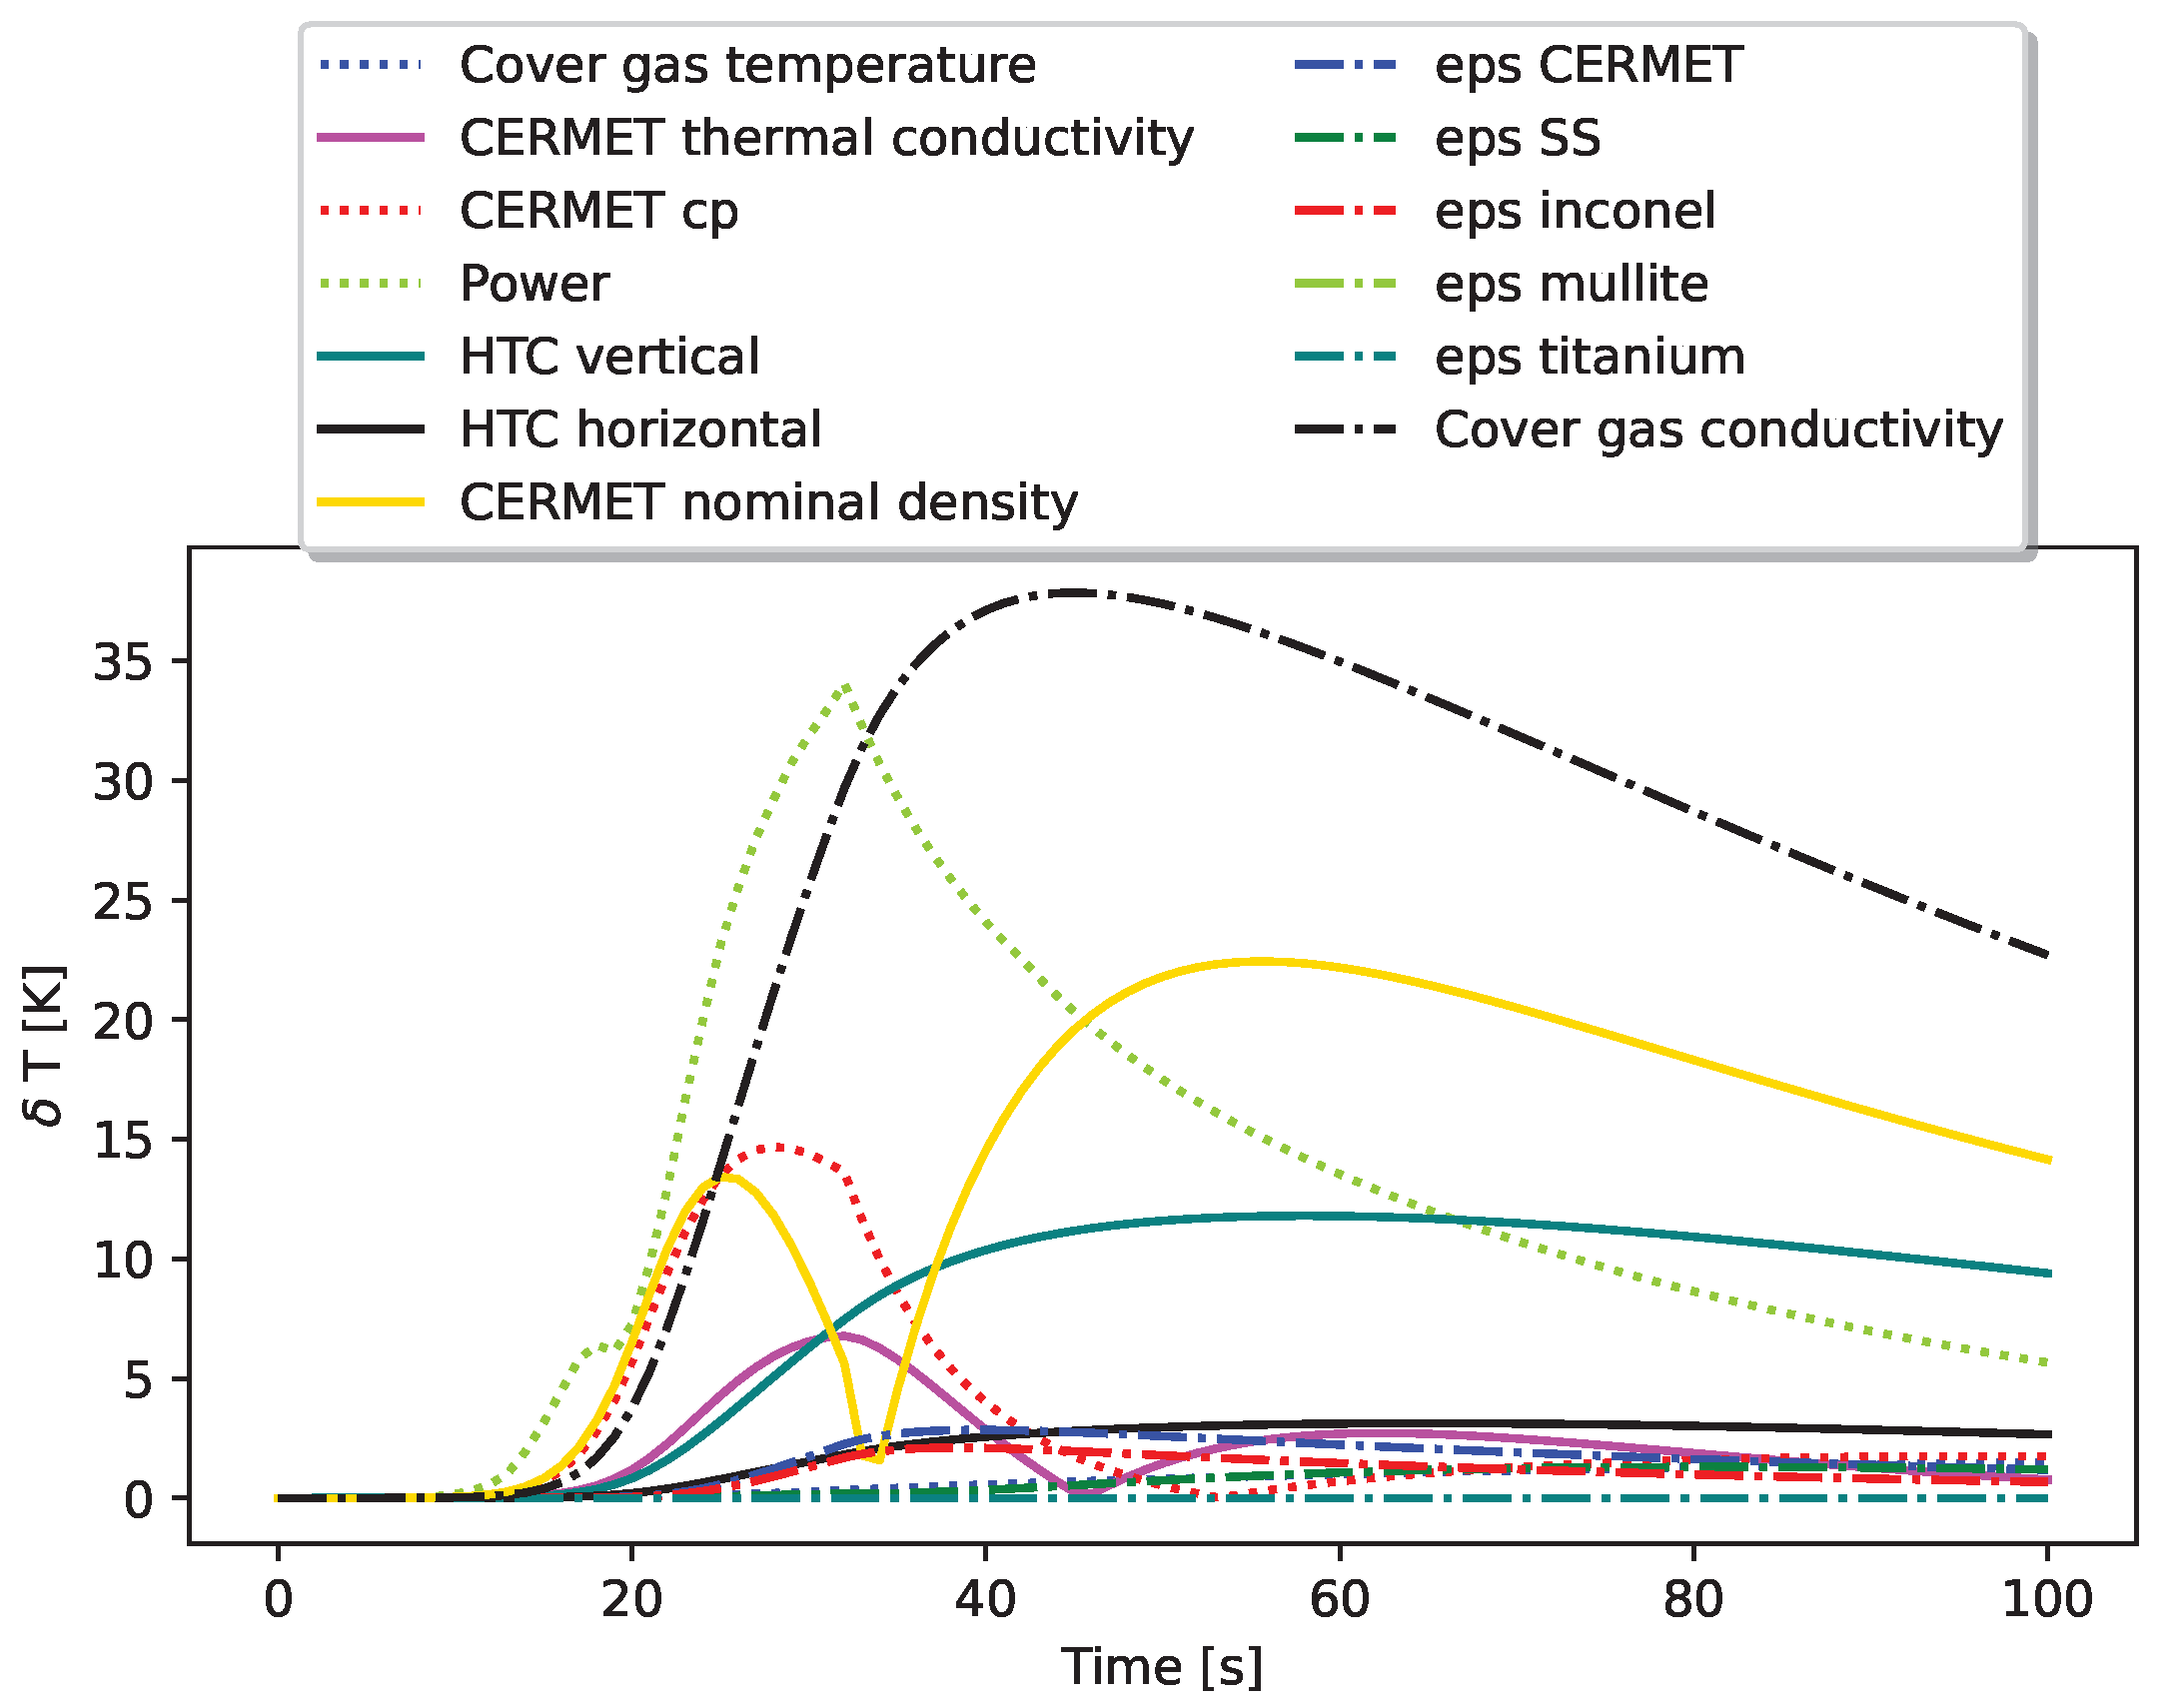
Validation and Uncertainty Quantification

We use Latin hypercube sampling (LHS) [68] with 10,000 samples to investigate the effect of the input uncertainties on the specimen temperature. We present the results of this study in Figure 13. The plot presents the envelope, median and average of the ensemble of sampled trajectories along with the measured temperature of thermocouple #1.
The measured temperature is close to or within the envelope of prediction uncertainty. It reacts slower to the initial rise in reactor power and the later peaking and reduction in reactor power. We conjecture the difference in prediction and measurement is caused by comparing the temperature at the inside of the channel with the temperature of the TC which is inserted into the channel and then shielded by a stainless-steel sheath. Because of the shielding the temperature of the TC is thermally buffered against changes in reactor power, but the channel wall temperature is not thermally buffered. The difference in thermal buffer also causes the difference in shape of the temperature curve when peak power is reached. The channel wall shows a much more abrupt change in slope at the temperature peak than the TC. The lack of an accurate TC model contributes both to uncertainty and biases in the prediction of TC measurements. This hinders the validation process for MOOSE experiment models but does not affect their accuracy for predicting specimen temperatures. Nevertheless it is recommended to include accurate TC models in the future to enable post-experiment comparison of Griffin models and experimental results.
The measured curve for TC#1 lies outside of the envelope of prediction uncertainty starting at 30 s and ending at 40 s of transient time. The measured curve being outside of the envelope of prediction uncertainty is referred to as discrepancy. Future assessment of the SIRIUS-CAL model must determine if the discrepancy of the TC#1 measurement and the Griffin predictions including their uncertainties is caused by the lack of an accurate TC model, underestimation of existing input uncertainties and biases, unrecognized sources of uncertainty, or modeling assumptions. Among these modeling assumptions are the effect of shortening the experiment model to the flask height, the simplification of the radiative heat transfer between specimen and capsule, and the limiting convective heat transfer modeling to an isothermal cover gas. The possible effect of these modeling assumptions is not reflected in the uncertainty quantification shown in Figure 13.
However, more important than resolving the discrepancy of the measured and computed results is the reduction of prediction uncertainty. At peak temperature and during the later part of the cool-down, the propagated uncertainty on the thermocouple temperature is 150 K. The uncertainty in the prediction of the thermocouple temperature must be reduced to realize the advantage of high-fidelity simulations of TREAT experiments. First, 150 K uncertainty on peak temperatures is comparable to the thermal margin of NTP fuel. In addition, fuel performance and qualification studies rely on accurately quantifying the temperatures of experiments and 150 K of uncertainty on temperature makes modeling and simulation useless for supporting such analyses. Thus, the current uncertainty might be unacceptably high for experiment design purposes. Second, if uncertainties stemming from data and modeling assumptions are of the same order or larger than anticipated errors from significantly simplified models or even hand calculations, higher-fidelity modeling becomes pointless. Finally, validation is not particularly valuable if the uncertainty bands on the best estimate solution are excessively large.
We use sensitivity analysis to identify the input uncertainties that drive the temperature uncertainty. The contribution to the overall uncertainty is quantified by:
δ T α ( t ) = T α ( t ) Δ α ,
where α are the uncertain quantities and Δ α the possible range of their values as identified in Table 5.
The larger δ T α is, the more the uncertainty of the input α affects the precision of the computed temperature. The contributions are plotted versus time in Figure 14. The contributions are discussed in detail:
  • Cover gas thermal conductivity has the largest δ T of up to 40 K. The cover gas thermal conductivity is important because the experiment is small and temperature levels are below 1000 K so that thermal conductivity through the cover gas is an important heat transfer mechanism. This uncertainty can be reduced significantly by increasing the knowledge of the cover gas temperature that drives the uncertainty in cover gas thermal conductivity. For that purpose, a thermal-hydraulics or CFD model of the cavity cover gas should be added to the SIRIUS-CAL experiment model.
  • The specimen power accounts for about 35 K of uncertainty.
  • The CERMET nominal density contributes up to 25 K to the uncertainty. This uncertainty stems entirely from lack of information from the experimenters and can be reduced by a more careful pre-experiment characterization of the specimen.
  • The CERMET specific heat contributes up to 15 K. This uncertainty can be reduced by measurements and modeling and simulation of the material properties of the CERMET such as performed in [69].
  • The heat transfer coefficient on the vertical surfaces contributes up to 12.5 K. The uncertainty of heat transfer coefficients can be reduced by improving the fidelity of the cover gas thermal-hydraulics model, using a CFD model for the cover gas region, or using CFD to inform a more accurate thermal-hydraulics model with closure relationships such as heat transfer coefficients.
  • The CERMET thermal conductivity contributes up to 7.5 K. The same comments as for the specific heat applies.
  • The cover gas temperature contributes up to 7.5 K. Note that cover gas thermal conductivity and cover gas temperature are changed independently so this sensitivity is only to the temperature of the cover gas assuming that the thermal conductivity does not change. The knowledge of the cover gas temperatures can be improved by using a better thermal-hydraulics model of the cover gas region.
  • The effects of emissivities and heat transfer coefficients on the horizontal surfaces are negligible.
The sensitivity analysis clearly points to three main reasons for the large uncertainty on the output: the specimen power, the material properties and specimen characterization, and the simplifying assumptions of the thermal-hydraulics model of the experiment. They are detailed as follows:
  • The specimen power is affected by the reactor power and the power coupling factor. In this work, we assume that the PCF does not change during the transient. Therefore, uncertainties are entirely due to the reactor power. The prediction of the reactor power with Griffin is an active field of work. The two main problems identified in Ref. [19] are the over-prediction of control rod worth by the existing Serpent model (similarly TREAT reactor operation’s MCNP models also overestimate control rod worth) and the discrepancy of neutron kinetics data in SPH corrected neutron diffusion calculations. The issue with effective kinetics data in the Serpent–Griffin–SPH data pipeline are discussed in Ref. [59].
  • Material properties and specimen characterization are outside of the realm of neutronics/ thermal/thermal-hydraulics modeling of TREAT experiments. The uncertainties from these sources are large for the SIRIUS-CAL experiment because of unusually poor characterization of the specimen density and the relative novelty of the W-Re-25 CERMET. Future experiments, even within the SIRIUS series, will have more accurate material properties available.
  • The thermal-hydraulics assumptions in the presented model lead to large uncertainties. In particular, gas temperature in the cavity and radiative transfer in the cavity (e.g., via a net radiation transfer method) would reduce the uncertainties significantly.

7. Conclusions

Advanced nuclear fuel materials’ performance and associated structure will be key to getting NTP engine concepts off the ground, both figuratively and literally. A number of material tests were performed from the late 1950s to the early 1970s under the Rover and NERVA NTP programs [9,70], and current development efforts have drawn largely from that work. However, current interests have resulted in new materials testing based on experience gleaned from earlier work, combined with modern materials performance data and testing methods. A major focus of the NASA Space Nuclear Propulsion Program lies in reviving NTP fuel fabrication techniques and design knowledge [71]. New materials are being tested at NASA’s non-nuclear NTREES facility, as well as at INL’s TREAT reactor.
This article reviewed an analysis of the first of the TREAT transient tests: a calibration experiment called SIRIUS-CAL. Predicting the transient behavior of TREAT and the performance of the experiment specimen as a result of that transient behavior is key to validating Griffin and MOOSE for the simulation of future SIRIUS experiments, as well as for application in NTP designs. As of this writing, the SIRIUS-1, SIRIUS-2a and SIRIUS-2b experiments have been completed. The design for SIRIUS-3 is complete, the experimental apparatus is assembled and the test scheduled for March 2022. Note that unlike with the SIRIUS-CAL experiment, each subsequent experiment is repeated on the order of 6–8 times for the test sample, simulating the multiple heatup/cooldown cycles experienced in real NTP engines. Griffin simulations are underway for the SIRIUS-1 and SIRIUS-2a experiments. SIRIUS-3 will be used to test a stack of 16 fuel elements. Each of these tests will be used to validate the methods described herein. With the SIRIUS-1 tests, structural analysis began to be added. Both the structural and thermal models have been completed for the SIRIUS-1 experiment, and PIE data will soon be available. In the near future, a wealth of data will become available for software validation.
The end goal is to provide validated multiphysics analysis capabilities to support NASA in designing NTP systems. However, this work is also being used internally at INL for the design of future experiments. The SIRIUS-4 experiment will use a stack of 10 CERMET fuel specimens and be the first experiment to use forced hydrogen flow through the stack. The heated hydrogen exiting the specimen stack will pass through a heat sink, then be mixed with cooler bypass hydrogen to reduce the temperatures of gases exiting the fuel stack. The SIRIUS-5 experiment will be similar in form but will use a CERCER fuel material. The stacked elements and hydrogen flow will complicate the design analysis for traditional methods; models for Griffin-based multiphysics simulations coupled with RELAP-7 are already under development in order to aid in the final design of the fuel samples, focusing primarily on stress analysis.
Griffin, which is compiled using the MOOSE framework, has proven capable of generating strongly coupled simulations with high-order spatial and temporal resolution. The current data workflow for TREAT entails a set of full-core steady-state Serpent Monte Carlo simulations to prepare base cross-sections and reference fluxes for the SPH method to preserve the reference reaction rates. The results from the base Griffin model show good agreement between the Griffin solutions and the Serpent reference calculations for the experiment with an air-filled experiment cavity. However, the reported work and ongoing analysis of the SIRIUS-1 experiment have highlighted issues with respect to control rod uncertainties. Although the SIRIUS-CAL experiment used transient rod withdrawal to initiate the transient, and the rods remained fully withdrawn until the reactor scram, SIRIUS-1 (and later transients) all use computer-driven transient rod motion to shape the core power response. Errors in regard to control rod position and composition are even more pronounced under this type of insertion. Hence, research is underway to better qualify the control rod model. The nature of such work falls outside the scope of this article, but this has demonstrated the value of this validation effort for identifying shortcomings in the modeling approach. We hope to publish the results of the SIRIUS-1 experiment simulation in the near future, thus providing a summary of transient rod modeling improvements.
Other areas remain to be investigated further. These areas include the use of SPH factors during a transient. These factors are computed for a range of temperatures and control rod state points, but are generated during a steady-state Serpent simulation. It is unclear whether delayed neutrons have any effect, though such an effect would likely be small and has thus been ignored up to this point. In addition, the use of static calibration factors may introduce some error, as these factors were shown in earlier Griffin calculations to be time-dependent, varying as a function of control rod motion early in the transient, then as a function core temperature as the reactor heats up [19].

Author Contributions

Conceptualization, T.J., S.S. and M.D.D.; methodology, S.S., T.J., C.-S.L. and J.O.; software, S.S., V.M.L. and J.O.; validation, T.J., S.S. and C.-S.L.; formal analysis, T.J., S.S., C.-S.L. and M.D.D.; investigation, T.J. and S.S.; resources, M.D.D.; writing—original draft preparation, T.J.; writing—review and editing, S.S., M.D.D. and V.M.L.; visualization, T.J., S.S. and M.D.D.; supervision, M.D.D. and S.S.; project administration, M.D.D.; funding acquisition, M.D.D. All authors have read and agreed to the published version of the manuscript.

Funding

This work was funded under U.S. Department of Energy contract no. DE-AC07-05ID14517, managed by Battelle Energy Alliance, LLC/Idaho National Laboratory for NASA’s Space Nuclear Propulsion (SNP) project in the NASA Space Technology Mission Directorate (STMD).

Data Availability Statement

The datasets generated during and/or analyzed during the current study are available from the corresponding author on reasonable request.

Acknowledgments

The authors wish to acknowledge support in obtaining TREAT data from Sam Giegel and Benjamin Chase, and to recognize the efforts of Mustafa Jaradat and Benjamin Baker in helping to identify control rod issues. We also wish to thank Frederick Gleicher, Ishita Trivedi, Nicolas Martin and Youssef Shatilla for technical review and comments and John Shaver for his technical editing of the manuscript.

Conflicts of Interest

The authors certify that they have no conflict of interest in the subject matter or materials discussed in this manuscript.

References

  1. Levack, D.J.; Horton, J.F.; Joyner, C.R.; Kokan, T.S.; Widman, F.; Guzek, B.J. Mars NTP Architecture Elements Using the Lunar Orbital Platform-Gateway. In Proceedings of the 2018 AIAA SPACE and Astronautics Forum and Exposition, Orlando, FL, USA, 17–19 September 2018. [Google Scholar] [CrossRef]
  2. DeHart, M.D.; Schunert, S.; Labouré, V.M. Nuclear Thermal Propulsion. In Nuclear Reactors; Pope, C.L., Ed.; IntechOpen: London, UK, 2022. [Google Scholar] [CrossRef]
  3. National Academies of Sciences, Engineering, and Medicine. Space Nuclear Propulsion for Human Mars Exploration; The National Academies Press: Washington, DC, USA, 2021. [Google Scholar] [CrossRef]
  4. Borowski, S.K.; McCurdy, D.R.; Packard, T.W. Nuclear Thermal Propulsion (NTP): A proven growth technology for human NEO/Mars exploration missions. In Proceedings of the 2012 IEEE Aerospace Conference, Big Sky, MT, USA, 3–10 March 2012; pp. 1–20. [Google Scholar] [CrossRef]
  5. Johnson, L.; Jones, J.; Kos, L.; Trausch, A.; Farris, R.; Woodcock, G. Benefits of Nuclear Electric Propulsion to Outer Planets Exploration. In Proceedings of the 38th AIAA/ASME/SAE/ASEE Joint Propulsion Conference & Exhibit, Indianapolis, IN, USA, 7–10 July 2002. [Google Scholar] [CrossRef]
  6. Heath, B.K.; Race, C.C. TREAT Restart Project. Nucl. Technol. 2019, 205, 1369–1377. [Google Scholar] [CrossRef]
  7. Houts, M.G.; Kim, T.; Emrich, W.J.; Hickman, R.R.; Broadway, J.W.; Gerrish, H.P.; Doughty, G.; Belvin, A.; Borowski, S.K.; Scott, J. The Nuclear Cryogenic Propulsion Stage. In Proceedings of the Nuclear and Emerging Technologies for Space (NETS) 2014, Hancock County, IN, USA, 24–26 February 2014. American Nuclear Society Topical Meeting. [Google Scholar]
  8. Gustafson, J.L. Space Nuclear Propulsion Fuel and Moderator Development Plan Conceptual Testing Reference Design. Nucl. Technol. 2021, 207, 882–884. [Google Scholar] [CrossRef]
  9. Esselman, W.H. The NERVA Nuclear Rocket Reactor Program. Westinghouse Eng. 1965, 23, 66–75. [Google Scholar]
  10. Tucker, D. CERMETS for Use in Nuclear Thermal Propulsion; IntechOpen: London, UK, 2019. [Google Scholar] [CrossRef]
  11. O’BRIEN, R.; Burns, D.E.; Woolstenhulme, N.E.; Dempsey, D.; Hill, C.M.; Hale, C. The SIRIUS-1 Nuclear Thermal Propulsion Fuels Transient Test Series in the Idaho National Laboratory TREAT Reactor. In Proceedings of the Nuclear and Emerging Technologies for Space (NETS) 2019, Richland, WA, USA, 25–28 February 2019. American Nuclear Society Topical Meeting. [Google Scholar]
  12. DeHart, M.D.; Baker, B.A.; Ortensi, J. Interpretation of energy deposition data from historical operation of the transient test facility (TREAT). Nucl. Eng. Des. 2017, 322, 504–521. [Google Scholar] [CrossRef]
  13. Ortensi, J.; Wang, Y.; Laboure, V.M.; Prince, Z.M.; Lee, C.; Jung, Y.S.; Park, H.; Shemon, E.R. Griffin Software Development Plan; Technical Report, INL/EXT-21-63185; Idaho National Laboratory: Idaho Falls, ID, USA, 30 June 2019. [Google Scholar] [CrossRef]
  14. Laboure, V.M.; Ortensi, J.; Wang, Y.; Schunert, S.; Gleicher, F.N.; DeHart, M.D.; Martineau, R.C. Multiphysics Steady-state simulation of the High Temperature Test Reactor with MAMMOTH, BISON and RELAP-7. In Proceedings of the International Conference on Mathematics Computational Methods Applied to Nuclear Science and Engineering (M&C 2019), Portland, OR, USA, 25–29 August 2019. [Google Scholar]
  15. Wang, Y.; Schunert, S.; Ortensi, J.; Laboure, V.; DeHart, M.; Prince, Z.; Gleicher, F. Rattlesnake: A MOOSE-Based Multiphysics Multischeme Radiation Transport Application. Nucl. Technol. 2021, 207, 1047–1072. [Google Scholar] [CrossRef]
  16. Shemon, E.R.; Smith, M.A.; Lee, C. PROTEUS-SN User Manual Revision 1.2; Technical Report ANL/NE-14/6; Argonne National Laboratory: Argonne, IL, USA, 2014. [Google Scholar]
  17. Lee, C.; Yang, W.S. MC2-3: Multigroup Cross Section Generation Code for Fast Reactor Analysis; Technical Report ANL/NE-11/41 (Rev. 3); Argonne National Laboratory: Argonne, IL, USA, 2018. [Google Scholar]
  18. Idaho National Laboratory. MOOSE Heat Conduction Module. Available online: https://mooseframework.inl.gov/modules/index.html (accessed on 6 May 2022).
  19. Ortensi, J.; Baker, B.A.; Johnson, M.P.; Wang, Y.; Labouré, V.M.; Schunert, S.; Gleicher, F.N.; DeHart, M.D. Validation of the Griffin application for TREAT transient modeling and simulation. Nucl. Eng. Des. 2021, 385, 111478. [Google Scholar] [CrossRef]
  20. MacFarlane, D.R.; Freund, G.A.; Boland, J.F. Hazards Summary Report on the Transient Reactor Test Facility (TREAT); Technical Report ANL-5923; Argonne National Laboratory: Argonne, IL, USA, 1958. [Google Scholar]
  21. Bess, J.D.; DeHart, M.D. Baseline Assessment of TREAT for Modeling and Analysis Needs; Technical Report INL/EXT-15-35372; Idaho National Laboratory: Idaho Falls, ID, USA, 2015. [Google Scholar]
  22. Okrent, D.; Dickerman, C.E.; Gasidlo, J.; O’Shea, D.M.; Schoeberl, D.F. The Reactor Kinetics of the Transient Reactor Test Facility (TREAT); Technical Report ANL-6174; Argonne National Laboratory: Argonne, IL, USA, 1960. [Google Scholar]
  23. Baker, B.A.; Fielding, K.D.; Hansen, J.E.; Ellsworth, T. Enhancements to the New TREAT Automatic Reactor Control System (ARCS). Nucl. Technol. 2021, 207, 1746–1752. [Google Scholar] [CrossRef]
  24. Woolstenhulme, N.E. Status Report on Development of MARCH Module Designs; Idaho National Laboratory: Idaho Falls, ID, USA, 2019. [Google Scholar] [CrossRef]
  25. Woolum, C.; Imholte, D.D.; Fleming, A.; Kamerman, D.; Tritthart, K. Fabrication and Assembly of the First Accident Tolerant Fuel Concept for TREAT Testing. In Proceedings of the Pressure Vessels and Piping Conference, Online, 19–24 July 2020; Volume 6. Materials and Fabrication. [Google Scholar] [CrossRef]
  26. Idaho National Laboratory. Calibration Transient for the Sirius Experiment (SIRIUS-CAL); Technical Report TFR-1040; Idaho National Laboratory: Idaho Falls, ID, USA, 2019. [Google Scholar]
  27. Labouré, V.; Wang, Y.; Ortensi, J.; Schunert, S.; Gleicher, F.; DeHart, M.; Martineau, R. Hybrid super homogenization and discontinuity factor method for continuous finite element diffusion. Ann. Nucl. Energy 2019, 128, 443–454. [Google Scholar] [CrossRef]
  28. Ortensi, J.; Wang, Y.; Laurier, A.; Schunert, S.; Hébert, A.; DeHart, M. A Newton Solution for the Superhomogenization Method: The PJFNK-SPH. Ann. Nucl. Energy 2018, 111, 579–594. [Google Scholar] [CrossRef]
  29. Hébert, A. Développement de la Methode SPH: Homogénéisation de Cellules dans Un réseau non Uniforme et Calcul des Paramètres de Réflecteur; Technical Report CEA-N-2209; Commissariat à l’Energie Atomique Centre d’Etudes Nucleaires de Saclay: Gif-sur-Yvette, France, 1981. [Google Scholar]
  30. Prince, Z.M.; Ragusa, J.C.; Wang, Y. Implementation of the Improved Quasi-Static Method in RATTLESNAKE/MOOSE for Time-dependent Radiation Transport Modelling. In Proceedings of the PHYSOR 2016: Unifying Theory and Experiments in the 21st Century, Sun Valley, ID, USA, 1–5 May 2016. [Google Scholar]
  31. Leppänen, J.; Pusa, M.; Viitanen, T.; Valtavirta, V.; Kaltiaisenaho, T. The Serpent Monte Carlo code: Status, development and applications in 2013. Ann. Nucl. Energy 2012, 82, 142–150. [Google Scholar] [CrossRef]
  32. Brown, D.A.; Chadwick, M.B.; Capote, R.; Kahler, A.C.; Trkov, A.; Herman, M.W.; Zhu, Y. ENDF/B-VIII.0: The 8th Major Release of the Nuclear Reaction Data Library with CIELO-project Cross Sections, New Standards and Thermal Scattering Data. Nucl. Data Sheets 2018, 148, 1–142. [Google Scholar] [CrossRef]
  33. Ortensi, J.; Alberti, A.; Wang, Y.; DeHart, M.D.; Gleicher, F.N.; Schunert, S.; Palmer, T.S. Methodologies and Requirements for the Generation of Physics Data Inputs to MAMMOTH Transient Simulations in Support of the Transient Reactor Test Facility; Technical Report INL/LTD-15-36265; Idaho National Laboratory: Idaho Falls, ID, USA, 2015. [Google Scholar]
  34. Ortensi, J.; Baker, B.; Schunert, S.; Wang, Y.; Gleicher, F.N.; DeHart, M.D. Updates to the Generation of Physics Data Inputs for MAMMOTH Simulations of the Transient Reactor Test Facility—FY2016; Technical Report INL/EXT-16-39120; Idaho National Laboratory: Idaho Falls, ID, USA, 2016. [Google Scholar]
  35. Ortensi, J.; DeHart, M.D.; Gleicher, F.N.; Wang, Y.; Schunert, S.; Alberti, A.L.; Palmer, T.S. Full Core TREAT Kinetics Demonstration Using Rattlesnake/BISON Coupling within MAMMOTH; Technical Report INL/EXT-15-36268; Idaho National Laboratory: Idaho Falls, ID, USA, 2015. [Google Scholar]
  36. Ortensi, J.; Labouré, V.; Schunert, S.; Stewart, R. Neutronics Enhanced Meshing Operations (NEMO) Users Manual Version 1.0; Technical Report INL/MIS-20-00730; Idaho National Laboratory: Idaho Falls, ID, USA, 2020. [Google Scholar]
  37. Blacker, T.D.; Owen, S.J.; Staten, M.K.; Quadros, W.R.; Hanks, B.; Clark, B.W.; Meyers, R.J.; Ernst, C.; Merkley, K.; Morris, R.; et al. CUBIT Geometry and Mesh Generation Toolkit 15.2 User Documentation; Technical Report, SAND2016-6850R; Sandia National Laboratories: Albuquerque, NM, USA, 1 May 2016. [Google Scholar]
  38. Schoof, L.A.; Yarberry, V.R. EXODUS II: A Finite Element Data Model, SAND92-2137; Technical Report; Sandia National Laboratory: Albuquerque, NM, USA, 1995. [Google Scholar]
  39. Weems, Z.; Goluoglu, S.; DeHart, M.D. Investigations of Rod Positions for Treat M8CAL Analyses. ASME J. Nucl. Radiat. Sci. 2018, 4, 031017. [Google Scholar] [CrossRef] [Green Version]
  40. Goluoglu, S.; DeHart, M.D. On the effects of pre- and post-transient rod positions for TREAT temperature-limited transient powers. Anuclear Eng. Des. 2018, 331, 97–102. [Google Scholar] [CrossRef]
  41. Idaho National Laboratory. MOOSE Executioner System. Available online: https://mooseframework.inl.gov/syntax/Executioner/index.html (accessed on 6 May 2022).
  42. Prince, Z.M.; Ragusa, J.C. Multiphysics reactor-core simulations using the improved quasi-static method. Ann. Nucl. Energy 2019, 125, 186–200. [Google Scholar] [CrossRef]
  43. Handwerk, J.; Lied, R. The Manufacture of the Graphite-Urania Fuel Matrix for TREAT; Technical Report ANL-5963; Argonne National Laboratory: Argonne, IL, USA, 1960. [Google Scholar]
  44. Gaston, D.R.; Permann, C.J.; Peterson, J.W.; Slaughter, A.E.; Andrš, D.; Wang, Y.; Short, M.P.; Perez, D.M.; Tonks, M.R.; Ortensi, J.; et al. Physics-based multiscale coupling for full core nuclear reactor simulation. Ann. Nucl. Energy 2015, 84, 45–54. [Google Scholar] [CrossRef]
  45. X-5 Monte Carlo Team. MCNP—A General Monte Carlo N-Particle Transport Code, Version 5; Technical Report; Los Alamos National Laboratory: Los Alamos, NM, USA, 2000. [Google Scholar]
  46. Gross, B.J. Physics Analysis of SIRIUS-CAL Experiment Irradiated in TREAT; Technical Report ECAR-4443; Idaho National Laboratory: Idaho Falls, ID, USA, 2019. [Google Scholar]
  47. Williamson, R.L.; Hales, J.D.; Novascone, S.R.; Tonks, M.R.; Gaston, D.R.; Permann, C.J.; Andrs, D.; Martineau, R.C. Multidimensional multiphysics simulation of nuclear fuel behavior. J. Nucl. Mater. 2012, 423, 149–163. [Google Scholar] [CrossRef]
  48. Milner, J. Space Nuclear Propulsion Material Property Handbook; Technical Report SNP-HDBK-0008; Glenn Research Center: Cleveland, OH, USA.
  49. Rhenium. Available online: https://en.wikipedia.org/wiki/Rhenium (accessed on 25 April 2020).
  50. Wang, Y.; Zhao, J. Understanding the thermal conductivity of pristine W and W-Re alloys from a physics-based model. J. Nucl. Mater. 2020, 529, 151931. [Google Scholar] [CrossRef]
  51. Toptan, A.; Jiang, W.; Hales, J.D.; Spencer, B.W.; Casagranda, A.; Novascone, S.R. FEA-aided investigation of the effective thermal conductivity in a medium with embedded spheres. Nucl. Eng. Des. 2021, 381, 111355. [Google Scholar] [CrossRef]
  52. Taylor, R.; Finch, R. The specific heats and resistivities of molybdenum, tantalum, and rhenium. J. Less Common Met. 1964, 6, 283–294. [Google Scholar] [CrossRef]
  53. Kim, C.S. Thermophysical Properties of Stainless Steels; Argonne National Laboratory: Argonne, IL, USA, 1975. [Google Scholar] [CrossRef]
  54. Microsil Data Sheet. Available online: https://www.zircarceramics.com/wp-content/uploads/2017/01/MICROSIL.pdf (accessed on 25 April 2020).
  55. Mullite—An Introduction. Available online: https://www.azom.com/article.aspx?ArticleID=925 (accessed on 25 April 2020).
  56. Mindrum Cermamics. Available online: https://www.mindrum.com/ceramics/mullite/ (accessed on 25 April 2020).
  57. Siefken, L. SCDAP/RELAP5/MOD 3.3 Code Manual; Technical Report NUREG/CR-6150; Volume 4, Rev. 2, NRC. Available online: http://citeseerx.ist.psu.edu/viewdoc/download?doi=10.1.1.409.5896&rep=rep1&type=pdf (accessed on 25 April 2020).
  58. Baker, B. Rod characterization in Serpent; unpublished.
  59. Takasugi, C.; Martin, N.; Laboure, V.; Ortensi, J.; Ivanov, K.; Avramova, M. Preservation of Kinetics Parameters Generated by Monte Carlo Calculations in Two-Step Deterministic Calculations. EPJ Nucl. Sci. Technol. 2022. accepted. [Google Scholar]
  60. Zhang, H.; Che, F.; Lin, T.; Zhao, W. 3—Thermal modeling, analysis, and design. In Modeling, Analysis, Design, and Tests for Electronics Packaging beyond Moore; Zhang, H., Che, F., Lin, T., Zhao, W., Eds.; Woodhead Publishing Series in Electronic and Optical Materials; Woodhead Publishing: Sawston, UK, 2020; pp. 59–129. [Google Scholar] [CrossRef]
  61. Churchill, S.W.; Chu, H.H. Correlating equations for laminar and turbulent free convection from a horizontal cylinder. Int. J. Heat Mass Transf. 1975, 18, 1049–1053. [Google Scholar] [CrossRef]
  62. Modest, M.F.; Mazumder, S. Radiative Heat Transfer; Academic Press: Cambridge, MA, USA, 2021. [Google Scholar]
  63. Keller, B.P.; Nelson, S.E.; Walton, K.L.; Ghosh, T.K.; Tompson, R.V.; Loyalka, S.K. Total hemispherical emissivity of Inconel 718. Nucl. Eng. Des. 2015, 287, 11–18. [Google Scholar] [CrossRef]
  64. González-Fernández, L.; Risueño, E.; Pérez-Sáez, R.; Tello, M. Infrared normal spectral emissivity of Ti–6Al–4V alloy in the 500–1150 K temperature range. J. Alloys Compd. 2012, 541, 144–149. [Google Scholar] [CrossRef]
  65. Optotherm Thermal Imaging. Optotherm Support, Emissivity in the Infrared. 2018. Available online: https://www.optotherm.com/emiss-table.htm (accessed on 6 May 2022).
  66. Carvajal Nunez, U.; Prieur, D.; Bohler, R.; Manara, D. Melting point determination of uranium nitride and uranium plutonium nitride: A laser heating study. J. Nucl. Mater. 2014, 449, 1–8. [Google Scholar] [CrossRef]
  67. Geelhood, K.J.; Luscher, W.G.; Senor, D.J.; Cunningham, M.E.; Lanning, D.D.; Adkins, H.E. Predictive Bias and Sensitivity in NRC Fuel Performance Codes; Technical Report NUREG/CR-7001; Pacific Northwest National Laboratory: Richland, WA, USA, 2009. [Google Scholar]
  68. Huntington, D.; Lyrintzis, C. Improvements to and limitations of Latin hypercube sampling. Probabilistic Eng. Mech. 1998, 13, 245–253. [Google Scholar] [CrossRef]
  69. Sessim, M.; Tonks, M.R. Multiscale simulations of thermal transport in W-UO2 CERMET Fuel for nuclear thermal propulsion. Nucl. Technol. 2021, 207, 1004–1014. [Google Scholar] [CrossRef]
  70. Spence, R.W. The Rover Nuclear Rocket Program. Science 1968, 160, 953–959. [Google Scholar] [CrossRef]
  71. Stewart, M.E. A Historical Review of Cermet Fuel Development and the Engine Performance Implications. In Proceedings of the Nuclear and Emerging Technologies for Space (NETS) 2015, Albuquerque, NM, USA, 23–26 February 2015. American Nuclear Society Topical Meeting. [Google Scholar]
Figure 1. Top view of the TREAT core, permanent reflector and biological shielding [21].
Energies 15 06181 g001
Figure 2. Cutaway illustration of the TREAT core, reflectors and biological shielding, showing the numerous penetrations into the core interior [21].
Energies 15 06181 g002
Figure 3. SIRIUS-CAL core configuration, showing control rod locations.
Energies 15 06181 g003
Figure 4. Illustration of SIRIUS-CAL within the MARCH system.
Energies 15 06181 g004
Figure 5. Isometric view of the SIRIUS-CAL fuel specimen.
Energies 15 06181 g005
Figure 6. Serpent plots depicting SIRIUS-CAL within the MARCH system.
Energies 15 06181 g006
Figure 7. X–Y view of the 19-by-19 TREAT array mesh with the hodoscope hole, with the SIRIUS-CAL experiment located in the center.
Energies 15 06181 g007
Figure 8. Three-dimensional view of the mesh, showing the experimental position, control rod fuel elements and reflector for the SIRIUS-CAL experiment.
Energies 15 06181 g008
Figure 9. Mesh of the SIRIUS-CAL specimen.
Energies 15 06181 g009
Figure 10. Geometry and mesh of the SIRIUS-CAL specimen and surrounding components for the thermal model.
Energies 15 06181 g010
Figure 11. Log-log plot of the simulated and measured core power.
Energies 15 06181 g011
Figure 12. Maximum and average time-dependent fuel temperatures calculated by Griffin during the SIRIUS-CAL transient.
Energies 15 06181 g012
Figure 13. Results of the uncertainty quantification study for the temperature evolution of the fuel SIRIUS-CAL fuel specimen. The envelope of computed temperature trajectories is colored in green and the average and median temperature trajectories are presented. The temperature response of thermocouple #1 is shown in red.
Energies 15 06181 g013
Figure 14. Contribution of the different uncertainties in input parameters to the uncertainty of the temperature prediction.
Energies 15 06181 g014
Table 1. Ten-group structure used for Griffin calculations.
GroupUpper Energy Bound (eV)GroupUpper Energy Bound (eV)
14.00000 × 10766.25000 × 10−1
21.15620 × 10672.09610 × 10−1
33.48110 × 10387.64970 × 10−2
41.32700 × 10294.73020 × 10−2
58.10003 × 100102.00100 × 10−2
Table 2. Thermal properties of standard fuel blocks in the TREAT (300 K to 1200 K) core [43].
Thermal PropertyUnitValue
Mass densityg/cm31.53
Heat
conduction
coefficient
W/cm-K 7.366 × 10 19 T 6 4.223 × 10 15 T 5
+ 9.826 × 10 12 T 4 1.182 × 10 8 T 3
+ 7.754 × 10 6 T 2 2.7 × 10 3 T + 0.607
Table 3. Calibration factors for SIRIUS-CAL experiment components [46].
ComponentCF Total (Low Density)CF Total (High Density)
Fuel specimen1.84 × 1001.61 × 100
Hanger rod2.60 × 10 2 2.75 × 10 2
Bottom collar2.92 × 10 2 2.92 × 10 2
Top collar2.51 × 10 2 3.03 × 10 2
Flask3.04 × 10 2 3.13 × 10 2
Crucible2.52 × 10 2 2.40 × 10 2
Capsule2.79 × 10 2 2.78 × 10 2
BUSTER pipe2.52 × 10 2 2.51 × 10 2
Insulation1.94 × 10−31.95 × 10⁻³
Table 4. Uncertain parameters of the TREAT neutronics model.
UncertaintyReactivity Effect (pcm)Control Rod Position
Core boron6–7.6 ppm1200C
Core height0.3172 cm150C
CR B 4 C density1.4–1.6 g / cm 3 100V
Zr-Steel composition-140V
C/S rods offset1.27 cm200V
Transient rods offset0.762 cm150V
Table 5. Uncertain parameters of the SIRIUS-CAL experiment thermal-hydraulics model.
ParameterVariationReference
Cover gas and ± 10 % T B C ( t ) see text
cavity temperature
CERMET thermal conduct ± 20 % nominalsee text
CERMET specific heat ± 5 % nominalsee text
Specimen powersee textsee text
Natural convection heat ± 20 %see text
transfer coefficient
CERMET density70–95%[46]
theoretical density
CERMET emissivity0.4–0.8Low value W-Re from [62]
High value is U N
at small wavelength [66]
SS316 & 304 emissivity0.26–0.66[62]
Inconel® 718 emissivity0.2–0.53[63]
Titanium grade 5 emissivity0.3–0.47[64]
Mullite emissivity0.8–0.85[65]
Cover gas conductivity0.15–0.35 W/mK[67]
Table 6. Adjustment of initial transient rod positions to match the measured reactivity insertion and reactor period for the SIRIUS-CAL transient.
Transient Rod
Position, cm
Reactivity Insertion,
% Δ k/k
Asymptotic
Period, s
Measurement85.5980.551.826
Griffin, without adjustment85.5980.630.892
Griffin, reactivity match87.0750.551.460
Griffin, period match87.8780.511.826
Table 7. Comparison of the reported and simulated kinetic parameters for TREAT.
QuantityReportedGriffinRelative Difference
β e f f , total7.178 × 10−36.932 × 10⁻³−3.43%
Λ , s9.000 × 10−48.928 × 10⁻⁴−0.80%
Publisher’s Note: MDPI stays neutral with regard to jurisdictional claims in published maps and institutional affiliations.

