Article

A Concept of Risk Prioritization in FMEA of Fluid Power Components

by
Joanna Fabis-Domagala
and
Mariusz Domagala
*,†
Faculty of Mechanical Engineering, Cracow University of Technology, Al. Jana Pawla II 37, 31-864 Cracow, Poland
*
Author to whom correspondence should be addressed.
These authors contributed equally to this work.
Energies 2022, 15(17), 6180; https://doi.org/10.3390/en15176180
Submission received: 28 July 2022 / Revised: 17 August 2022 / Accepted: 20 August 2022 / Published: 25 August 2022
(This article belongs to the Special Issue Application and Analysis in Fluid Power Systems)

Abstract

:
FMEA is a widely used tool for decades and is also used as an industrial standard. However, there are two main drawbacks of this analysis that have been specified from the beginning. The first one is risk prioritization, which is expressed by a risk priority number (RPN). The RPN is a product of three factors with equal weight: severity (S), occurrence (O), and detection (D), which may produce equal risk priority for different combinations of S, O, and D. The second is the uncertainties caused by converting linguistic terms into quantitative data. The essential data used in the FMEA strongly depend on subjective experts’ opinions, knowledge, and experience. For decades, various attempts of overcoming these weaknesses have been made, not only by academics but also by industry. The Automotive Industry Action Group (AIAG) and Verband der Automobilindustrie (VDA) have created an FMEA handbook that defines action priority (AP) depending on the combination of severity, occurrence, and detection numbers. This study presents an alternative to risk prioritization in FMEA based on failures of the tasks which analyzed systems perform. The fundamental factors S, O, and D have been redefined in a way to minimize uncertainties. The proposed method has been implemented in the flow control valve and can be easily applied in mechanical engineering applications.

1. Introduction

Fluid power systems are not the latest achievement in engineering but are still widely used in industrial drive systems. In some cases, they cannot be replaced by other systems due to their unique features that are unachievable by other systems. Wide application, mainly in the highly demanding applications in which safety has the highest priority, requires improving reliability. Failures of fluid power components have a complex nature due to the interaction between high-pressure fluid with solid and chemical agent contaminants and structural parts. The mentioned reasons and the relative elements’ motion make the fluid power component’s likelihood of failure high. The research on failures and reliability of fluid power systems or their components is made with the use of various tools and methods. Ref. [1] presents work on monitoring and modeling gradual failure on a typical fluid power system. Y. Lee et al. [2] have investigated a failure of the hydraulic system which led to a fire on the wind turbine. Refs. [3,4,5] deal with the failure of hydraulic pumps. Research on failures, their analysis, and their influence on system operation are also conducted for fluid power components [6,7,8]. Watton J. [9] has prepared a complete compendium of analysis of fluid power system failures, while [10] was focused on the reliability of mechanical parts, including the fluid power system’s components, and led to the base failure rate.
The reliability of fluid power components can be increased by any means, including failure modes and effects analysis (FMEA) [11,12], fault tree analysis (FTA) [13], root cause analysis (RCA) [14], and their extensions or modifications. FMEA is one of the most commonly used tools for improving system quality; however, the risk assessment has been criticized [15] and has been found as a method weakness. The traditional FMEA uses a risk priority number (RPN), which is a product of severity (S), occurrence (O), and detection (D). The equal weight of those factors may give the same results for a different combination and can be very confused regarding safety. Although the traditional FMEA was formally defined in the industrial standards in the early 1960s [16], later [17] the industry also noticed the weakness in the risk evaluation. The 2008 FMEA handbook [18] says that the RPN should no longer be recommended practice to define the need for action. Additionally, it says that for failure modes with severity numbers 9 or 10, the risk must be adequately addressed. The latest release [19] introduced the action priority (AP) rating table in which the AP depends on a combination of S, O, and D, where the severity plays the dominant role. Table 1 shows AP classification table. The failure modes are classified into three categories of AP: high risk (H), medium risk (M), and low risk (L) for design or process FMEA.
It seems to be a step forward from the previous release because it removes the subjectiveness of risk assessment. However, even for the highest values of severity (S 9–10), the risk is defined as medium (M) for detection (D 5–6) and occurrence (O 2–3) or low (L) for detection (D 1–3) and occurrence (O 1-3).
Other drawbacks are the conversion of linguistic terms into quantitative data and uncertainties related to subjective opinions, experience, and knowledge of experts evaluating systems.
Different methods and tools are used to overcome the weaknesses mentioned earlier. The traditional risk assessment can be extended with additional factors [20] or relevant weights [21]. Another approach is implementing other perspectives on the risk, such as the customer’s [22] or maintenance [23] perspective.
There are numerous methods that are used to minimize the uncertainties of the FMEA process. The most common approaches are the grey theory set [24], linguistic theory [25], fuzzy sets [26], and reasoning theory [27].
Liu et al. [28], in [28], have prepared a complex and methodical literature review of methods and tools currently used in the FMEA in both risk evaluation and elimination of uncertainties. The recent studies on overcoming traditional FMEA’s drawbacks focus on implementing new methods or combining those mentioned earlier. Ref. [29] presents an approach of FMEA in which failure modes are classified based on the combination of risk factors in pairs: S and O, S and D, and O and D. The risk factors pair results were analyzed by using grey relation analysis. Yu et al. [30] have implemented the cloud model theory to minimize the linguistic uncertainties and have used the VIKOR model to determine the risk priority. The authors in [31] have modified the FMEA framework for IT according to the recommendation from the relevant literature review. Ref. [32] has utilized the cloud model to improve the FMEA. A three-stage fuzzy risk assessment based on FMEA has been proposed by Yelda et al. [33]. In ref. [34] the authors have proposed an approach in which the FMEA method has been modified by integrating the fuzzy rule base (FRB) and grey relations theory (GRT) to overcome the traditional FMEA methods’ drawbacks. The uncertainty dealt with a different knowledge background of experts has been presented in [35], where prospect theory has been implemented. Another approach to converting linguistic terms into quantitative data is in [36]. The fuzzy numbers and traditional measurement of alternatives and ranking according to compromise solution (MARCOS) methods have been used. Meanwhile, Shi et al. [37] have proposed integrating hesitant linguistic preference relations (HLPRs) and an extended dynamic consensus model in FMEA. Another approach to the modification of FMEA is taking into consideration influences of failure modes and the attenuation effect of such influences in the system [38].
The drawbacks of FMEA still draw the attention of scholars and remain unsolved.
Despite the rich assortment of implemented methods and tools, the risk assessment in FMEA is still problematic. Approaches available in the literature are excessively complicated or too computationally expensive to be able to be used in the industrial standard. The recent practical implementation of FMEA by AIAG and VDA is helpful in removing subjective decisions in risk assessment. However, the implemented risk ranking may lead to misvalued failure modes in the aspect of safety. The uncertainty linked to the subjectiveness of experts’ knowledge and background is still high. Our main motivation was to modify FMEA in a way to be similar to traditional analysis without using complex tools and methods and concurrently minimize typical uncertainties. The main idea of our approach is the assumption that any system is created to perform the intended task(s) and failures that can occur may disorganize that process. For that reason, we categorize failures that may occur for individual components as those that stop the system from performing a system task and those that still allow the main task to be completed but with major or minor malfunctions. We propose assessing the system’s risk based on the combination of failures and related components in the aspect of the ability to perform the intended task(s). Once the failures for related components are categorized, they are prioritized by the product of occurrence (O) and detection (D) factors. In the proposed approach, the occurrence (O) has been defined as a function of subfactors that determine the likelihood of failure occurrences such as the manufacturing process, duty time, and functions performed by individual components. The detection (D) remains the same as in traditional FMEA. The presented approach is an extension of our previous work [39], in which a similar approach has been proposed. The novelty of this approach is the risk categorization and the method which allows for evaluating the occurrence (O) factor. In contrast to our previous study, in which we used a base failure rate to evaluate the occurrence, in this approach, it was defined based on functions performed by components. To distinguish those failures which can be created for other reasons than during normal operation, we have proposed to use additional modification subfactors. The occurrence (O) and detection (D) factors are equally valued. The proposed method was implemented in the risk assessment for the FMEA of the flow control valve.

2. Methodology

The presented methodology by principle is very similar to the traditional FMEA framework. Almost all steps are analogical. As presented in our previous studies [40], the potential failures are typical for fluid power components used in the conventional FMEA.

2.1. Assumptions

The primary purpose of this study was a qualitative analysis of failures and their end effects on components of fluid power systems. Failures that may occur in them are complex, and primary failure may only trigger the final failure. Therefore, we assume only primary forms of failure, and the presented analysis was carried out only for primary mechanical failures. We also assume that only a few essential data are available for the investigated component. Detailed technical data and manufacturing/assembly processes are inaccessible.
Another assumption is that the failures can be detected without a sophisticated diagnostic system or disassembly. Only basic measurements such as the pressure and flow rate are available.

2.2. Method

One of the stages of the FMEA is the functional analysis of the system, which includes the identification of the basic elements of the system, their potential failures, and causes. However, formal rules for this step are not strictly defined and may differ depending on the considered case. The proposed method assumes that any system is created to fulfill one or more tasks. Therefore, if any failure occurs, the system may not be able to perform the intended task or only perform it partially with some degradation.
We assume that system S consists of a set of components c i C , i = 1 n , which can be connected to each other in any way (parallel, series, or series-parallel). Each component c i performs a specific function or several functions f j F , j = 1 , 2 in the system S. The set of component functions f i can be determined as follows:
  • f 1 : main component functions;
  • f 2 : auxiliary functions.
Each components c i may have a certain state determined by the failure f a F a , fa = f c , f m , f n , which can be determined as follows:
  • f c : failures, which stop s component from executing its function;
  • f m : failures, which allow a component to execute its function with a major degradation;
  • f n : failures, which allow a component to execute its function with a minor degradation.
We introduce the failure importance factor f i as:
f i = { 3 , for   f c 2 , for   f m 1 , for   f n
Among components c i , when creating a system we can distinguish those:
  • that are essential to perform the intended system’s task: main components c e ;
  • that are supplementing main components and ensure the proper system operation: major components c m ;
  • whose failure has little effect on the main task of the system: minor components c n ;
  • additional components whose failure does not affect the main task of the system c a .
We introduce the component importance factor c i m as:
c i m = {     4 , for c e     3 , for c m     2 , for c n     1 , for c a
Additionally, we assume that failures that may appear for some components may influence other components’ failures. For that reason, we have implemented a component failure factor c i n which can be described as:
c i n = k n
where:
k is the number of components that a given component may influence;
n is the total number of components.
The system severity S e we can define as the ability to perform the intended task. We assume that risk assessment is evaluated primarily by severity Se, which can be expressed as:
S e = c i m + c i n · f i
The severity S e is valued with numbers 1–15.
The occurrence O we define as an estimator of failure for corresponding components. We assumed that the main contributor to the likelihood of component failure is the number of functions ( f f factor) the component realizes with modification factors λ i :
O = α f f + λ i
where:
f f = f 1 f 1 + f 2
λ i = λ m o + λ m a + λ d t + λ e v
The factors above arise from the analysis of fluid power components [10], which states that the reliability of fluid power components depends on:
  • relative motion λ m o ;
  • tolerances and surface quality which requires more sophisticated manufacturing processes λ m a ;
  • duty time λ d t ;
  • environmental conditions λ e v .
Each modification factor λ i has equal weight and may reach a maximal value equal to 0.25. The function factor f f maximal value is 4. The evaluation of all mentioned factors can be set arbitrarily and then renormalized to the required range.
Since the mentioned study defines failure rate, it was necessary to introduce a corrective factor α , which allows distinguishing failures which occur during regular operation or in other circumstances. The coefficient is valued in the following way:
  • normal operation: 2;
  • operation outside specified specification: 1.5;
  • maintenance: 1;
  • assembly: 0.5.
The detection D has been defined and evaluated in the following way:
  • detection of failure is almost certain: 1;
  • detection is very high: 2;
  • detection is high: 3;
  • detection is moderately high: 4;
  • detection is moderate: 5;
  • detection is low: 6;
  • detection is very low: 7;
  • detection is remote: 8;
  • detection is very remote: 9;
  • detection is nearly not possible: 10.
According to our primary hypothesis, the risk assessment is realized based on severity S e , which defines whether the system is able to perform intended tasks. The prioritization of failures inside task failures is performed by product occurrence O and detection D.

3. Case Study

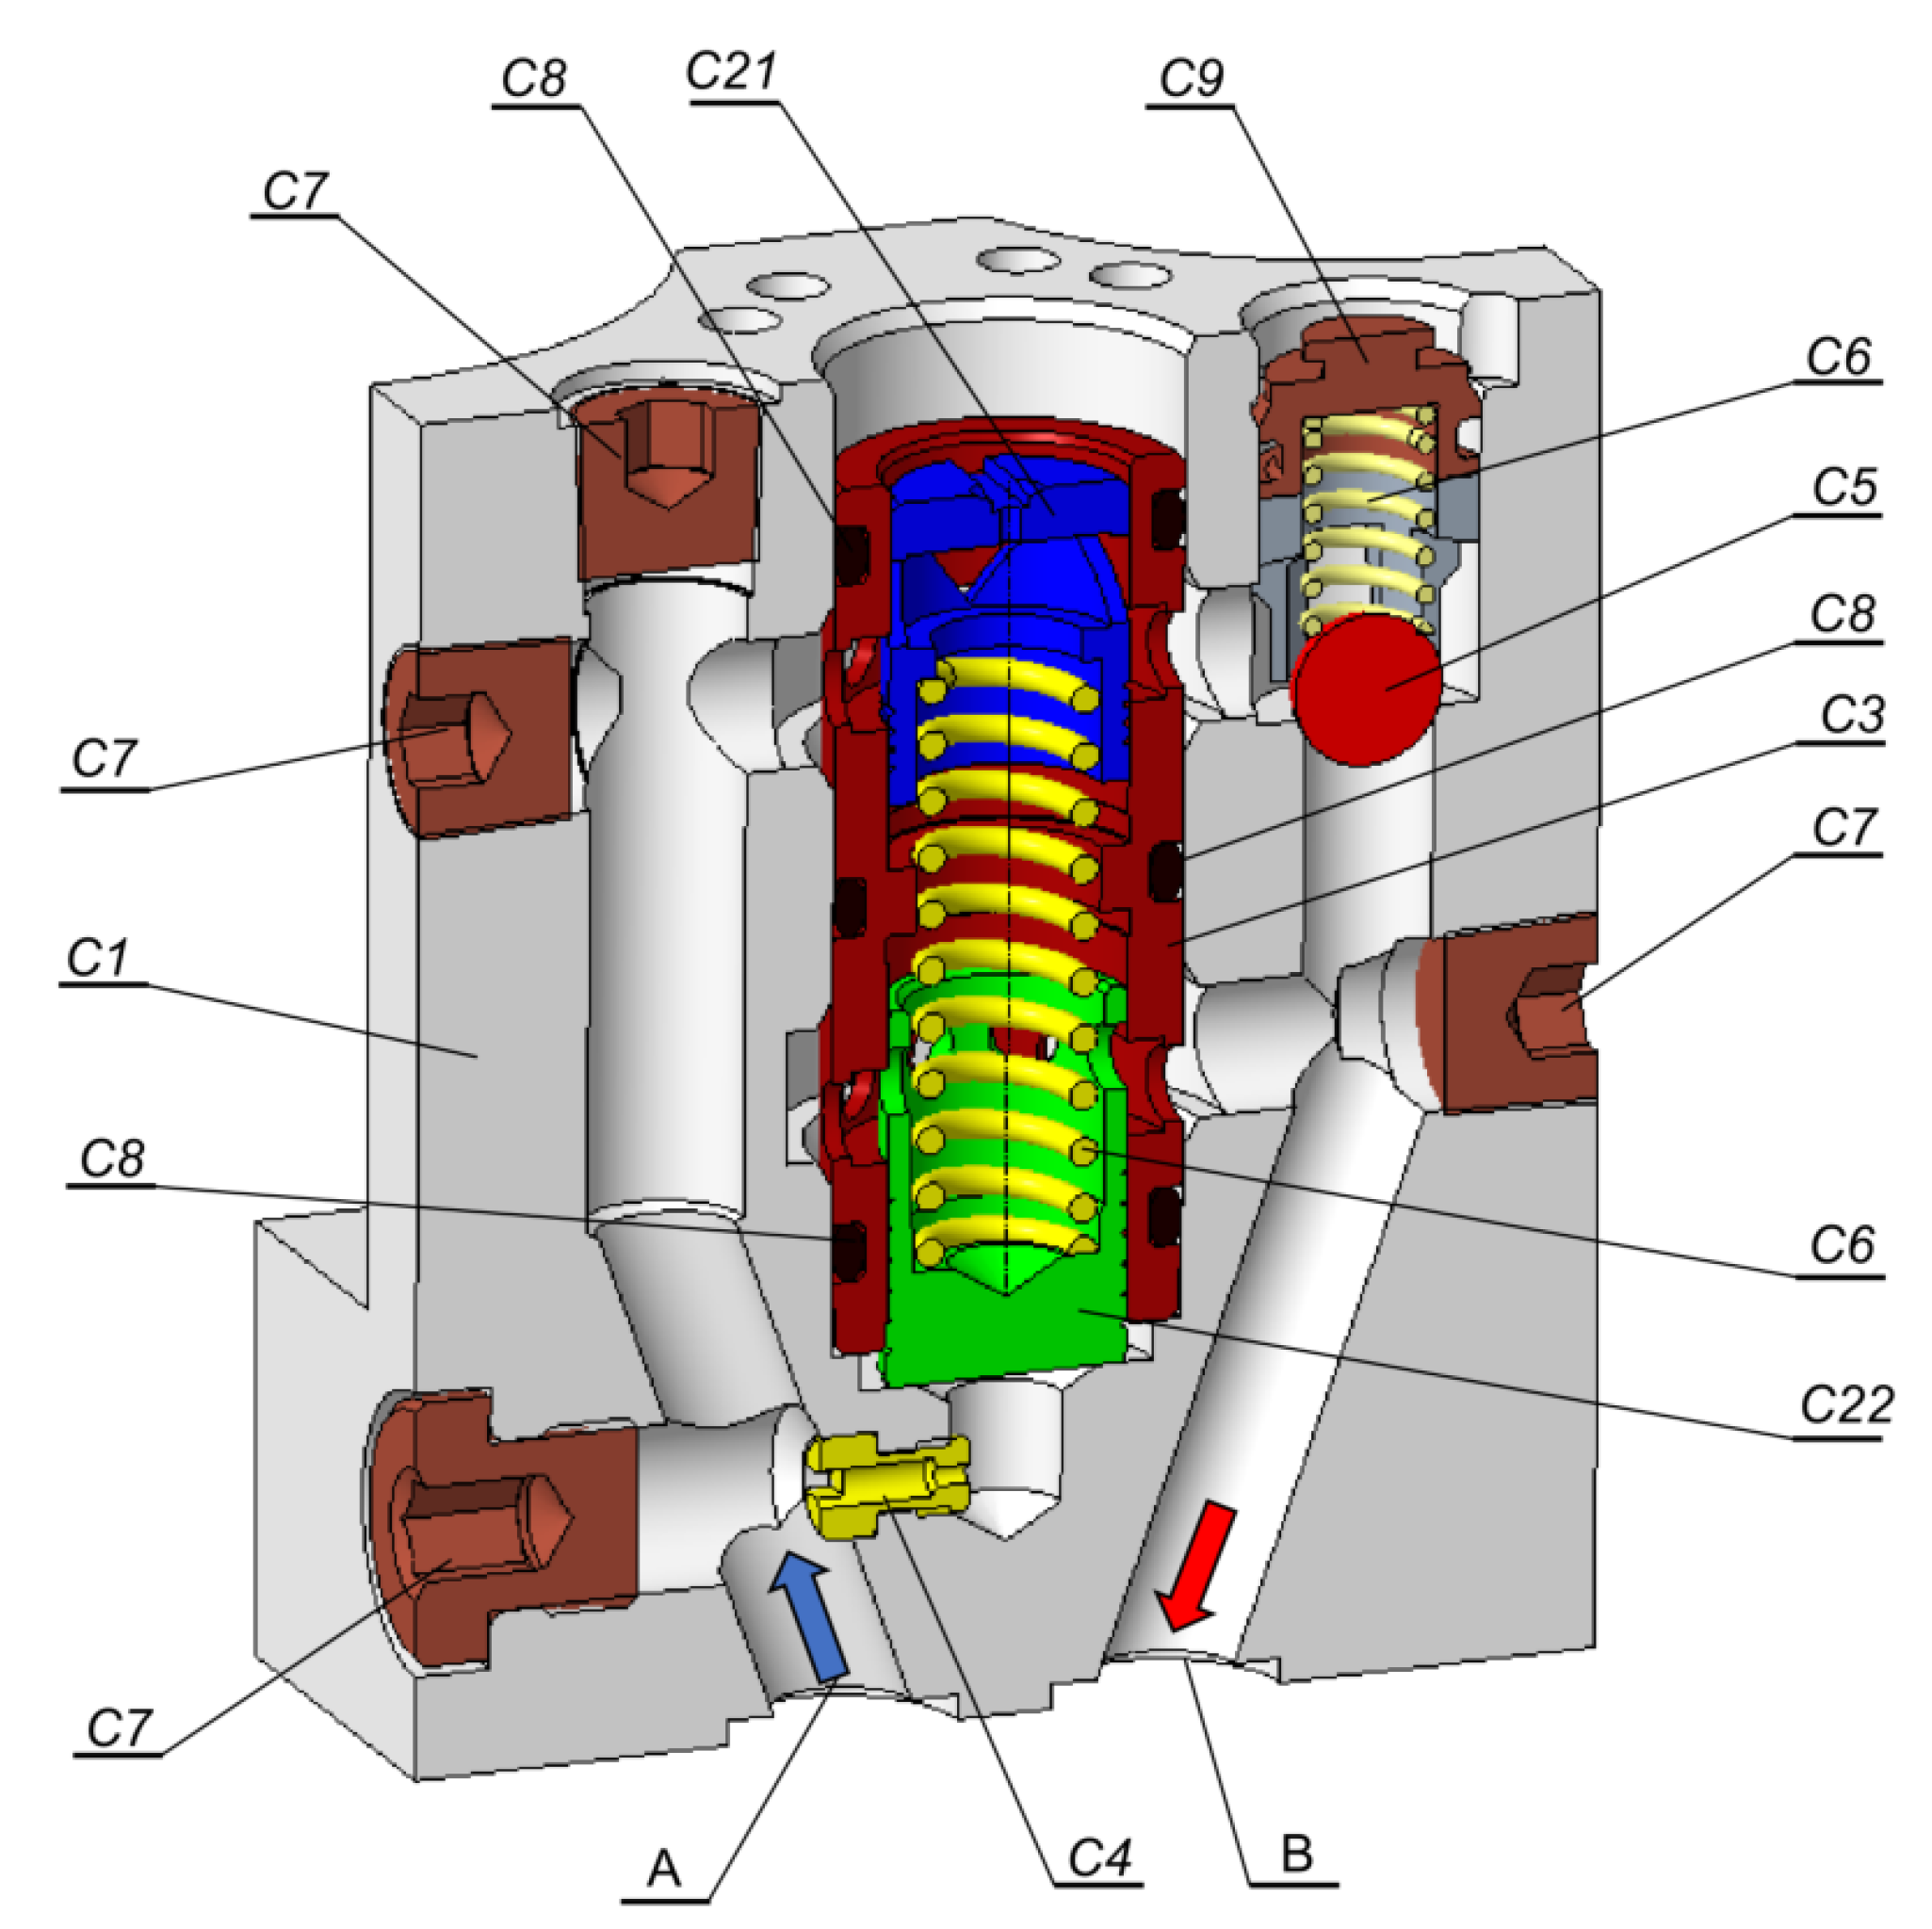
The investigated fluid power component is a two-way flow control valve presented in Figure 1. The valve’s purpose is to maintain a constant flow rate regardless of the pressure difference between ports A and B. When the pressure line is connected to port A, the flow rate is controlled by the throttling gap between piston C21 and sleeve C3. The solenoid sets the gap by setting the position of the piston C21. The constant flow rate is provided by a pressure compensator (piston C22 and nozzle C4).
We can distinguish the following components whose failure will disturb the main task of the valve:
  • body ( c 1 );
  • piston 1 ( c 21 );
  • piston 2 ( c 22 );
  • sleeve ( c 3 );
  • nozzle ( c 4 );
  • spring ( c 6 );
  • plug ( c 7 );
  • sealing ring ( c 8 ).
The following components, when failures occur, may still complete the primary task but with some limitations:
  • ball ( c 5 );
  • check valve seat ( c 9 );
  • oil ( c 10 ), it should be understood as a component that transfers pressure energy.
Failures that leave the valve unable to perform the task are:
  • fracture ( f c 1 );
  • yielding ( f c 2 );
  • seizing ( f c 3 );
  • aging ( f c 4 );
  • hardening ( f c 5 );
  • thread stripping ( f c 6 );
  • clogging ( f c 7 );
  • extreme contamination ( f c 8 ).
Failures that still allow the valve to perform the task but with a major degradation are:
  • erosion ( f m 1 );
  • wear ( f m 2 );
  • aeration ( f m 3 );
  • contamination ( f m 4 );
  • chemical action ( f m 5 ).
Failures that still allow the valve to perform the task but with a minor degradation are the same as the aforementioned. The factor which defines whether the failure belongs to major or minor degradation is its intensity. For simplicity, we will not consider failures with minor degradation. Functions that are performed by individual components are presented in Table 2.
Task failures for the corresponding components are presented in Table 3.

4. Results

Table 4 and Table 5 present the risk assessment of failures and corresponding components. Table 4 presents failures and corresponding component ratings when the primary task of the valve is not realized. The rank is created based on the severity number S e . For the failures with equal S e , the rank is evaluated based on a product of occurrence (O) and detection (D). Table 5 presents failures and corresponding component ratings when the primary task of the valve is maintained with major deficiencies.
The results of failures with minor degradation are essentially the same as those presented in Table 4. The only difference is failure intensity.

5. Discussion

The ranking method in this study allowed for the segregation of those failures that can potentially occur and leave the valve component unable to perform the intended task. However, some failures have the same value of severity ( S e ) inside the assumed categories. The adopted product of occurrence (O) and detection (D) as an additional evaluating criterion did not allow for distinguishing their ranks. This indicates that another factor apart from those presented in this study would need to be employed. Another solution might be a modification of the detection factor (D), which remained unchanged, and problems with uncertainties related to linguistic conversion to quantitative data remain relatively high. The presented method uses factors based on failure history and research of similar but not strictly identical objects; therefore, it is suitable during the design process or initial stage of failure analysis. Additionally, it can be combined with other tools and methods such as root cause analysis (RCA) or fault tree analysis (FTA). As was mentioned earlier, a ranking for failures with minor degradation of the valve’s intended function is the same as for major degradation. The only difference is the intensity of failure. As the majority of failures in Table 5 are caused during the normal operational condition, it is certain the degradation of the valve’s main task will depend on the intensity of wear or erosion of valve components.
Another feature that can be observed is the source of the failures which stop the valve from performing its task. All of those failures are mainly caused during assembling, maintenance work, or operation outside specifications. Analogously, those failures which cause major or minor degradation of the valve are mainly produced during normal operation.
The presented method can be easily extended to any fluid power components, however, we are unable to perform FMEA for electrical/electronic components. It can be used only for purely mechanical or hydromechanical components. Proposed subfactors in occurrence (O) were defined only as typical for mechanical or hydromechanical failures.
The severity values S e can be set arbitrary with any values; the proposed methods only prioritize failures for related components inside categorized failures on those which stop the valve from performing its task and those which cause a major or minor malfunction.

Comparison with the Traditional FMEA Risk Assessment

The Table 6 presents a risk analysis using the traditional approach for selected failures and related components by invited experts. The risk has been expressed as the RPN (product of severity (S), occurrence (O), and detection (D)) and by using action priority (AP).
According to the table, the highest RPN value was reached for failure wear f m 2 and erosion f m 1 for the components pistons 1 c 21 and piston 2 c 22 . For both, the action priority (AP) is high (H). This is overestimating those failures, which can cause a major or minor malfunction in the valve. In contrast, the failure fracture f c 1 for the body c 1 and thread stripping f c 6 for plug c 7 are underestimated. Their RPN values are lower than other failures, and action priority (AP) is low (L). Those failures, when they occur, stop the valve’s operation.

6. Conclusions

Despite the continuous improvement of FMEA and its new standards, many problems remain unresolved. The proposal of risk assessment presented in this paper and the assessment of the likelihood of potential defects allows minimizing the uncertainty of the gathered data.
The proposed method categories failures and relevant components in the aspect of their influence on the ability to perform the intended task. The method presented in this paper is universal and can be used in any component of the fluid power system.
The proposed method also identifies failures that can cause critical failure to the system, which would be neglected by the traditional FMEA method or even the latest one implemented in the industry.
The proposed methods do not require computationally extensive tools or simulational methods. In principle, it is very similar to the traditional FMEA method. The proposed failures and component categorization make it so the proposed method can be adjusted to individual needs and valued with arbitrary weights.
The presented method has shown its superiority over the recent AIAG and VDA FMEA standard and the traditional FMEA framework. Some of the failures that can occur on main valve components would not be recognized as critical to the system.
An extension of the presented method might be a redefinition of the detection factor to minimize the still relatively high uncertainties and implement new risk factors such as the cost of manufacturing or repairs.

Author Contributions

Conceptualization, J.F.-D.; methodology, M.D.; software, M.D.; validation, J.F.-D.; formal analysis, J.F.-D.; investigation, M.D.; resources, M.D.; data curation, M.D.; writing—original draft preparation, M.D.; writing—review and editing, M.D.; visualization, J.F.-D.; supervision, J.F.-D.; project administration, J.F.-D.; funding acquisition, J.F.-D. All authors have read and agreed to the published version of the manuscript.

Funding

This research received no external funding.

Institutional Review Board Statement

Not applicable.

Informed Consent Statement

Not applicable.

Data Availability Statement

Not applicable.

Conflicts of Interest

The authors declare no conflict of interest.

Abbreviations

The following abbreviations are used in this manuscript:
MDPIMultidisciplinary Digital Publishing Institute
DOAJDirectory of Open Access Journals
FMEAFailure Modes and Effect Analysis
RCARoot Cause Analysis
FTAFault Tree Analysis
RPNRisk Priority Number
AIAGAutomotive Industry Action Group
VDAand der Automobilindustrie VDA
APAction Priority

References

  1. Zhao, X.; Zhou, C.; Zhao, L.; Zhang, S.; Wen, P.; Jiang, J. Condition evaluation model of fluid power system in gradual failure based on data envelopment analysis. Comput. Fluids 2015, 110, 219–226. [Google Scholar] [CrossRef]
  2. Lee, Y.; Lee, G.; Yang, J.; Park, J.; Baek, D. Failure analysis of a hydraulic power system in the wind turbine. Eng. Fail. Anal. 2020, 107, 104218. [Google Scholar] [CrossRef]
  3. Ma, Z.; Wang, S.; Shi, J.; Li, T.; Wang, X. Fault diagnosis of an intelligent hydraulic pump based on a nonlinear unknown input observer. Chin. J. Aeronaut. 2018, 31, 385–394. [Google Scholar] [CrossRef]
  4. Li, T.; Wang, S.; Zio, E.; Shi, J.; Ma, Z. A numerical approach for predicting the remaining useful life of an aviation hydraulic pump based on monitoring abrasive debris generation. Mech. Syst. Signal Process. 2018, 136, 106519. [Google Scholar] [CrossRef]
  5. Hast, D.; Findeisen, R.; Streif, S. Detection and isolation of parametric faults in hydraulic pumps using a set-based approach and quantitative–qualitative fault specifications. Control Eng. Pract. 2015, 40, 61–70. [Google Scholar] [CrossRef]
  6. Gianni, N.; Tito, M. Failure of a heavy-duty hydraulic cylinder and its fatigue re-design. Eng. Fail. Anal. 2011, 18, 1030–1036. [Google Scholar]
  7. Roquet, P.; Gamez-Montero, P.J.; Castilla, R.; Raush, G.; Codina, E. A Simplified Methodology to Evaluate the Design Specifications of Hydraulic Components. Appl. Sci. 2018, 8, 1612. [Google Scholar] [CrossRef]
  8. Guo, Y.; Xiong, G.; Zeng, L.; Li, Q. Modeling and Predictive Analysis of Small Internal Leakage of Hydraulic Cylinder Based on Neural Network. Energies 2021, 14, 2456. [Google Scholar] [CrossRef]
  9. Watton, J. Modelling, Monitoring and Diagnostic Techniques for Fluid Power Systems; Springer: London, UK, 2007. [Google Scholar]
  10. Handbook of Reliability Prediction for Mechanical Equipment; Naval Surface Warfare Center: West Bethesda, MD, USA, 2011.
  11. Stirrup, T.S.; Chamberlin, H.C.; Curran, K.L.F. Scaled Wind Farm Technology Hydraulic System Failure Modes and Effects Analysis; Sandia National Laboratories: Albuquerque, NM, USA; Livermore, CA, USA, 2015. [Google Scholar]
  12. Fabis-Domagala, J.; Domagala, M.; Momeni, H. A Matrix FMEA Analysis of Variable Delivery Vane Pumps. Energies 2021, 14, 1741. [Google Scholar] [CrossRef]
  13. Zhang, F.; Cheng, L.; Gao, Y.; Xu, X.; Wang, Y. Fault tree analysis of a hydraulic system based on the interval model using latin hypercube sampling. J. Intell. Fuzzy Syst. 2019, 37, 8345–8355. [Google Scholar] [CrossRef]
  14. Hemati, A.; Shooshtari, A.A. Gear Pump Root Cause Failure Analysis Using Vibrations Analysis and Signal Processing. J. Fail. Anal. Preven. 2020, 20, 1815–1818. [Google Scholar] [CrossRef]
  15. Liu, H.C.; Liu, L.; Liu, N. Risk evaluation approaches in failure mode and effects analysis: A literature review. Expert Syst. Appl. 2013, 40, 828–838. [Google Scholar] [CrossRef]
  16. MIL-P 1629; USA Military Standard, Procedure for Performing a Failure Mode, Effects and Criticality Analysis (MIL-P 1629, USA). Military Specifications and Standards: Washington, DC, USA, 1949.
  17. J1739 200901; Potential Failure Mode and Effects Analysis in Design (Design FMEA), Potential Failure Mode and Effects Analysis in Manufacturing and Assembly Processes (Process FMEA). SAE International: Warrendale, PA, USA, 2009.
  18. AIAG. Potential Failure Mode and Effect Analysis (FMAE), 4th ed.; AIAG: Automotive Industry Action Group, 2008; Available online: https://www.aiag.org/store/publications/details?ProductCode=FMEA-4 (accessed on 20 July 2022).
  19. AIAG & VDA FMEA Handbook. AIAG: Automotive Industry Action Group. 2019. Available online: https://www.aiag.org/store/publications/details?ProductCode=FMEAAV-1 (accessed on 20 July 2022).
  20. Anes, V.; Henriques, E.; Freitas, M.; Reis, L. A new risk prioritization model for failure mode and effects analysis. Qual. Reliab.Eng. Int. 2018, 34, 516–528. [Google Scholar] [CrossRef]
  21. Tang, Y.; Zhou, D.; Chan, F.T.S. AMWRPN: Ambiguity Measure Weighted Risk Priority Number Model for Failure Mode and Effects Analysis. IEEE Access 2018, 6, 27103–27110. [Google Scholar] [CrossRef]
  22. Koomsap, P.; Charoenchokdilok, T. Improving risk assessment for customer-oriented FMEA. Total Qual. Manag. Bus. Excell. 2018, 29, 1563–1579. [Google Scholar] [CrossRef]
  23. Pancholi, N.; Bhatt, M. FMECA-based maintenance planning through COPRAS-G and PSI. J. Qual. Maint. Eng. 2018, 24, 224–243. [Google Scholar] [CrossRef]
  24. Li, Z.; Chen, L. A novel evidential FMEA method by integrating fuzzy belief structure and grey relational projection method. Eng. Appl. Artif. Intell. 2019, 77, 136–147. [Google Scholar] [CrossRef]
  25. Shi, S.; Fei, H.; Xu, X. Application of a FMEA method combining interval 2-tuple linguistic variables and grey relational analysis in preoperative medical service process. IFAC-PapersOnLine 2019, 52, 1242–1247. [Google Scholar] [CrossRef]
  26. Filo, G.; Fabis-Domagala, J.; Domagala, M.; Lisowski, E.; Momeni, H. The idea of fuzzy logic usage in a sheet-based FMEA analysis of mechanical systems. MATEC Web Conf. 2018, 183, 03009. [Google Scholar] [CrossRef]
  27. Qin, J.; Xi, Y.; Pedrycz, W. Failure mode and effects analysis (FMEA) for risk assessment based on interval type-2 fuzzy evidential reasoning method. Appl. Soft Comput. 2020, 89, 10613. [Google Scholar] [CrossRef]
  28. Liu, H.C.; Chen, X.; Dua, C.; Wang, Y. Failure mode and effect analysis using multi-criteria decision making methods: A systematic literature review. Comput. Ind. Eng. 2019, 135, 881–897. [Google Scholar] [CrossRef]
  29. Ouyang, L.; Che, Y.; Yan, L.; Park, C. Multiple perspectives on analyzing risk factors in FMEA. Comput. Ind. 2022, 141, 103712. [Google Scholar] [CrossRef]
  30. Yu, J.; Wu, S.; Chen, H.; Yu, Y.; Fan, H.; Liu, J. Risk assessment of submarine pipelines using modified FMEA approach based on cloud model and extended VIKOR method. Process. Saf. Environ. Prot. 2021, 155, 555–574. [Google Scholar]
  31. Apol Pribadi, S.; Nina Fadilah, N. The consistency analysis of failure mode and effect analysis (FMEA) in information technology risk assessment. Heliyon 2020, 6, e03161. [Google Scholar] [CrossRef]
  32. Lipeng, W.; Fang, Y.; Fang, W.; Zijun, L. FMEA-CM based quantitative risk assessment for process industries—A case study of coal-to-methanol plant in China. Process. Saf. Environ. Prot. 2021, 149, 299–311. [Google Scholar] [CrossRef]
  33. Yelda, Y.; Gülin Feryal, C. A FMEA based novel intuitionistic fuzzy approach proposal: Intuitionistic fuzzy advance MCDM and mathematical modeling integration. Expert Syst. Appl. 2021, 183, 115413. [Google Scholar] [CrossRef]
  34. Shamsu, H.; Jin, W.; Christos, K.; Musa, B. Modified FMEA hazard identification for cross-country petroleum pipeline using Fuzzy Rule Base and approximate reasoning. J. Loss Prev. Process. Ind. 2022, 74, 104616. [Google Scholar] [CrossRef]
  35. Yan, Z.; Chuanhao, F.; Hengjie, Z. From diversity to consensus: Impacts of opinion evolution and psychological behaviours in failure mode and effect analysis. Appl. Soft Comput. 2022, 128, 109399. [Google Scholar] [CrossRef]
  36. Soumava, B.; Shankar, C. Failure analysis of CNC machines due to human errors: An integrated IT2F-MCDM-based FMEA approach. Eng. Fail. Anal. 2021, 130, 105768. [Google Scholar] [CrossRef]
  37. Shi, H.; Liu, Z.; Liu, H.C. A new linguistic preference relation-based approach for failure mode and effect analysis with dynamic consensus reaching process. Inf. Sci. 2022, 977–993. [Google Scholar] [CrossRef]
  38. Qun, W.; Guozhu, J.; Yuning, J.; Wenyan, S. A new approach for risk assessment of failure modes considering risk interaction and propagation effects. Reliab. Eng. Syst. Saf. 2021, 216, 108044. [Google Scholar] [CrossRef]
  39. Fabis-Domagala, J.; Domagala, M.; Momeni, H. A Concept of Risk Prioritization in FMEA Analysis for Fluid Power Systems. Energies 2021, 14, 6482. [Google Scholar] [CrossRef]
  40. Fabis-Domagala, J.; Momeni, H.; Filo, G.; Bikass, S.; Lempa, P. Matrix FMEA Analysis of the flow conrol valve. QPI 2019, 1, 590–595. [Google Scholar]
Figure 1. Flow control valve: 2-way flow control valve type UDRD6 by Ponar Wadowice: C1—body, C21—piston 1, C22—piston 2, C3—sleeve, C4—nozzle, C5—ball, C6—spring, C7—plug, C8—sealing ring, C9—check valve seat, A and B—valve port.
Energies 15 06180 g001
Table 1. The AP classification [19].
S 9–10S 7–8S 4–6
D\O10987654321D\O10987654321D\O10987654321
10HHHHHHHHHL10HHHHHHHMML10HHHMMMMLLL
9HHHHHHHHHL9HHHHHHHMML9HHHMMMMLLL
8HHHHHHHHHL8HHHHHHHMML8HHHMMMMLLL
7HHHHHHHHHL7HHHHHHHMML7HHHMMMMLLL
6HHHHHHHMML6HHHHHMMMML6HHHMMLLLLL
5HHHHHHHMML5HHHHHMMMML5HHHMMLLLLL
4HHHHHHHLLL4HHHHHMMLLL4MMMMMLLLLL
3HHHHHHHLLL3HHHHHMMLLL3MMMMMLLLLL
2HHHHHHHLLL2HHHHHMMLLL2MMMMMLLLLL
1HHHHHMMLLL1HHHMMMMLLL1MMMLLLLLLL
S 2–3S 1
D\O10987654321D\O10987654321
10MMMLLLLLLL10LLLLLLLLLL
9MMMLLLLLLL9LLLLLLLLLL
8MMMLLLLLLL8LLLLLLLLLL
7MMMLLLLLLL7LLLLLLLLLL
6MMMLLLLLLL6LLLLLLLLLL
5MMMLLLLLLL5LLLLLLLLLL
4LLLLLLLLLL4LLLLLLLLLL
3LLLLLLLLLL3LLLLLLLLLL
2LLLLLLLLLL2LLLLLLLLLL
1LLLLLLLLLL1LLLLLLLLLL
Table 2. Functions performed by valve components.
Component c i Primary Function f 1 Secondary Function f 2
body ( c 1 )connecting with the systemfixing check valve
fixing piston/sleeve positionmounting
sealsseat for spring
flow managementseat for nozzle
piston 1 ( c 21 )flow rate setting-
sealing-
piston 2 ( c 22 )flow rate control-
sealing-
sleeve ( c 3 )guiding pistons-
sealing-
nozzle ( c 4 )pressure control-
ball ( c 5 )-closing/opening flow
spring ( c 6 )positioning-
plug ( c 7 )closing flow ducts-
sealing ring ( c 8 )sealing-
check valve seat ( c 9 )-guiding ball
-guiding spring
oil ( c 10 )energy transfergreasing
-cooling
Table 3. Task failures.
Valve FunctionComponentFailure
The primary task is not realizedbody c 1 fracture f c 1
yielding f c 2
thread stripping f c 6
piston 1 c 21 fracture f c 1
yielding f c 2
seizing f c 3
piston 2 c 22 fracture f c 1
yielding f c 2
seizing f c 3
sleeve c 3 fracture f c 1
yielding f c 2
seizing f c 3
nozzle c 4 fracture f c 1
clogging f c 7
spring c 6 fracture f c 1
yielding f c 2
plug c 7 fracture f c 1
thread stripping f c 6
sealing ring c 8 fracture f c 1
aging f c 4
hardening f c 5
oil c 10 extreme contamination f c 8
The major degradation of the primary taskbody c 1 erosion f m 1
piston 1 c 21 wear f m 2
piston 2 c 22 chemical action f m 5
sleeve c 3
plug c 7
ball c 5 fracture f c 1
seizing f c 3
erosion f m 1
wear f m 2
chemical action f m 5
spring c 6 chemical action f m 5
sealing ring c 8 wear f m 2
chemical action f m 5
check valve seat c 9 fracture f c 1
seizing f c 3
yielding f c 2
thread stripping f c 6
erosion f m 1
wear f m 2
chemical action f m 5
oil c 10 aeration f m 3
contamination f m 4
chemical action f m 5
Table 4. The rank of failures when the primary task is not completed.
Rank SeverityOccurrenceDetection
c i m c i n f i S e f f λ m o λ m a λ d t λ e v α OD O · D
1 c 10 f c 8 40.81818314.45451.20000.1251.51.987547.95
2 c 1 f c 2 40.54545313.636340.06250.1250.250.251.57.0313642.1875
3 c 3 f c 3 40.54545313.63631.60.06250.250.250.062524.45940.05
4 c 21 f c 1 40.54545313.63631.60.1250.250.18750.06251.53.3375930.0375
c 21 f c 2 40.54545313.63631.60.1250.250.18750.06251.53.3375930.0375
c 3 f c 1 40.54545313.63631.60.06250.250.250.06251.53.3375930.0375
c 3 f c 2 40.54545313.63631.60.06250.250.250.06251.53.3375930.0375
5 c 1 f c 1 40.54545313.636340.06250.1250.250.251.57.0313321.0938
6 c 21 f c 3 40.54545313.63631.60.1250.250.250.062524.575627.45
7 c 1 f c 6 40.54545313.636340.06250.1250.250.250.52.343824.6875
8 c 22 f c 1 40.45454313.36361.60.1250.250.250.06251.53.4313930.8813
9 c 22 f c 2 40.45454313.36361.60.1250.250.250.06251.53.4313930.8813
c 22 f c 3 40.45454313.36361.60.1250.250.250.062524.575627.45
10 c 6 f c 2 40.36363313.09090.80.06250.06250.250.06251.51.8563916.7063
11 c 6 f c 1 40.36363313.09090.80.06250.06250.250.06251.51.8563712.9938
12 c 4 f c 7 40.18181312.54540.80.06250.1250.18750.062522.475922.275
13 c 4 f c 1 40.18181312.54540.80.06250.1250.18750.06251.51.8563611.138
14 c 8 f c 4 40.09090312.27270.80.06250.06250.250.062522.475922.275
15 c 8 f c 5 40.09090312.27270.80.06250.06250.250.062522.475922.275
c 8 f c 1 40.09090312.27270.80.06250.06250.250.062522.475614.85
16 c 7 f c 1 40.09090312.27270.80.06250.06250.06250.250.50.618310.6188
c 7 f c 6 40.09090312.27270.80.06250.06250.06250.250.50.618310.6188
Table 5. The ranks of functional failures with major degradation.
Rank SeverityOccurrenceDetection
c i m c i n f i S e f f λ m o λ m a λ d t λ e v α OD O · D
1 c 8 f m 2 40.0909312.27270.80.06250.06250.250.062522.47501024.75
c 8 f m 5 40.0909312.27270.80.06250.06250.250.062522.47501024.75
2 c 10 f m 3 40.818229.63641.20.06250.06250.250.2523.65414.6
c 10 f m 4 40.818229.63641.20.06250.06250.250.2523.65414.6
c 10 f m 5 40.818229.63641.20.06250.06250.250.2523.65414.6
3 c 1 f m 1 40.545529.090940.06250.12500.250.2529.37501093.75
c 1 f m 2 40.545529.090940.06250.12500.250.2529.37501093.75
c 1 f m 5 40.545529.090940.06250.12500.250.2529.37501093.75
4 c 21 f m 5 40.545529.09091.60.12500.250.250.062524.57501045.75
5 c 21 f m 1 40.545529.09091.60.12500.250.18750.062524.451044.5
c 21 f m 2 40.545529.09091.60.12500.250.18750.062524.451044.5
c 3 f m 1 40.545529.09091.60.06250.250.250.062524.451044.5
c 3 f m 2 40.545529.09091.60.06250.250.250.062524.451044.5
c 3 f m 5 40.545529.09091.60.06250.250.250.062524.451044.5
6 c 22 f m 1 40.454528.90911.60.12500.250.250.062524.5751045.75
c 22 f m 2 40.454528.90911.60.12500.250.250.062524.5751045.75
c 22 f m 5 40.454528.90911.60.12500.250.250.062524.5751045.75
7 c 6 f m 5 40.363628.72730.80.06250.06250.1250.062522.2251022.25
8 c 4 f m 1 40.181828.36360.80.06250.1250.18750.062522.4751024.75
c 4 f m 2 40.181828.36360.80.06250.1250.18750.062522.4751024.75
c 4 f m 5 40.181828.36360.80.06250.1250.18750.062522.4751024.75
9 c 9 f c 1 20.272736.81820.40.06250.1250.1250.06251.51.16251011.625
c 9 f c 2 20.272736.81820.40.06250.1250.1250.06251.51.16251011.625
10 c 9 f c 6 20.272736.81820.40.06250.1250.1250.06250.50.3875103.875
11 c 5 f c 3 20.181836.54550.80.12500.1250.1250.062522.4751024.75
12 c 5 f c 1 20.181836.54550.80.12500.1250.1250.06251.51.85631018.5625
13 c 7 f m 1 30.090926.18180.80.06250.06250.06250.2522.4751024.75
c 7 f m 2 30.090926.18180.80.06250.06250.06250.2522.4751024.75
c 7 f m 5 30.090926.18180.80.06250.06250.06250.062522.11021
14 c 9 f m 1 20.272724.54550.40.06250.1250.1250.062521.551015.5
c 9 f m 2 20.272724.54550.40.06250.1250.1250.062521.551015.5
c 9 f m 5 20.272724.54550.40.06250.1250.1250.062521.551015.5
15 c 5 f m 1 20.181824.36360.80.12500.1250.1250.062522.4751024.75
c 5 f m 2 20.181824.36360.80.12500.1250.1250.062522.4751024.75
c 5 f m 5 20.181824.36360.80.12500.1250.1250.062522.4751024.75
c 5 f m 5 20.181824.36360.80.12500.1250.1250.06250.50.6188106.1875
Table 6. The RPN and AP.
Failure/ComponentSODRPNAP
c 1 f c 1 103390L
c 7 f c 6 101110L
c 1 f c 2 1036180H
c 21 f c 1 1039270H
c 21 f c 2 1039270H
c 21 f c 3 1056300H
c 22 f c 1 1039270H
c 22 f c 2 1039270H
c 22 f c 3 1056300H
c 21 f m 1 8710560H
c 21 f m 2 8710560H
c 22 f m 1 8710560H
c 22 f m 2 8710560H
Publisher’s Note: MDPI stays neutral with regard to jurisdictional claims in published maps and institutional affiliations.

