


Sedimentary Facies Analysis of the Third Eocene Member of Shahejie Formation in the Bonan Sag of Bohai Bay Basin (China): Implications for Facies Heterogeneities in Sandstone Reservoirs


Abstract
:
1. Introduction
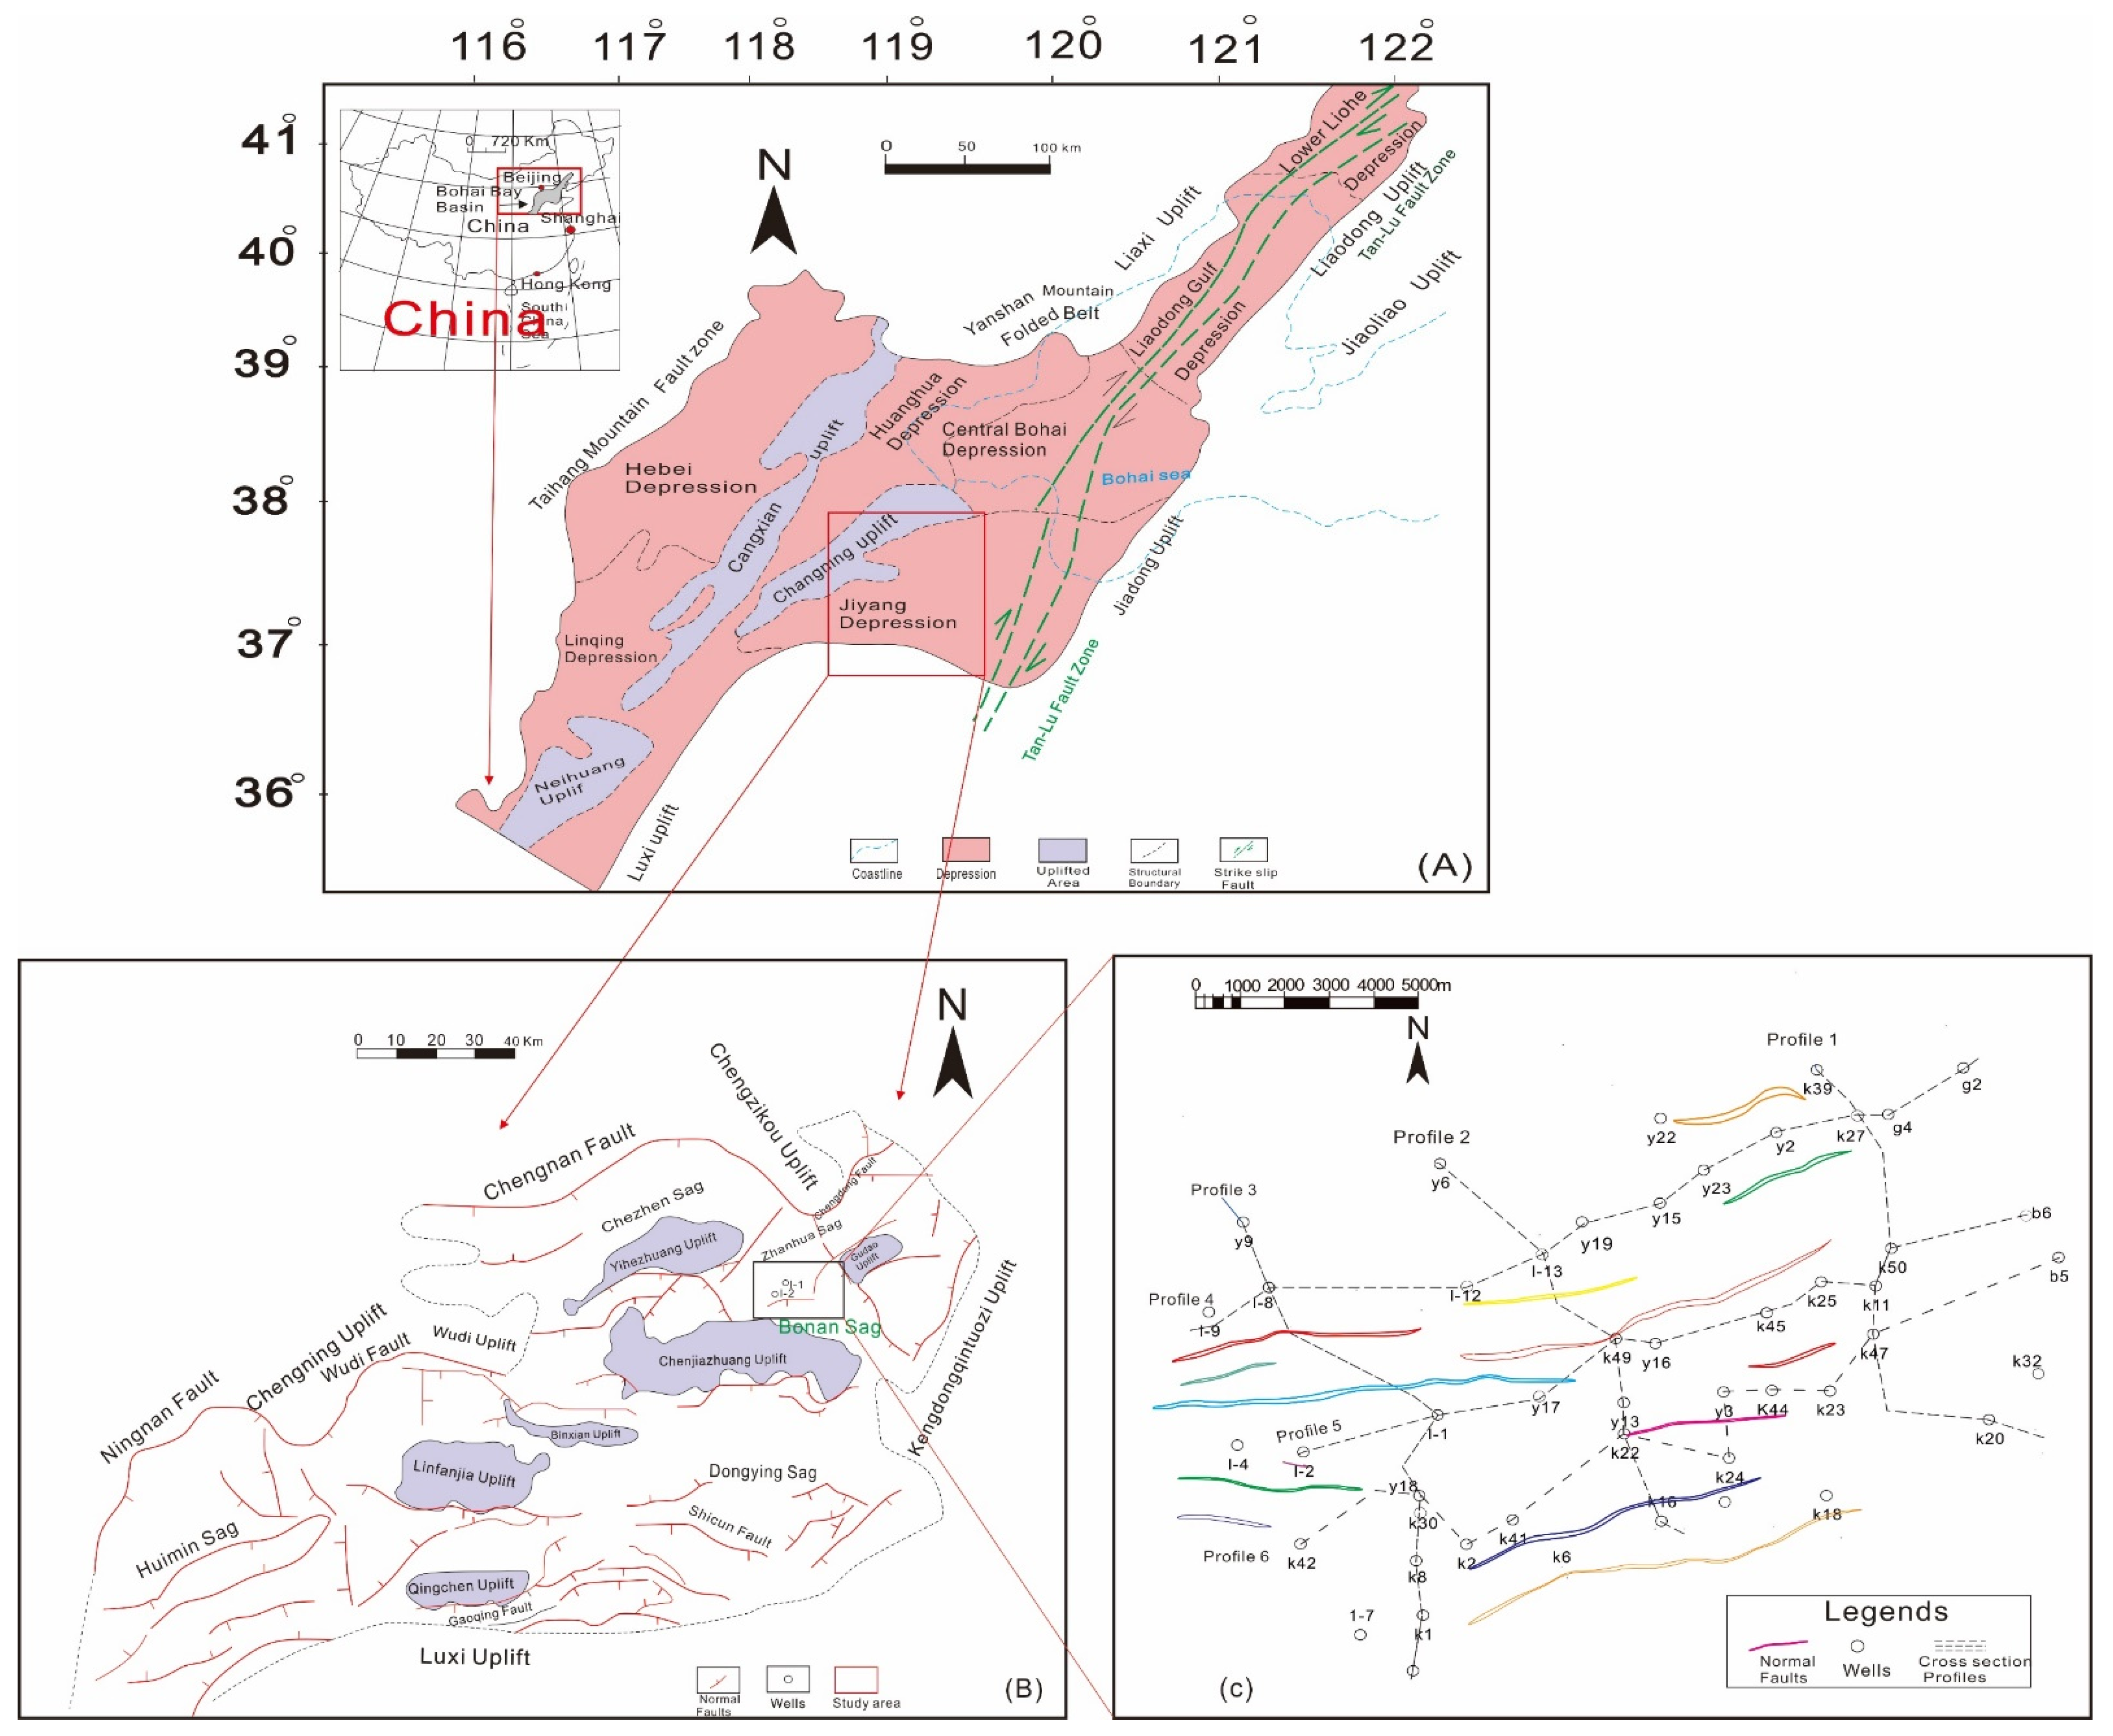
2. Geological Settings
Bonan Sag
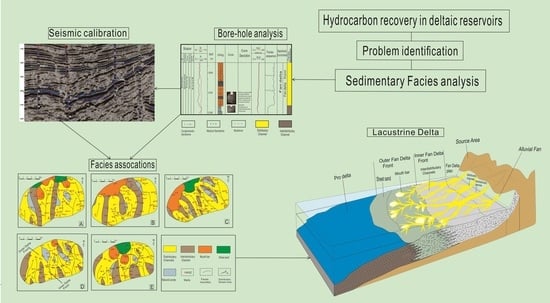
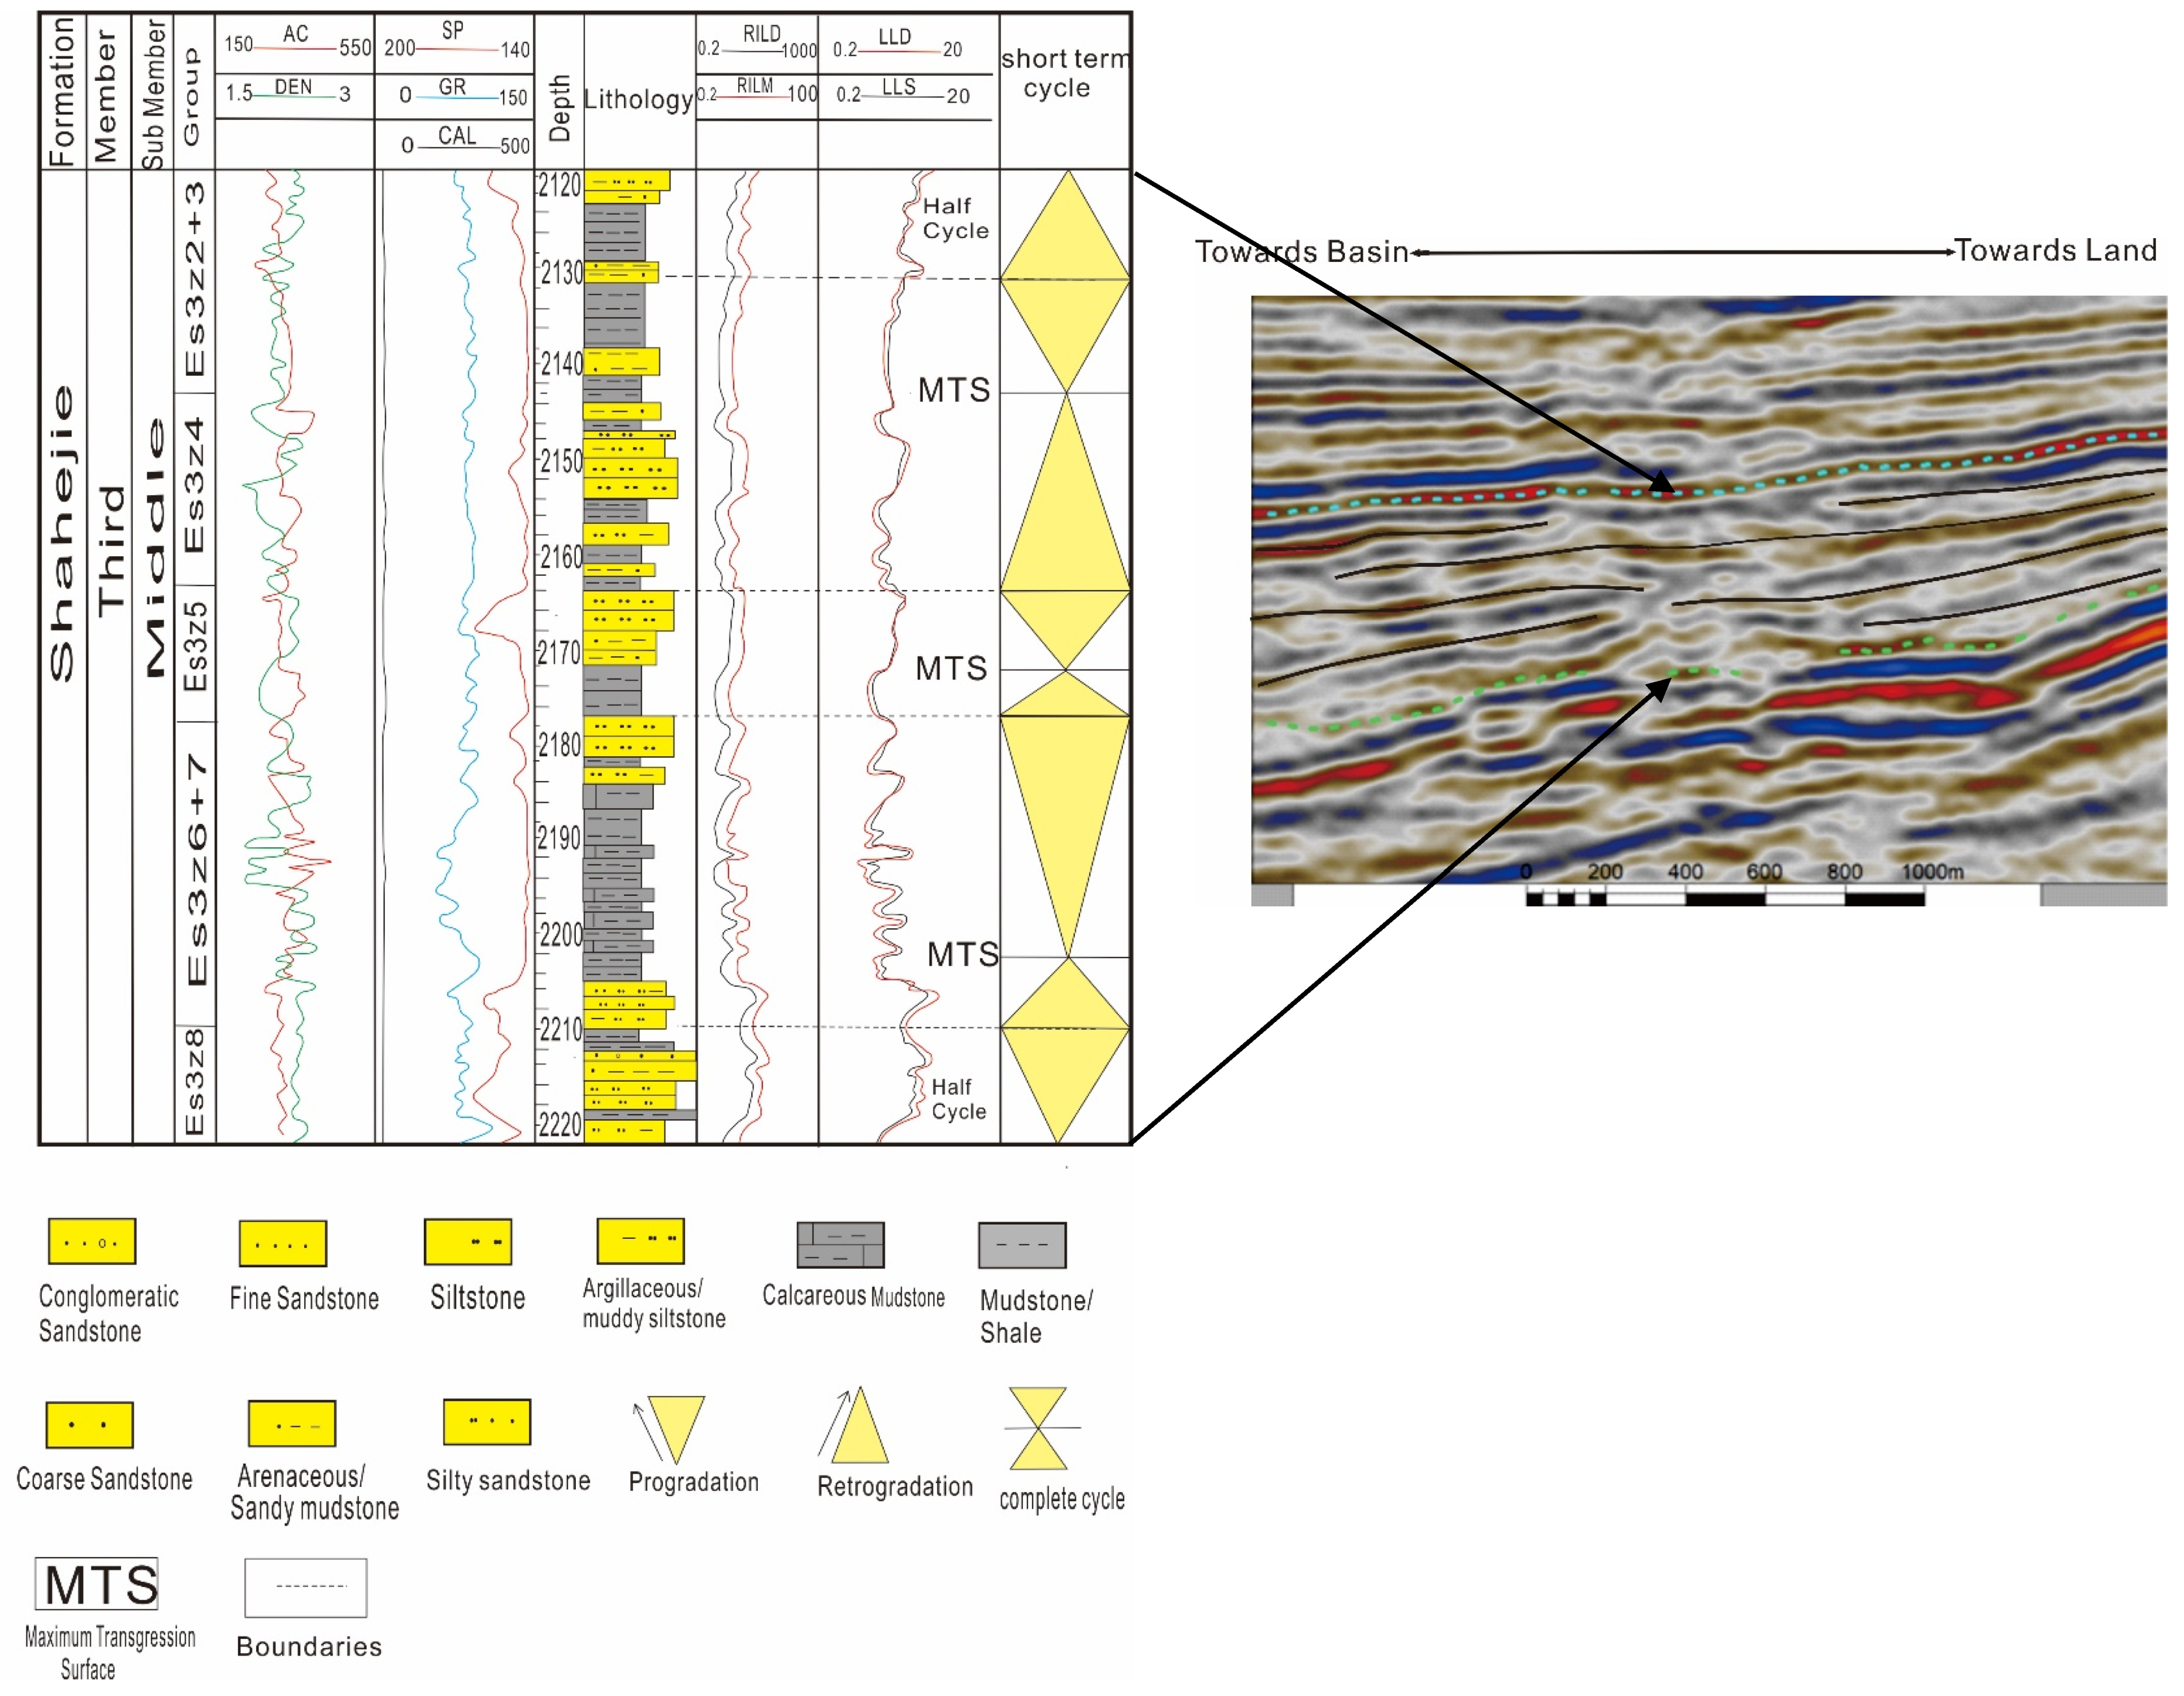
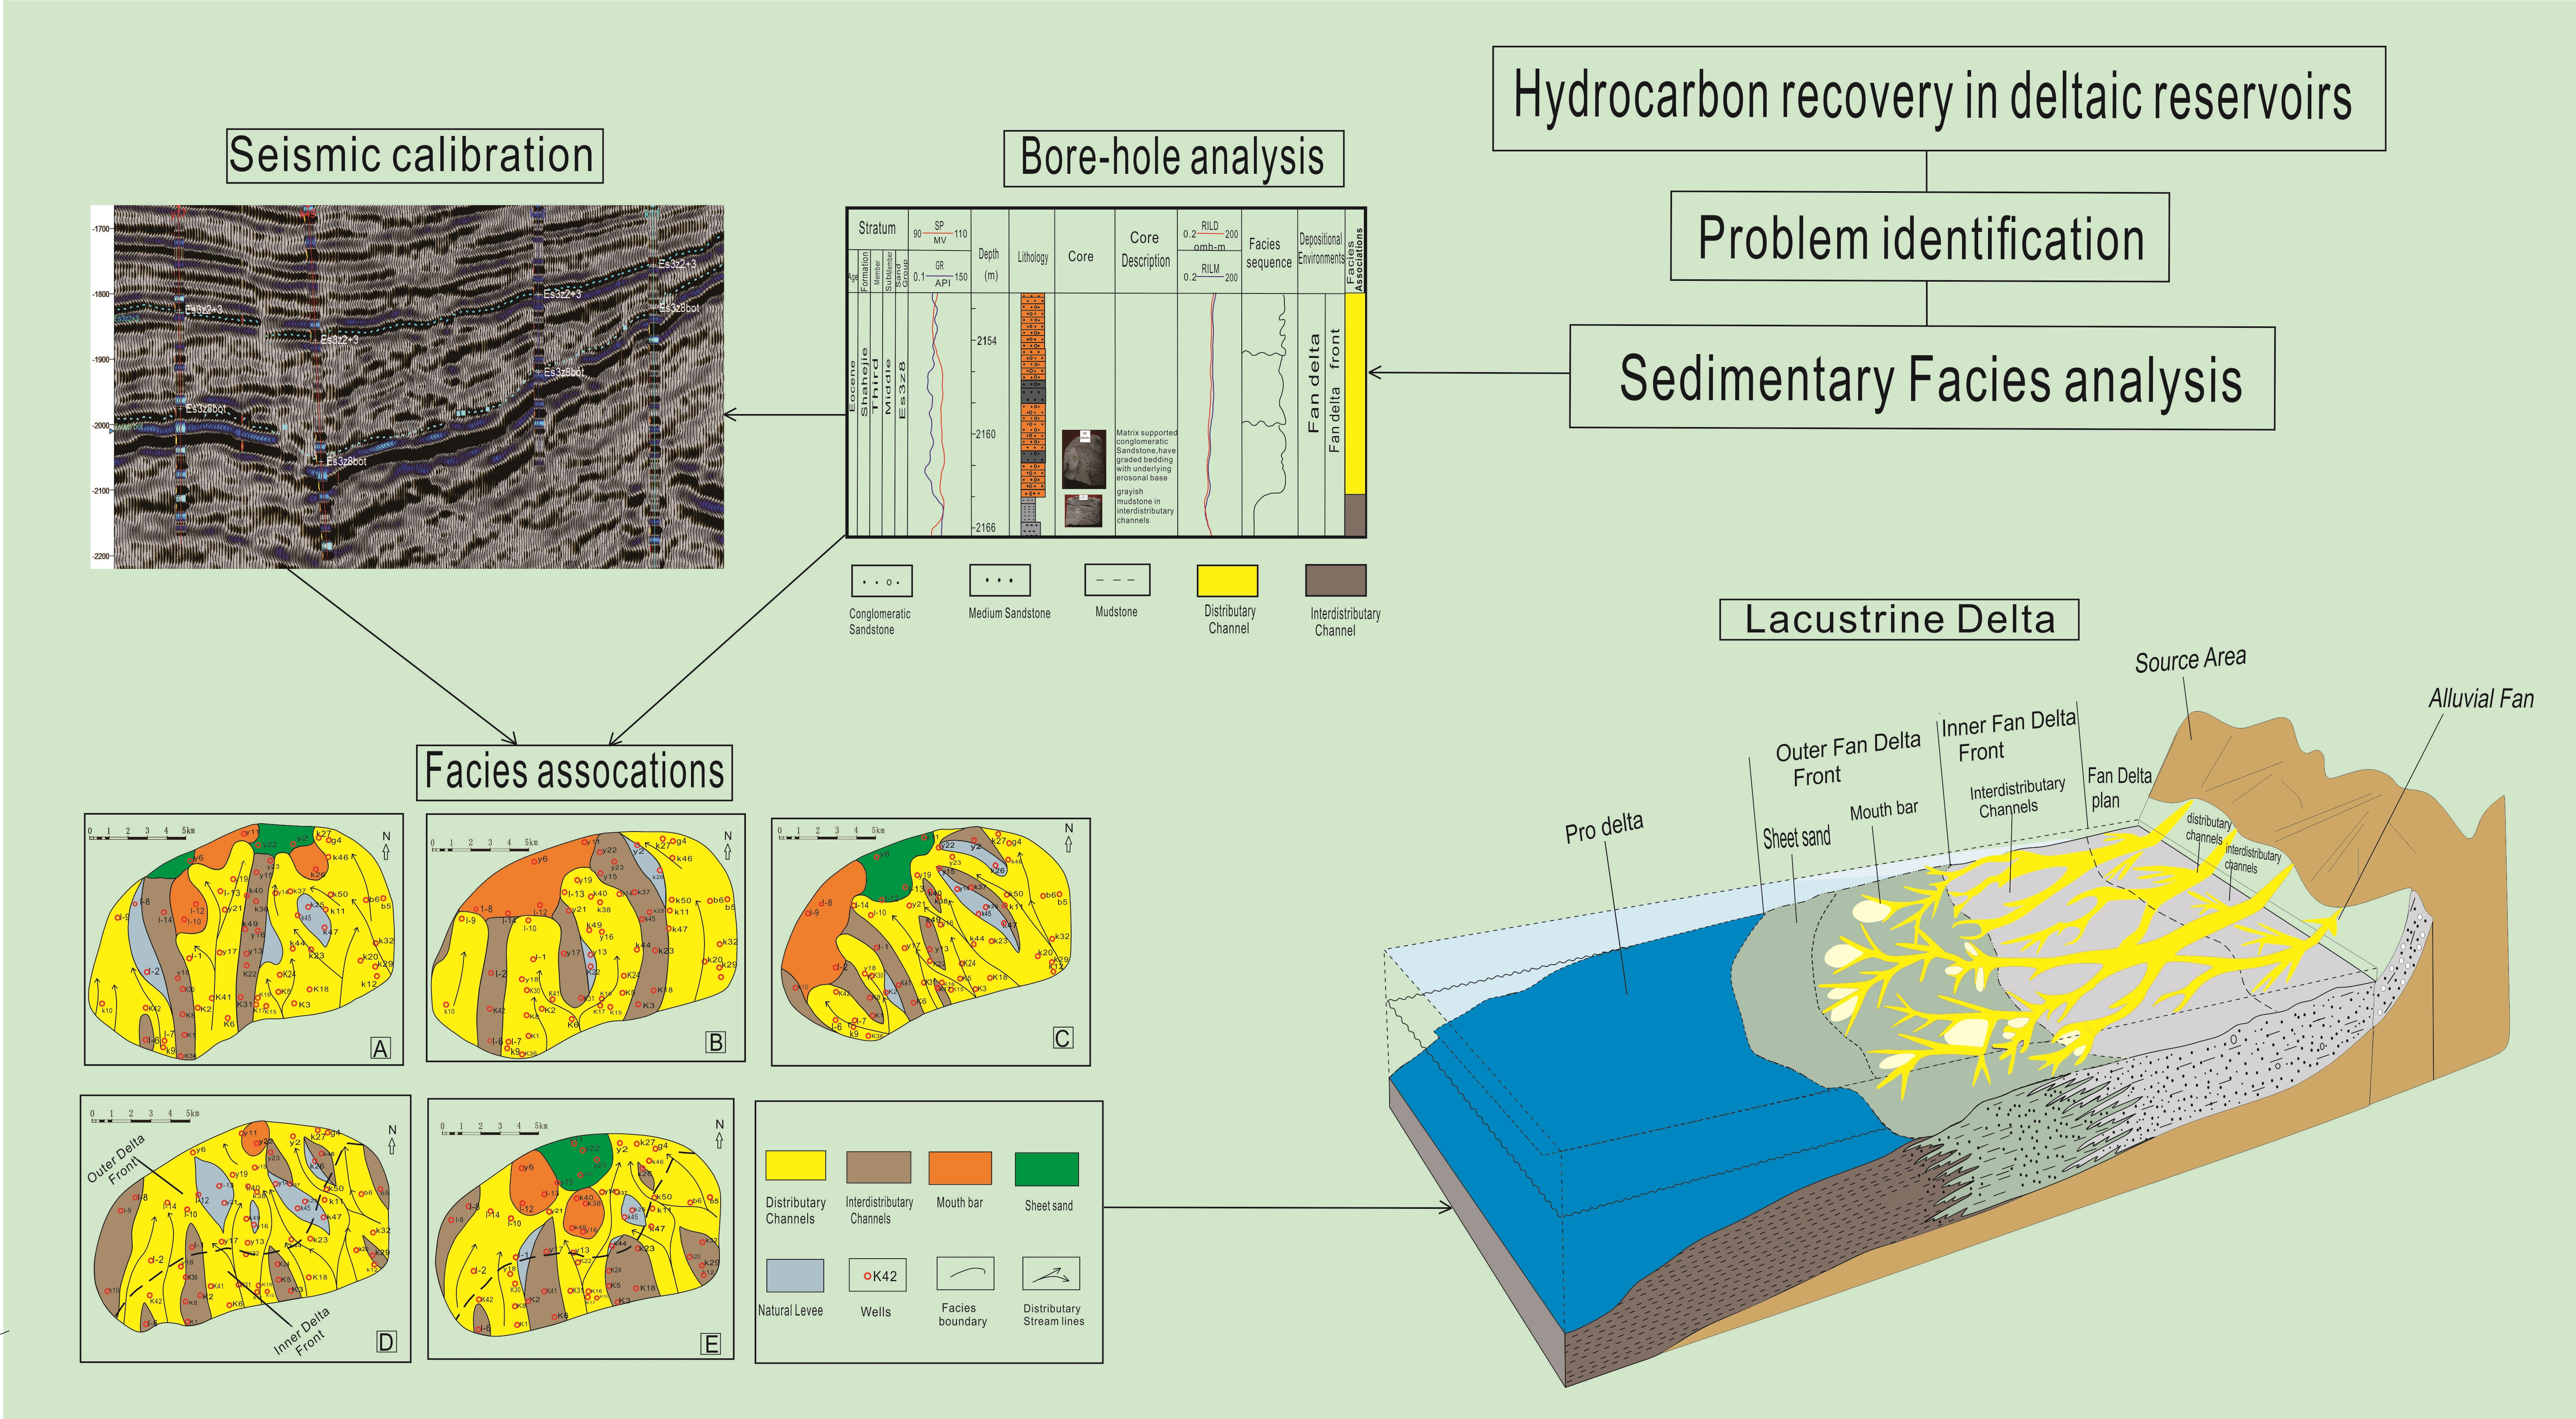
3. Data and Methodology
4. Results
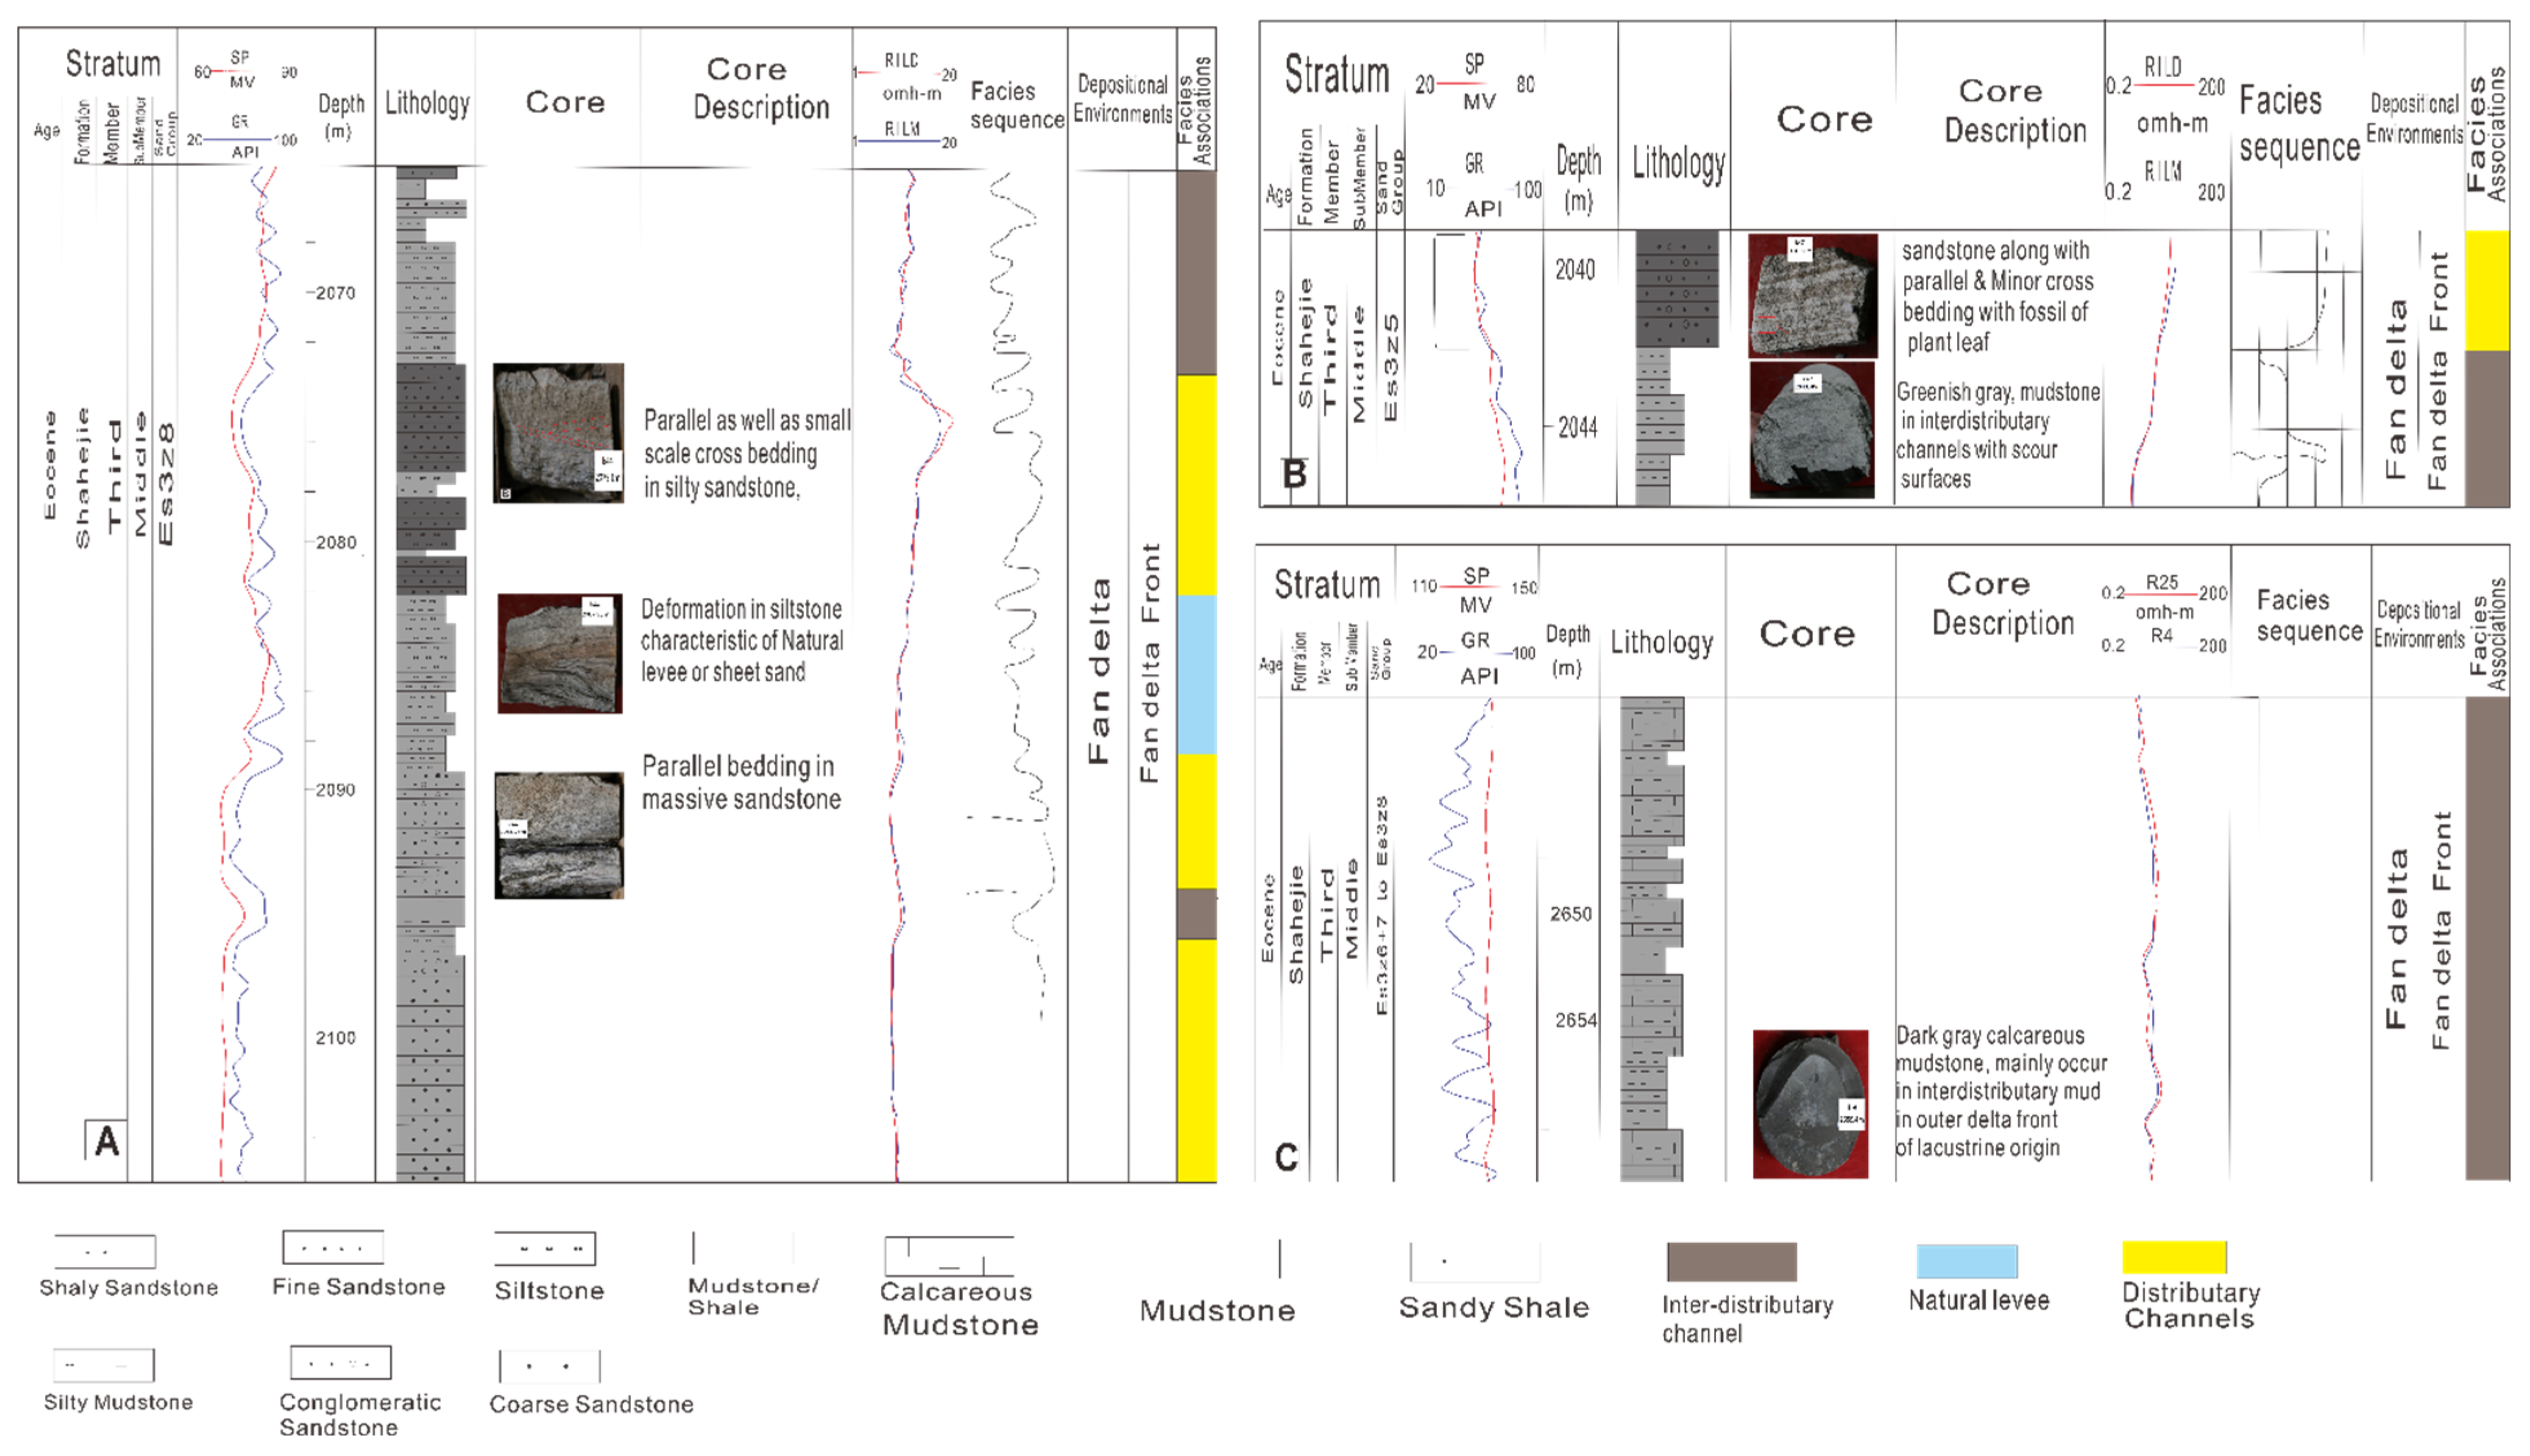
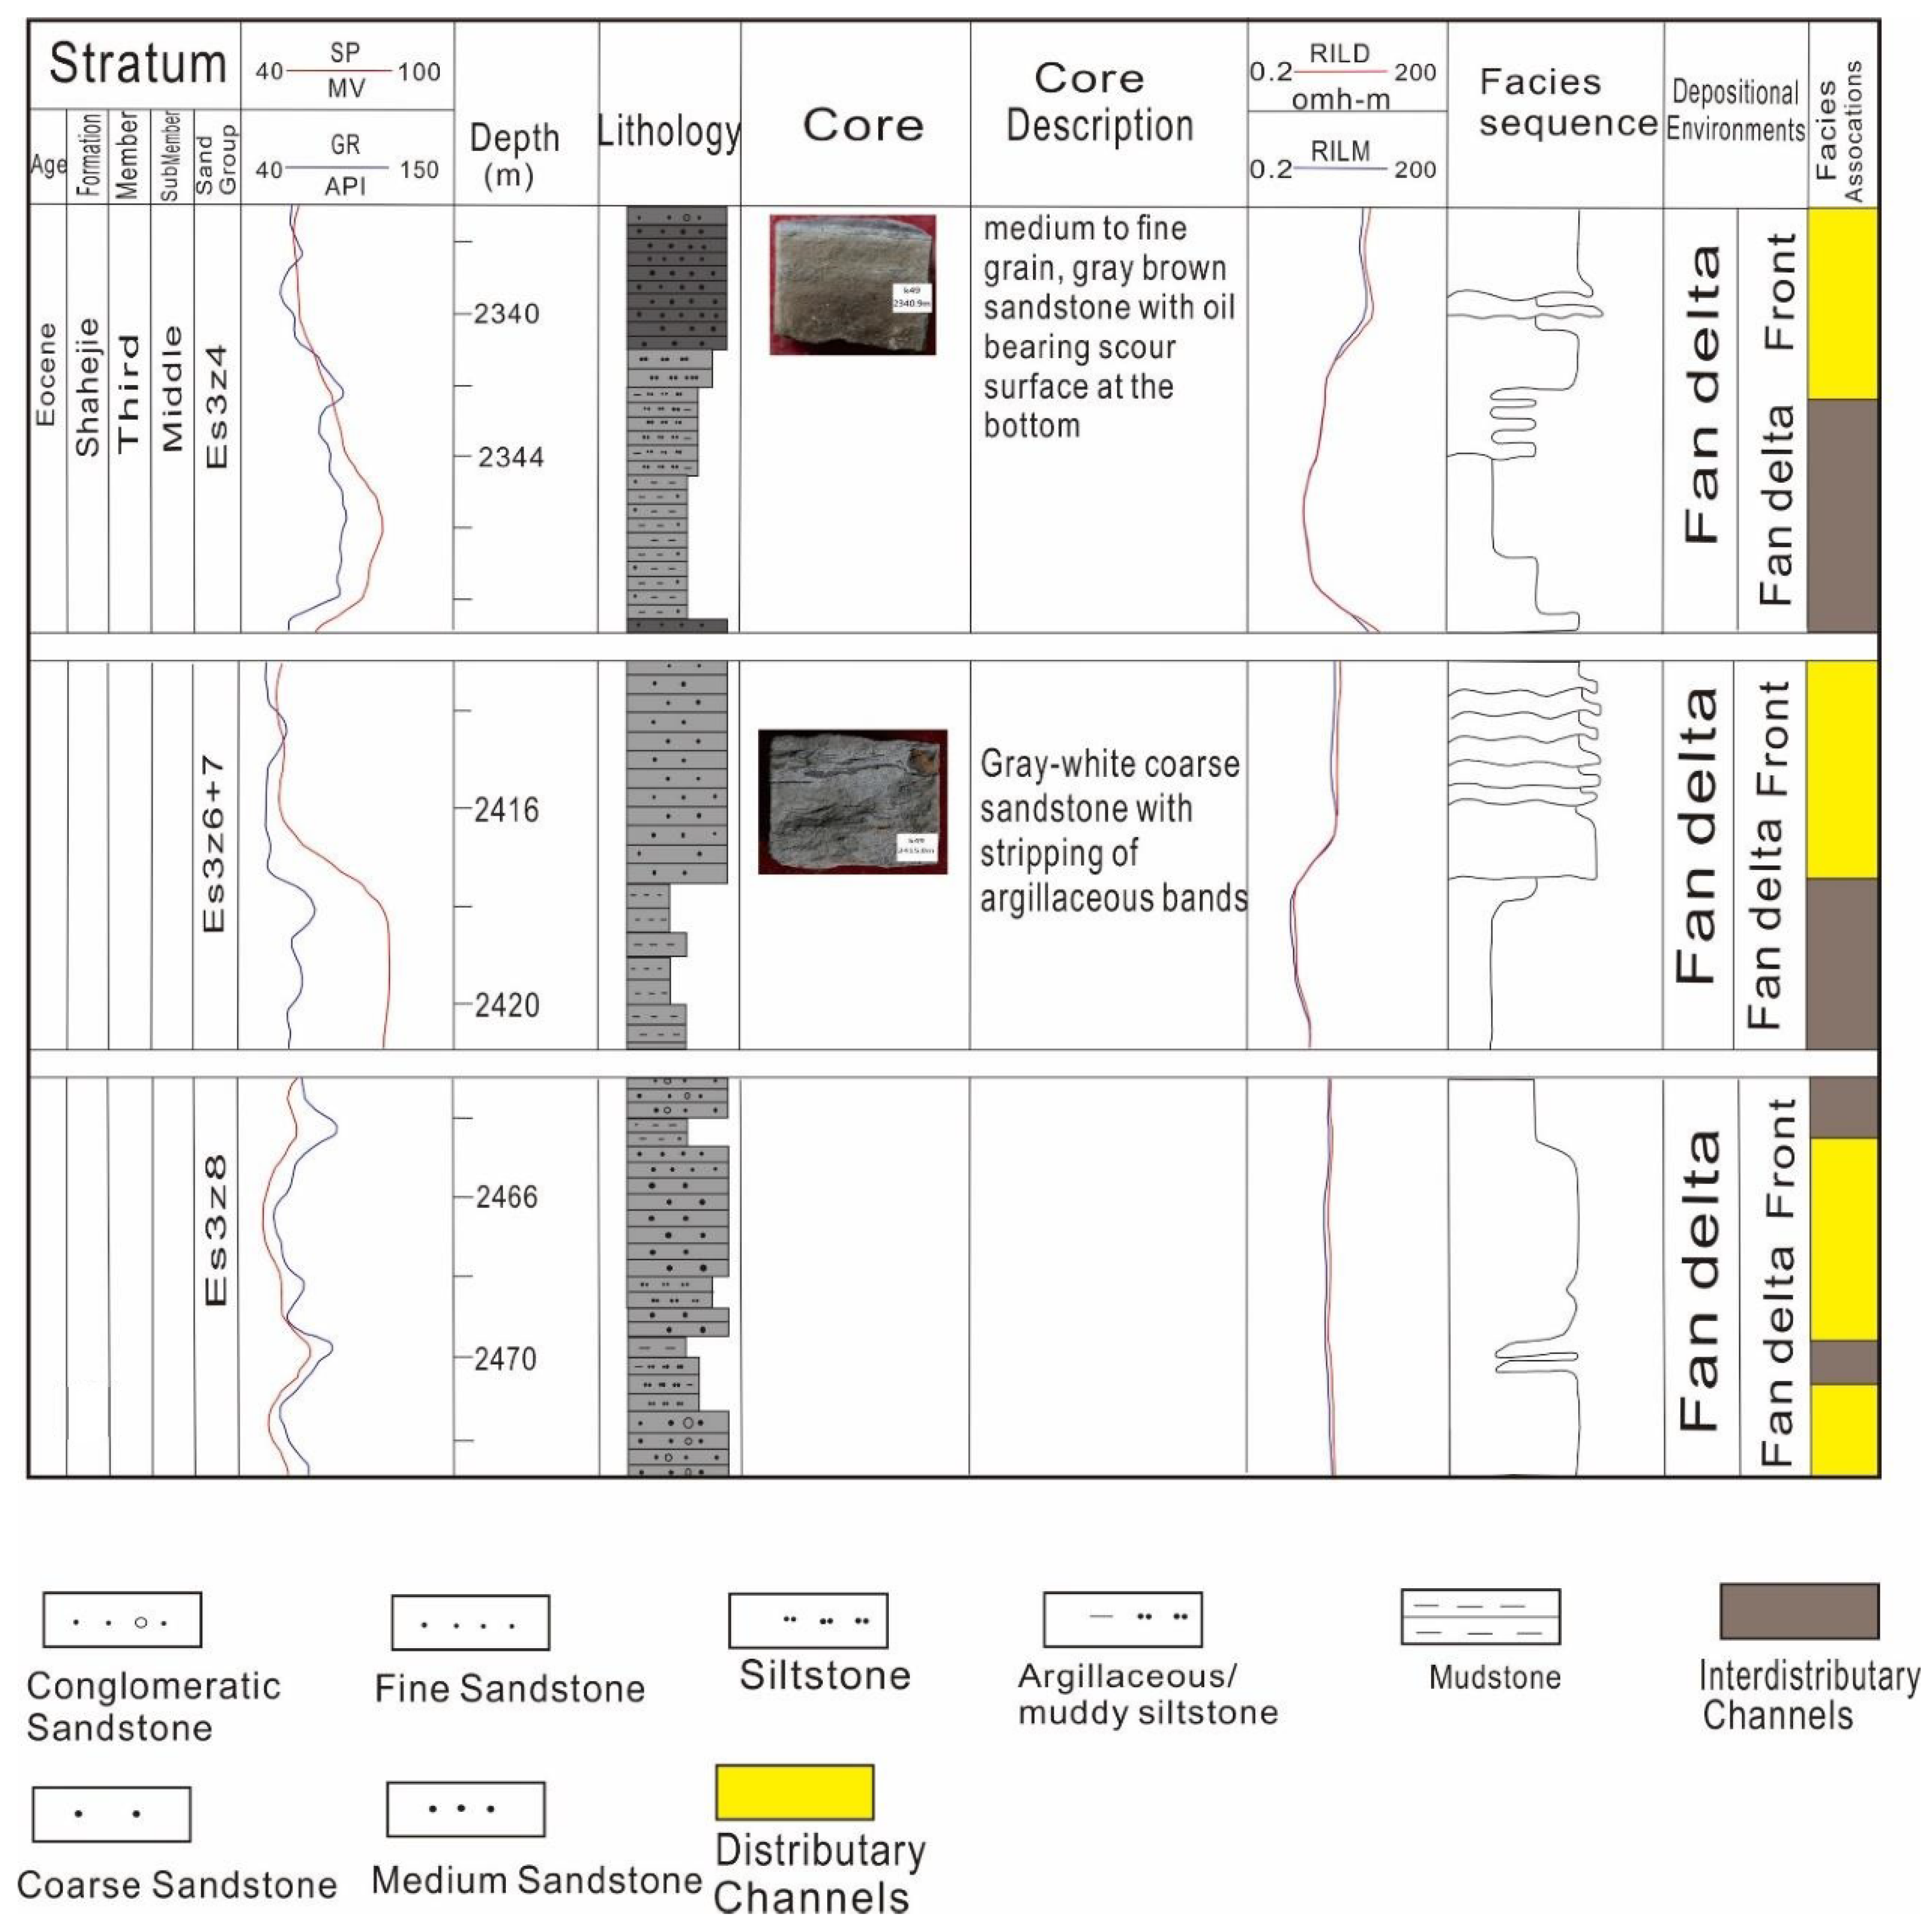
4.1. Mudstones with Associated Sedimentary-Lithofacies Analysis
4.2. Siltstones with Associated Sedimentary-Lithofacies Analysis
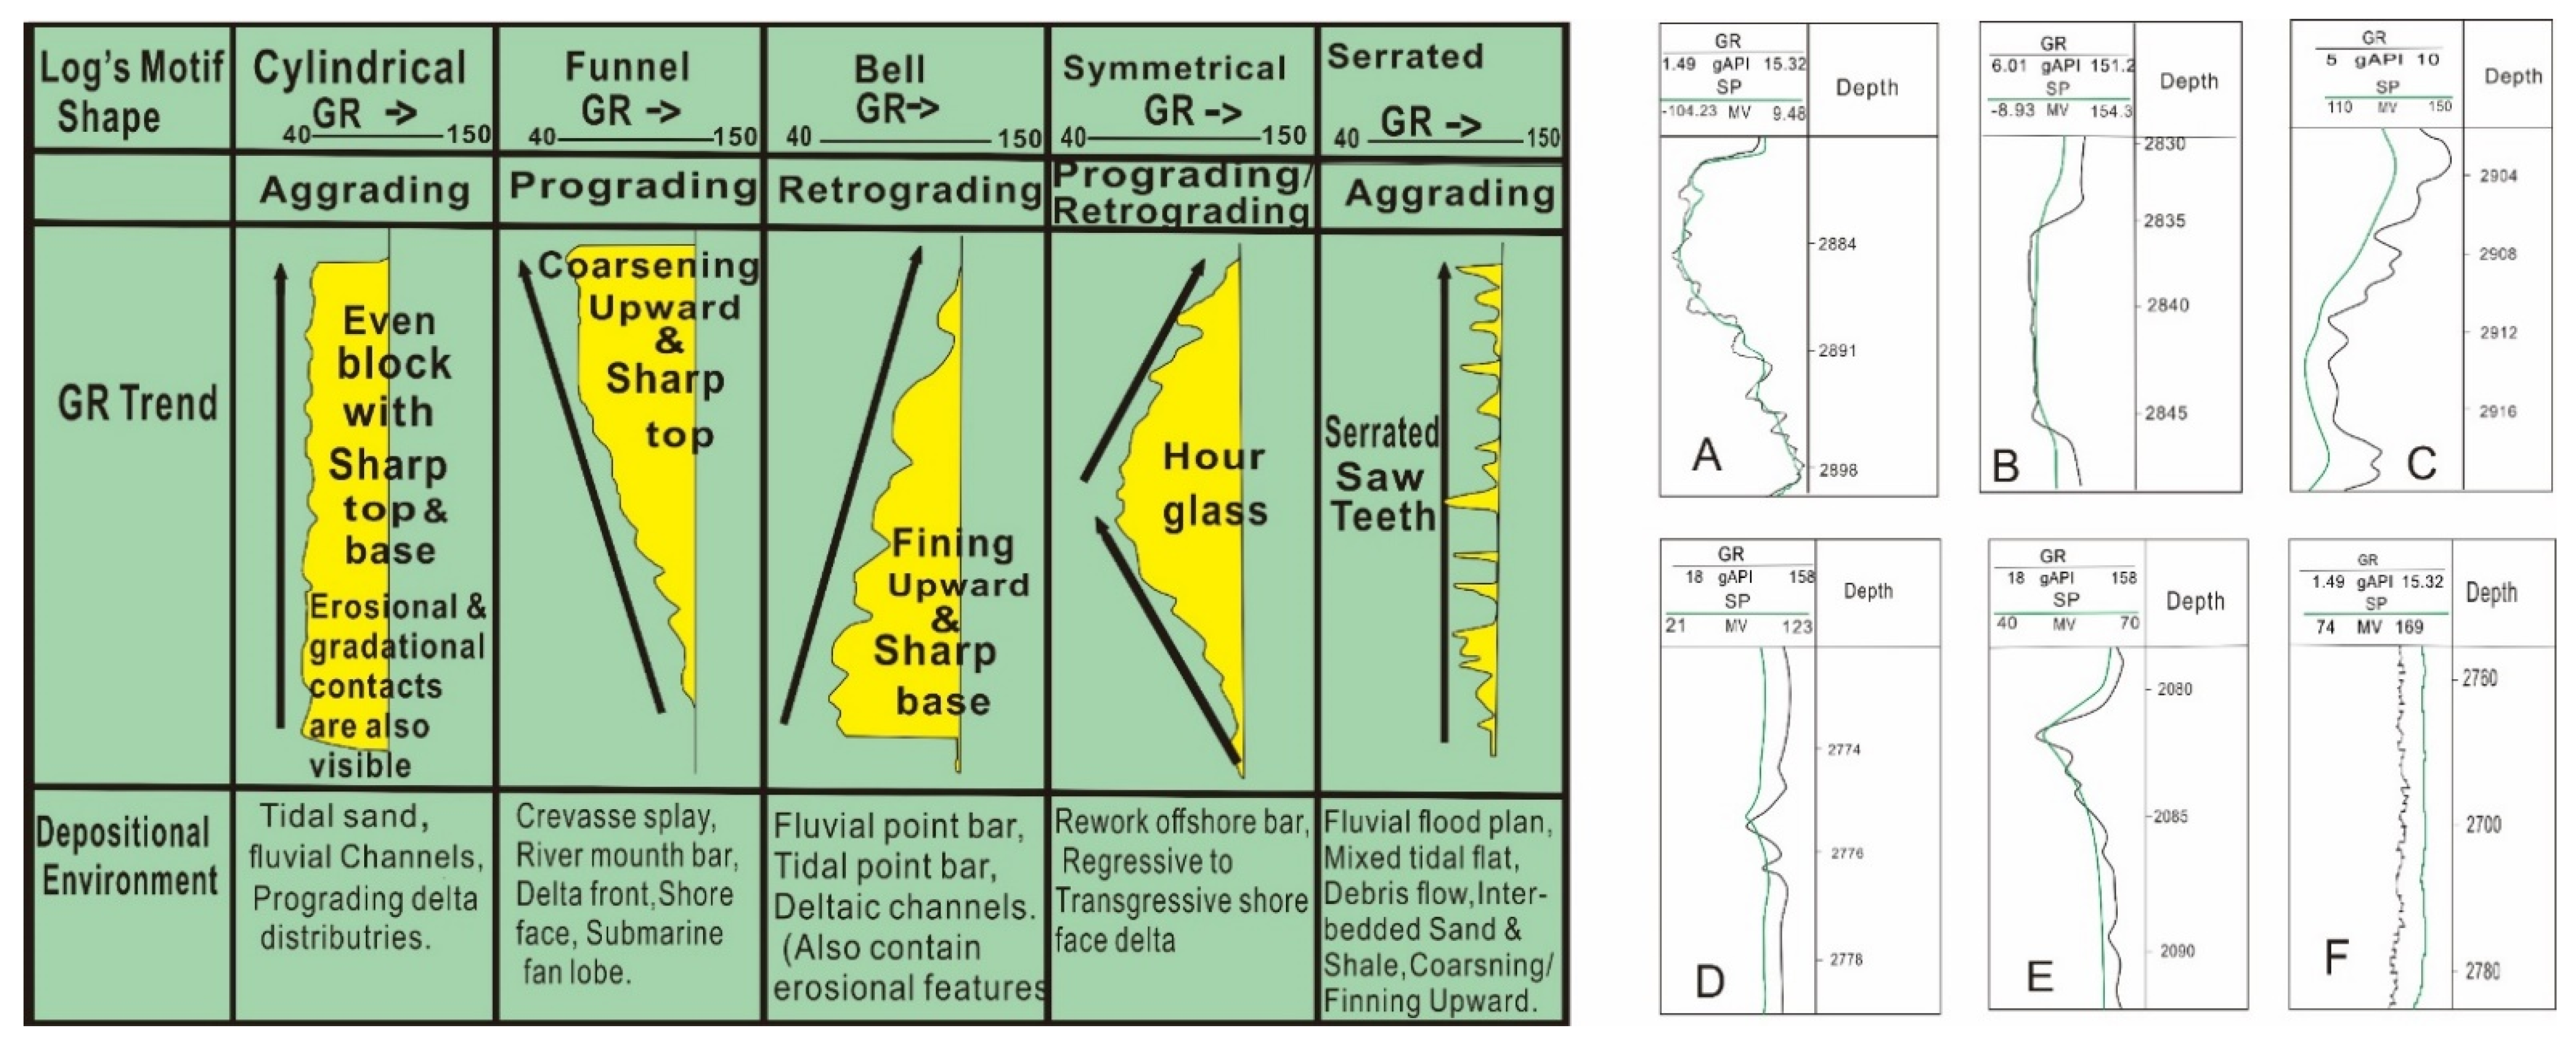
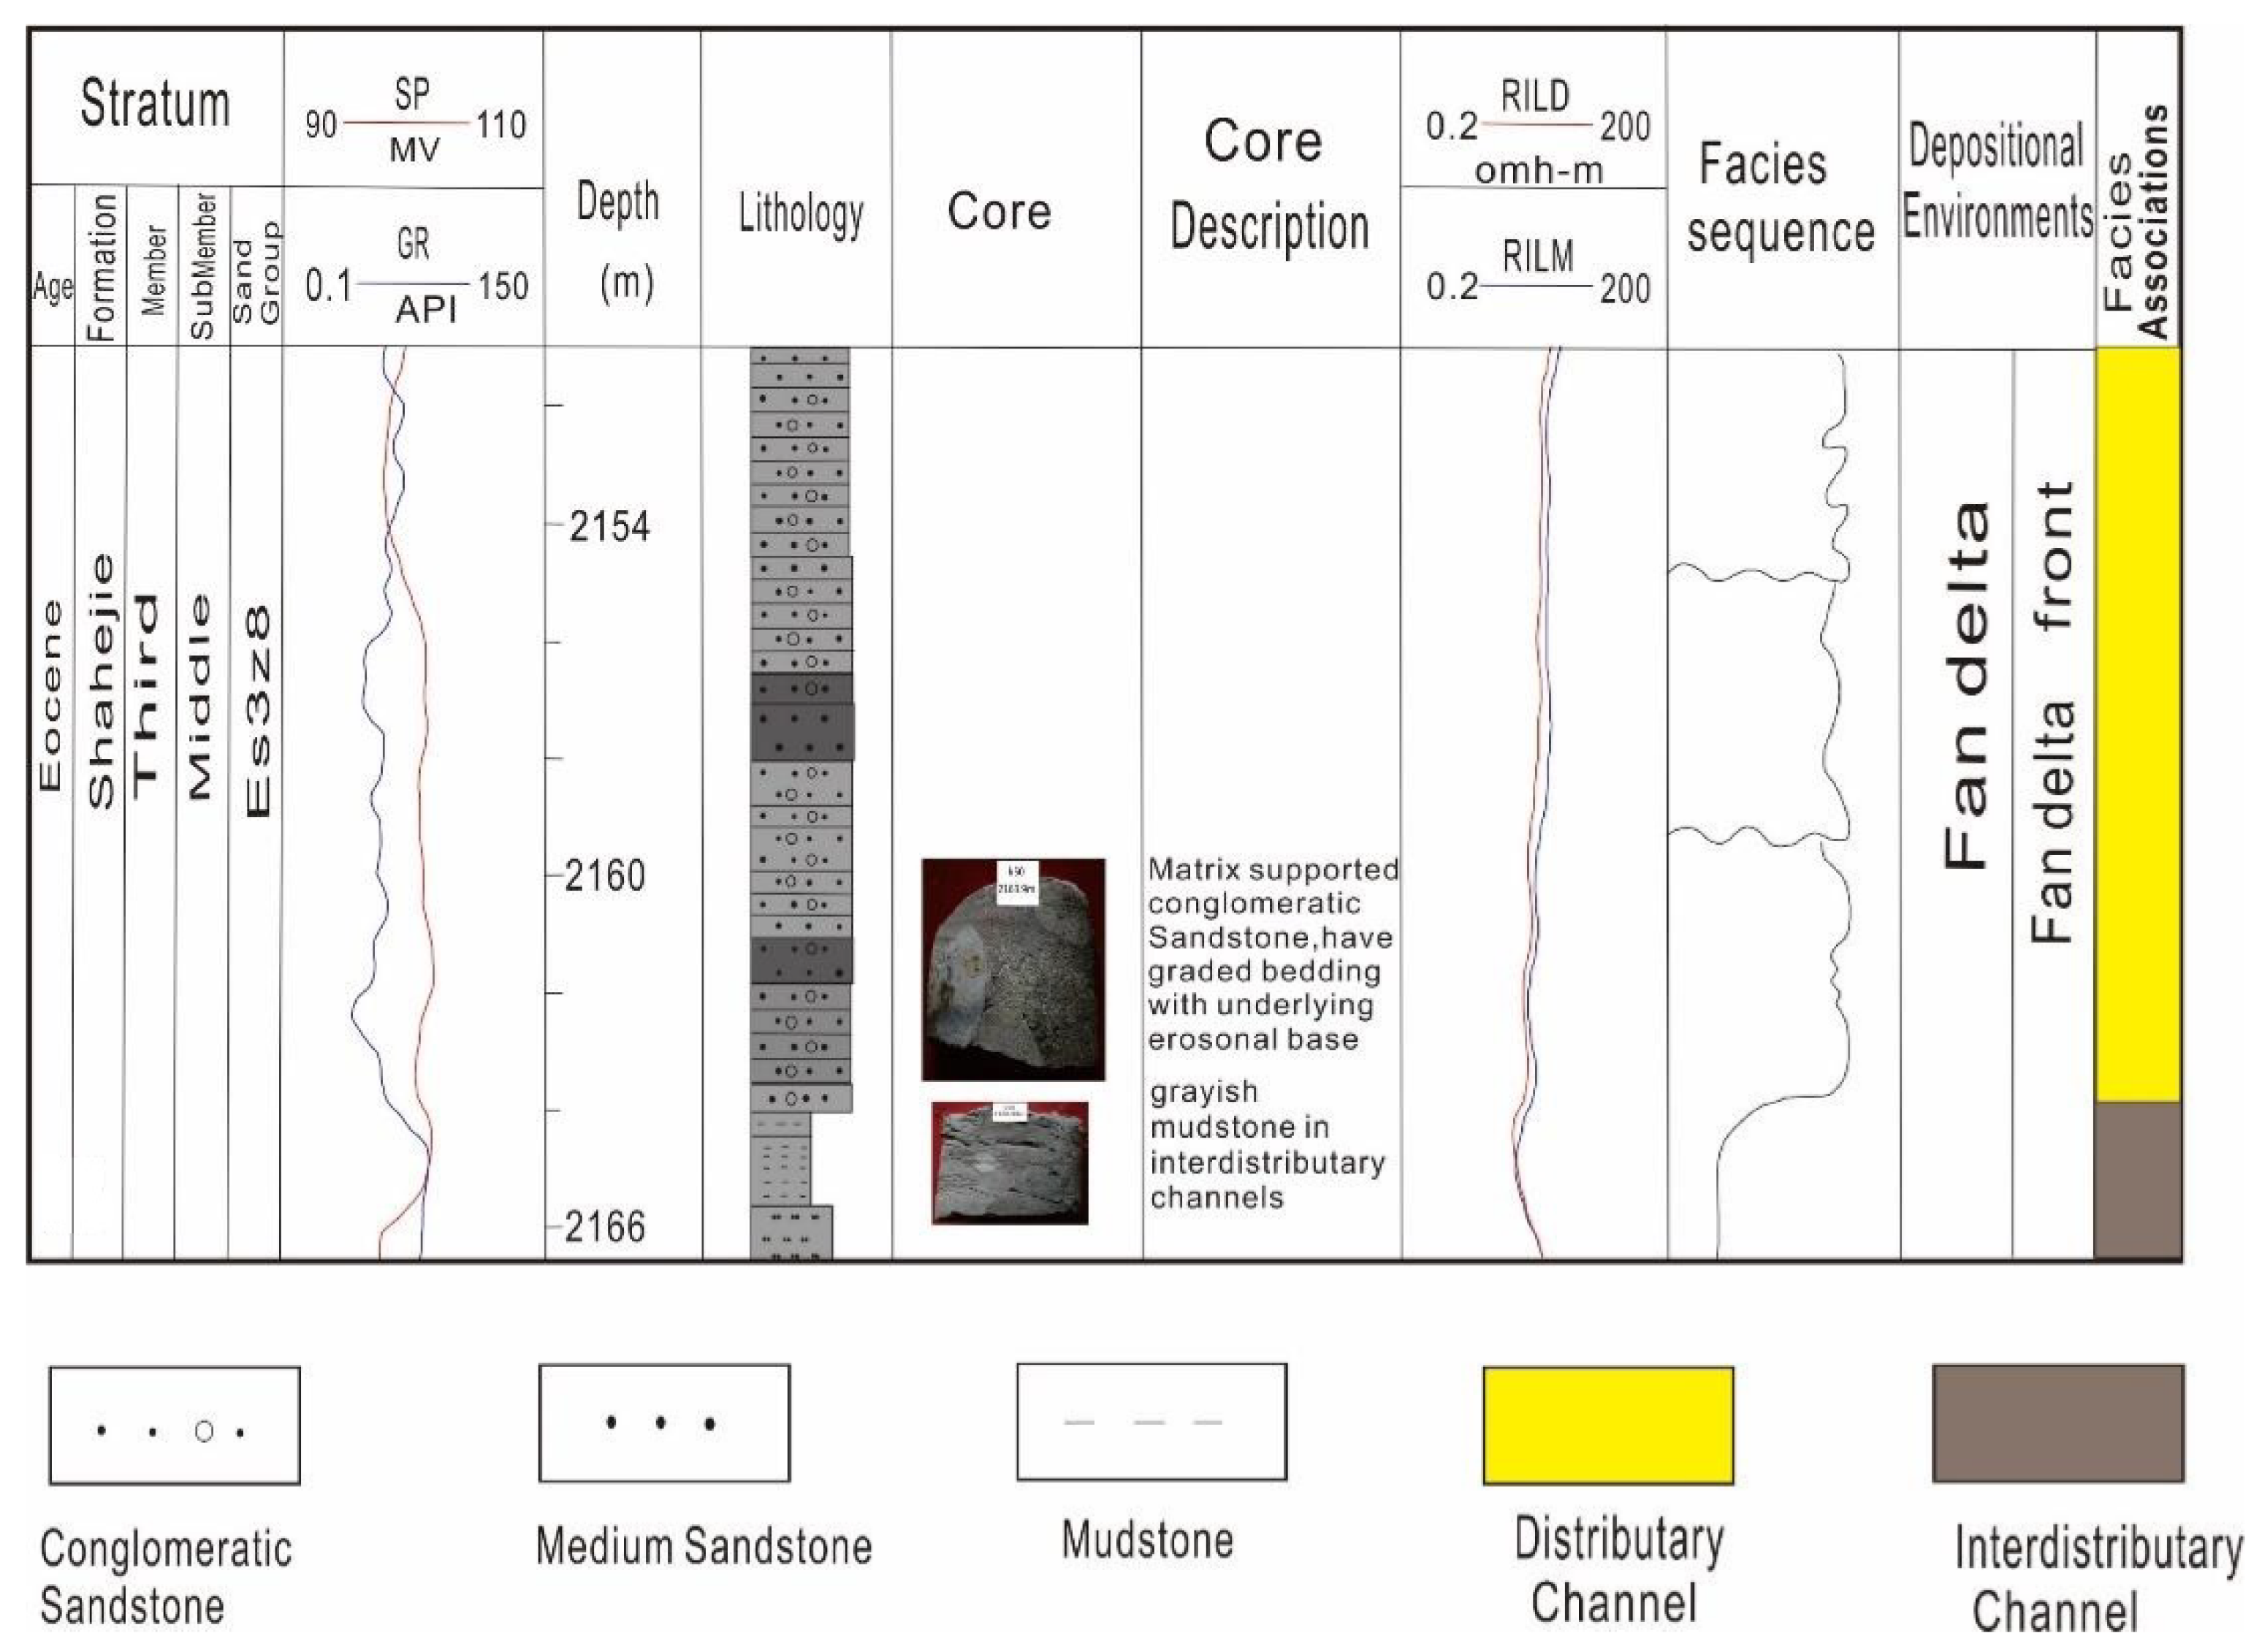
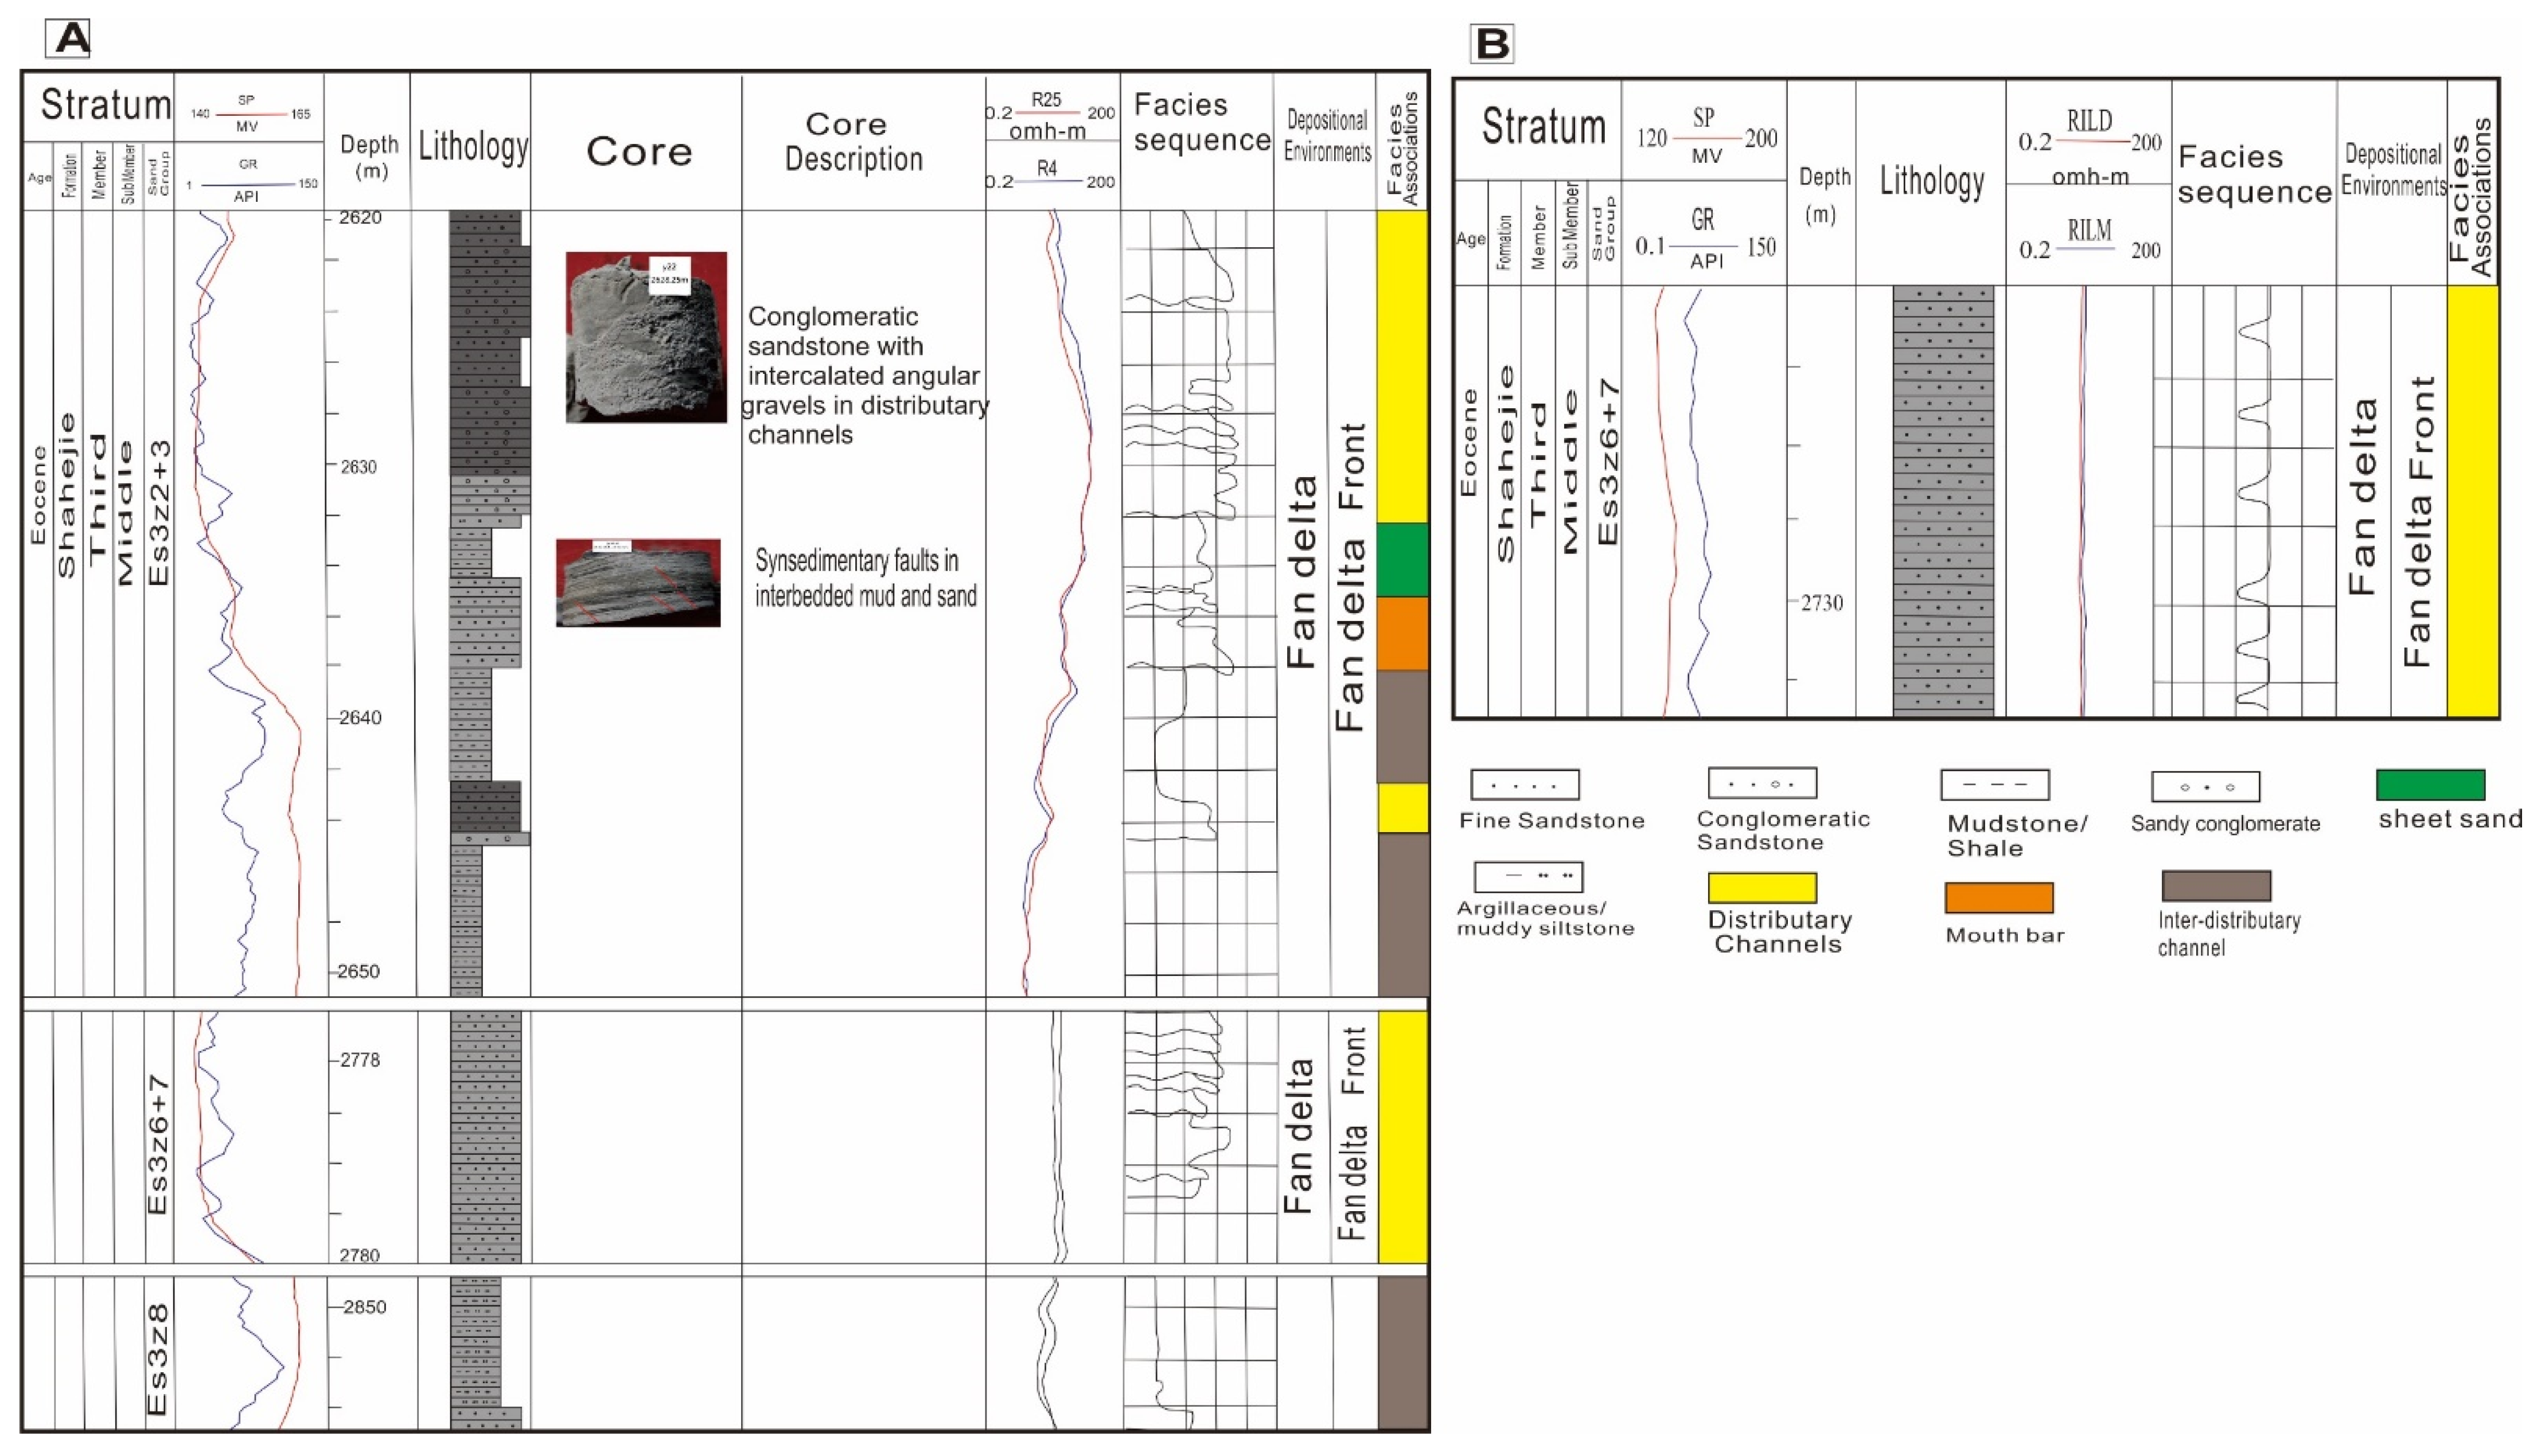
4.3. Sandstones with Associated Sedimentary-Lithofacies Analysis
5. Discussion
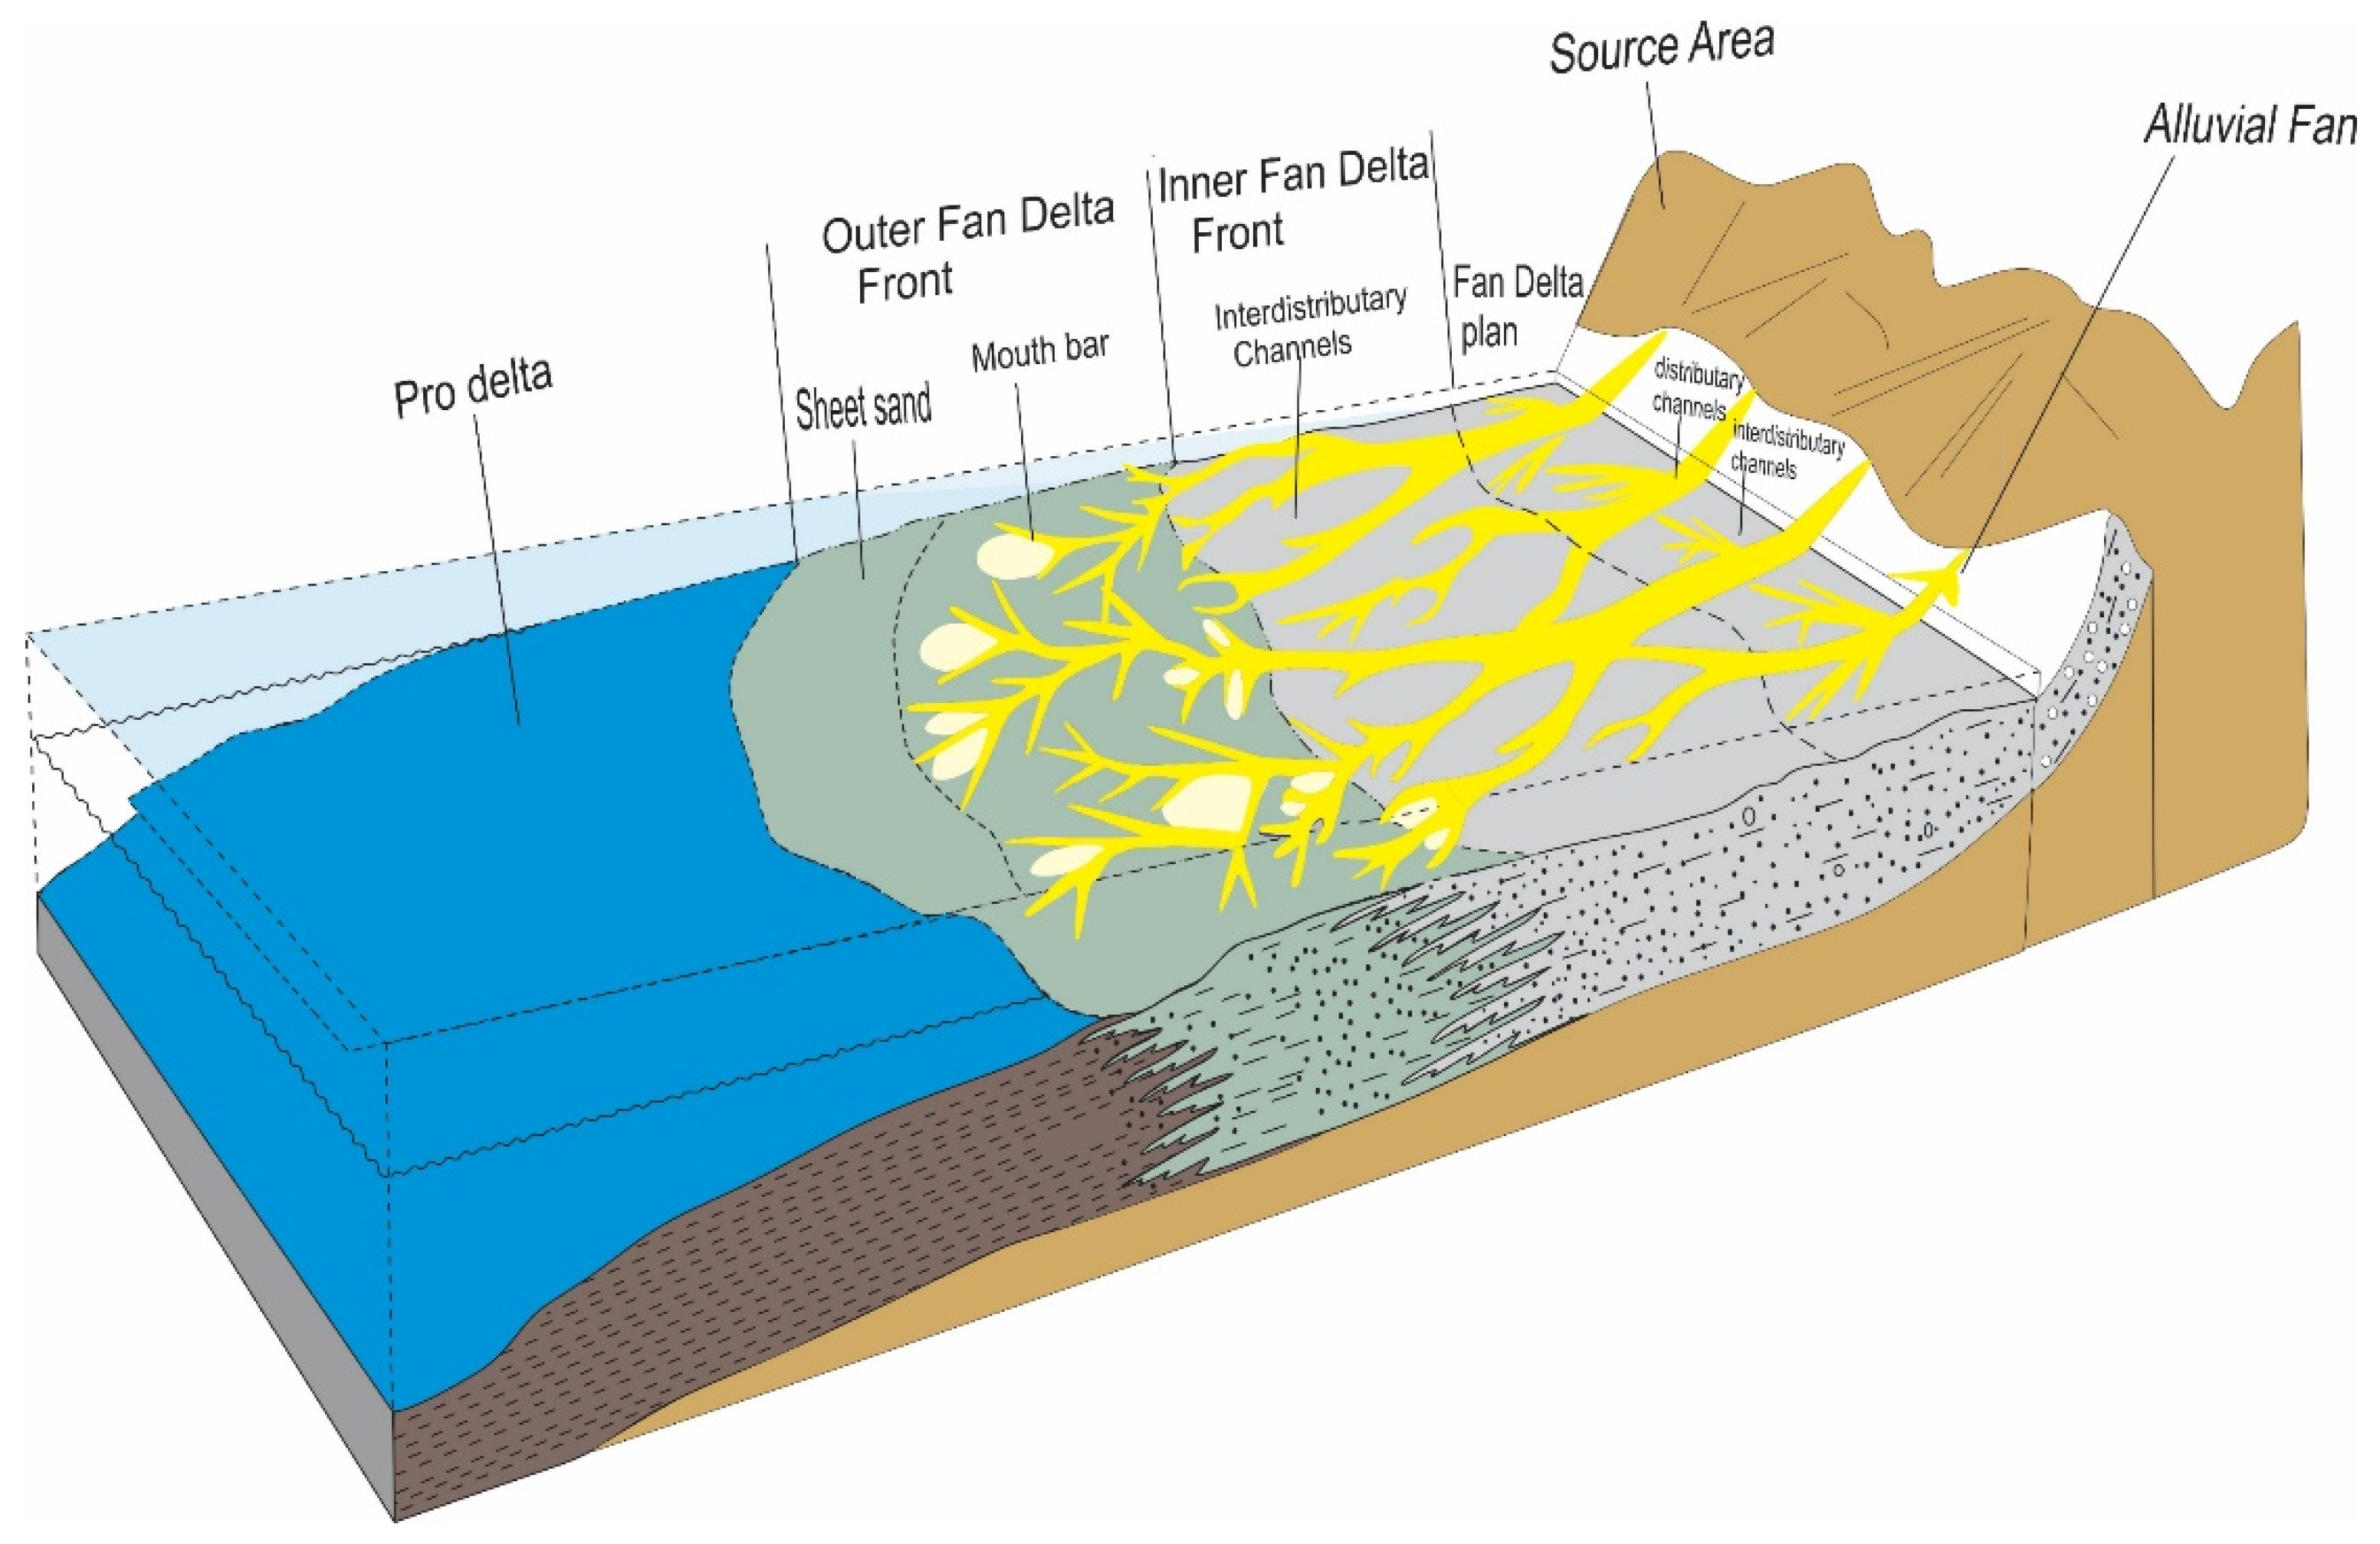
5.1. Depositional Facies Analysis
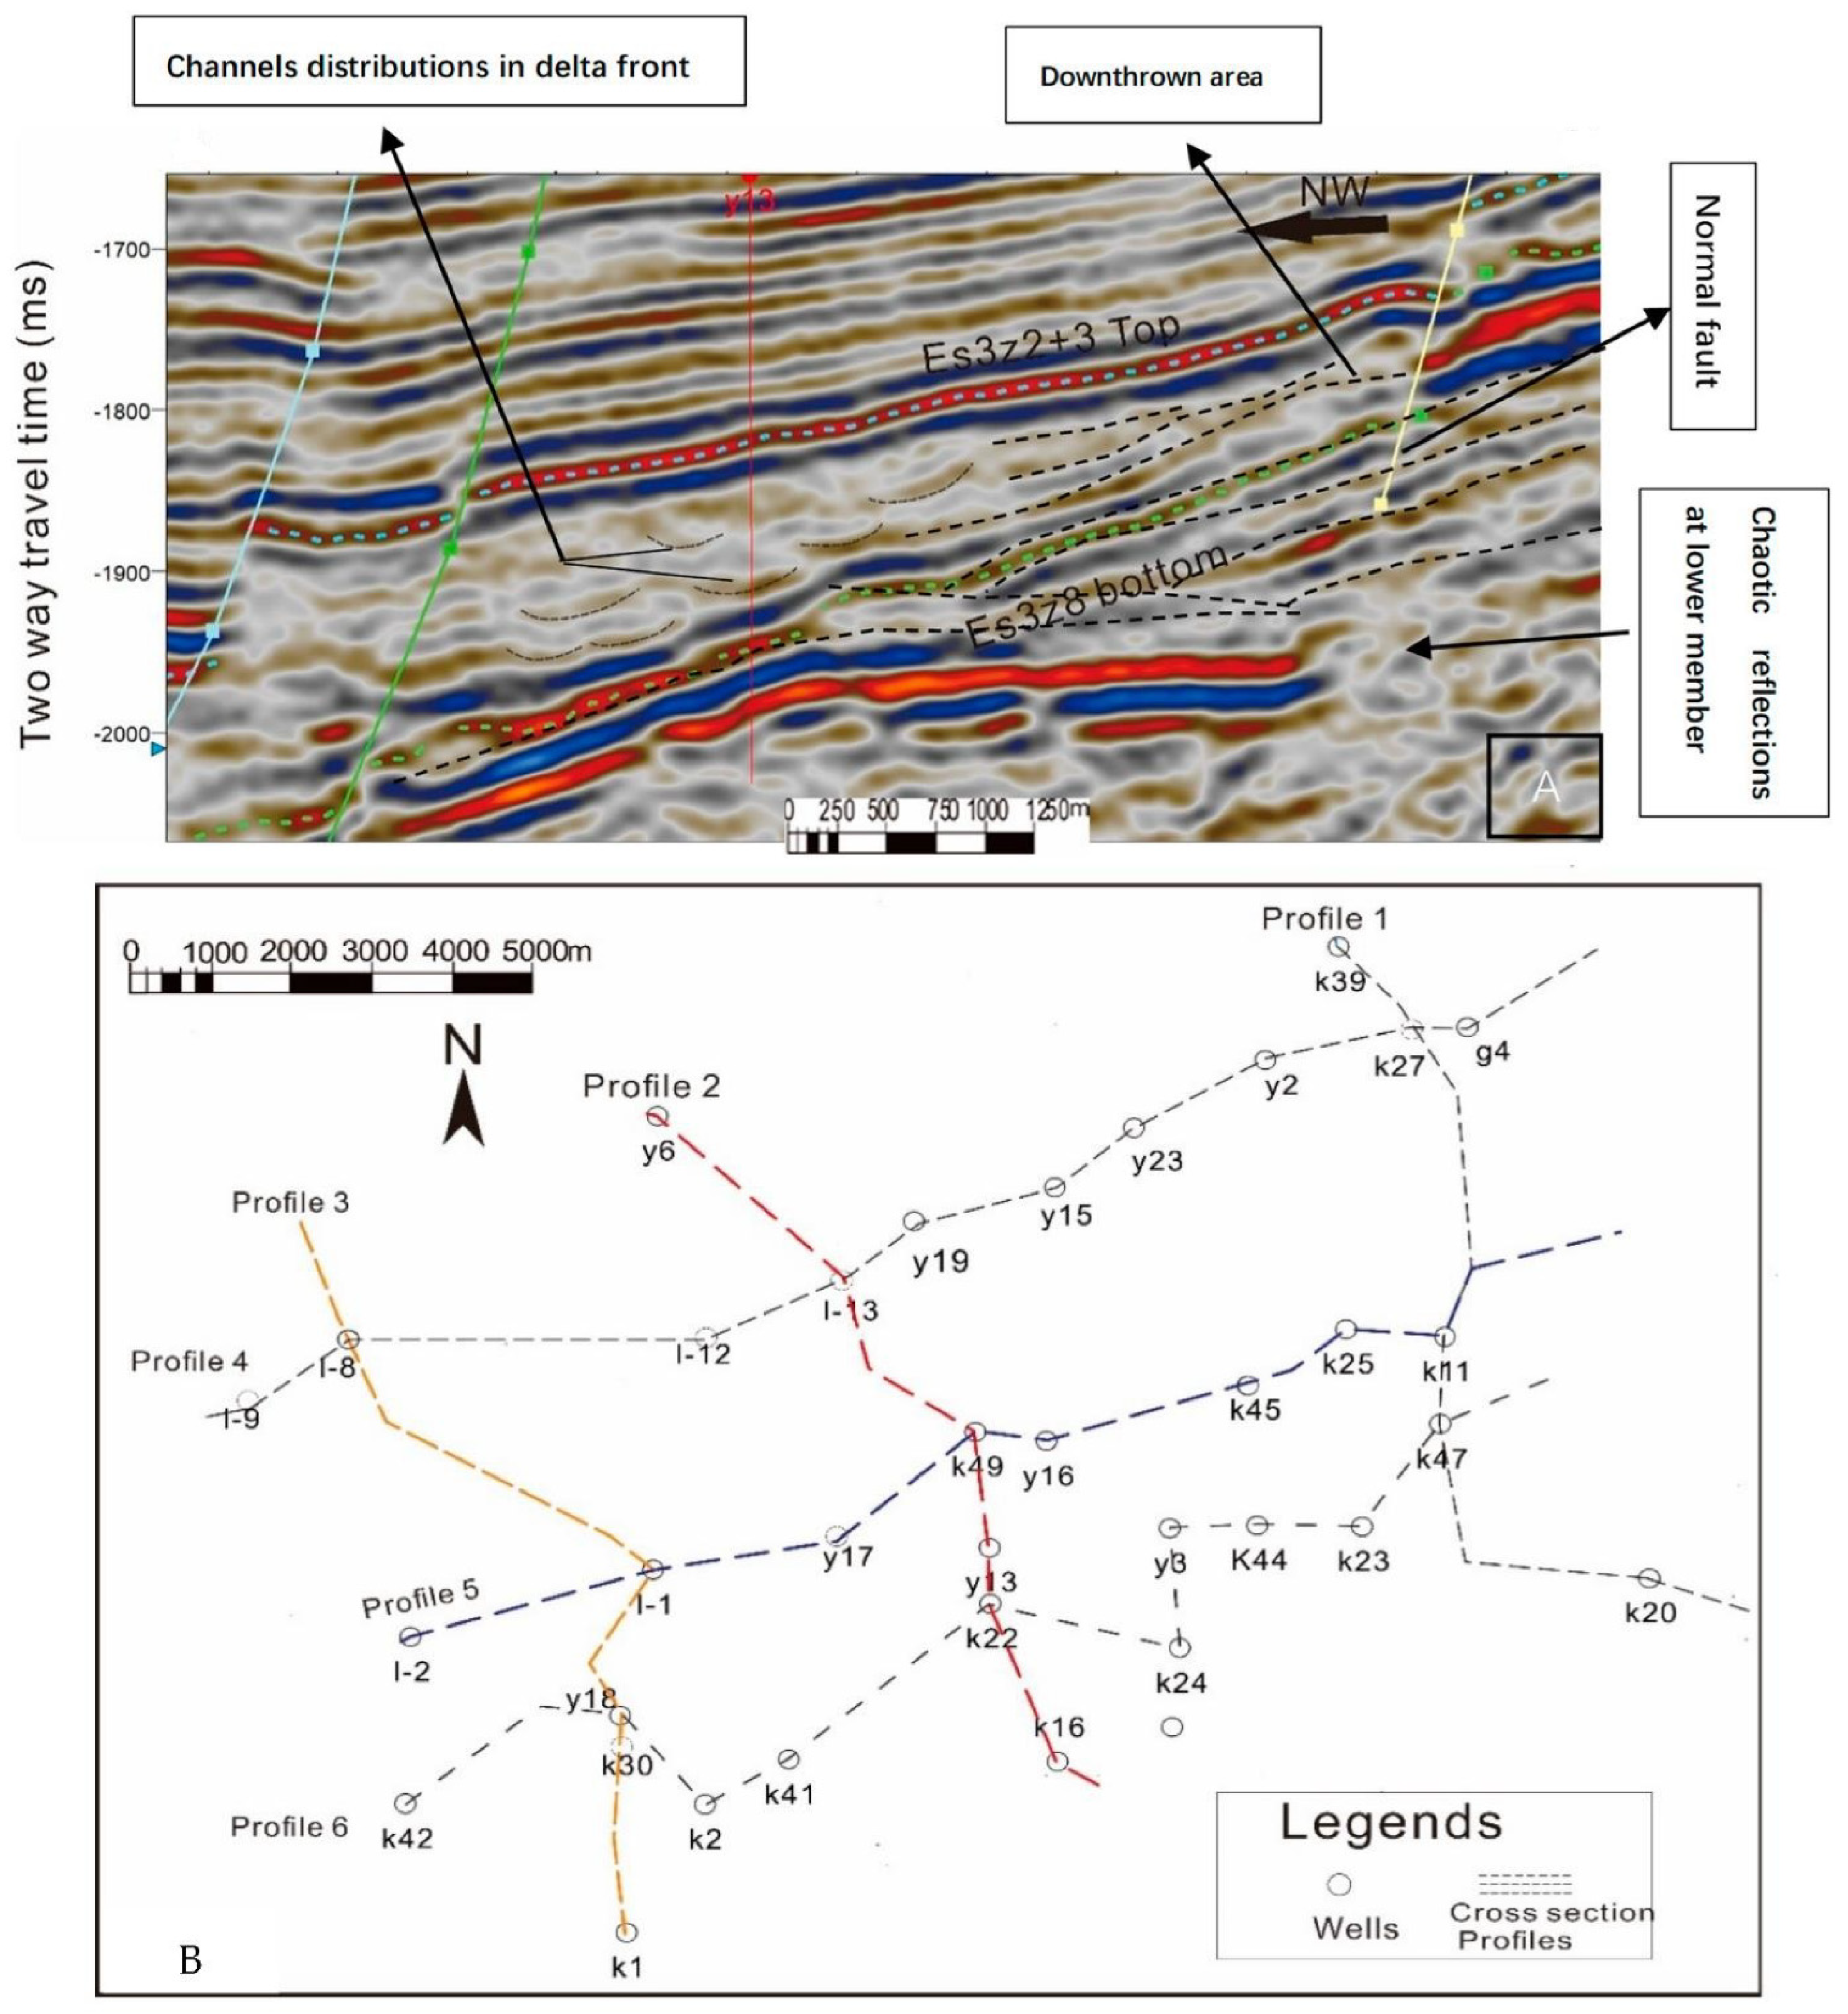
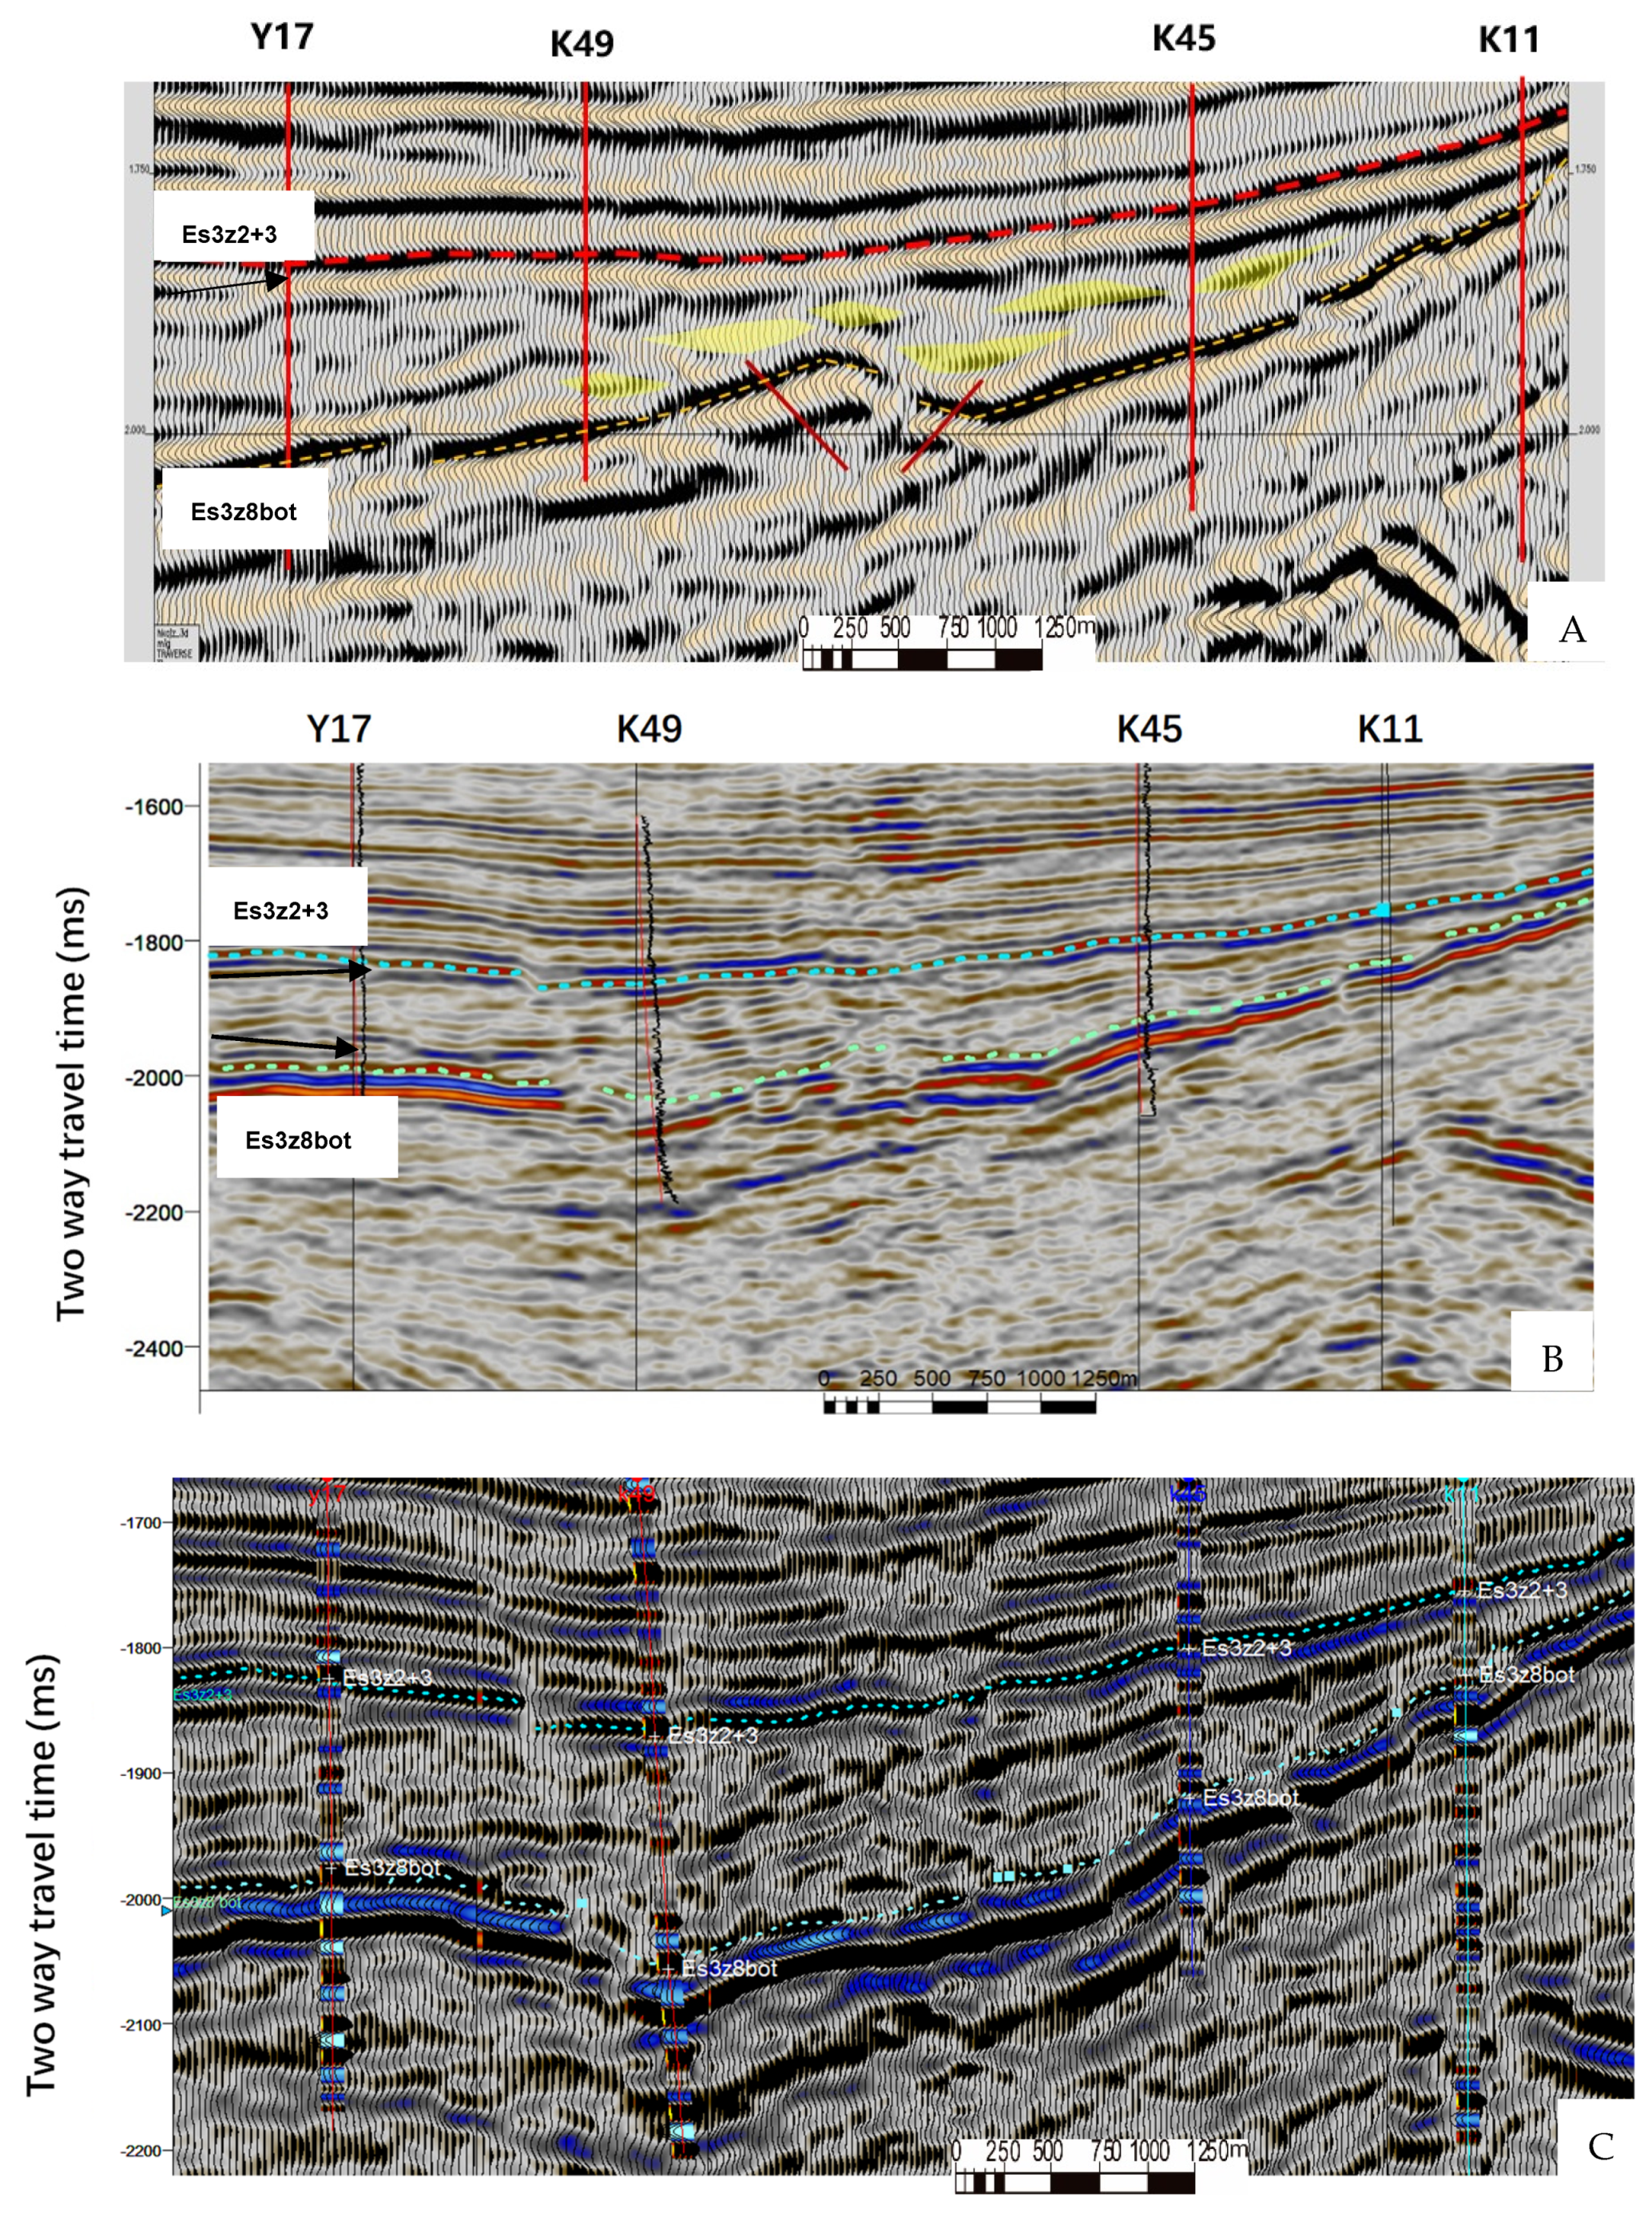
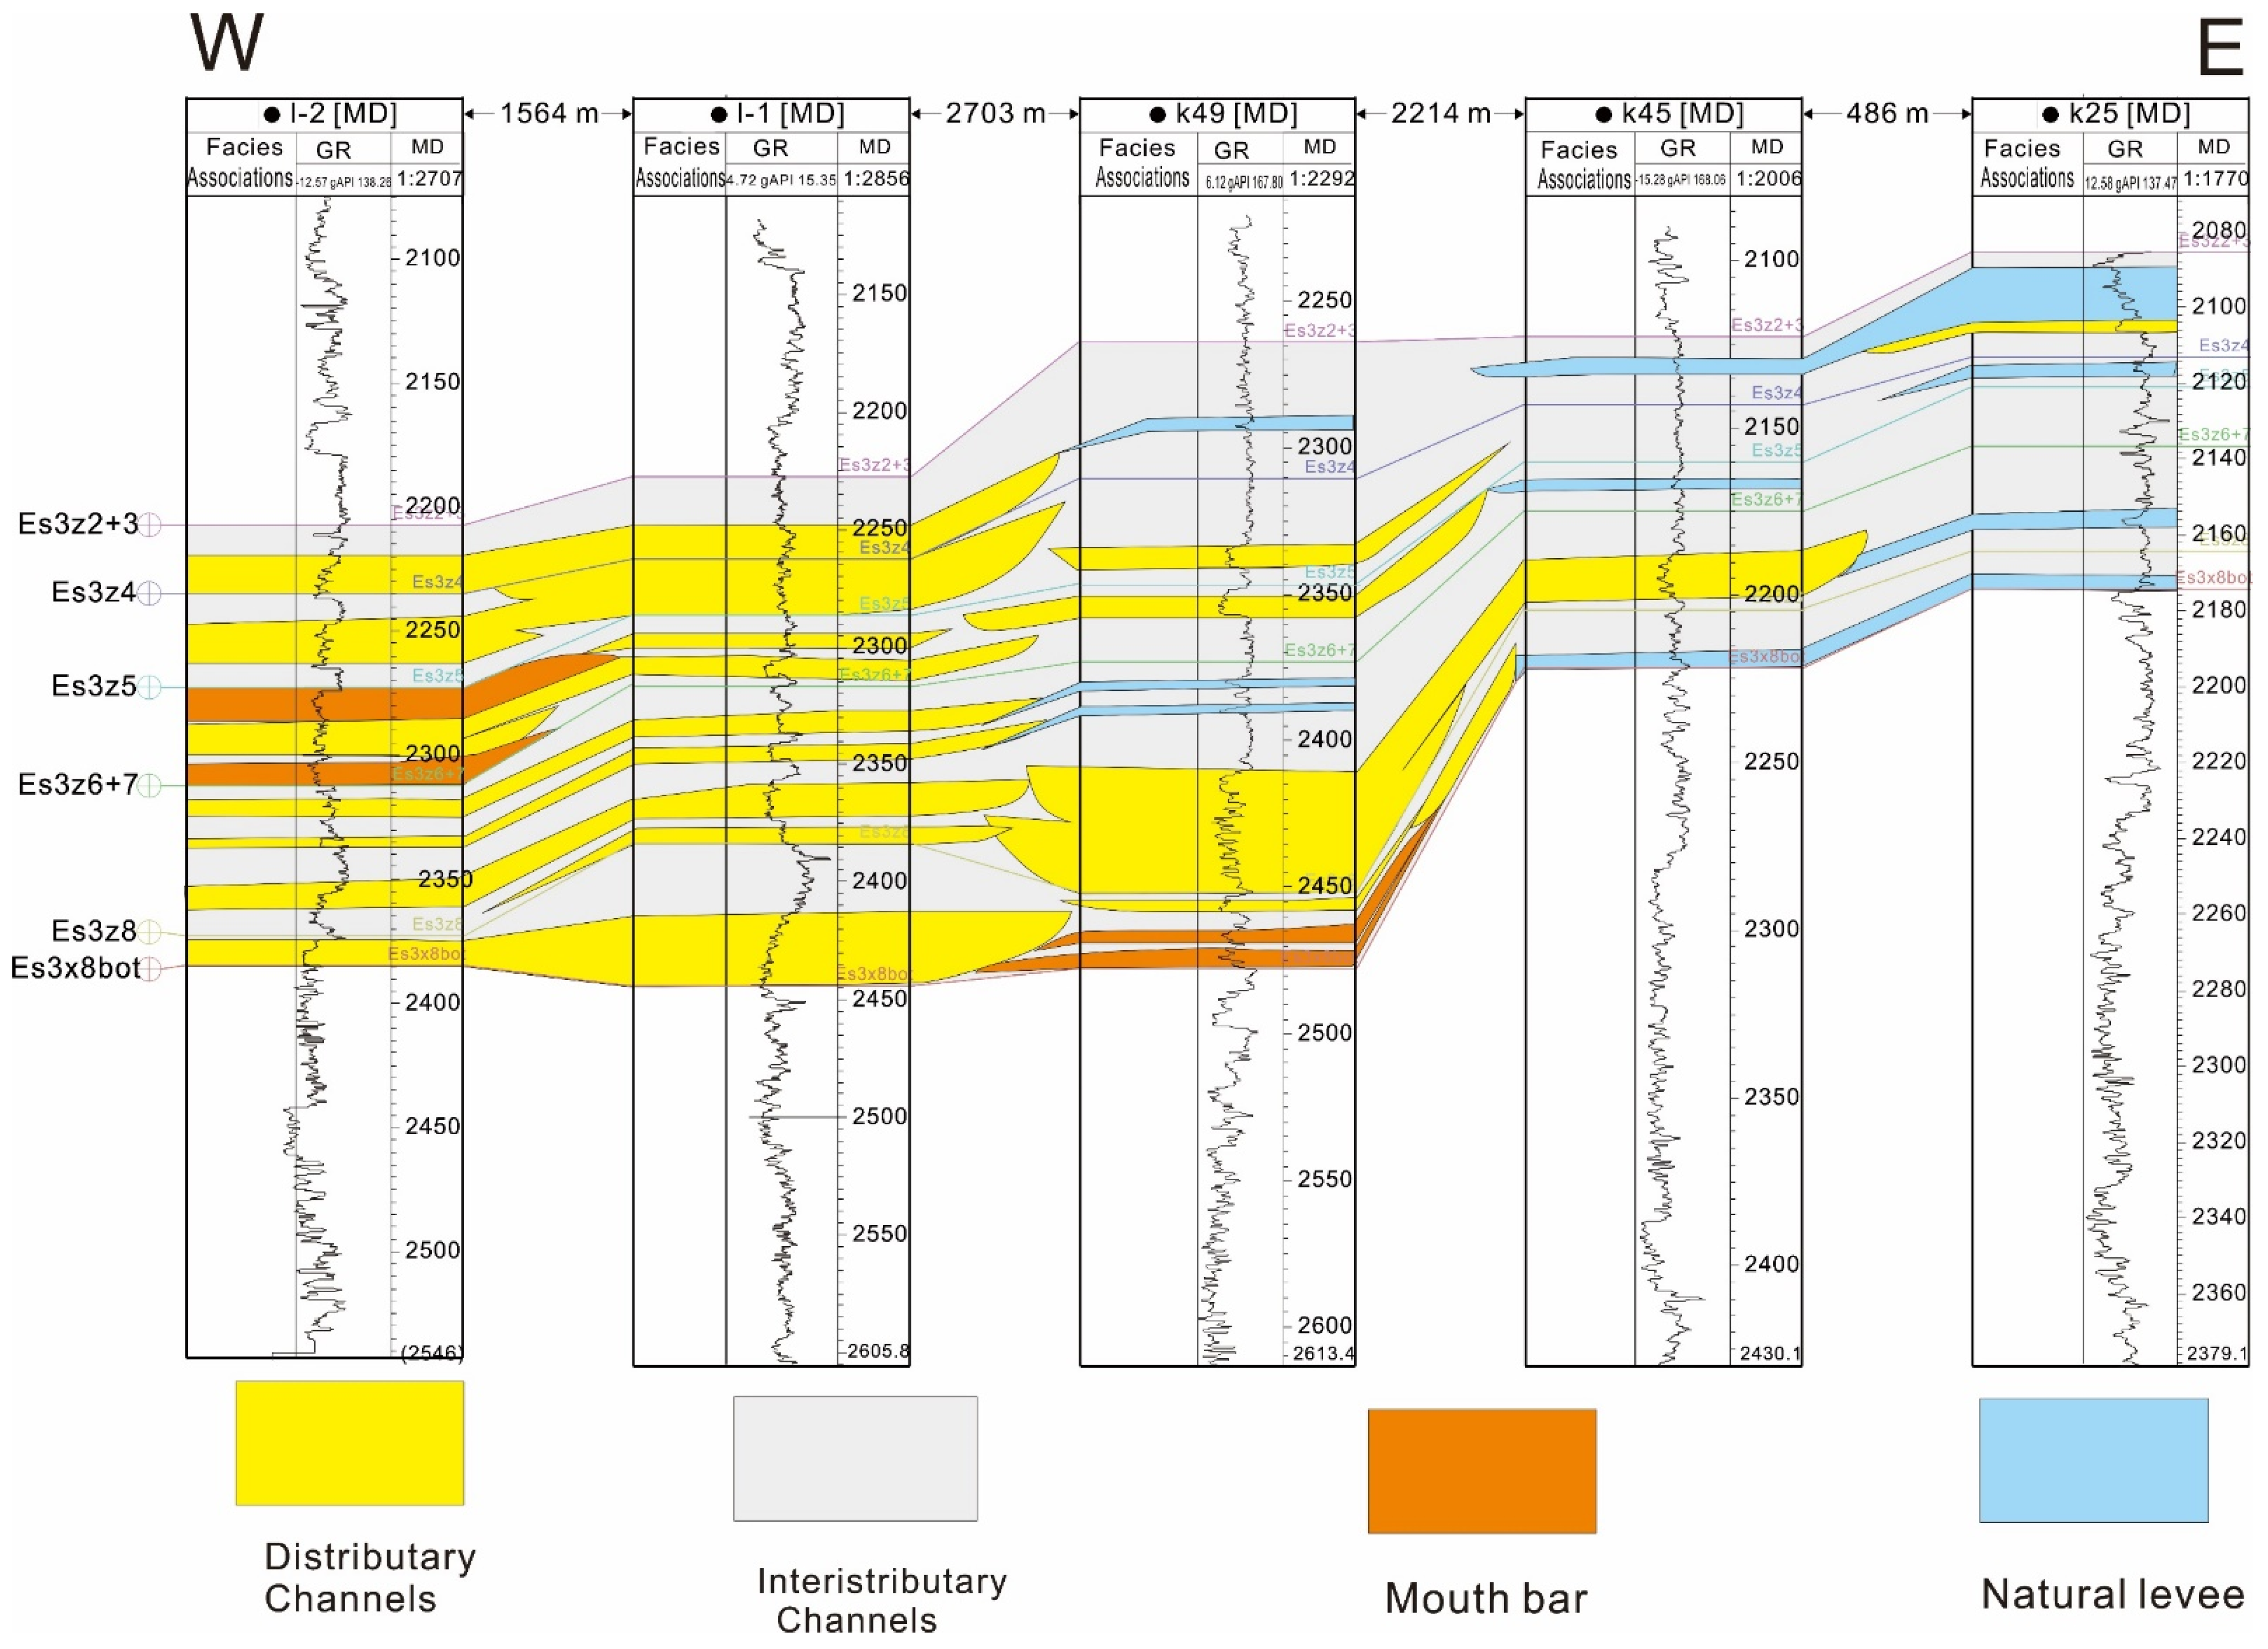
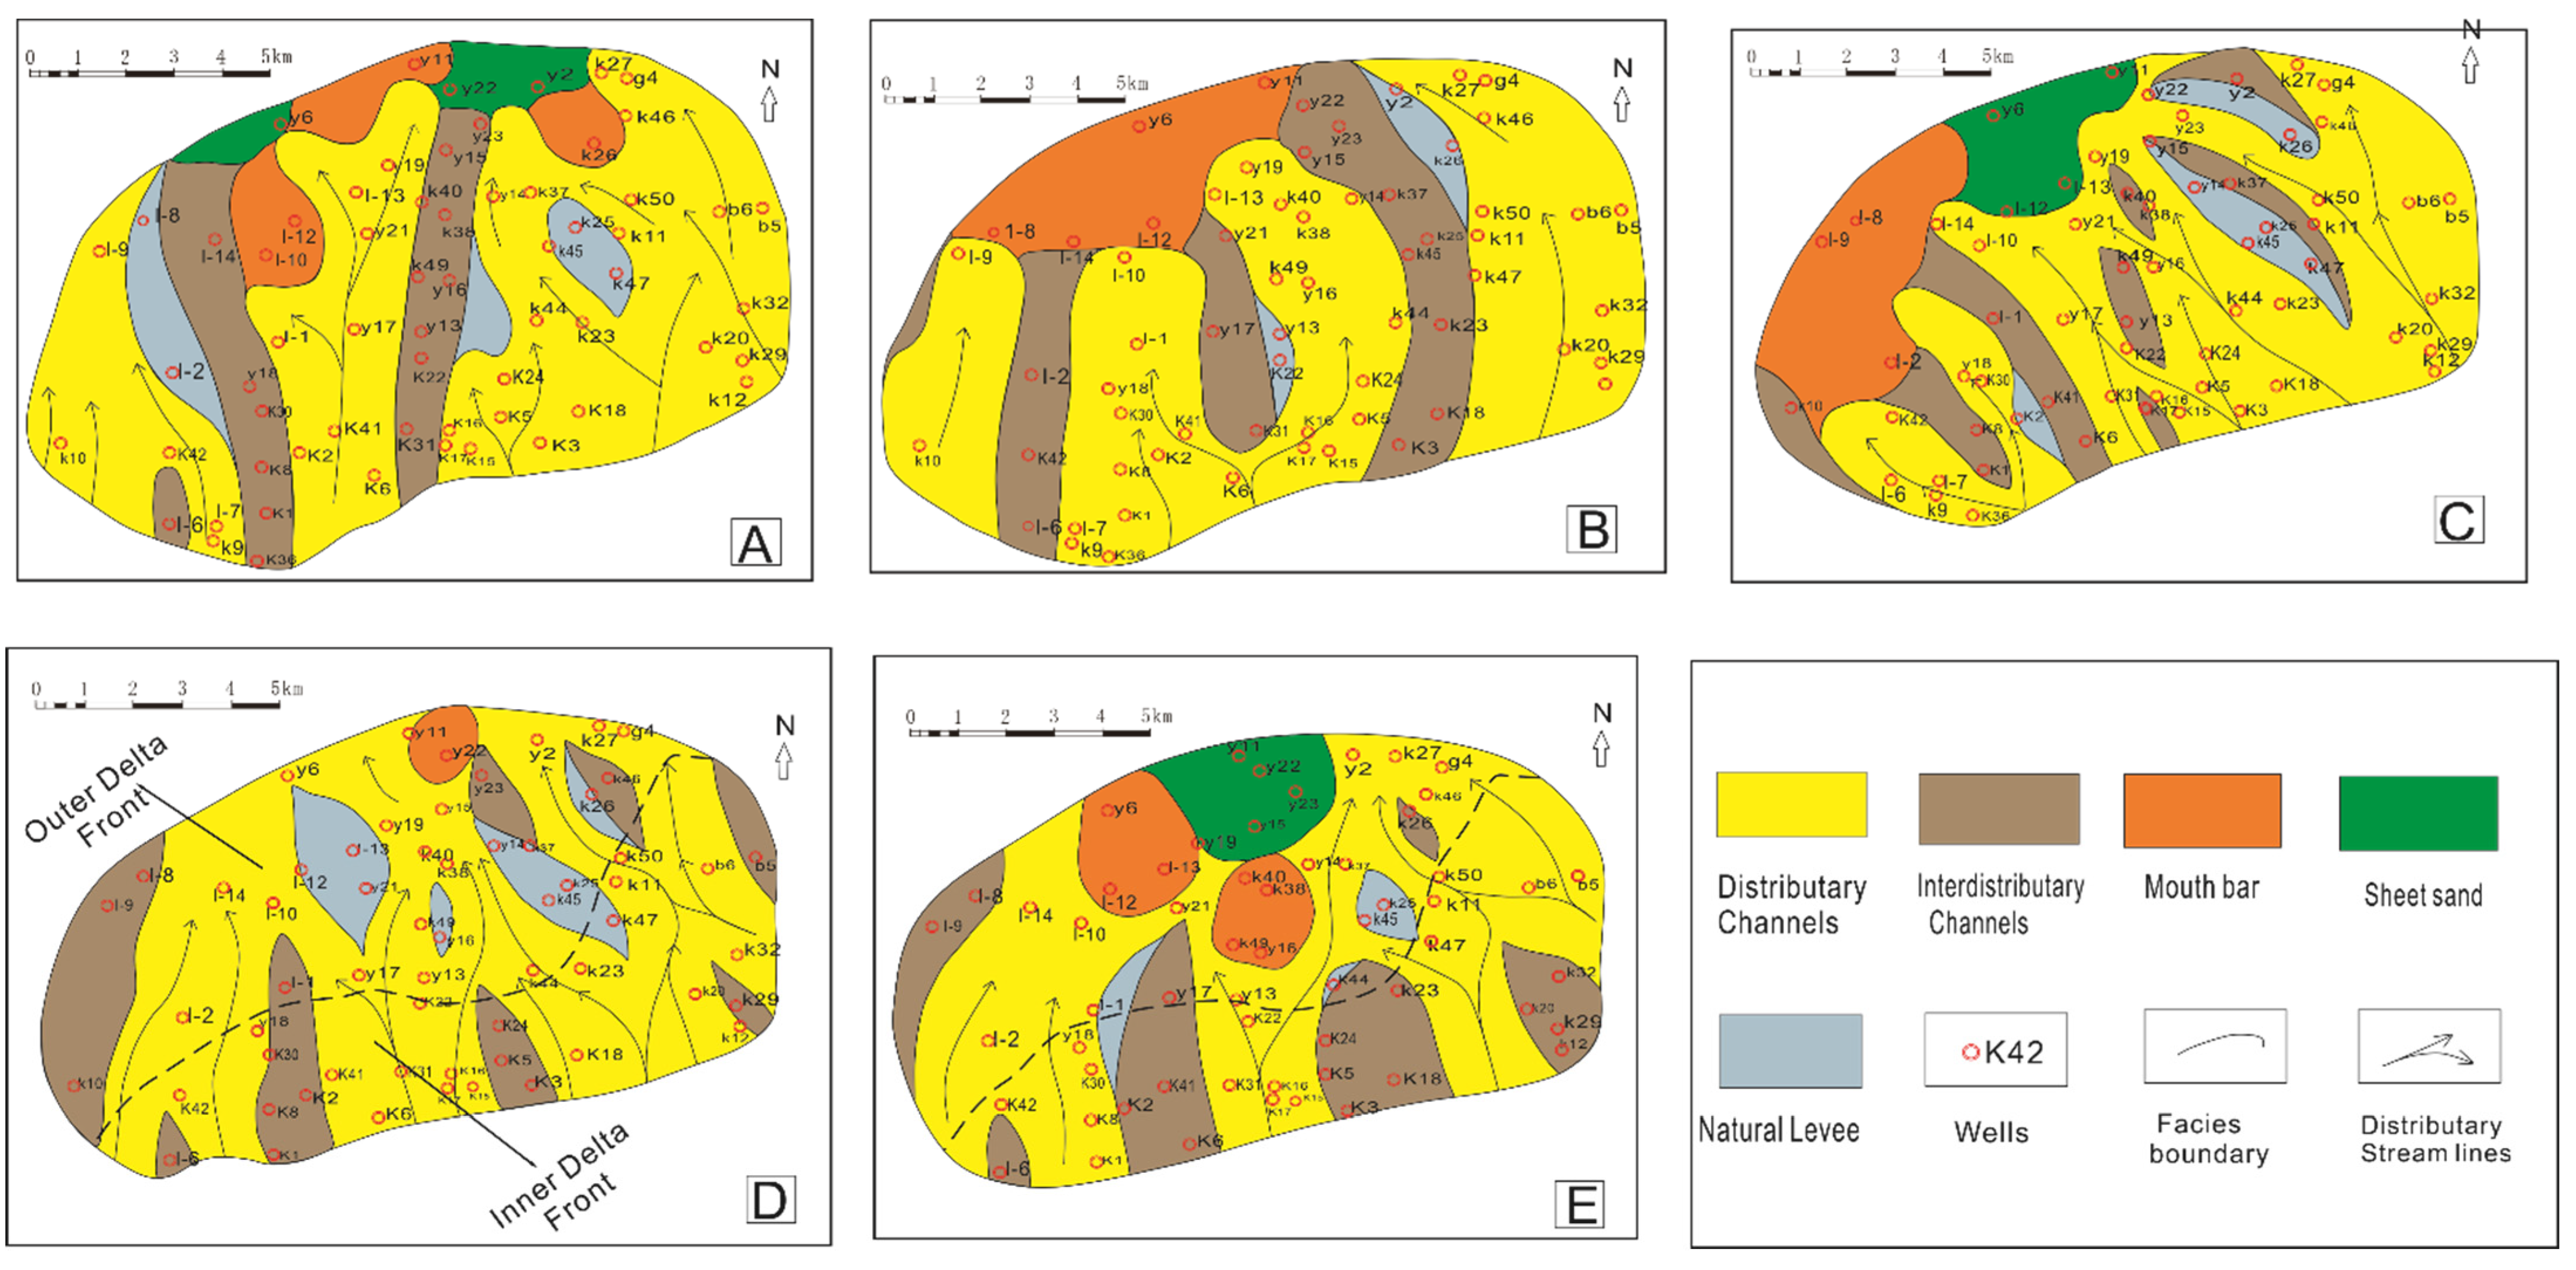
5.2. Distribution of Depositional Facies
6. Conclusions
Author Contributions
Funding
Institutional Review Board Statement
Informed Consent Statement
Data Availability Statement
Acknowledgments
Conflicts of Interest
Abbreviation
| MCS | Matrix supported conglomeratic sandstone |
| CSg | Conglomeratic sandstone with intercalated angular gravels |
| PCSs | Parallel and cross bedded silty sandstone |
| MS | Massive sandstone |
| RCL | Ripple cross laminated sandstone |
| WCS | Wedged shape cross bedding in silty sandstone |
| PBSs | Parallel bedding in siltstone |
| RCS | Sandstone with rip up clasts |
| GBS | Grayish-brown sandstone |
| GM | Grayish mudstone |
| GGM | Greenish gray mudstone |
| DGM | Dark gray mudstone |
| CS | Coarsening upward sandstone |
| CFs | Coarsening upward fine sandstone |
| PLS | Parallel laminated sandstone |
| DFs | Deformed siltstone |
| CBS | Convolute bedding in siltstone |
| SSM | Synsedimentary faults |
References
- Hu, S.; O’Sullivan, P.B.; Raza, A.; Kohn, B.P. Thermal History and Tectonic Subsidence of the Bohai Basin, Northern China: A Cenozoic Rifted and Local Pull-Apart Basin. Phys. Earth Planet. Inter. 2001, 126, 221–235. [Google Scholar] [CrossRef]
- Wang, Y.; Liang, C.; Sun, X. Shale Oil Reservoir Characteristics and Enrichment in the Jiyang Depression, Bohai Bay Basin, East China. J. Earth Sci. 2017, 28, 977–986. [Google Scholar] [CrossRef]
- Feng, Y.; Liu, H.; Song, G.; Yuan, F.; Li, J.; Jiang, Z. Relationship between Decreased Pressure Gradient and Reservoir Filling Degree of Paleogene in Bonan Sag. J. Pet. Sci. Eng. 2019, 180, 615–630. [Google Scholar] [CrossRef]
- Liu, H.; Jiang, Y.; Song, G.; Gu, G.; Hao, L.; Feng, Y. Overpressure Characteristics and Effects on Hydrocarbon Distribution in the Bonan Sag, Bohai Bay Basin, China. J. Pet. Sci. Eng. 2017, 149, 811–821. [Google Scholar] [CrossRef]
- Yin, X.; Lu, S.; Wang, P.; Wang, Q.; Wang, W.; Yao, T. A Three-Dimensional High-Resolution Reservoir Model of the Eocene Shahejie Formation in Bohai Bay Basin, Integrating Stratigraphic Forward Modeling and Geostatistics. Mar. Pet. Geol. 2017, 82, 362–370. [Google Scholar] [CrossRef]
- Zhang, S.; Sui, F.; Lin, H.; Liu, H.; Zhang, S.; Li, J. Petroleum Geology and Prospective Evaluation of Pretertiary in Bohai Bay Basin, 2nd ed.; Geological Publishing House: Beijing, China, 2008; p. 20. [Google Scholar]
- Xiaomin, Z.; Qianghu, L.; Jiawang, G.; Yanlei, D.; Shifa, Z.; Mingxuan, T.; Yong, Y. Reconstruction of sediment-dispersal patterns using seismic sedimentology in the southeastern Zhanhua Sag, Bohai Bay Basin, China. J. Pet. Sci. Eng. 2019, 182, 106335. [Google Scholar] [CrossRef]
- Liu, Q.; Zhu, Q.; Zhu, H.; Liu, k.; Tan, M.; Chen, H. Three-dimensional forward stratigraphic modelling of the gravel-to mud-rich fan-delta in the slope system of Zhanhua Sag, Bohai Bay Basin, China. Mar. Pet. Geol. 2017, 70, 18–30. [Google Scholar] [CrossRef]
- Lai, J.; Wang, G.; Fan, Z.; Chen, J.; Wang, S.; Fan, X. Sedimentary Characterization of a Braided Delta Using Well Logs: The Upper Triassic Xujiahe Formation in Central Sichuan Basin, China. J. Pet. Sci. Eng. 2017, 154, 172–193. [Google Scholar] [CrossRef]
- Tong, K.J.; Zhao, C.M.; Lu, Z.B.; Zhang, Y.C.; Zheng, H.; Xu, S.N.; Wang, J.L.; Pan, L.L. Reservoir evaluation and fracture chracterization of the metamorphic buried hill reservoir in Bohai Bay Basin. Pet. Explor. Dev. 2012, 39, 62–69. [Google Scholar] [CrossRef]
- Huo, G.; Qian, X.; Song, X. The Origin of the Bohai Bay Basin. Acta Sci. Nat. Univ. Pekin. 1998, 34, 503–509. [Google Scholar]
- Allen, M.B.; Macdonald, D.I.M.; Xun, Z.; Vincent, S.J.; Brouet-Menzies, C. Early Cenozoic Two-Phase Extension and Late Cenozoic Thermal Subsidence and Inversion of the Bohai Basin, Northern China. Mar. Pet. Geol. 1997, 14, 951–972. [Google Scholar] [CrossRef]
- Qi, J.; Yang, Q. Cenozoic Structural Deformation and Dynamic Processes of the Bohai Bay Basin Province, China. Mar. Pet. Geol. 2010, 27, 757–771. [Google Scholar] [CrossRef]
- Qi, J. Two Tectonic Systems in the Cenozoic Bohai Bay Basin and Their Genetic Interpretation. Chin. Geol. 2004, 31, 15–22. [Google Scholar]
- Zhao, F.; Jiang, S.; Li, S.; Zhang, H.; Wang, G.; Lei, J.; Gao, S. Cenozoic Tectonic Migration in the Bohai Bay Basin, East China. Geol. J. 2016, 51, 188–202. [Google Scholar] [CrossRef]
- Dong, C. High Revolution Sequence Stratigraphy in Third Member of Shahejie Formation of the Lower Tertiary in Bonan Sag. J. Univ. Pet. China Ed. Nat. Sci. 2002, 26, 11–14. [Google Scholar]
- Wang, M.; Wilkins, R.W.T.; Song, G.; Zhang, L.; Xu, X.; Li, Z.; Chen, G. Geochemical and Geological Characteristics of the Es3L Lacustrine Shale in the Bonan Sag, Bohai Bay Basin, China. Int. J. Coal Geol. 2015, 138, 16–29. [Google Scholar] [CrossRef]
- Fawad, N.; Liu, T.; Fan, D.; Qazi, M.A. Sequence stratigraphic division and correlation of third middle member of Eocene Shahejie formation in the Bonan Sag, Bohai Bay Basin, China. In Proceedings of the 5th International Conference of Palaeogeography, Yangzte Univertsity, Wuhan, China, 12–15 May 2022. [Google Scholar]
- Nazeer, A.; Abbasi, A.S.; Sarfraz, S.H. Sedimentary facies interpretation of Gamma Ray (GR) log as basic well logs in Central and Lower Indus Basin of Pakistan. Geod. Geodyn. 2016, 10, 1–12. [Google Scholar] [CrossRef]
- Selley, R.C. Concepts and Methods of Subsurface Facies Analysis; American Association of Petroleum Geologists: Tulsa, OK, USA, 1978; pp. 9–82. [Google Scholar]
- Nichols. Sedimentology and Stratigraphy, 2nd ed.; John Wiley & sons Ltd.: Chichester, UK, 2009; pp. 1–411. [Google Scholar]
- Guo, L.; Jia, C.; Konhauser, K.O. Depositional system and hydrocarbon accumulation in Gubei slope zone, Zhanhua Depression, Bohai Bay Basin, eastern China. Energy Explor. Exploit. 2016, 34, 810–827. [Google Scholar] [CrossRef]
- Jiang, S.; Henriksen, S.; Wang, H.; Lu, Y.; Ren, J.; Cai, D.; Feng, Y.; Weimer, P.J. Sequence-stratigraphic architectures and sand-body distribution in Cenozoic rifted lacustrine basins, east China. Am. Assoc. Pet. Geol. Bull. 2013, 97, 1447–1475. [Google Scholar] [CrossRef]
- Lu, S.; Liu, W.; Wang, M.; Zhang, L.; Wang, Z.; Chen, G.; Xiao, D.; Li, Z.; Hu, H.T. Lacustrine shale oil resource potential of Es3L Sub-Member of Bonan Sag, Bohai Bay Basin, Eastern China. J. Earth Sci. 2017, 28, 996–1005. [Google Scholar] [CrossRef]
- Hu, L. Pressure characteristics and formation mechanisms of Paleogene in Bonan sag, Zhanhua depression. J. China Univ. Pet. 2013, 37, 46–51. [Google Scholar]
- Yuan, J.; Yu, G.; Song, M.; Zhong, J.; Dong, D.; Wang, W.; Liu, Y.; Ma, L. Depositional characteristics and reservoir potential of Paleogene sediment gravity flow deposits on a faulted slope of the Zhanhua Sag, Bohai Bay Basin, China. J. Asian Earth. Sci. 2019, 177, 89–106. [Google Scholar] [CrossRef]
- Zhu, X.; Zeng, H.; Li, S.; Dong, Y.; Zhu, S.; Zhao, D.; Huang, W. Sedimentary characteristics and seismic geomorphologic responses of a shallow-water delta in the Qingshankou Formation from the Songliao Basin, China. Mar. Petrol. Geol. 2017, 79, 131–148. [Google Scholar] [CrossRef]
- Marriott, S.B.; Wright, V.P. Mudrock deposition in an ancient dryland system: Moor Cliffs Formation, Lower Old Red Sandstone, southwest Wales. UK Geol. J. 2004, 39, 277–298. [Google Scholar] [CrossRef]
- Li, Z.; Zhi, D.B.; Lu, X.D.; Dong, S.Z.; Shu, W.M.; Jian, S.; Jia, H.Z.; Ze, C.W. Sedimentary characteristics and pattern of distributary channels in shallow water deltaic red bed succession: A case from the Late Cretaceous Yaojia formation, southern Songliao Basin, NE China. J. Pet. Sci. Eng. 2018, 171, 1171–1190. [Google Scholar]
- Li, Y.; Shao, L.; Eriksson, K.A.; Tong, X.; Gao, C.; Chen, Z. Linked Sequence Stratigraphy and Tectonics in the Sichuan Continental Foreland Basin, Upper Triassic Xujiahe Formation, Southwest China. J. Asian Earth Sci. 2014, 88, 116–136. [Google Scholar] [CrossRef]
- Zhou, Y.; Ji, Y.; Pigott, J.D.; Meng, Q.; Wan, L. Tectono-stratigraphy of Lower Cretaceous Tanan sub-basin, Tamtsag Basin, Mongolia: Sequence architecture, depositional systems and controls on sediment infill. Mar. Pet. Geol. 2014, 49, 176–202. [Google Scholar] [CrossRef]
- Van, D.K.D.A.; Flaig, P.P.; Hasiotis, S.T. Paleoenvironmental Reconstruction of A Late Cretaceous, Muddy, River-Dominated Polar Deltaic System: Schrader Bluff Prince Creek Formation Transition, Shivugak Bluffs, North Slope of Alaska. USA J. Sediment. Res. 2015, 85, 903–936. [Google Scholar]
- Dong, W.; Lin, C.; Eriksson, K.; Zhou, X.; Liu, J.; Teng, Y. Depositional Systems and Sequence Architecture of the Oligocene Dongying Formation, Liaozhong Depression, Bohai Bay Basin, Northeast China. Am. Assoc. Pet. Geol. Bull. 2011, 95, 1475–1493. [Google Scholar] [CrossRef]
- Li, S.; Ma, Y.Z.; Yu, X.; Li, S. Reservoir potential of deep water lacustrine delta-front sandstones in upper Triassic yangchang formation, Western Ordos Basin, China. J. Pet. Geol. 2017, 40, 105–118. [Google Scholar] [CrossRef]
- Martini, I.; Sandrelli, F. Facies analysis of a Pliocene river-dominated deltaic succession (Siena Basin, Italy): Implications for the formation and infilling of terminal distributary channels. Sedimentology 2015, 62, 234–265. [Google Scholar] [CrossRef]
- Boggs. Petrology of Sedimentary Rocks, 2nd ed.; Cambridge University Press: London, UK, 2009; pp. 1–167. [Google Scholar]
- Tanner, L.H.; Lucas, S.G. Deposition and deformation of fluvial–lacustrine sediments of the Upper Triassic–Lower Jurassic Whitmore Point Member, Moenave Formation, northern Arizona. Sediment. Geol. 2010, 223, 180–191. [Google Scholar] [CrossRef]
- Ming-zhen, W. The Discovery and Geological Preliminary Investigation of A Slump-Slip Soft-Sediment Deformation Multilayer Complex Structure in Neoproterozoic Strata in Shouxian County, Anhui Province. Acta Geosci. Sin. 2012, 1, 49–56. [Google Scholar]
- Shanmugam, G. Modern Internal Waves and Internal Tides along Oceanic Pycnoclines: Challenges and Implications for Ancient Deep-Marine Baroclinic Sands. Am. Assoc. Pet. Geol. Bull. 2013, 97, 799–843. [Google Scholar] [CrossRef]
- Luo, S.; He, S.; Jin, Q.; Yang, R.; Zhang, J. Overpressure System Classification and Structure Characteristic in Bonan Sag. J. Jilin Univ. Earth Sci. Ed. 2015, 45, 37–51. [Google Scholar] [CrossRef]
- Olariu, C.; Steel, R.J.; Petter, A.L. Delta-front hyperpycnal bed geometry and implications for reservoir modeling: Cretaceous Panther Tongue delta, Book Cliffs, Utah. Am. Assoc. Petrol. Geol. Bull. 2010, 94, 819–845. [Google Scholar] [CrossRef]
- Maniscalco, R.; Fazio, E.; Punturo, R.; Cirrincione, R.; Di Stefano, A.; Distefano, S.; Forzese, M.; Lanzafame, G.; Leonardi, G.S.; Montalbano, S.; et al. The Porosity in Heterogeneous Carbonate Reservoir Rocks: Tectonic versus Diagenetic Imprint—A Multi-Scale Study from the Hyblean Plateau (SE Sicily, Italy). Geosciences 2022, 12, 149. [Google Scholar] [CrossRef]


| Lithology | Description | Interpretations | Cores |
|---|---|---|---|
| well, k44 Depth:2079.1 Fine silty sandstone | Parallel as well as small scaled cross bedding; siltstone is inversely graded to fine sandstone on the top. Parallel bedding started from siltstone to fine sandstone that turned into a cross bedding structure. | Sand bars migrate in distributary channels, parallel bedding to cross bedding indicate the progradation of delta front facies; a brownish color shows the channel presence in inner delta front deposits of shallow water environment. | 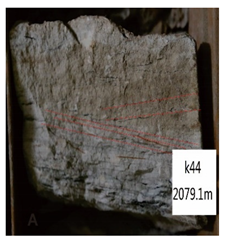 |
| well, k44(C) Depth:2088.75 Massive sandstone | Parallel bedding and small-scale cross bedding; thinner coal bed is embedded in massive sandstone; brownish color can be seen on the top side. | The massive beds were developed under conditions of rapid deposition in the upper flow regime of high-density current. Organic content shows poor oxygenated environments of the inner delta front or delta plain. | 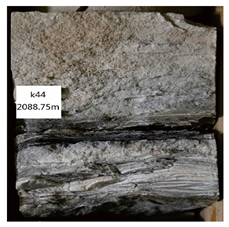 |
| well l-9 Depth: 2659.4 Dark gray calcareous mudstone | Homogenous calcareous mudstone (view from the top); no obvious sedimentary structures are found. | A dark gray or black color shows the sedimentary environment of weak oxidation to reduction in shallow to deep lake; suggested to form in interdistributary channels of the outer delta front. |  |
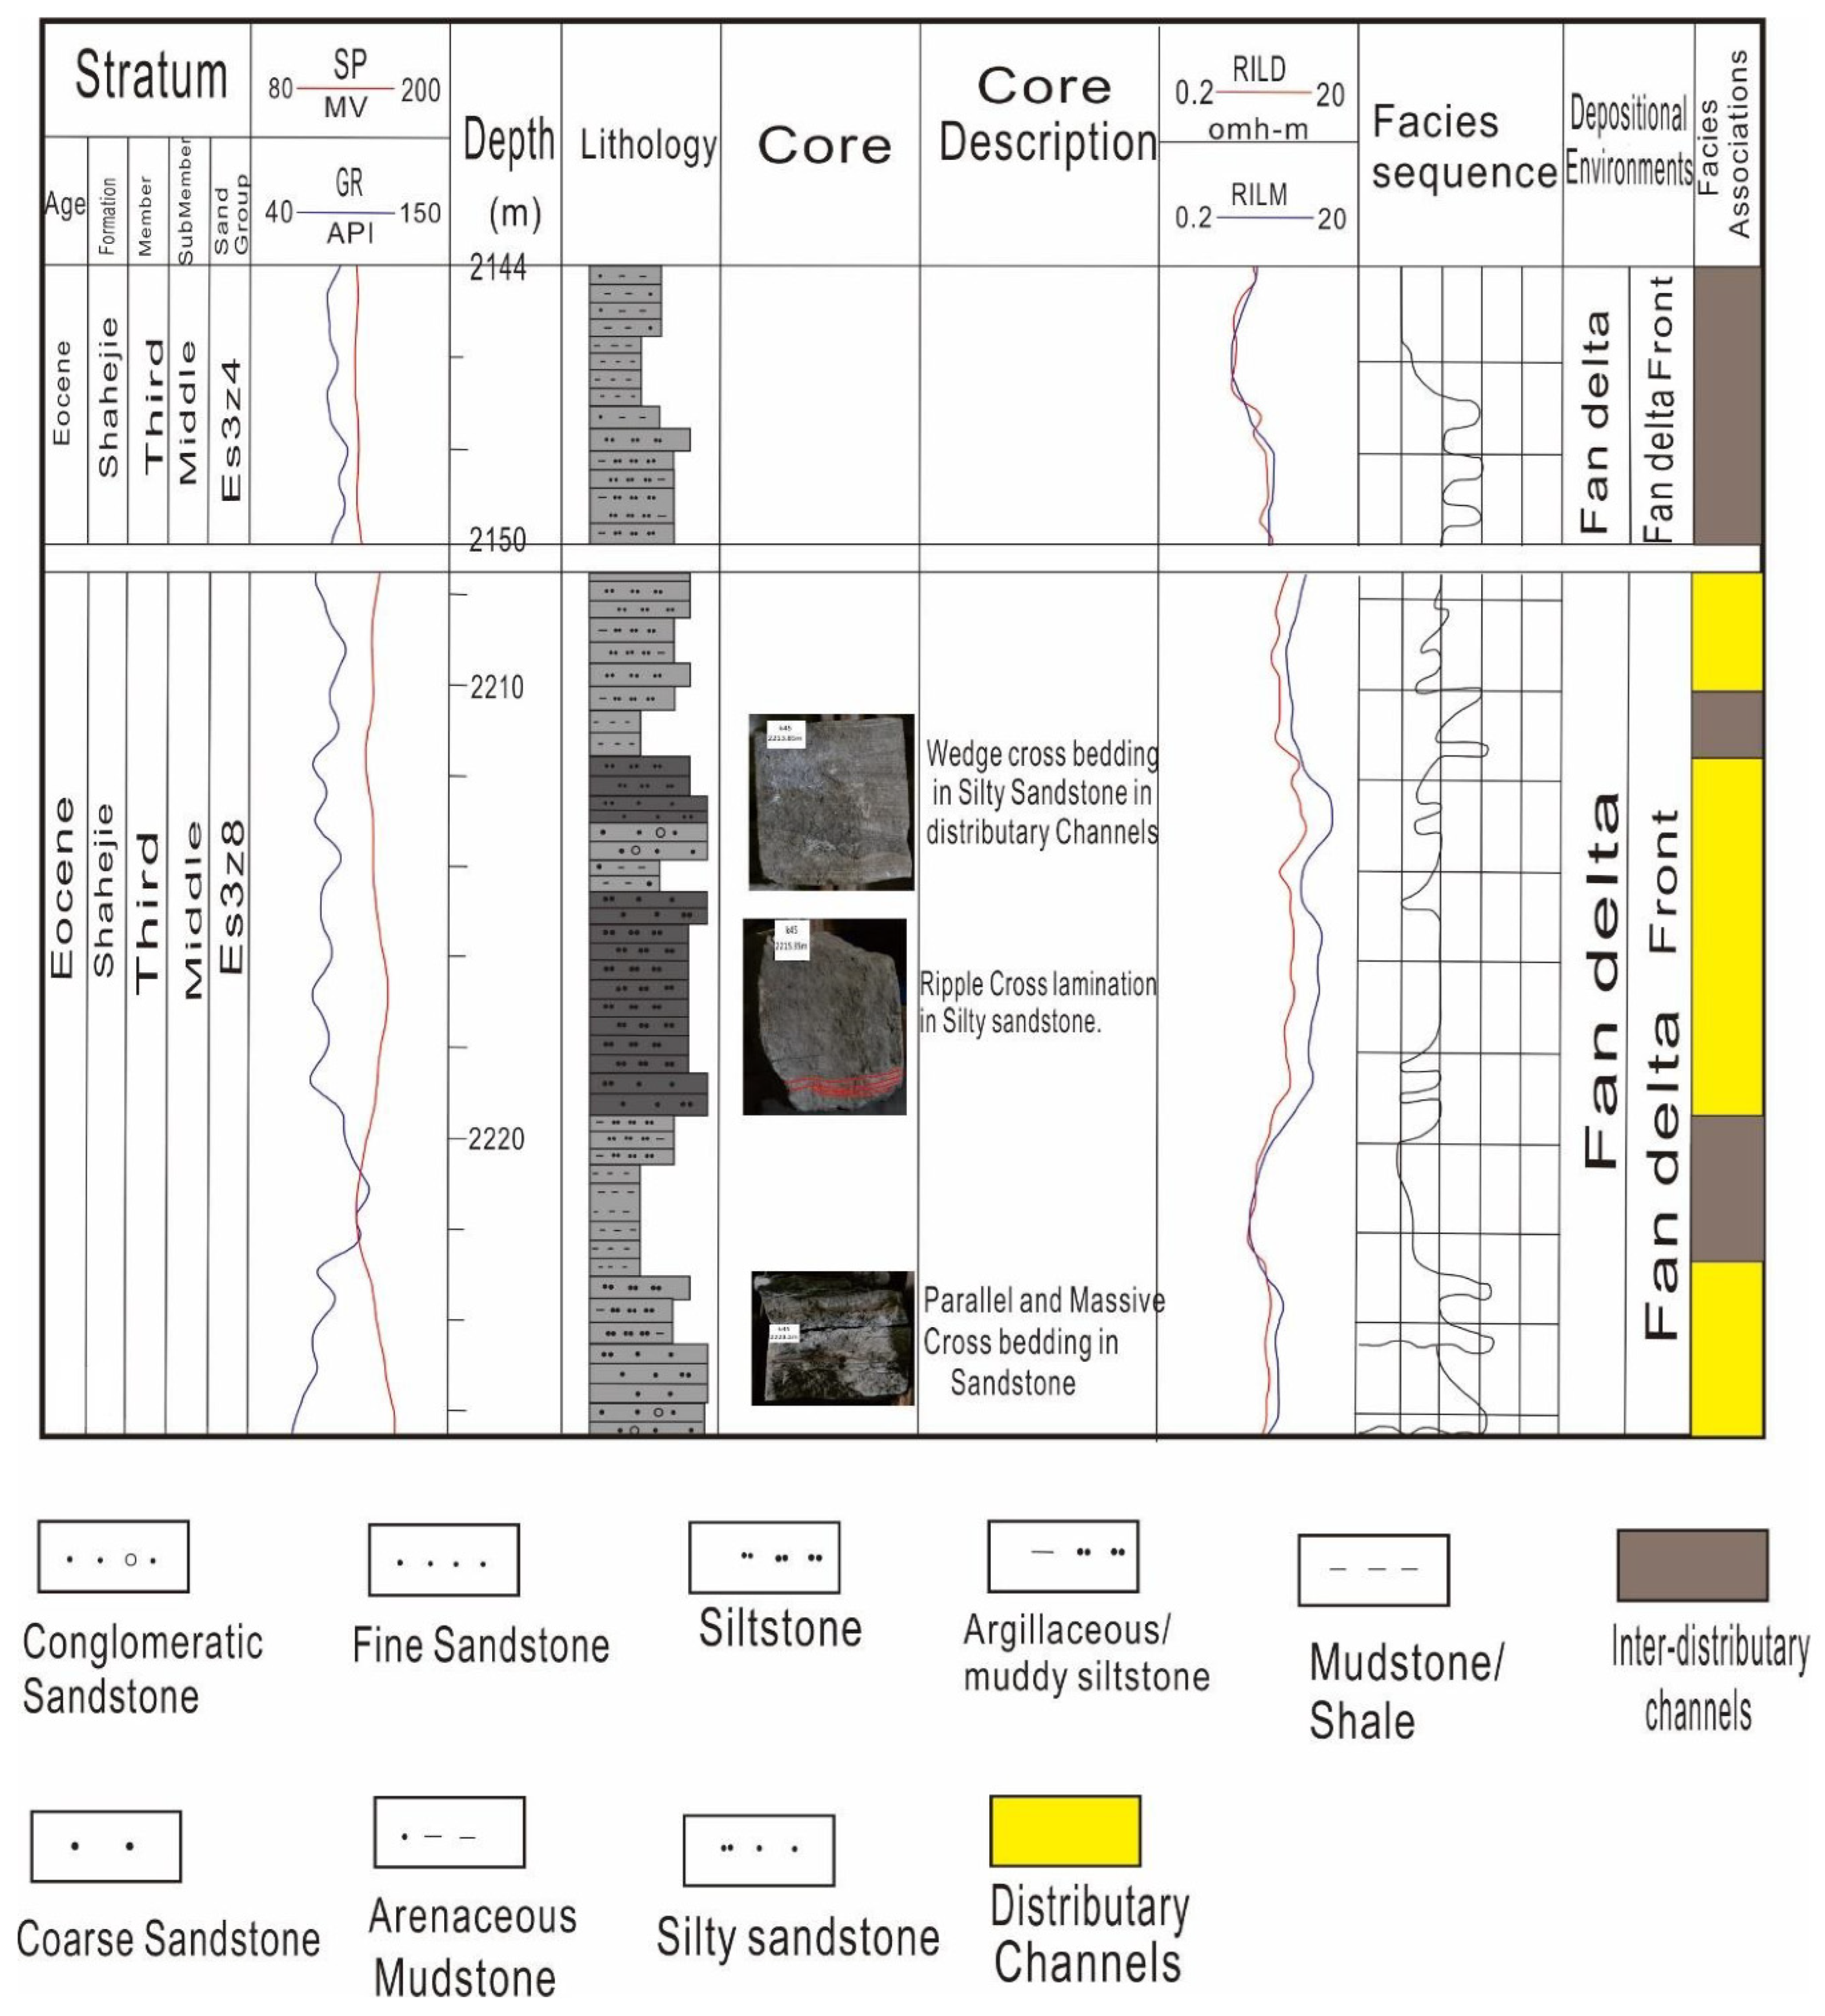
| Well k45 Depth:2213.85 Light Gray silty sandstone | Wedge shaped cross bedding with an erosional base; cross bedding is also occurring. | This type of bedding is interpreted in high energy environments in the channels. Erosive beds form a wedge shaped structure. It is interpreted to occur in delta front deposits. | 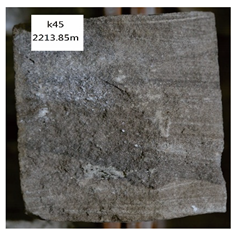 |
| Well Y22 Depth:2634.35 Interbedded mud and sand | Synsedimentary faults are found and display an en echelon array, parallel beds of mud are present, which are more obvious in the middle portion. | These micro faults are interpreted on deltaic slopes and formed due to normal grown faults that initiate sliding in weak lithologies, and hence it marks a transitional zone between the mouth bar and the sheet sands. | 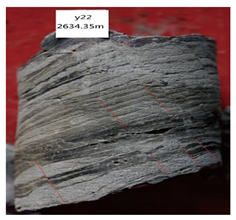 |
| Well, k50(H) Depth:2116.50 Grayish mudstone | Grayish mudstone with scours at the bottom due to underlying sandstone; it marks the erosive contact. | Grayish mudstone is interpreted to form in wetting-reducing conditions in interdistributary areas; representing periodic flow of water due to rising lake levels in flood events; interpreted to form in the inner delta front. | 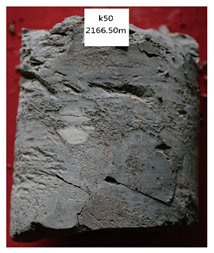 |
| Well k50 Depth: 2163.9 Matrix supported conglomeratic sandstone (MCS) | Mud clasts of grayish color are embedded in these deposits that display a poor sorting, and clasts are angular to sub angular in shape due to less abrasion; showing normal grading and scours are present at the base. | Poor sorting and less abrasion suggested their presence near to sources; interpreted to form in higher energy environments of the inner delta front. | 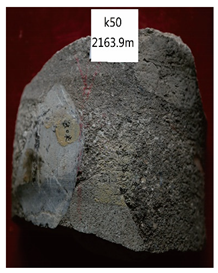 |
| Well k47 Depth:2043.40 Greenish grey mudstone | Erosion surfaces are found in greenish grey mudstone on the basal side; that marks abrasion with underlying sandstones. | Green mudstone is interpreted to form in wetting-reducing conditions in interdistributary areas; representing periodic flow of water due to rising lake levels in flood events; interpreted to form in the inner delta front. | 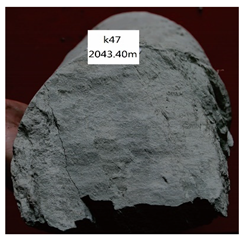 |
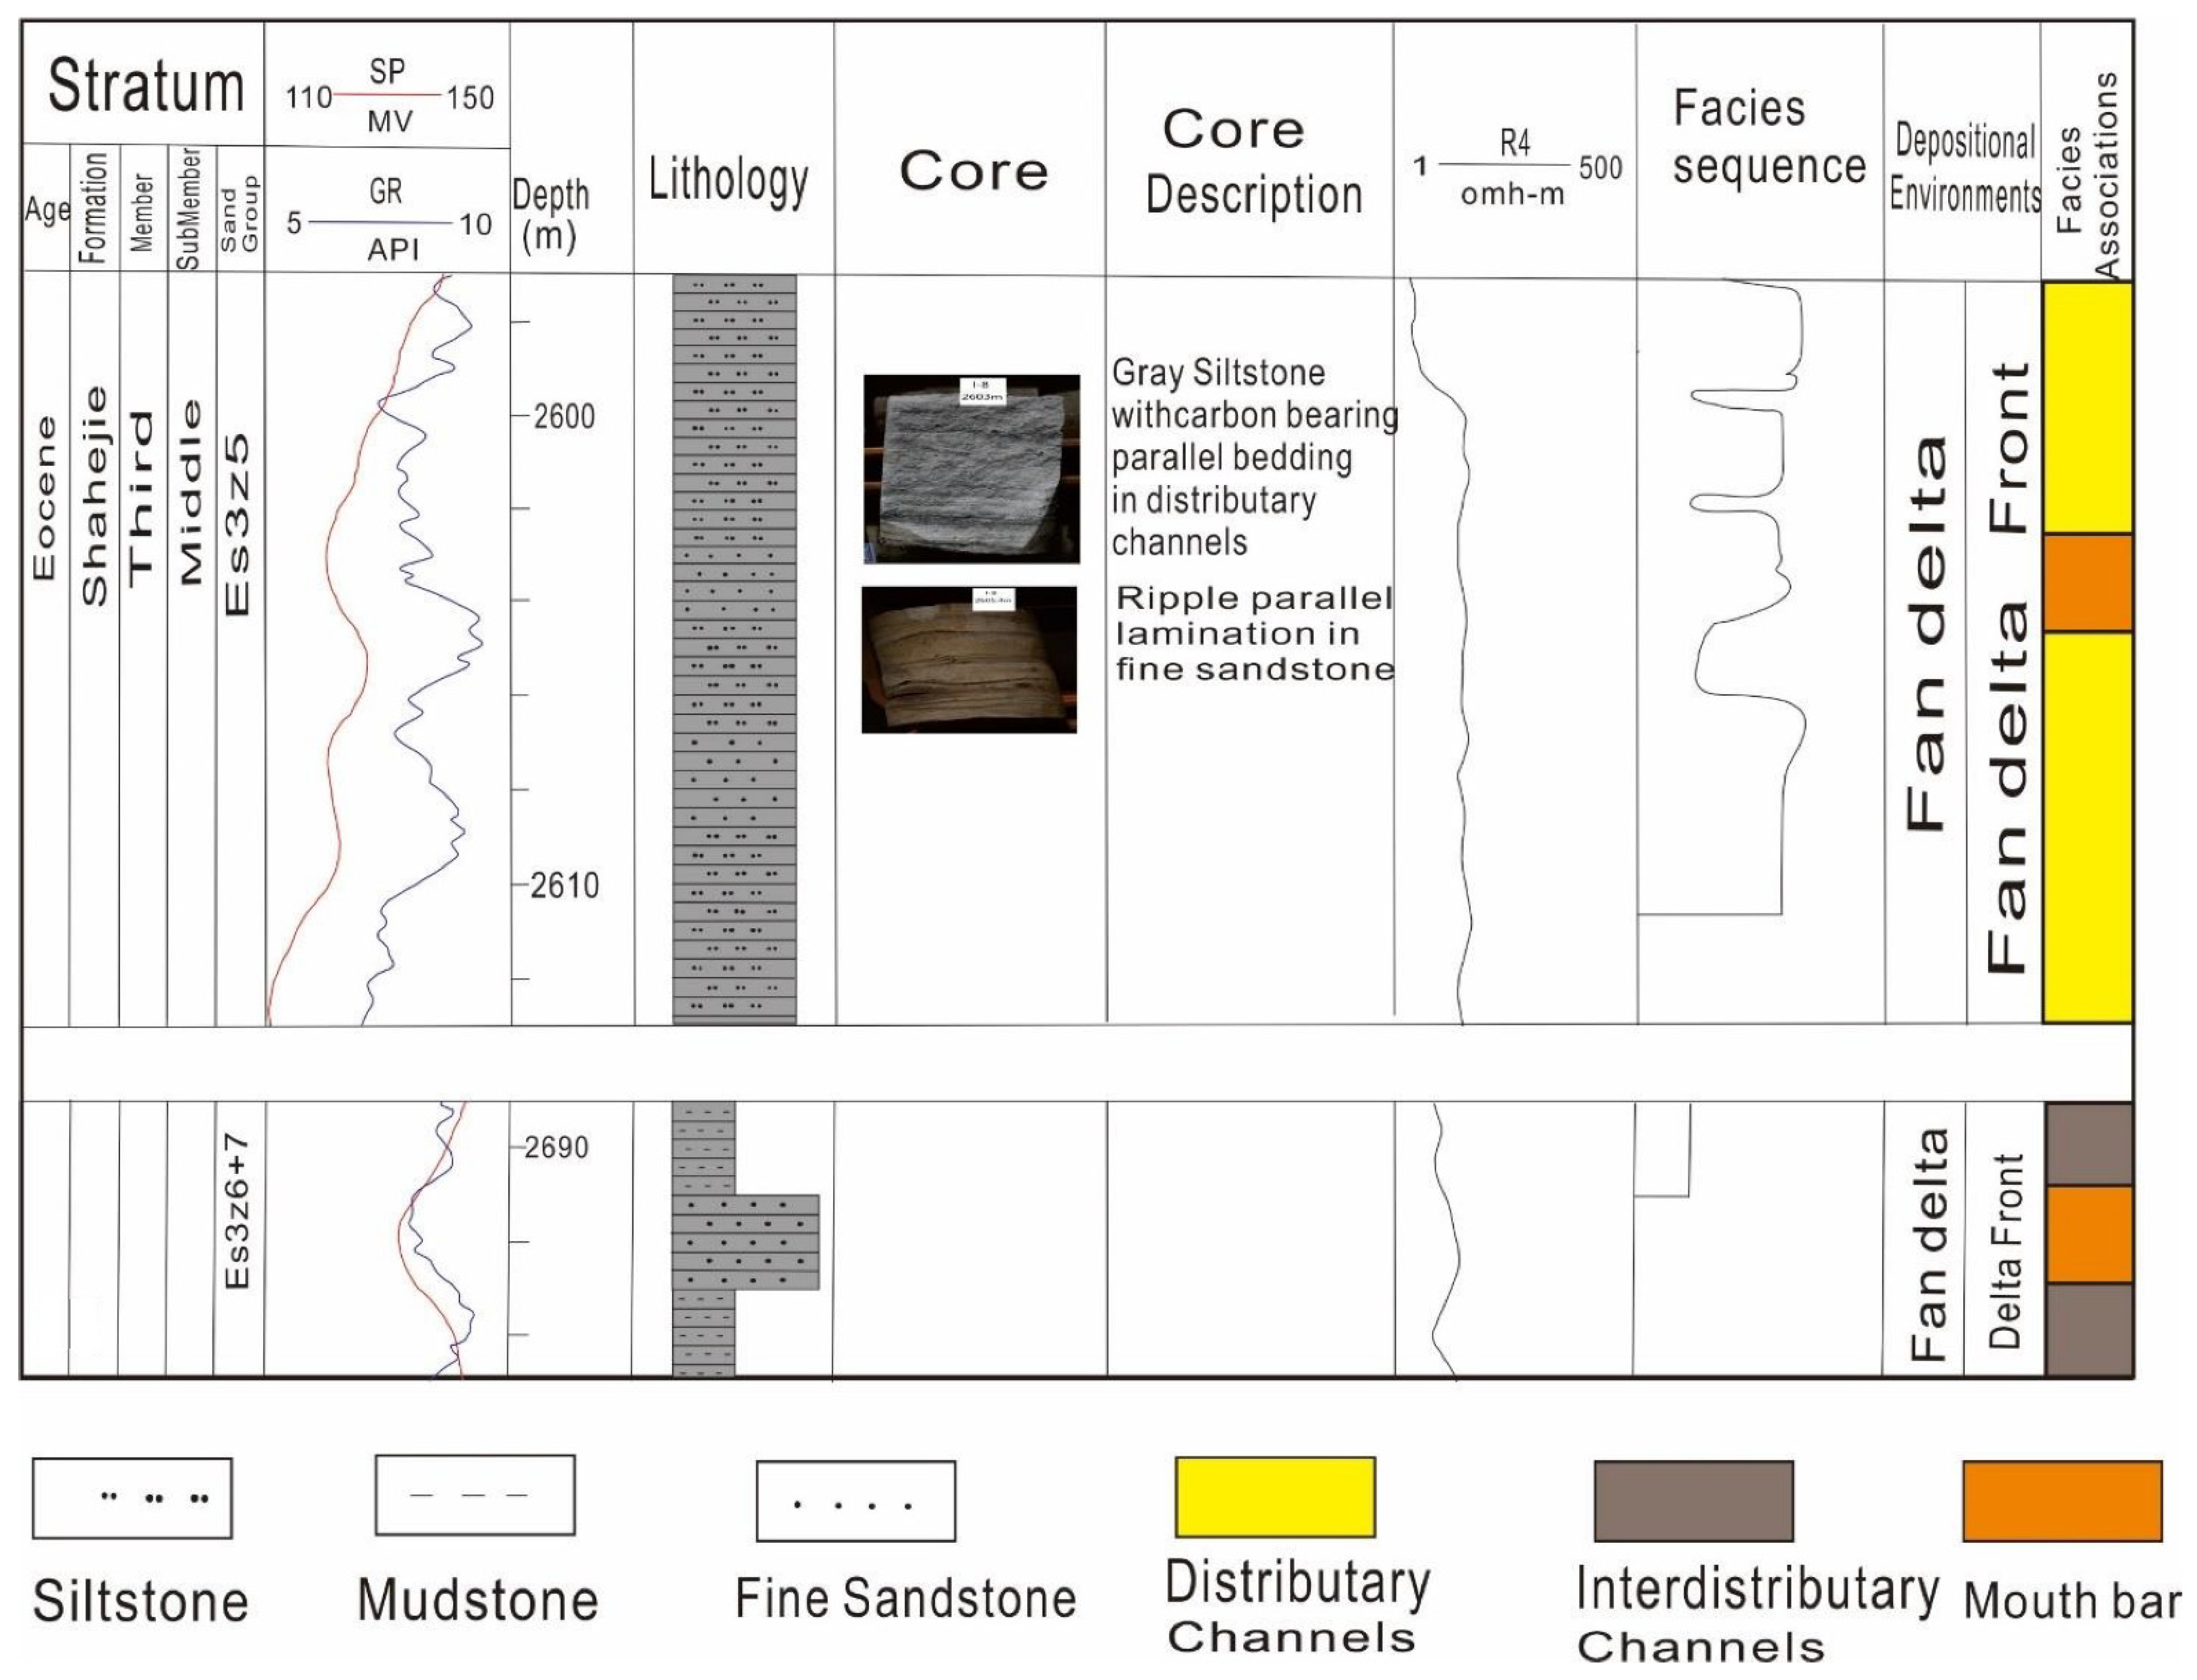
| Well l-8 Depth:2603 Gray siltstone | Carbon bearing parallel bedding at the bottom; mark a sharp contact with underlaying fine sandstone. | Carbon’s presence is Interpreted in low energy reducing environment in distributary channel deposits; stronger wave action influences the grain size in shallow to deep water of outer delta front origin. | 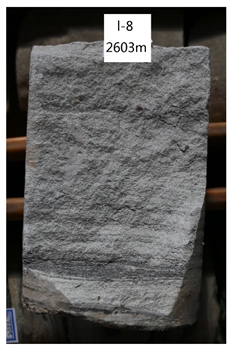 |
| Well l-8 Depth: 2605.4 Fine sand stone | Fine sandstone with ripple parallel lamination; climbing ripples at the bottom; Lamination cover is of dark mud. | Ripple parallel laminations are interpreted to form in a low energy subaqueous reducing environment as mouth bar deposits; stronger wave action in shallow to deep water suggests their occurance in the outer delta front. | 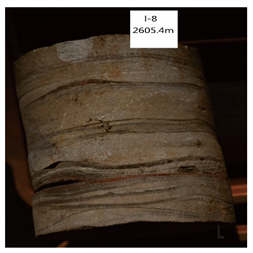 |
| Well k49 Depth: 2340.9 Fine grained gray-brown sandstone | Medium to fine grained gray-brown sandstone; oil bearing scour surfaces at the bottom, normally graded, with a fining upward trend. | Well sorted grains represent the wave action in channel deposits, away from the sources; hence, they are suggested to occur in the outer delta front area. | 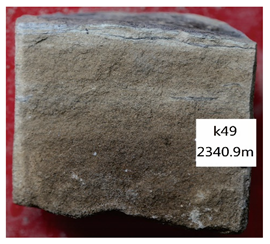 |
| Well k45 Depth:2215 Silty sandstone | Ripple cross lamination (red lines) at the base of silty sandstone, with erosional structure at the basal side. It shows a good sorting. | Good sorting and ripple cross lamination represent the occurrence of these deposits in the outer delta front area, lower part may contain mouth bar deposits. | 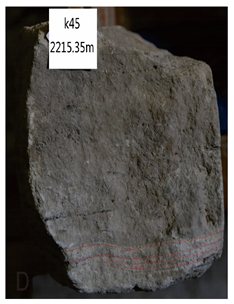 |
Publisher’s Note: MDPI stays neutral with regard to jurisdictional claims in published maps and institutional affiliations. |
© 2022 by the authors. Licensee MDPI, Basel, Switzerland. This article is an open access article distributed under the terms and conditions of the Creative Commons Attribution (CC BY) license (https://creativecommons.org/licenses/by/4.0/).
Share and Cite
Fawad, N.; Liu, T.; Fan, D.; Ahmad, Q.A. Sedimentary Facies Analysis of the Third Eocene Member of Shahejie Formation in the Bonan Sag of Bohai Bay Basin (China): Implications for Facies Heterogeneities in Sandstone Reservoirs. Energies 2022, 15, 6168. https://doi.org/10.3390/en15176168
Fawad N, Liu T, Fan D, Ahmad QA. Sedimentary Facies Analysis of the Third Eocene Member of Shahejie Formation in the Bonan Sag of Bohai Bay Basin (China): Implications for Facies Heterogeneities in Sandstone Reservoirs. Energies. 2022; 15(17):6168. https://doi.org/10.3390/en15176168
Chicago/Turabian StyleFawad, Nadir, Taixun Liu, Daidu Fan, and Qazi Adnan Ahmad. 2022. "Sedimentary Facies Analysis of the Third Eocene Member of Shahejie Formation in the Bonan Sag of Bohai Bay Basin (China): Implications for Facies Heterogeneities in Sandstone Reservoirs" Energies 15, no. 17: 6168. https://doi.org/10.3390/en15176168
APA StyleFawad, N., Liu, T., Fan, D., & Ahmad, Q. A. (2022). Sedimentary Facies Analysis of the Third Eocene Member of Shahejie Formation in the Bonan Sag of Bohai Bay Basin (China): Implications for Facies Heterogeneities in Sandstone Reservoirs. Energies, 15(17), 6168. https://doi.org/10.3390/en15176168