1. Introduction
With the International Energy Agency reporting a 57% rise in global carbon dioxide (CO
2) emissions from 1990, the world now produces an estimated 30 billion tonnes of CO
2 each year, with road transport roughly accounting for 18% of the total [
1]. These reported emissions are a direct result of an increased demand for travel, sourced by factors such as population growth, economic growth, and urban sprawl. As a reaction to these figures and increasing demands by legislative authorities to rapidly reduce vehicle emissions, the industry has seen a rise in OEMs announcing the electrification of their vehicle fleets. Soon all automotive companies will move away from the conventional internal combustion engine vehicle (ICEV) to the more efficient hybrid electric (HEV) and battery electric vehicles (BEV).
BEVs currently offer the most efficient and cost-effective mode of transport, with the potential to reduce our dependence on fossil fuels and lower greenhouse gas emissions. At present, the main issues with BEVs are the limited range, charging facilities, and battery life/recyclability. Tesla is currently leading the way with BEV technology, being an exclusively BEV automotive company and selling almost 1 million units in recent years [
2]. Ahead of most OEMs, Tesla is already focusing on the flaws with BEVs. Notably, the issue surrounding extreme climates and the effects this has on BEV range, battery life, and performance.
It has been found that the thermal management system (TMS) is one of the largest range limiting systems for BEVs [
3]. The TMS is responsible for maintaining the powertrain operating conditions and providing effective climate control to the cabin. For conventional internal combustion engines (ICEV), the purpose of the TMS is to regulate engine temperature to create an environment for optimal combustion and minimal emissions. Furthermore, the TMS controls oil viscosity, so the correct boundary layer is maintained between components to avoid early engine wear, thermal oil breakdown or unnecessary viscous friction. Due to the inherently large heat loss of internal combustion engines (ICE), in cold climates, the engine heat can be used to heat the cabin. While in hot climates, fresh air or a separate air conditioning (AC) system is used.
BEVs do not have this high level of waste heat due to the naturally higher efficiency of the electric powertrain. As a result, heating the cabin by other means, such as the PTC heater, has led to higher energy consumption when exposed to extremely cold climates. However, heating the cabin is not the only issue which arises with the BEV TMS. The TMS now has three major powertrain components to manage: the battery, motor, and inverter. Lithium-ion batteries suffer significant losses in cold temperatures below room temperature. This is because of reduced energy capabilities, increased impedance, as well as severe battery degradation due to lithium plating [
4,
5,
6,
7,
8]. Whereas, when it is too hot, the battery is at risk of loss of active material, solid electrolyte interface decomposition and internal reaction, which will ultimately lead to thermal runaway [
9,
10,
11,
12]. On the other hand, motors and inverters tend to be less sensitive to temperature. Generally, electric motors and inverters suffer limited effects in low-temperature climates. However, electric motors can suffer from demagnetisation and rotor slip in high temperatures [
13,
14]. While for inverters, higher temperatures can lead to accelerating power loss and material fatigue failure [
15,
16,
17].
BEV TMS design has undergone heavy development in recent years with the help of OEMs and the research community. There are simple TMS designs which use the standard vapour compression cycle and positive temperature coefficient heater (PTC) to serve the cabin and a simple radiator coolant loop to maintain inverter and electric motor temperature [
18,
19]. For the battery, these systems use the battery management system (BMS) to adjust power limits, reducing heat generation, which leads to battery overheating [
20]. To combat lithium-ion battery ageing, degradation, and thermal runaway, it has become a common practice to include a third loop responsible for controlling lithium-ion battery temperature to a 15 °C to 35 °C range [
21]. This temperature range is so close to normal ambient that cooling using a radiator would not be feasible. Thus, it is common to see the battery loop connected to the AC refrigeration circuit using a two-phase thermal liquid evaporator, known as a chiller [
21]. To prevent battery increased impedance and lithium plating due to cold temperatures, it is normal to see a PTC heater for heating coolant entering the battery or to directly heat the battery casing. Running an AC compressor naturally requires a lot of power, resulting in a reduction in BEV range. Consequently, some systems include a second radiator for battery cooling in cold climates [
22]. The radiator works in unison with the chiller for battery cooling to cover battery temperature regulation in all climates. In cold climates, using the radiator instead of the chiller will significantly reduce energy consumption. New waste heat recovery (WHR) systems have been the focus of research lately [
23]. These systems tend to use complex coolant circuits with many valves to connect the battery, inverter, electric motor, and HVAC to move waste heat to limited systems, rather than rejecting waste heat straight to ambient.
This paper will discuss a new WHR system designed by Tesla with a unique heat pump and coolant circuit. It is the only system of its kind to have a single heat exchanger in the radiator pack, which functions as a radiator, condenser, and evaporator. The novelty of this paper is in the discussion, modelling, and simulation of the new WHR system. This report is separated into four key sections, a discussion of the patent and all its key operating modes, a discussion of the difference between the patent and the system in production, followed by modelling, simulation, and a discussion of the results.
2. Octovalve Patent
Tesla, the world’s leading electric vehicle manufacturer, has developed a revolutionary heat pump thermal management system for the Model Y, which is a patented design [
24] and is analysed by Sandy Munro [
25]. Sandy Munro [
25] describes the octovalve system, which is capable of redirecting coolant to control all heating/cooling demands with 15 operating modes for extreme ambient conditions [
24].
There are a few differences between the systems patent and the system in production; however, the way in which these systems operate is largely the same. The following sections contain a brief description of the patented heat pump design, present the differences between the patent and production system, and summarise the modes of operation.
2.1. Thermo-Fluid Circuit Design
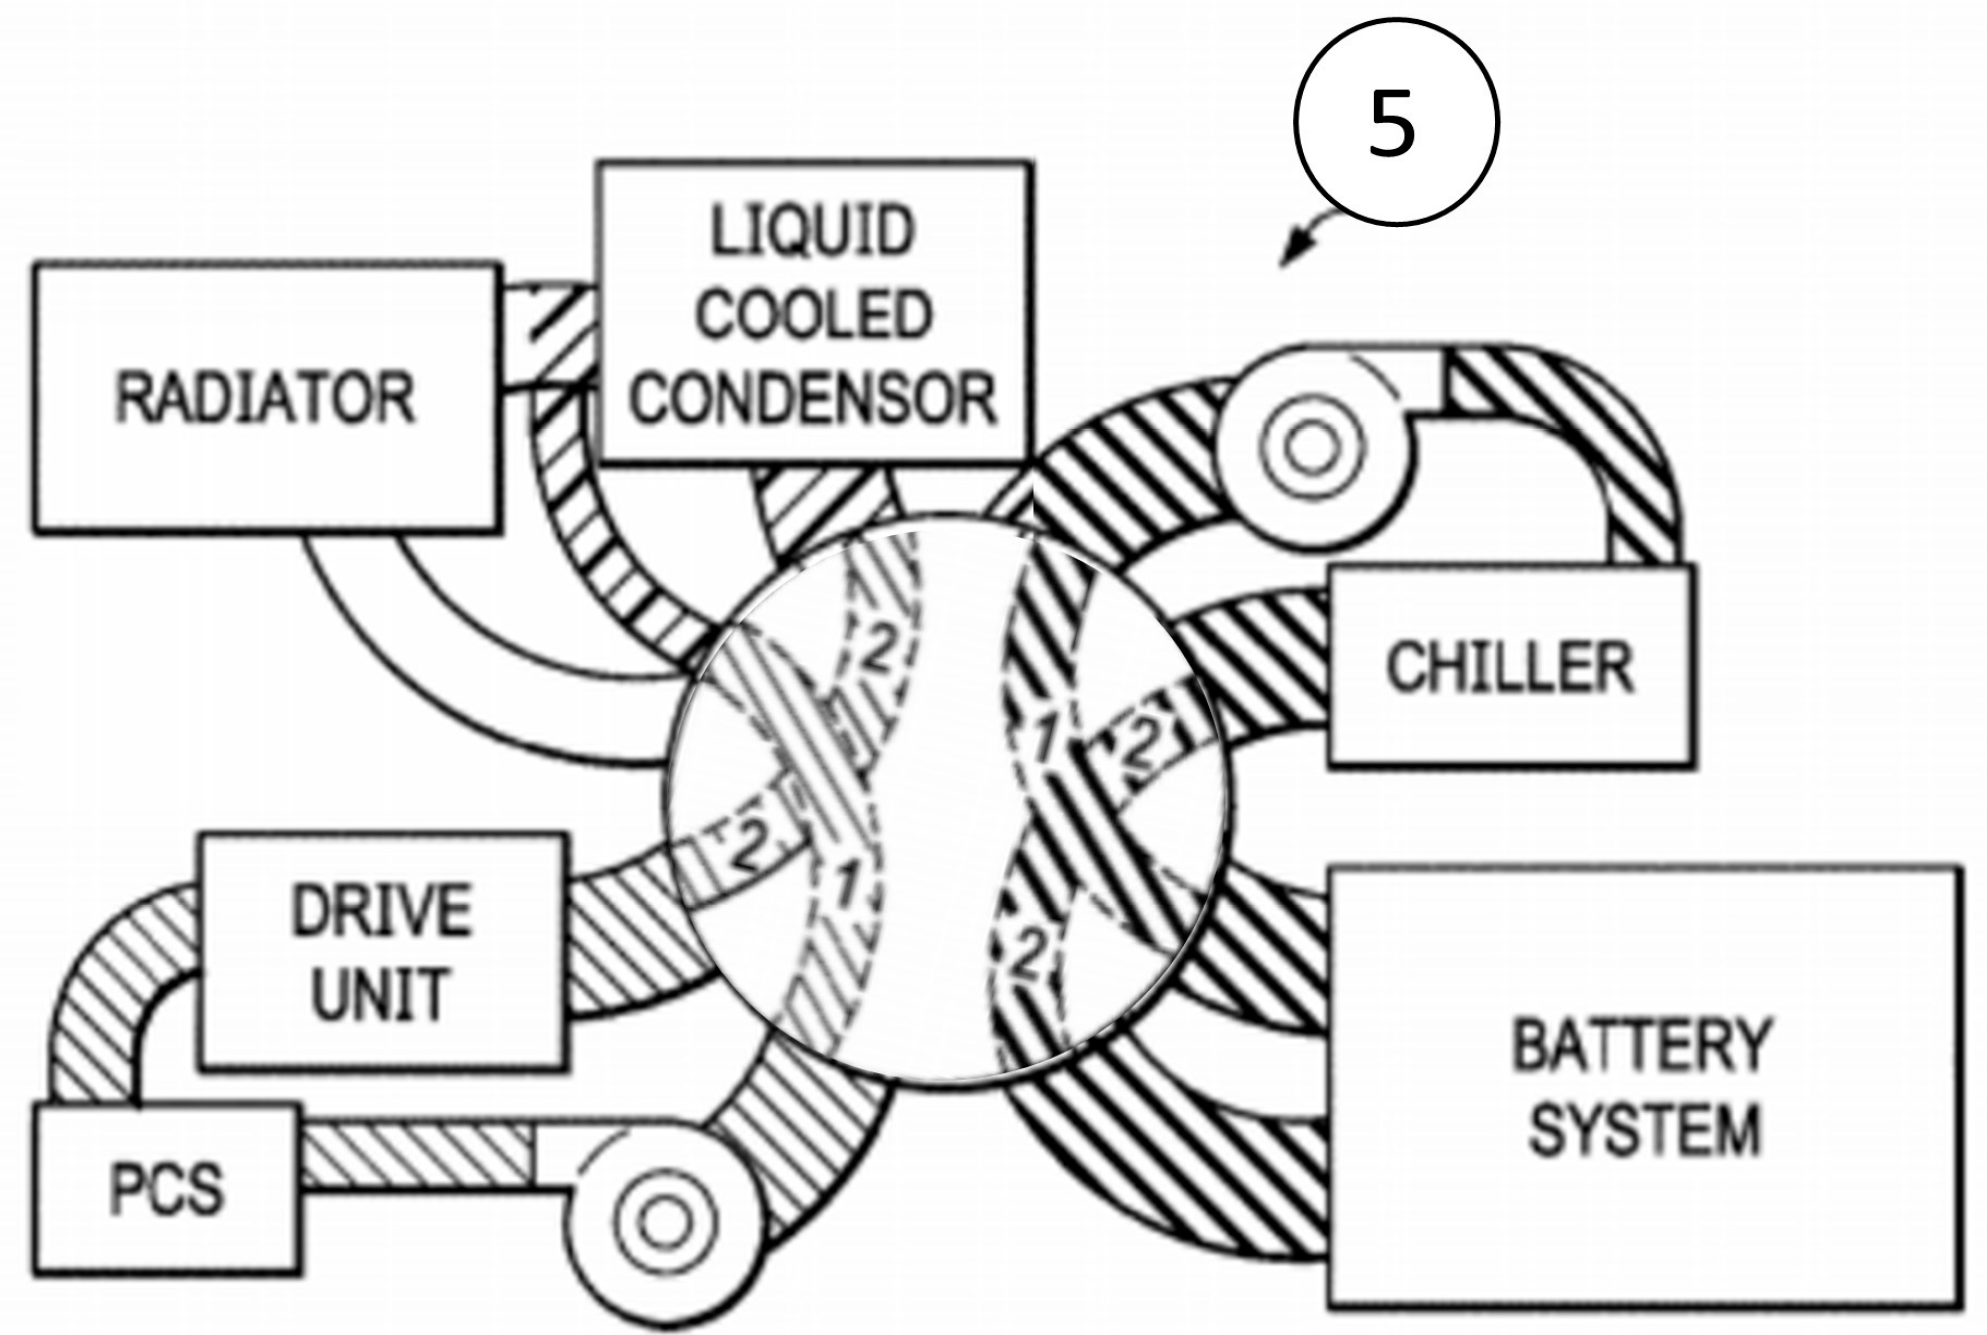
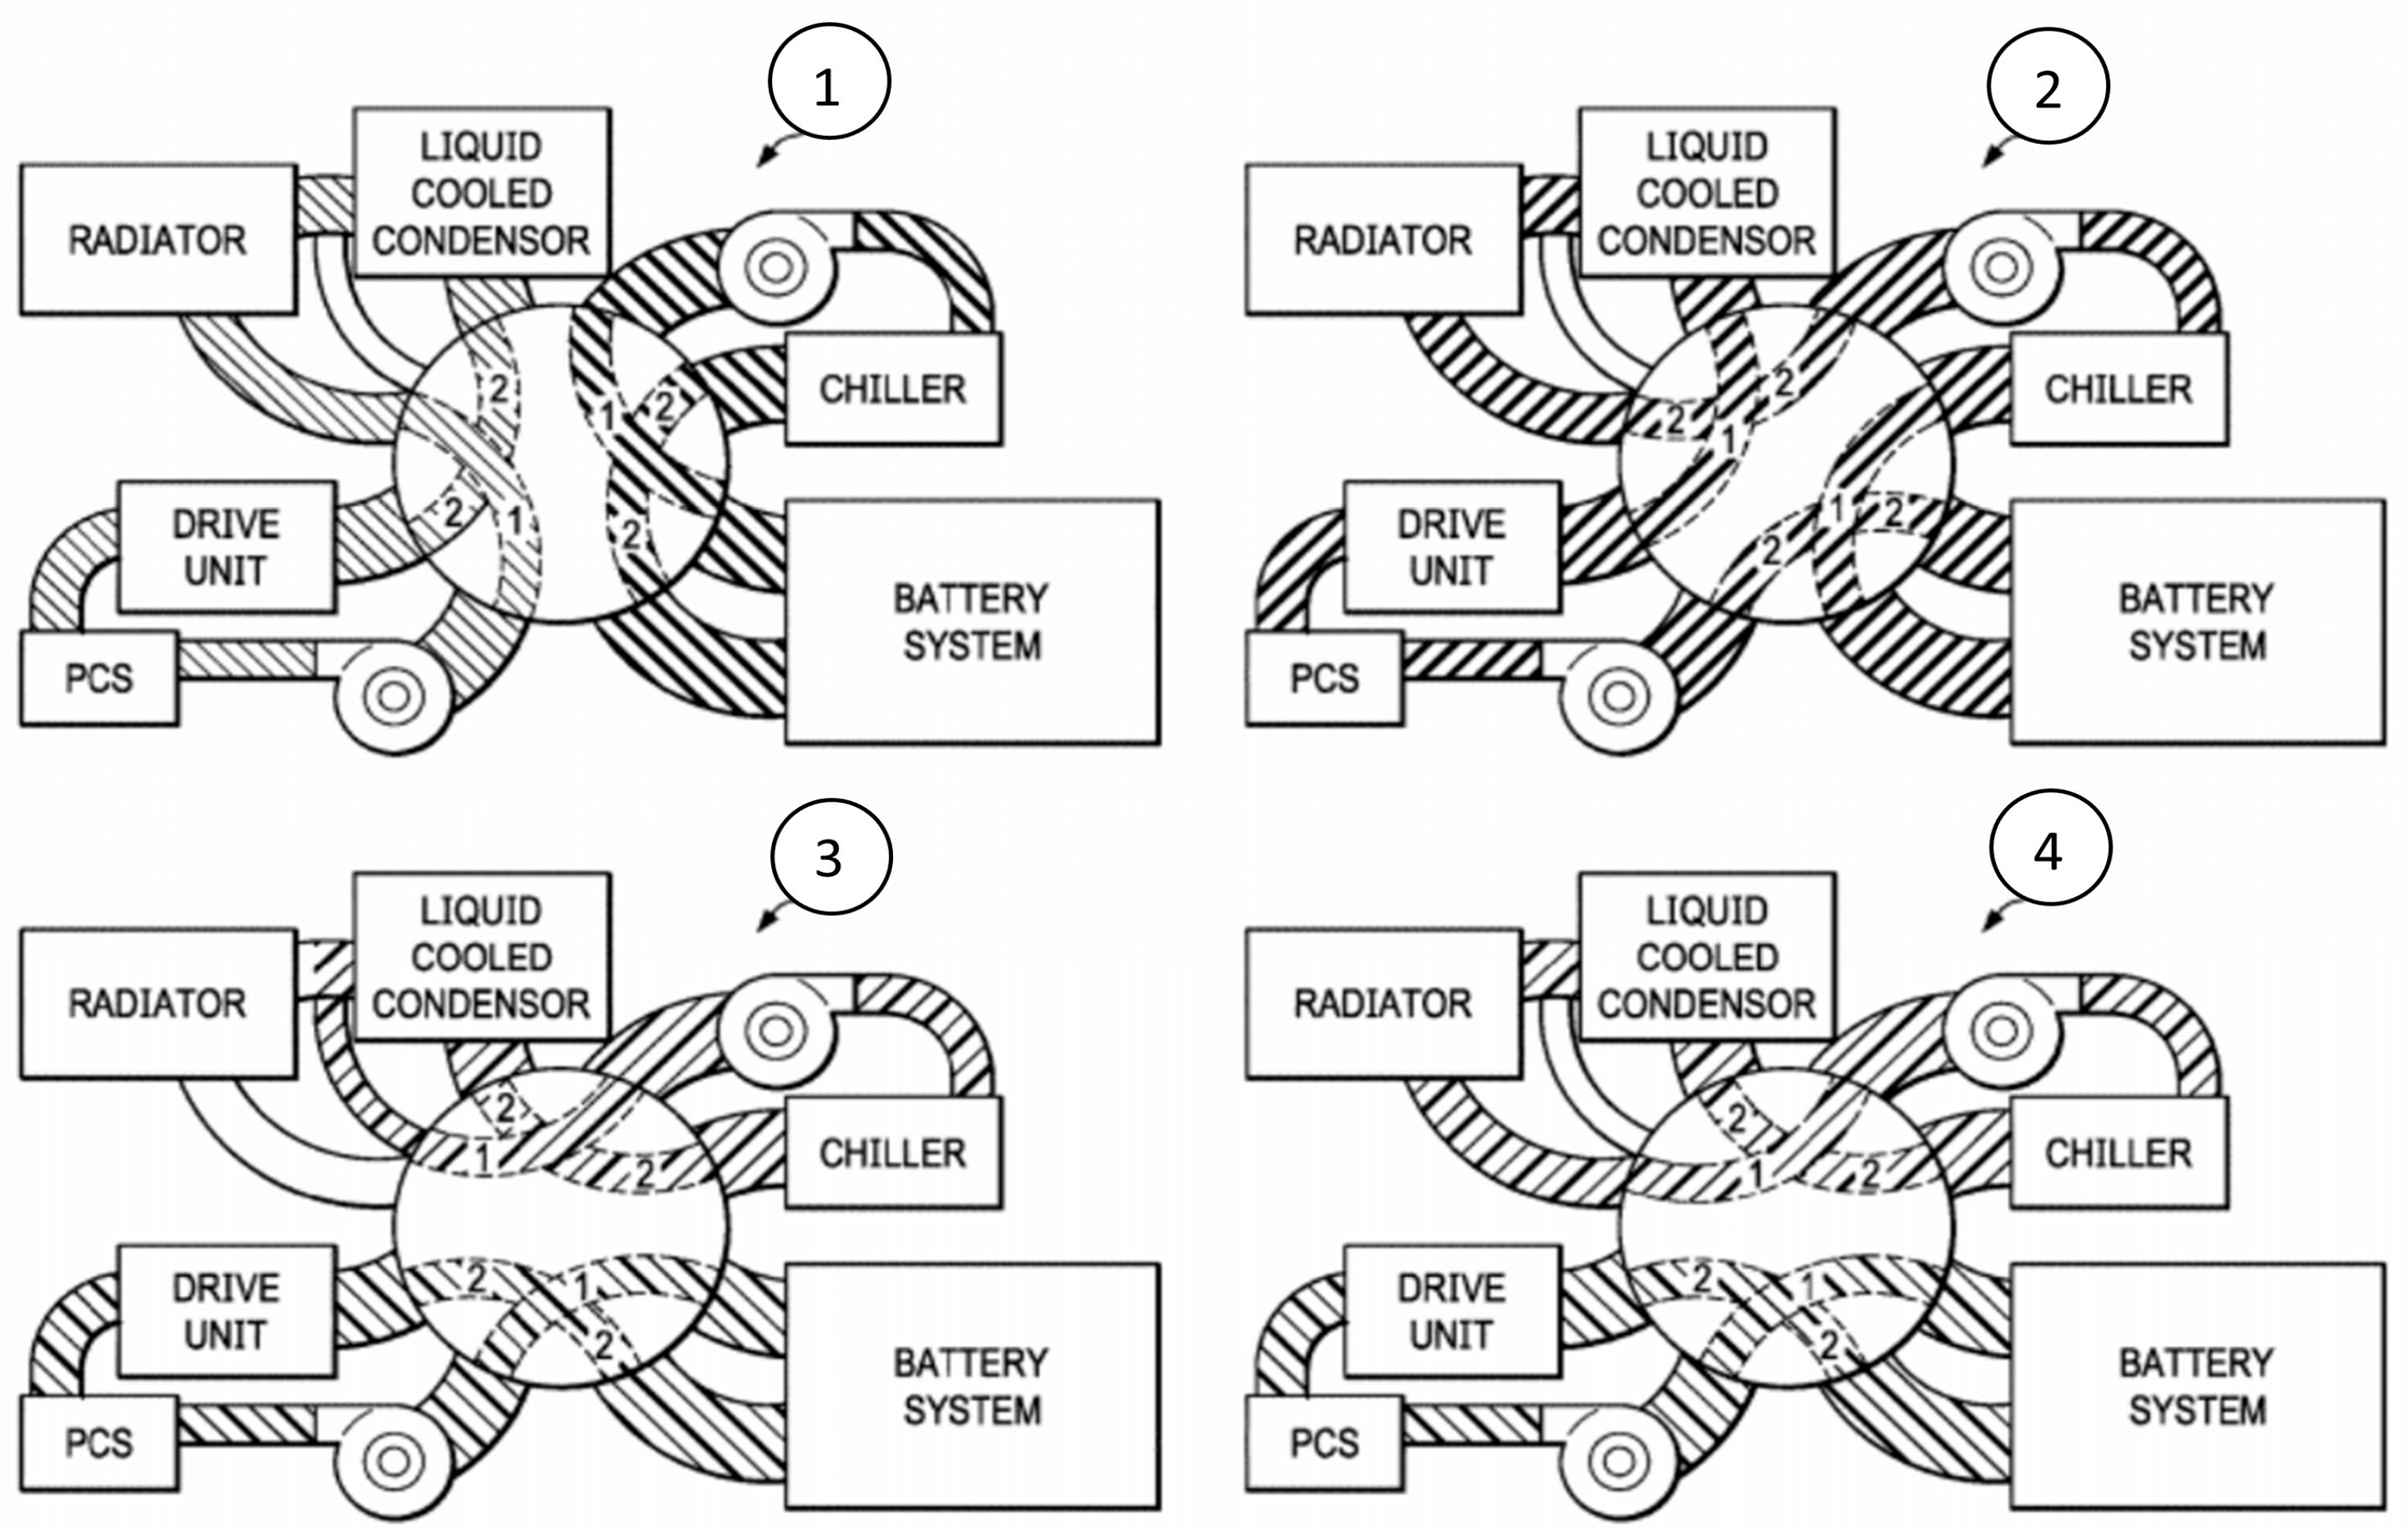
At the core of the system’s design is a fully integrated, multi-functional heat pump connected to a coolant circuit which can be heavily manipulated by a single valve. Where most EVs have a coolant circuit which does not interact with the cabin, this system uses a single heat pump which can interact with both cabin and coolant and provide a link between the two. The way in which the heat pump is designed allows heat to be transferred from the cabin to coolant (and ambient) or vice versa. To help control the flow of heat between the cabin, powertrain and ambient, Tesla has developed a new valve named the ‘octovalve’. This valve is a rotation valve with eight ports that allows coolant to flow in five unique loops. Each loop is capable of multiple functions depending on heat pump operation. The patent illustrates the valve operation of the four coolant loops with a simple diagram, shown in
Figure 1.
The valve in state 1 shows the coolant circuit in 2 parallel loops. The drive unit (inverter and motor), radiator and LCC in loop, and the chiller and battery on a separate loop. The valve in state 2 shows the coolant circuit in a complete series loop, with coolant flowing through all the components. The valve in state 3 shows the coolant circuit in different parallel loop configurations, with the battery and drive unit in loop and the LCC and chiller in loop. The valve in state 4 shows the same parallel circuit as state 3 but with the radiator in loop with the LCC and chiller.
Figure 1 shows an 8-port valve with the ability to change the routing between nine ports. The ninth port acts as a radiator bypass. In the patent’s supporting diagrams, this is shown as two 4-way valves and a 3-way valve for the bypass [
24]. As a result, valve states 1 and 2 can be adjusted to bypass the radiator, like states 3 and 4. A mode referenced in the patent but not shown using the simple coolant flow diagram has been created using the style of
Figure 1. This mode is shown in
Figure 2 and named mode 5 for this paper.
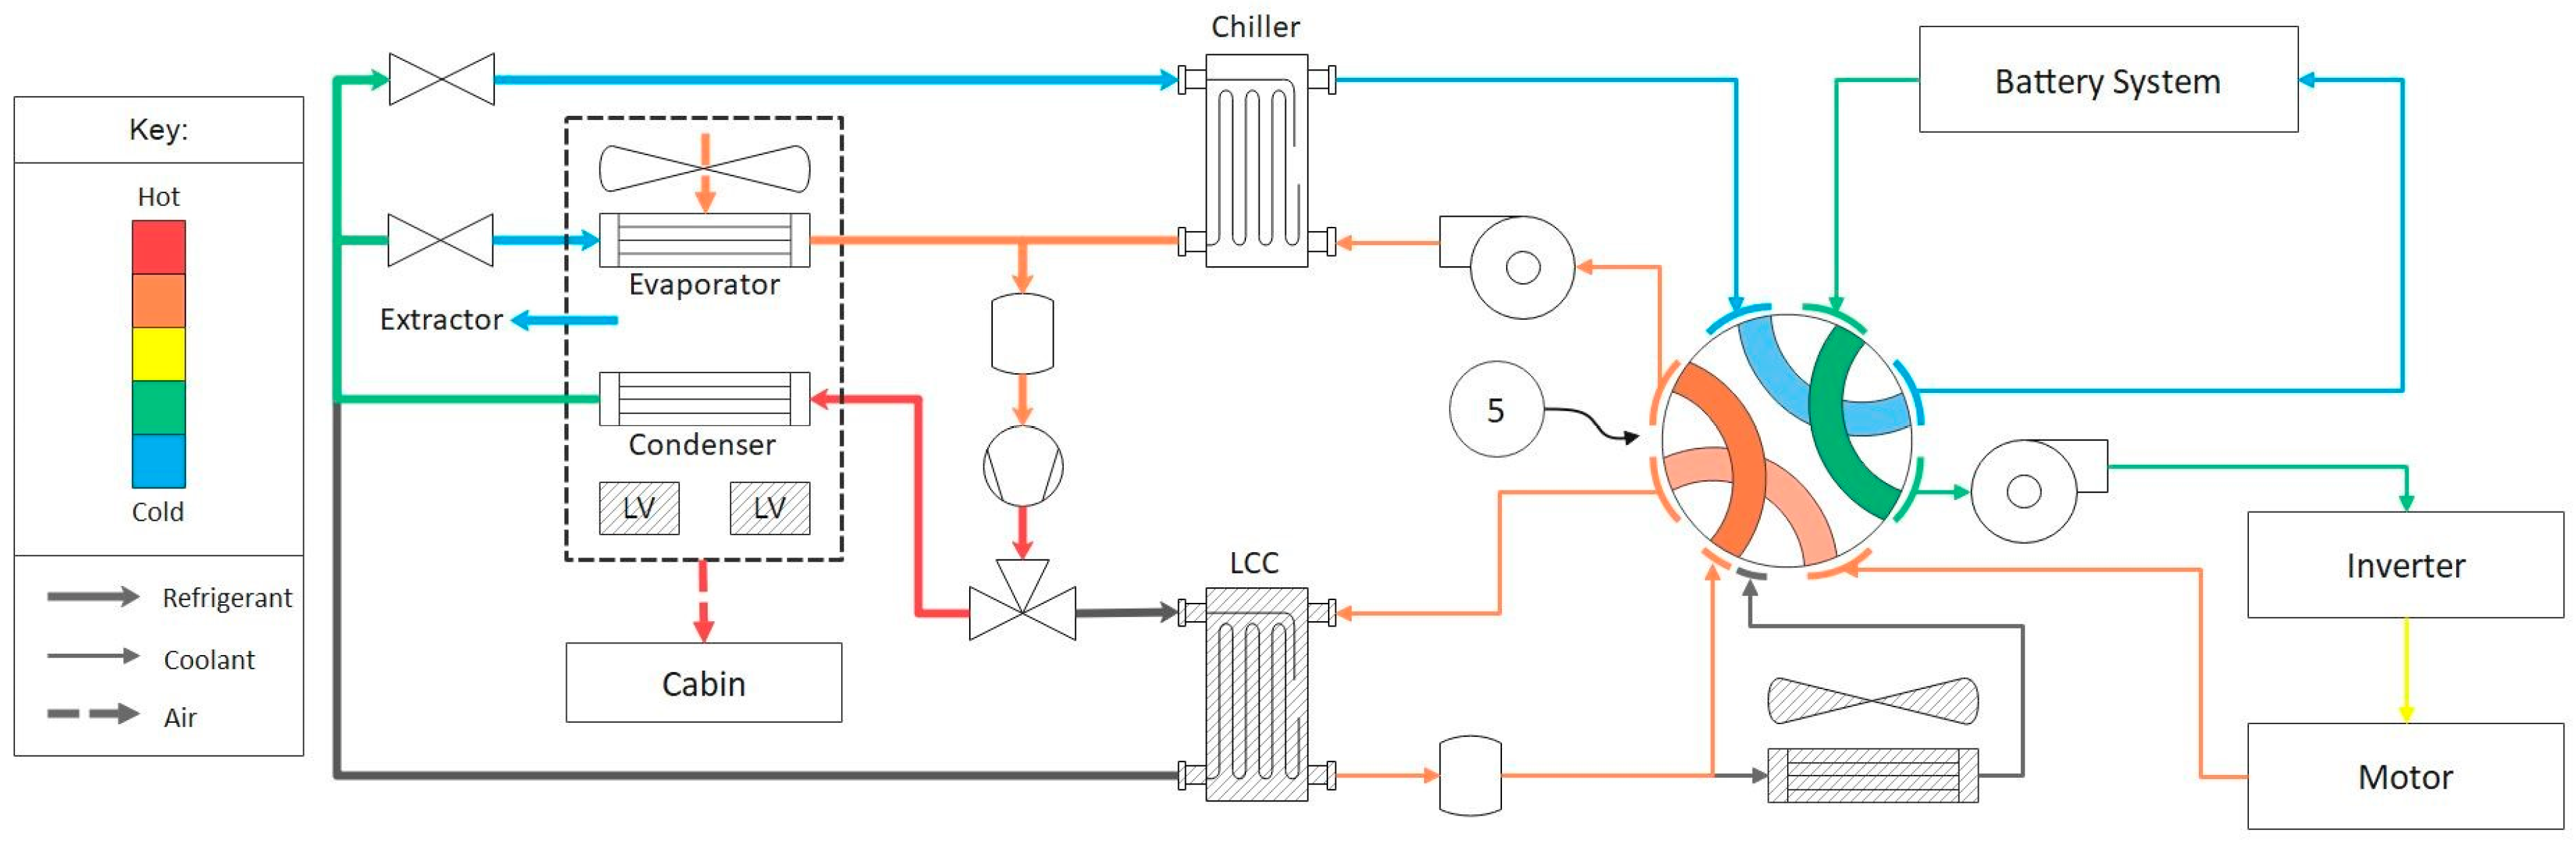
2.2. Heat Pump Design
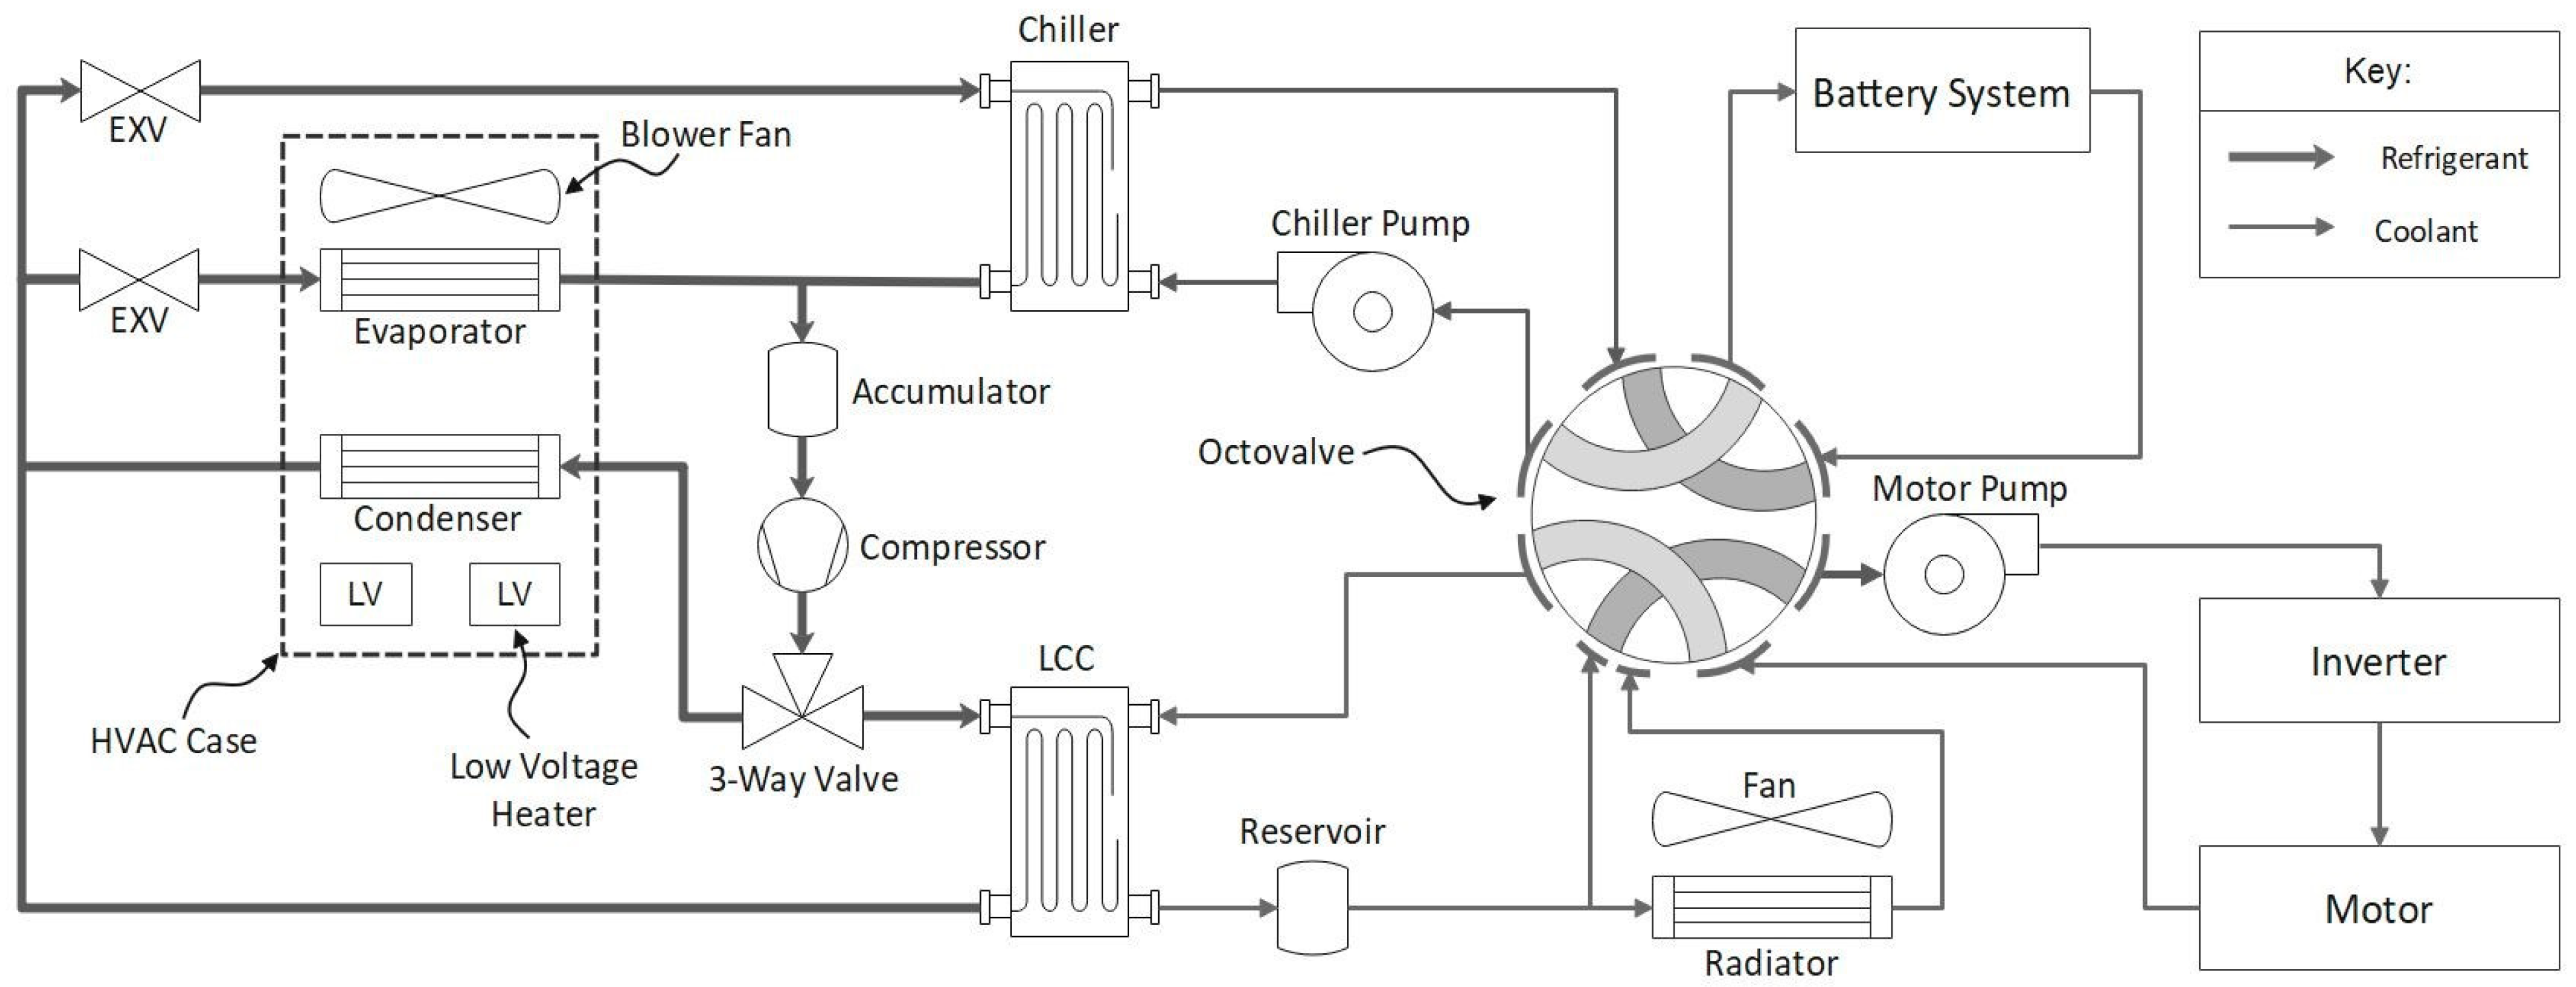
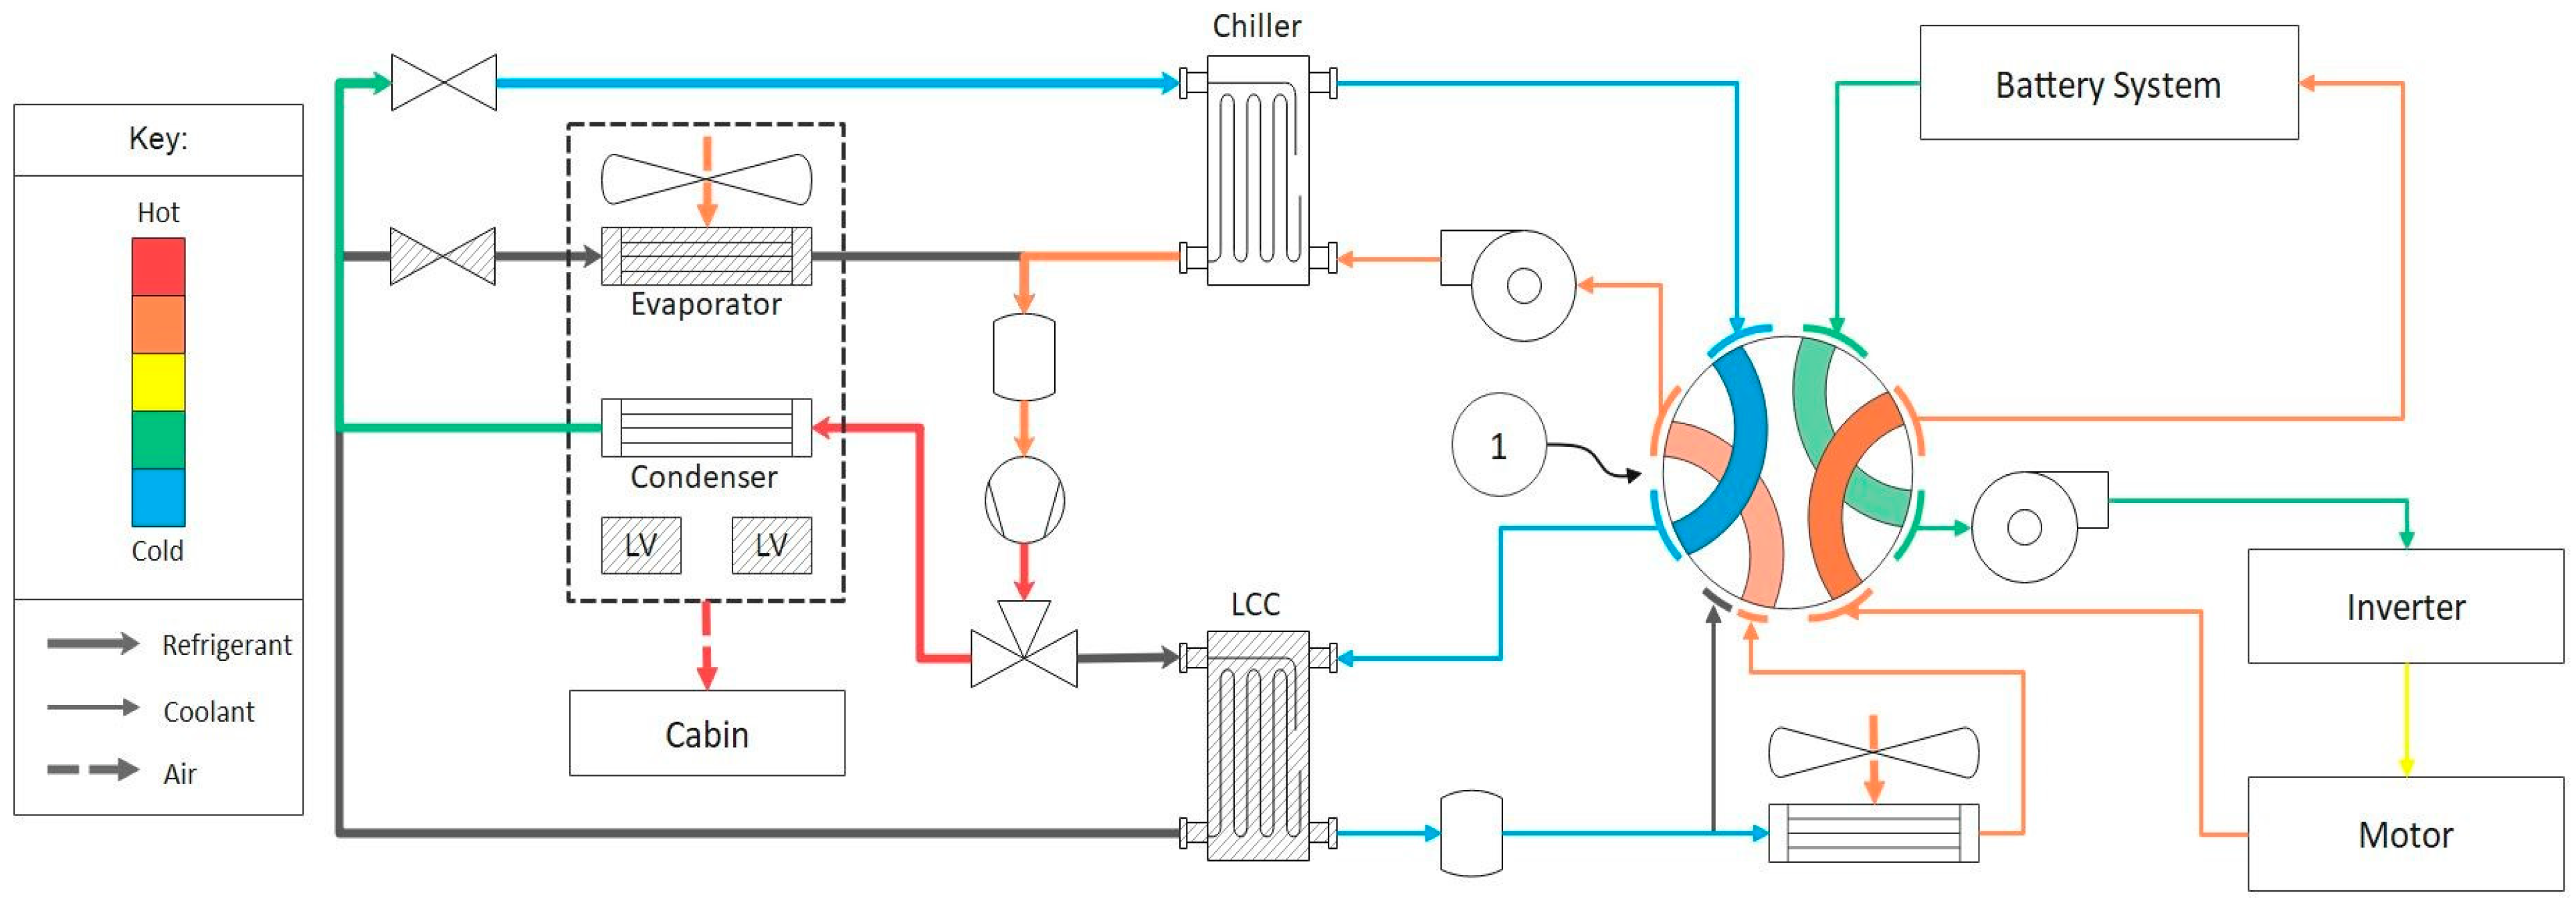
The Model Y heat pump consists of a single electrical compressor, 3-way valve, LCC, cabin condenser, two electronic expansion valves (EXVs), chiller, cabin evaporator, and accumulator, as shown in
Figure 3. This differs from the standard compression cycle by having two condensers (condenser and LCC) in parallel and two evaporators (evaporator and chiller) in parallel. To support this layout, Tesla has designed a fully controllable 3-way valve for delivering hot, high-pressure refrigerant to the desired condenser(s). Likewise, EXVs are used to actively control the superheat set point of the evaporators or even completely block flow to an evaporator when not required. This system is a large shift from the refrigeration layout used by many OEMs. With no external condenser, the heat must use the cabin condenser or radiator to transfer heat to ambient.
2.3. HVAC Case Design
As a result of having a cabin condenser, Tesla has designed a new HVAC case which houses the condenser, as shown in
Figure 4. The case is a V-shape design to allow water to flow off the evaporator and through the extractor without contacting the condenser. There is a recirculation duct which resides within the HVAC case to route condenser exhaust back to the evaporator inlet. The reason for this internal recirculation duct will become apparent in the sections following.
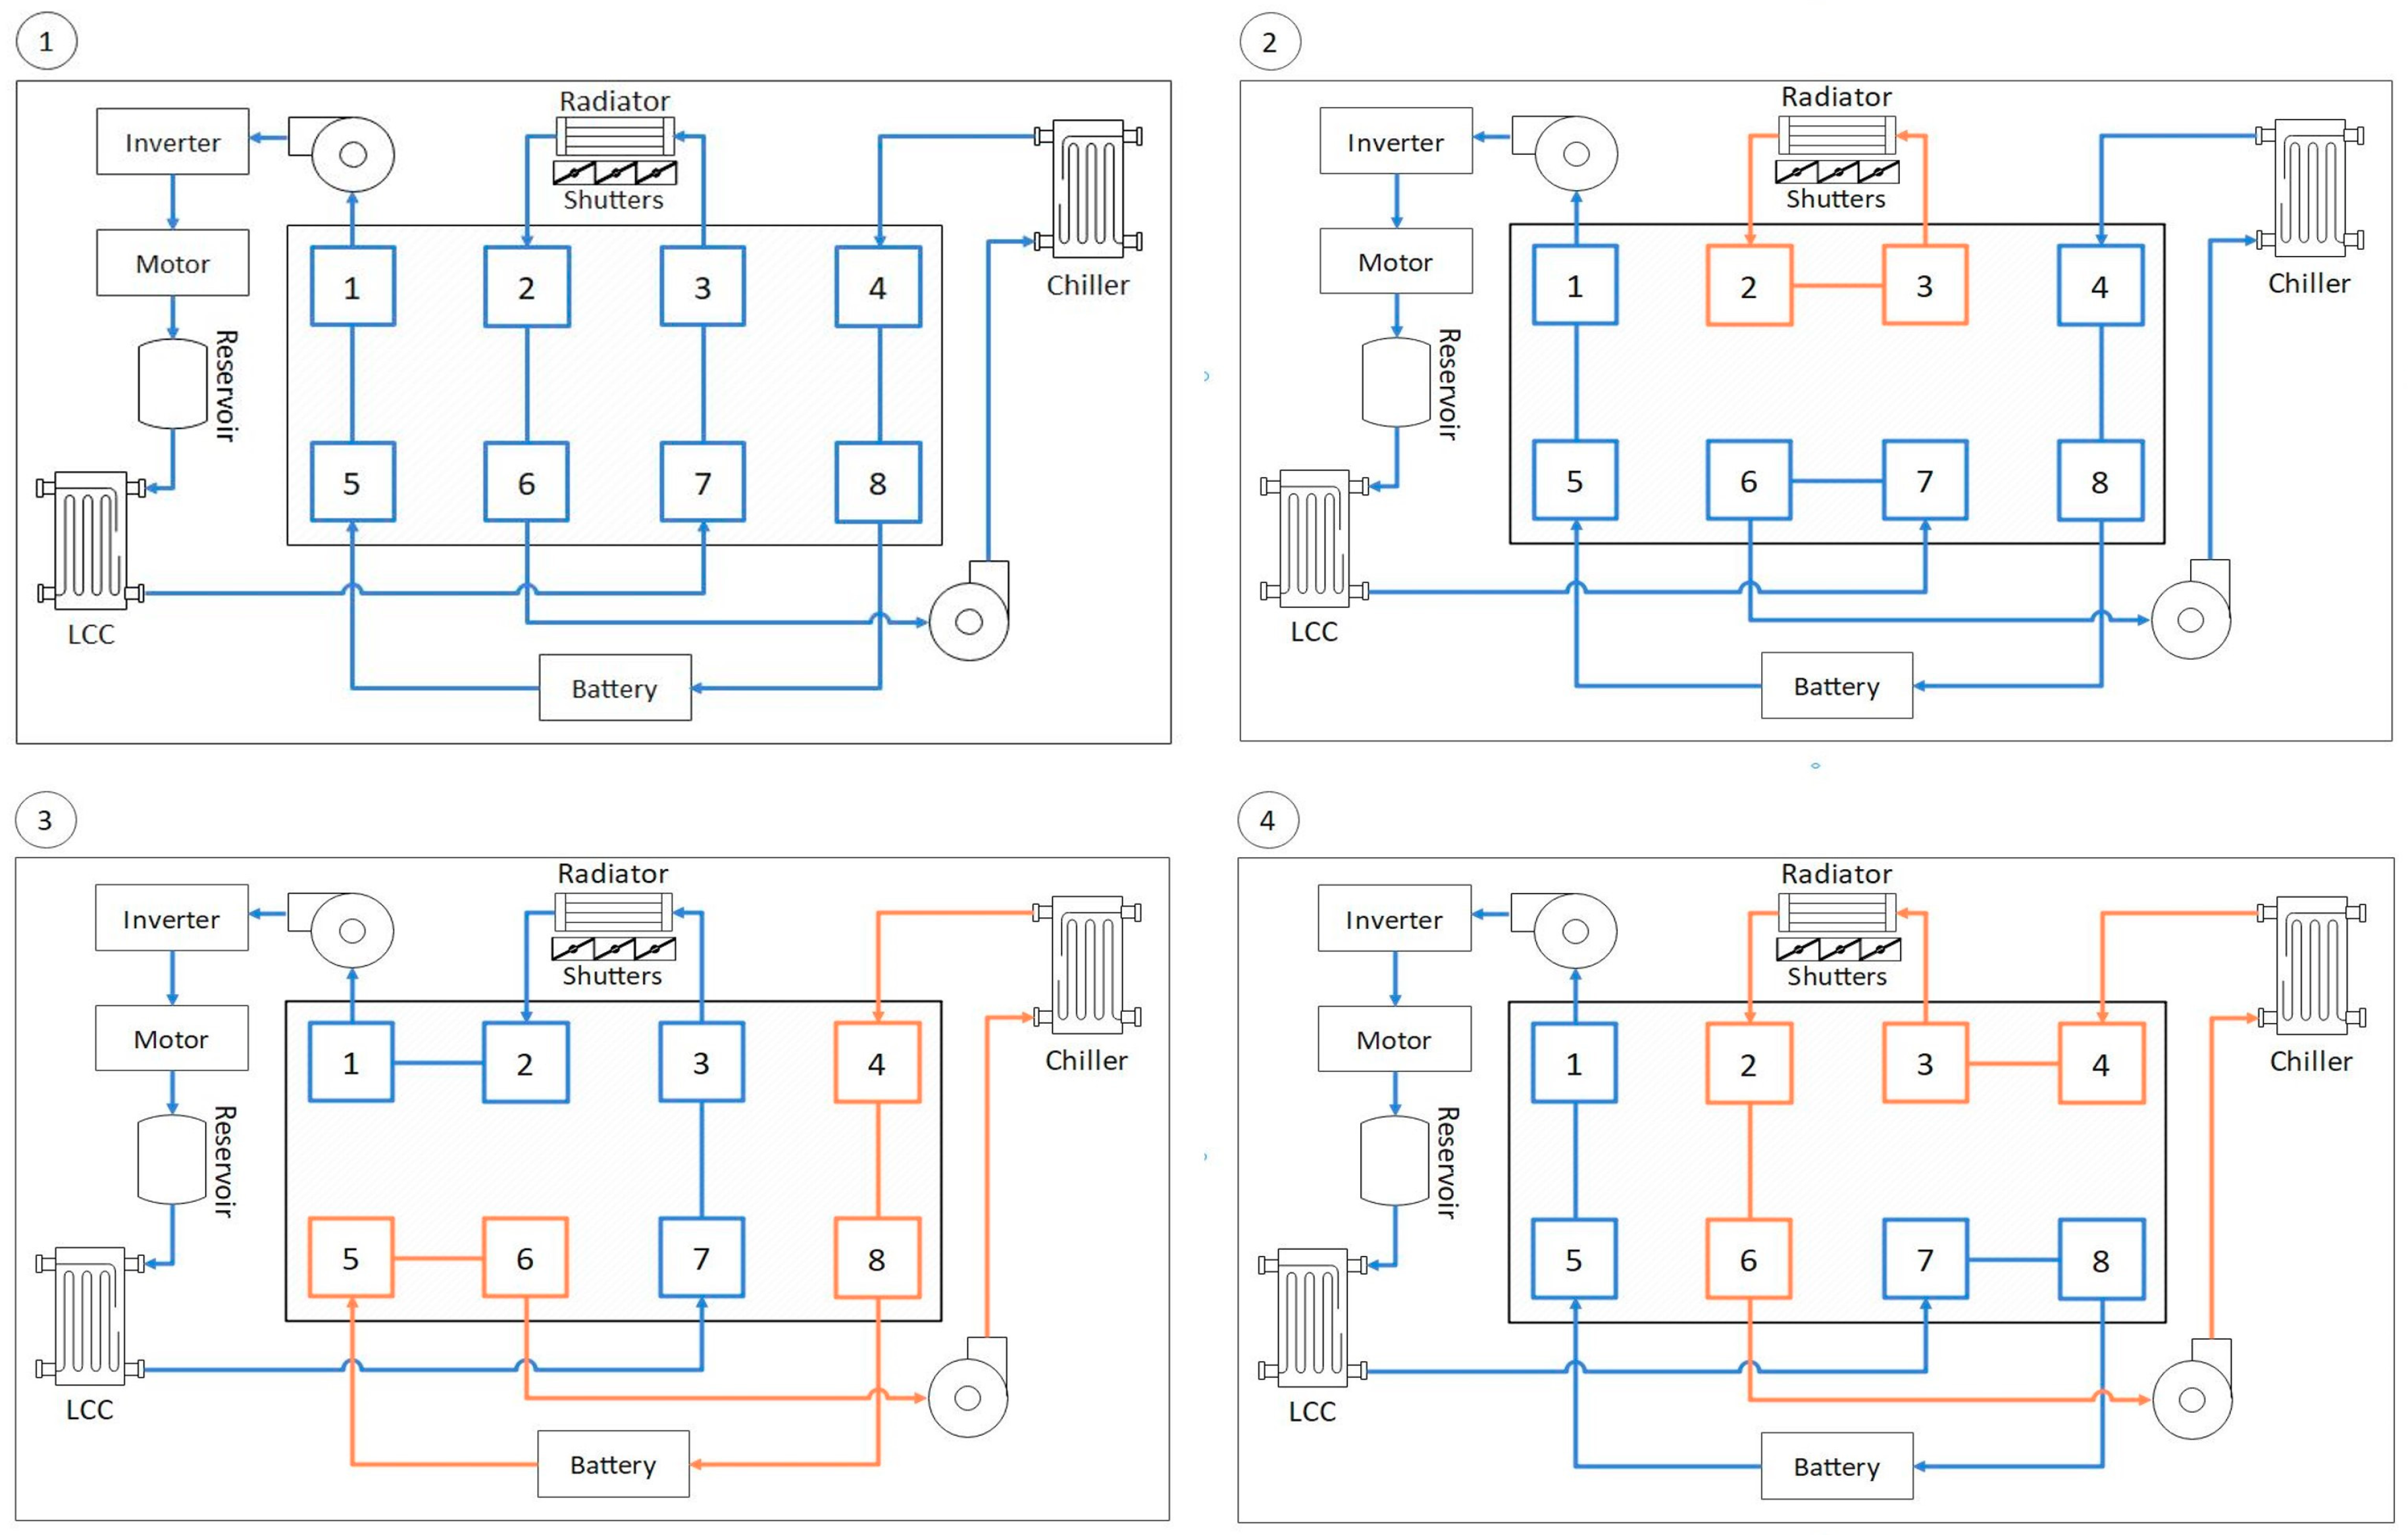
2.4. Heating Modes
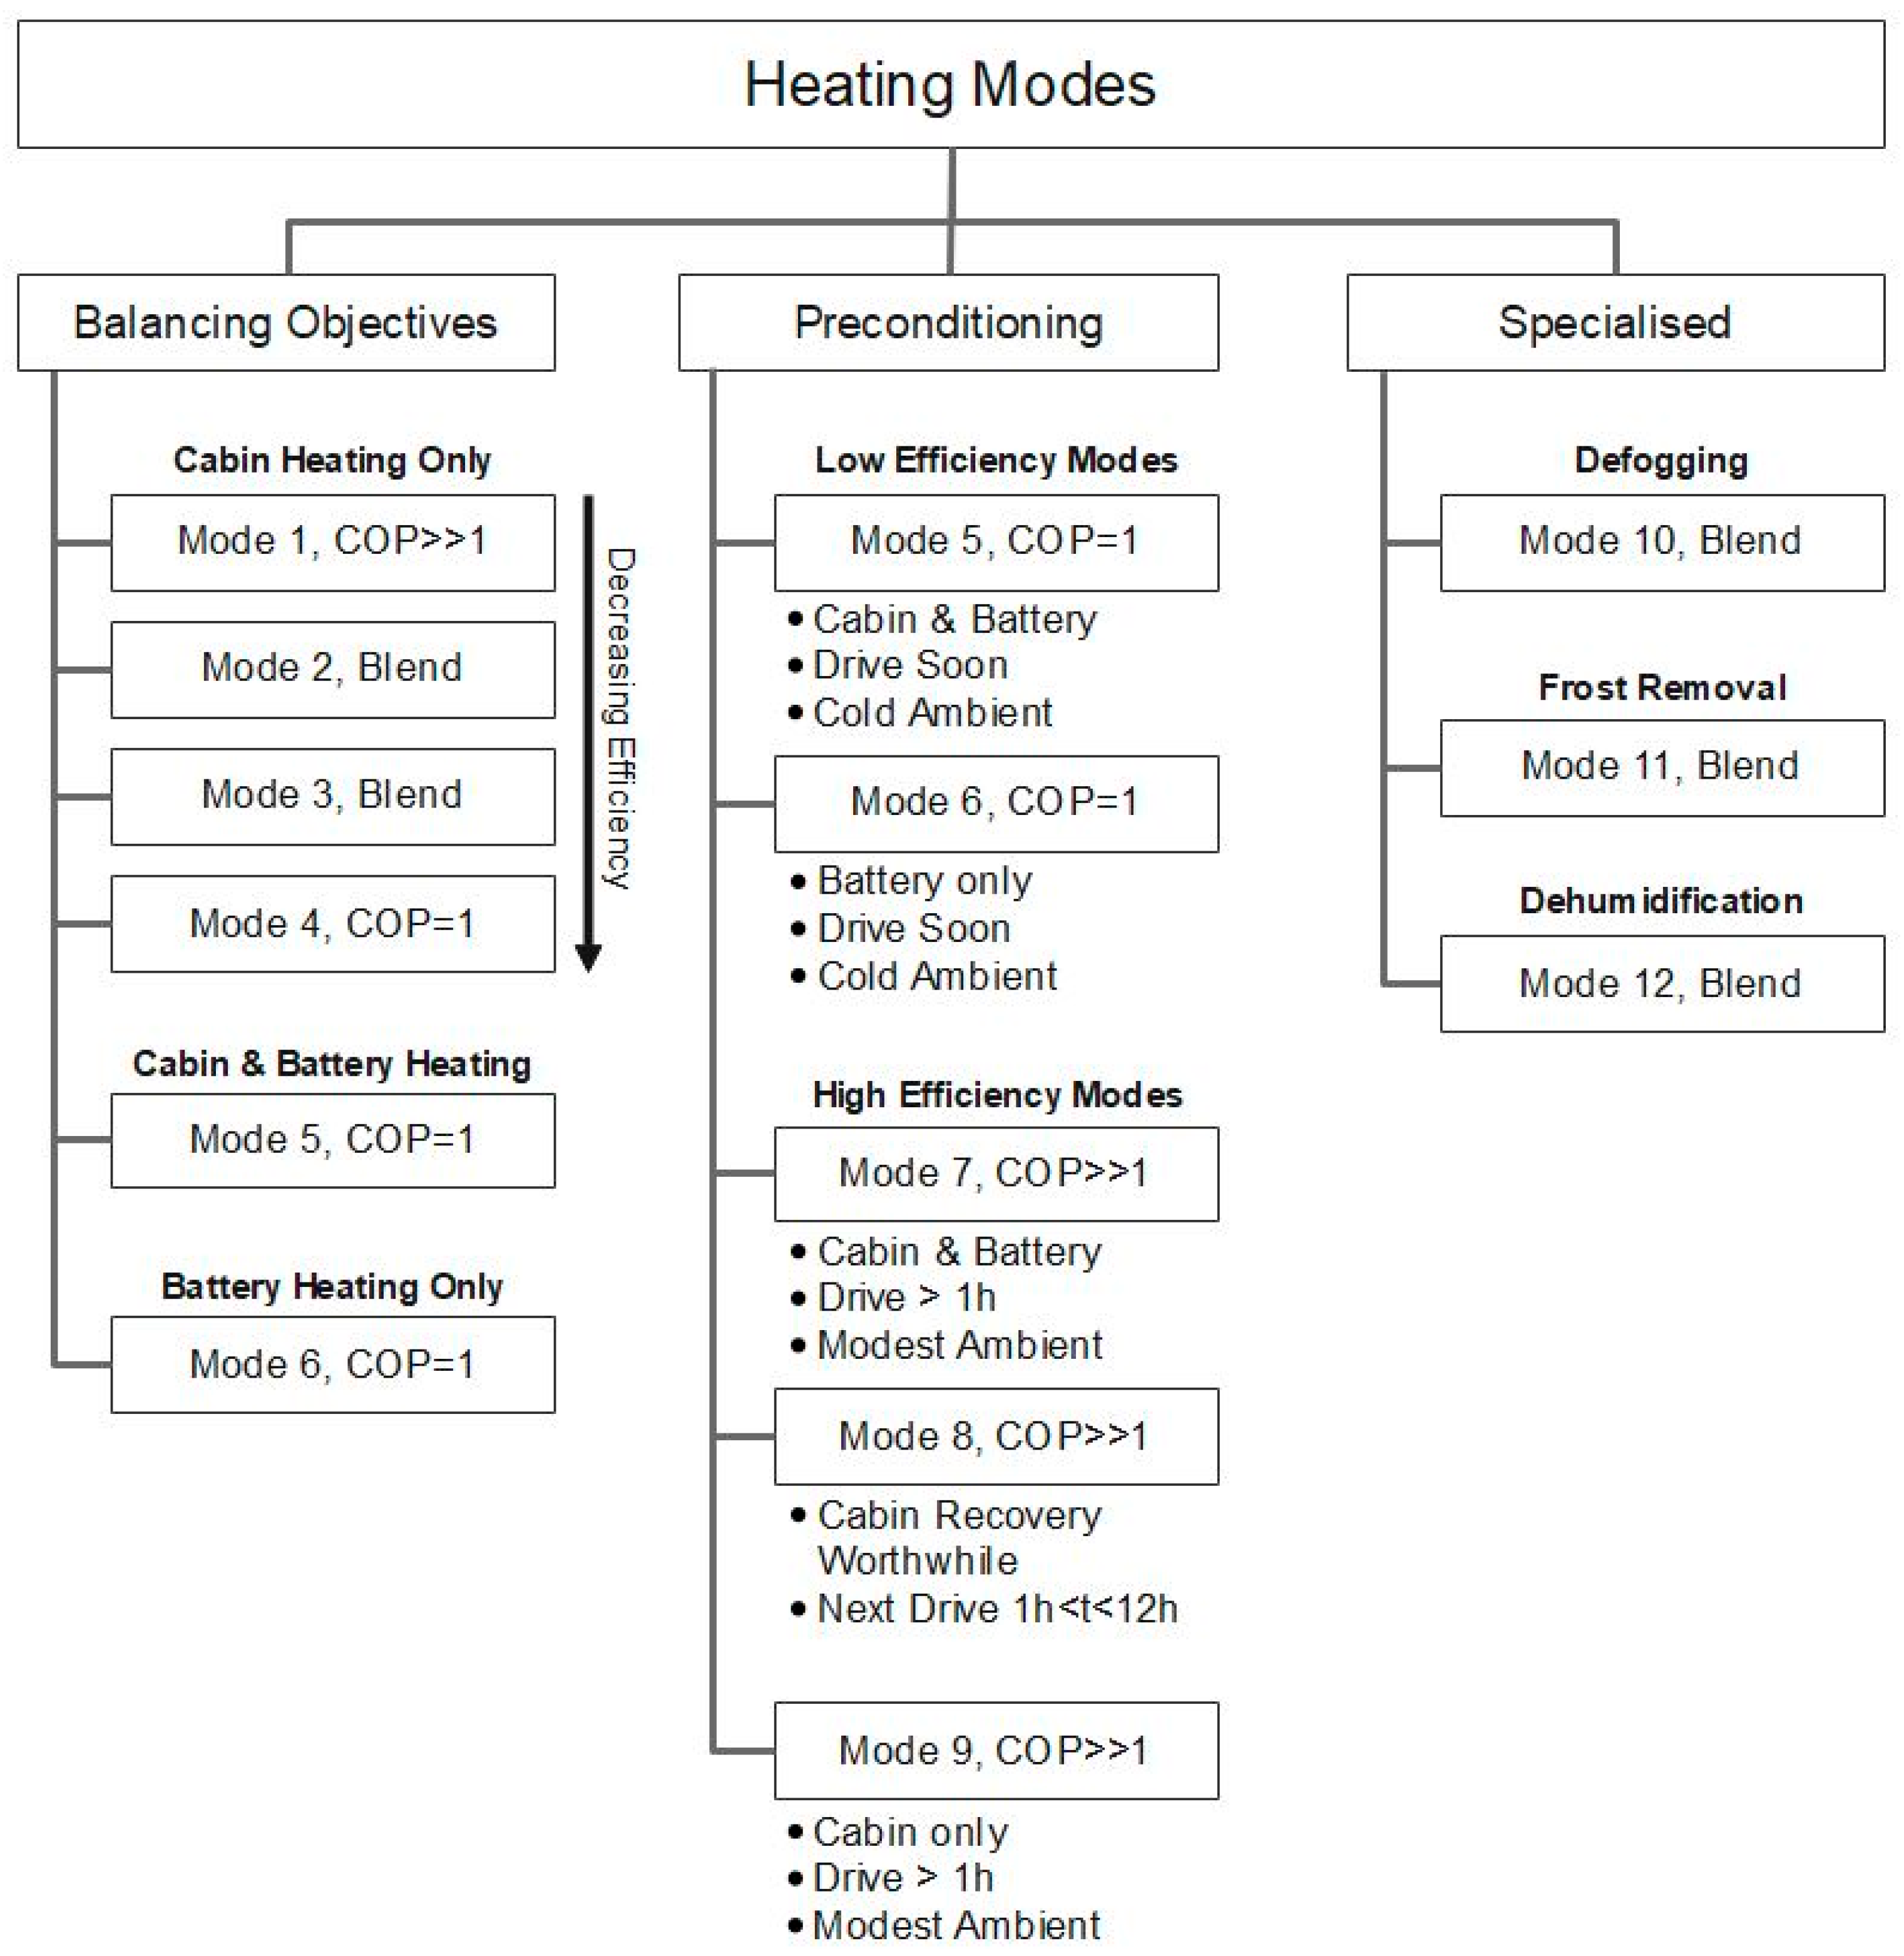
The system under analysis has a total of 12 heating modes shown in
Figure 5, each with a primary objective(s) where the criteria that the net energy to the target components(s) is >0. These are categorised under three titles. Balancing objectives: the main group of heating modes where there is a primary target component requiring thermal energy (cabin, battery, or combined) and, depending on other component needs, sourcing energy to maximise efficiency. Preconditioning: modes designed to store energy between drives and transfer the energy to target components to reduce warm-up time and unnecessary energy consumption. Specialised: modes designed for very specific tasks, not necessarily improving thermal comfort or improving powertrain performance. In this paper, we will not consider preconditioning modes or specialised modes. Only the core “Balancing Objectives” modes for heating are explored.
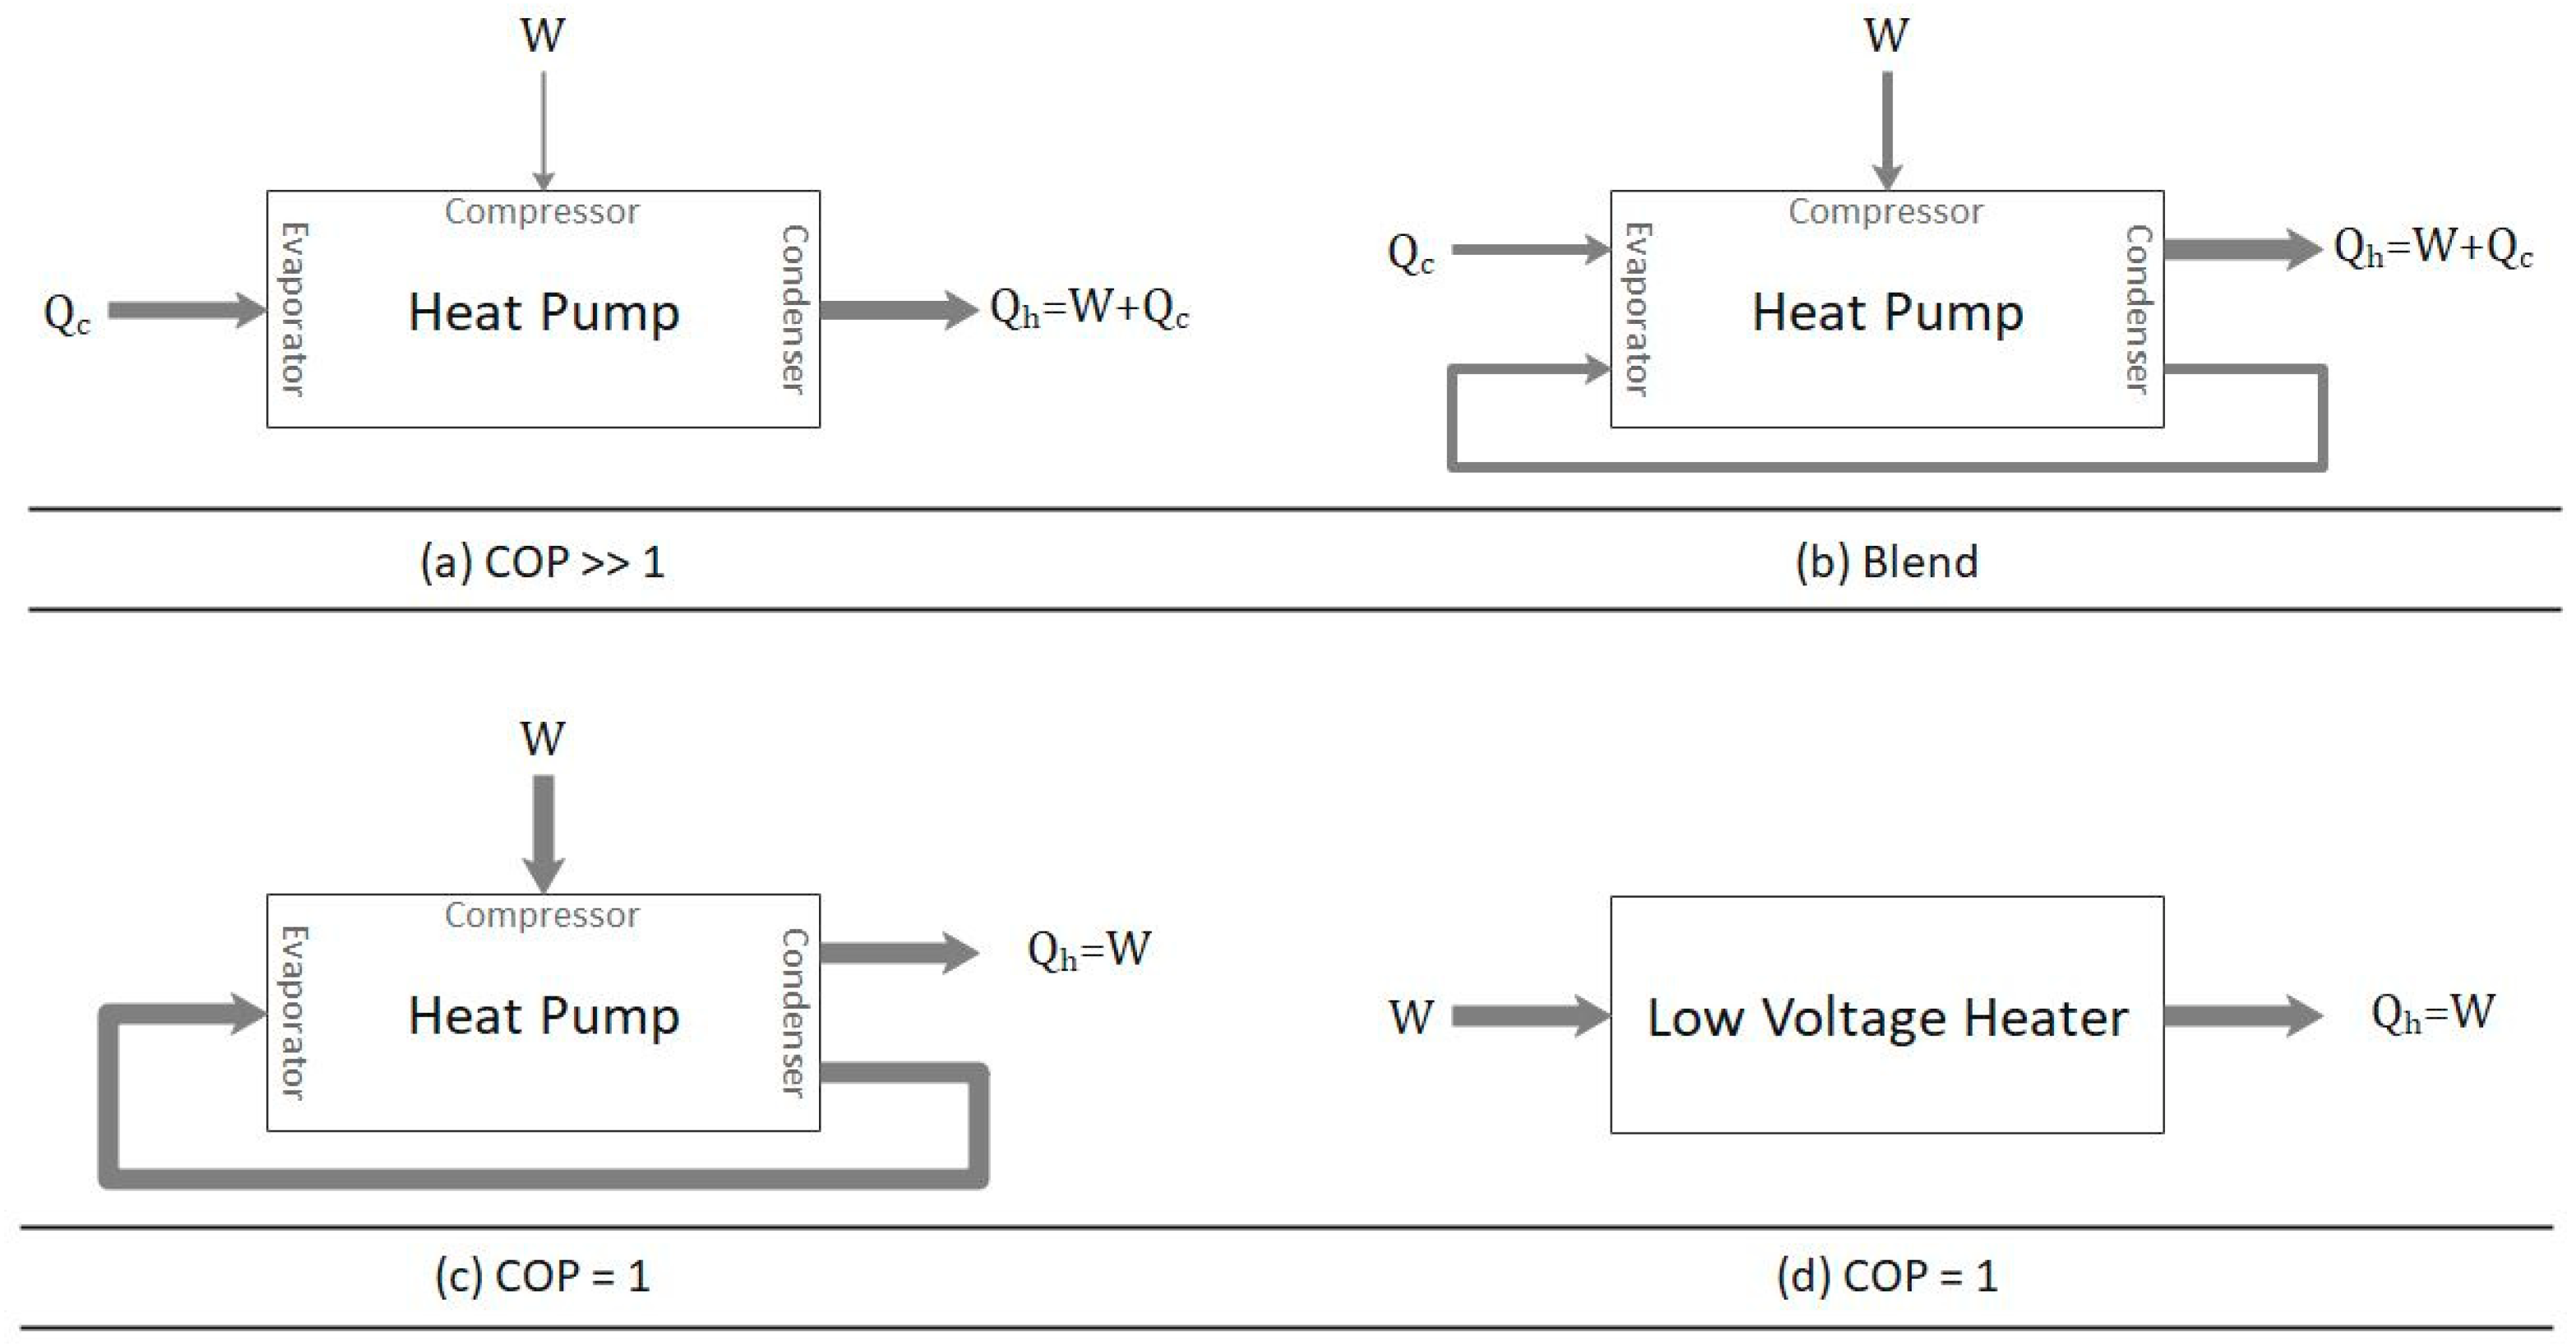
Each mode has a generalised coefficient of performance (COP) which describes the heat pump’s ability to source energy. From the definition:
When the primary objective of the heat pump is heating, the equation can be expressed as,
Therefore, the most efficient heating modes are capable of sourcing energy from thermal reservoirs with little input energy resulting in a COP >> 1 (
Figure 6a). Conversely, the least efficient methods of heating are where the electrical energy is equal to the output thermal energy (COP = 1).
Figure 6d shows a low voltage heater which uses resistive heating to produce thermal energy, a typical example of COP=1 heating. A heat pump can perform a similar function where the compressor effectively becomes the heater. The cabin evaporator and condenser are active; the condenser cancels absorbed energy at the evaporator and releases the equivalent energy in the compressor. The effect is that the compressor energy is equal to the incremental energy given to the cabin (
Figure 6c). Finally, if there is a heat reservoir available but more thermal energy is required, the heat pump can operate as a ‘blend’ of COP >> 1 and COP = 1. Hence, the heat pump operates as previously but partially sources energy from the heat reservoir (
Figure 6b). Low voltage heaters can also work in harmony with the system to produce more COP = 1 energy.
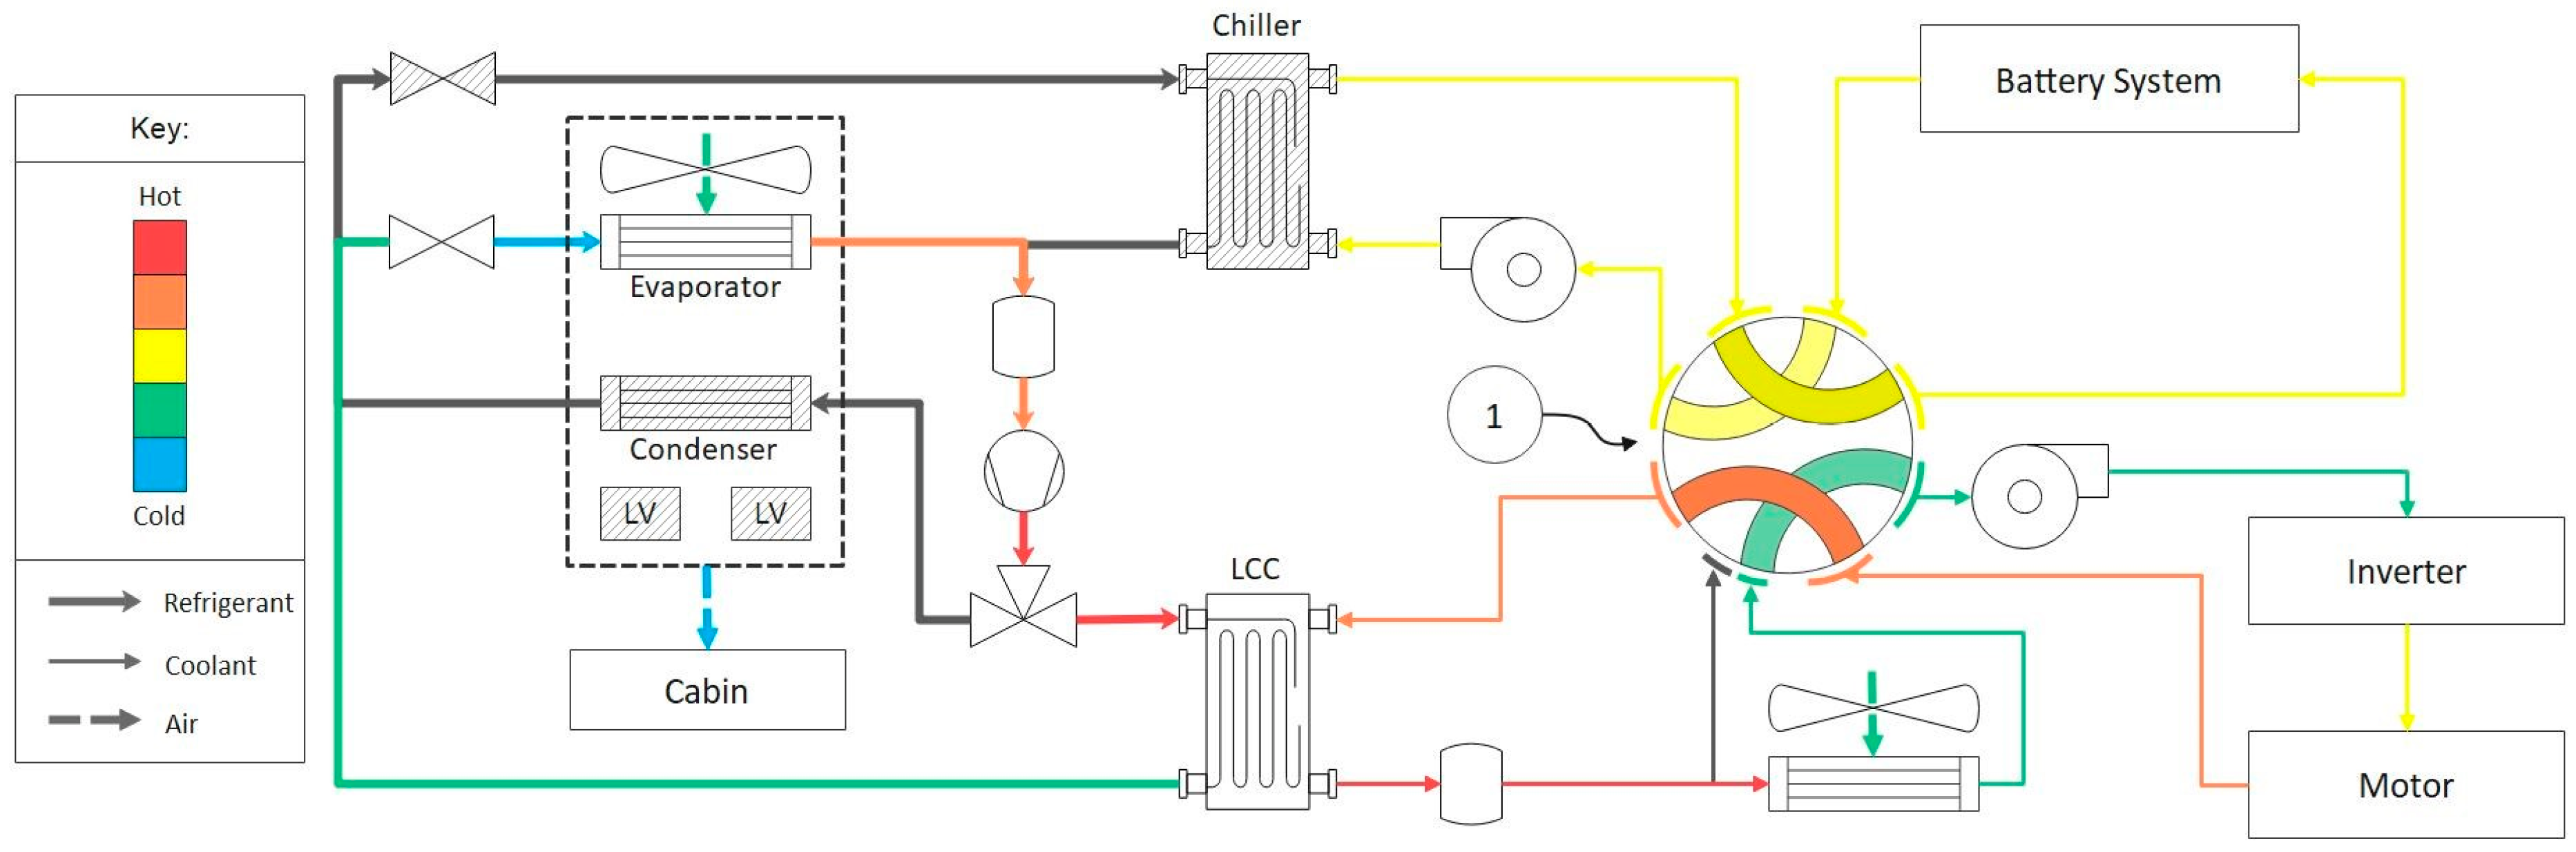
2.4.1. Mode 1
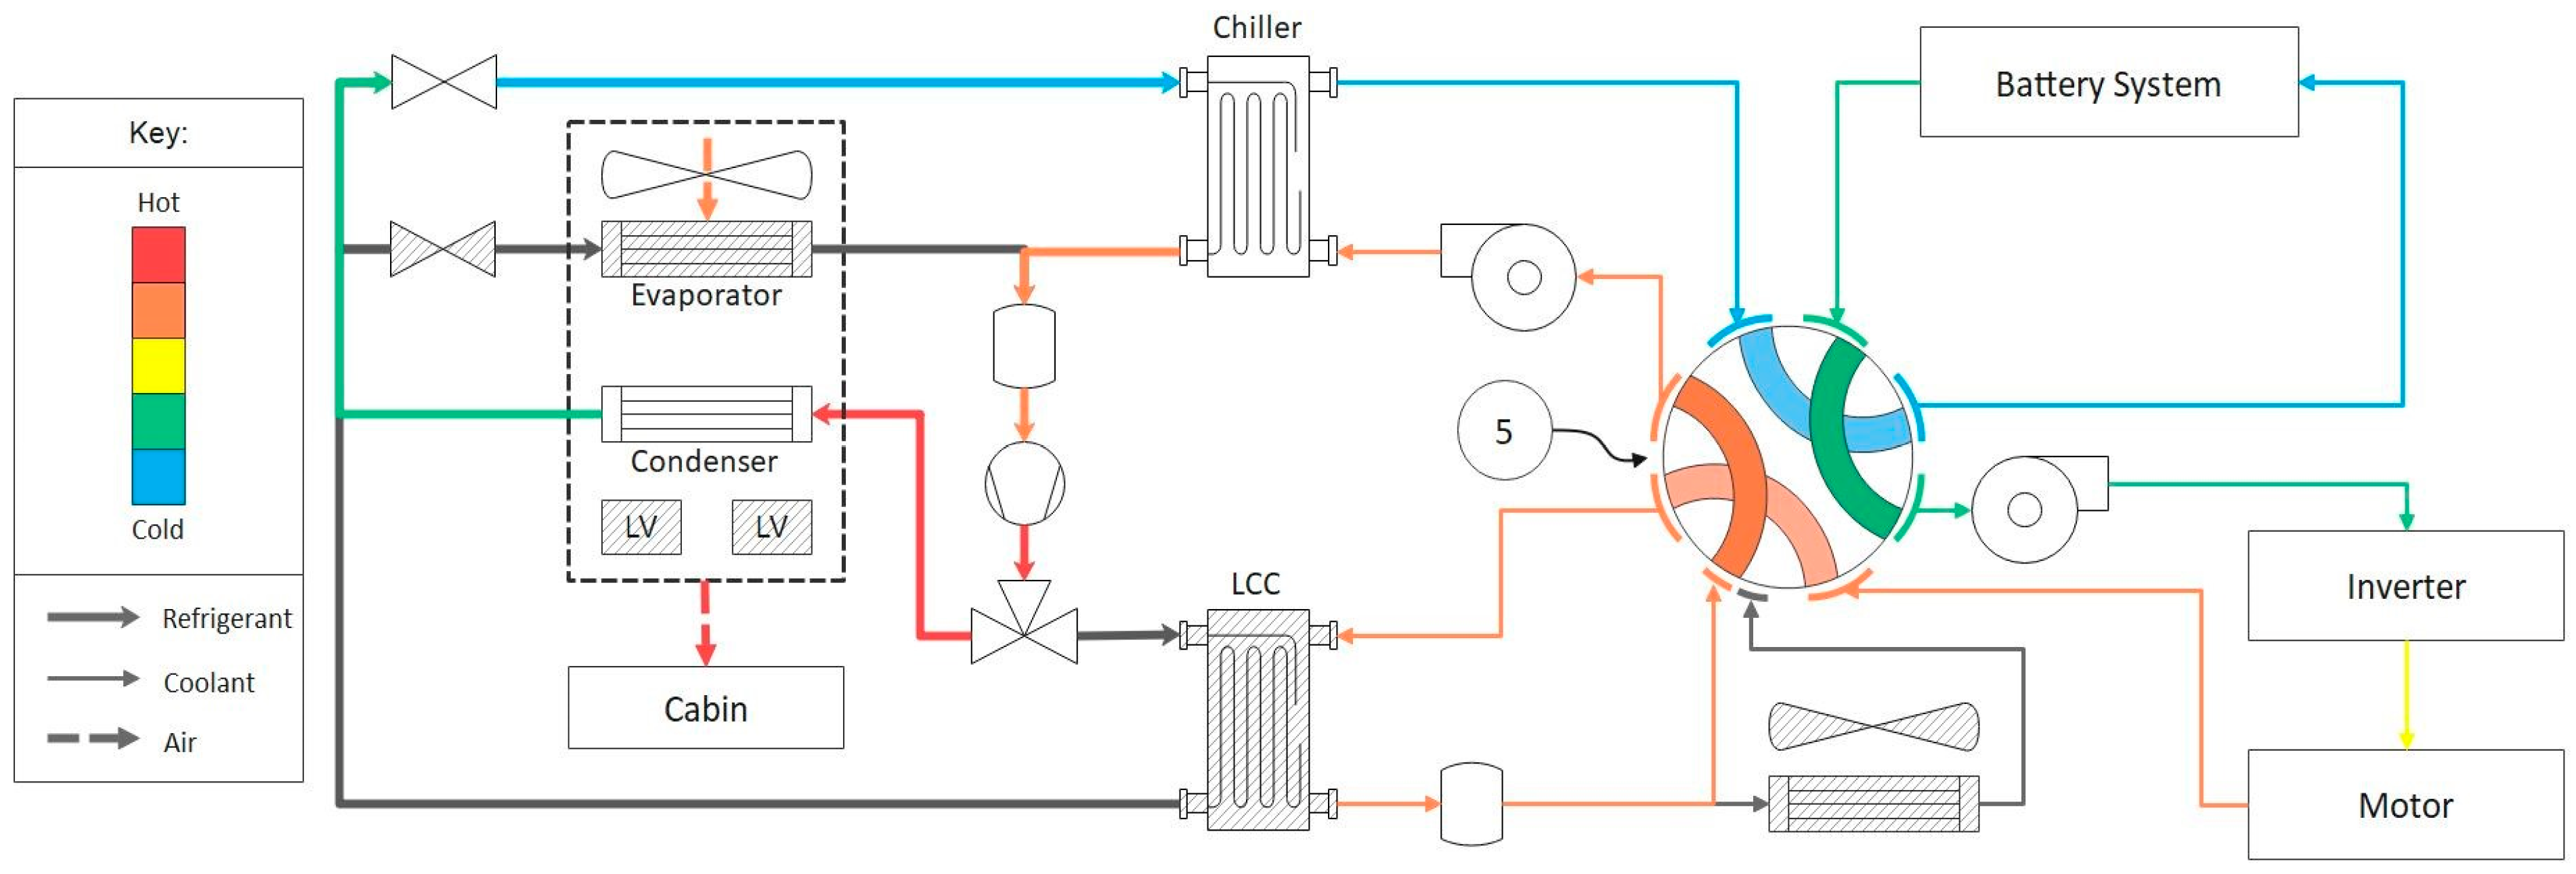
Mode 1 is the most efficient cabin heating mode operating in a COP >> 1 state (pure heat pump). In this mode, energy is sourced by either the ambient air or the battery system/drive unit (considered to be ‘free’ from a cycle efficiency perspective) shown in
Figure 7. The heat pump compressor operates in an efficient mode to maximise vehicle range. Heat can be sourced from the ambient air if the atmospheric temperature is above −10 °C (coolant thermal energy is greater than the refrigerant and the chiller). However, the closer to −10 °C, the less effective the system becomes. If the drivetrain is above ambient or the battery requires cooling, it is more effective to source energy from these components as shown in
Figure 8. In both instances, the 3-way valve routing fluid to the LCC is closed, EXV to the cabin evaporator is fully closed, and the chiller and cabin condenser are active. On the coolant side, the octovalve is set to position 1 for ambient sourcing and 5 for drivetrain sourcing. In both cases, heat from the coolant side is transferred to the chiller refrigerant to be rejected at the cabin condenser.
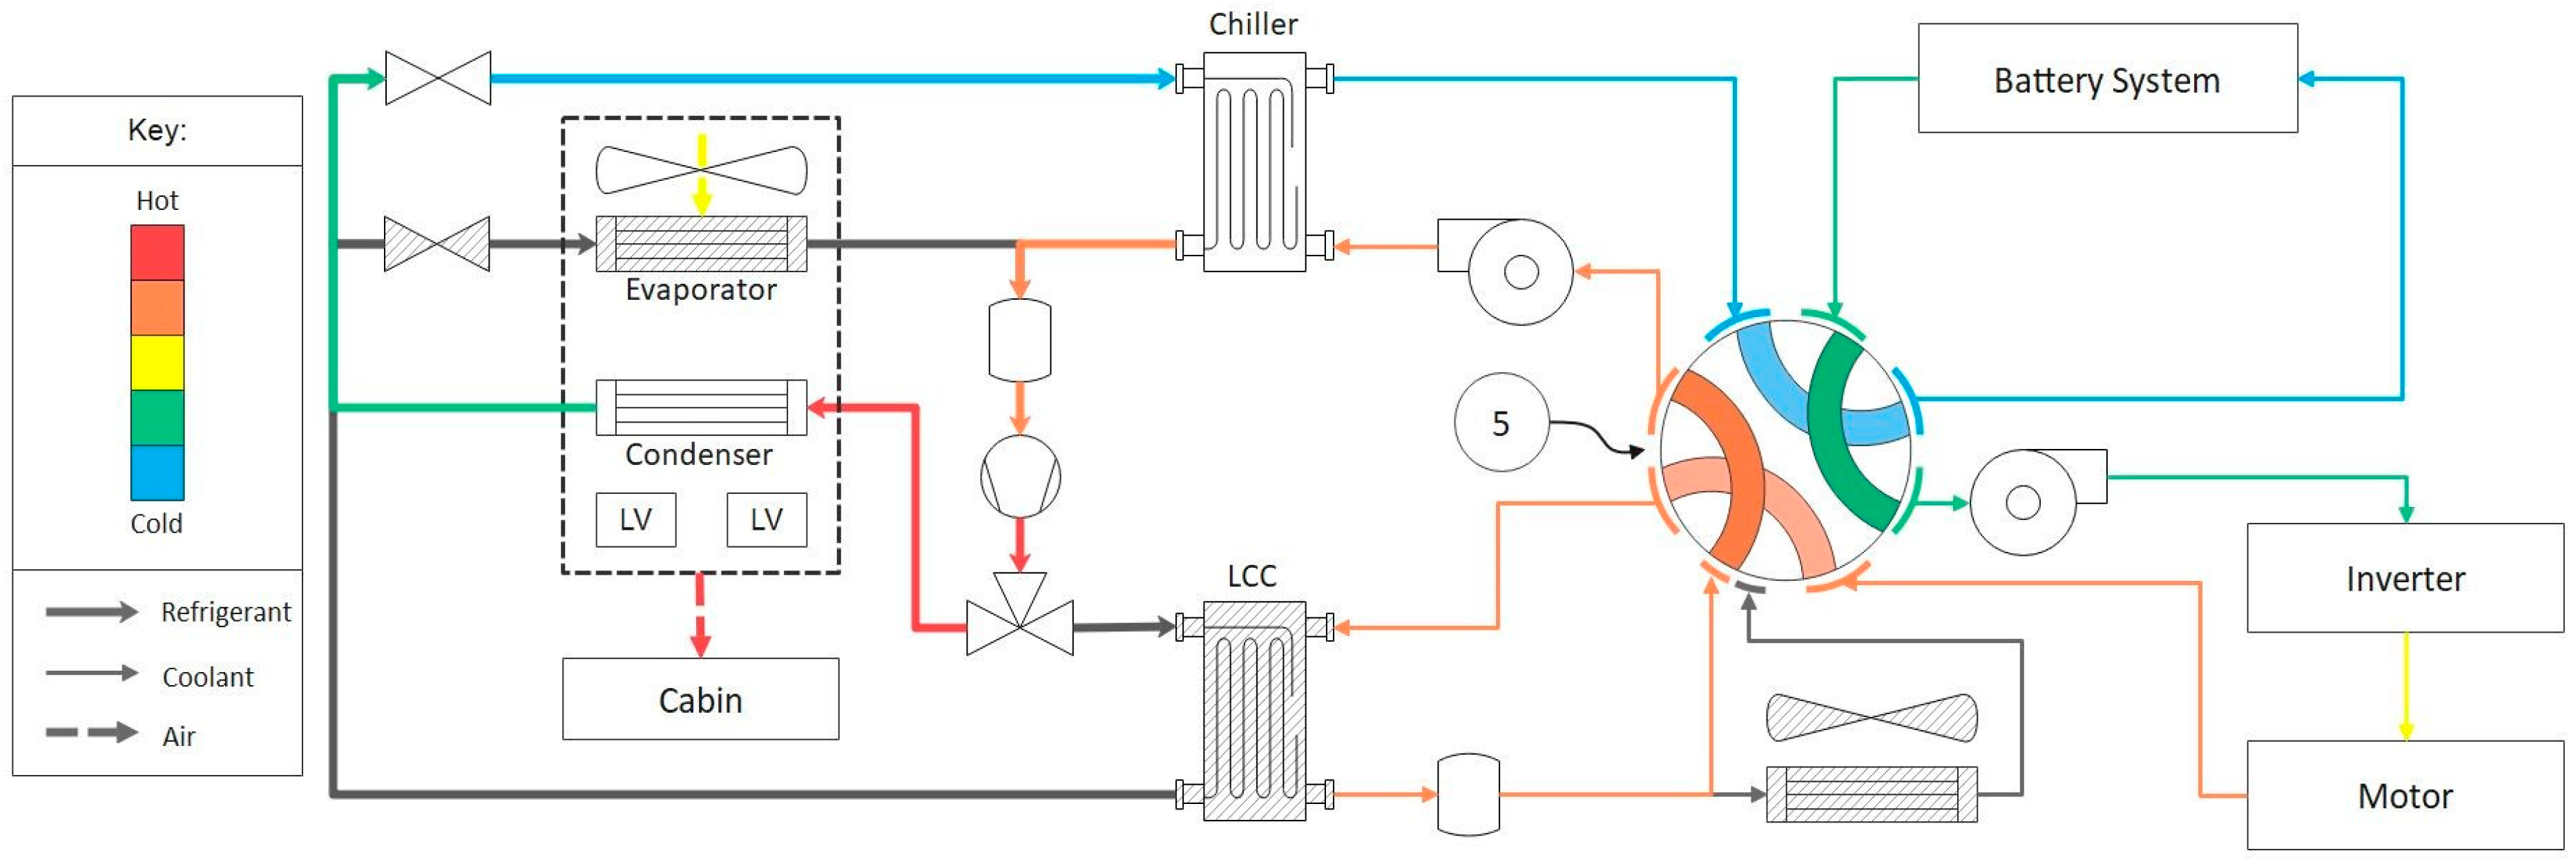
2.4.2. Mode 2
Figure 9 shows the system in a second heating mode, used when either of the mode 1 configurations cannot supply the demand. Given that conditions remain the same as heating mode 1b, mode 2a will be active. In this mode, the configuration will remain the same as 1b, now with the LV heaters active. The LV heaters will contribute to a COP = 1. This mode is known as a ‘blend’ as the COP >> 1 and COP = 1 heating methods combine to form to set COP > 1 (roughly 1–2). In this mode, the proportion of heat sourced from the battery to LV can be controlled if the battery still requires warming. Having the LV heaters active provides a slightly higher thermal output to the cabin and left/right differential heating if the driver and passenger demands differ.
Alternatively, if there is still energy available in the ambient air, the system will operate as shown in
Figure 10. Instead of using the LV heaters, it is possible to produce the same ‘blending’ effect using the cabin evaporator. Within the HVAC casing, there is an extractor in between the cabin evaporator and condenser. If this is open and the condenser, evaporator, and chiller are active, it is possible to source energy from the powertrain and ambient. As a result, the sourcing from the battery and ambient, which leaves via the extractor, contributes to COP >> 1. The air which continues through the condenser contributes to COP = 1.
2.4.3. Mode 3
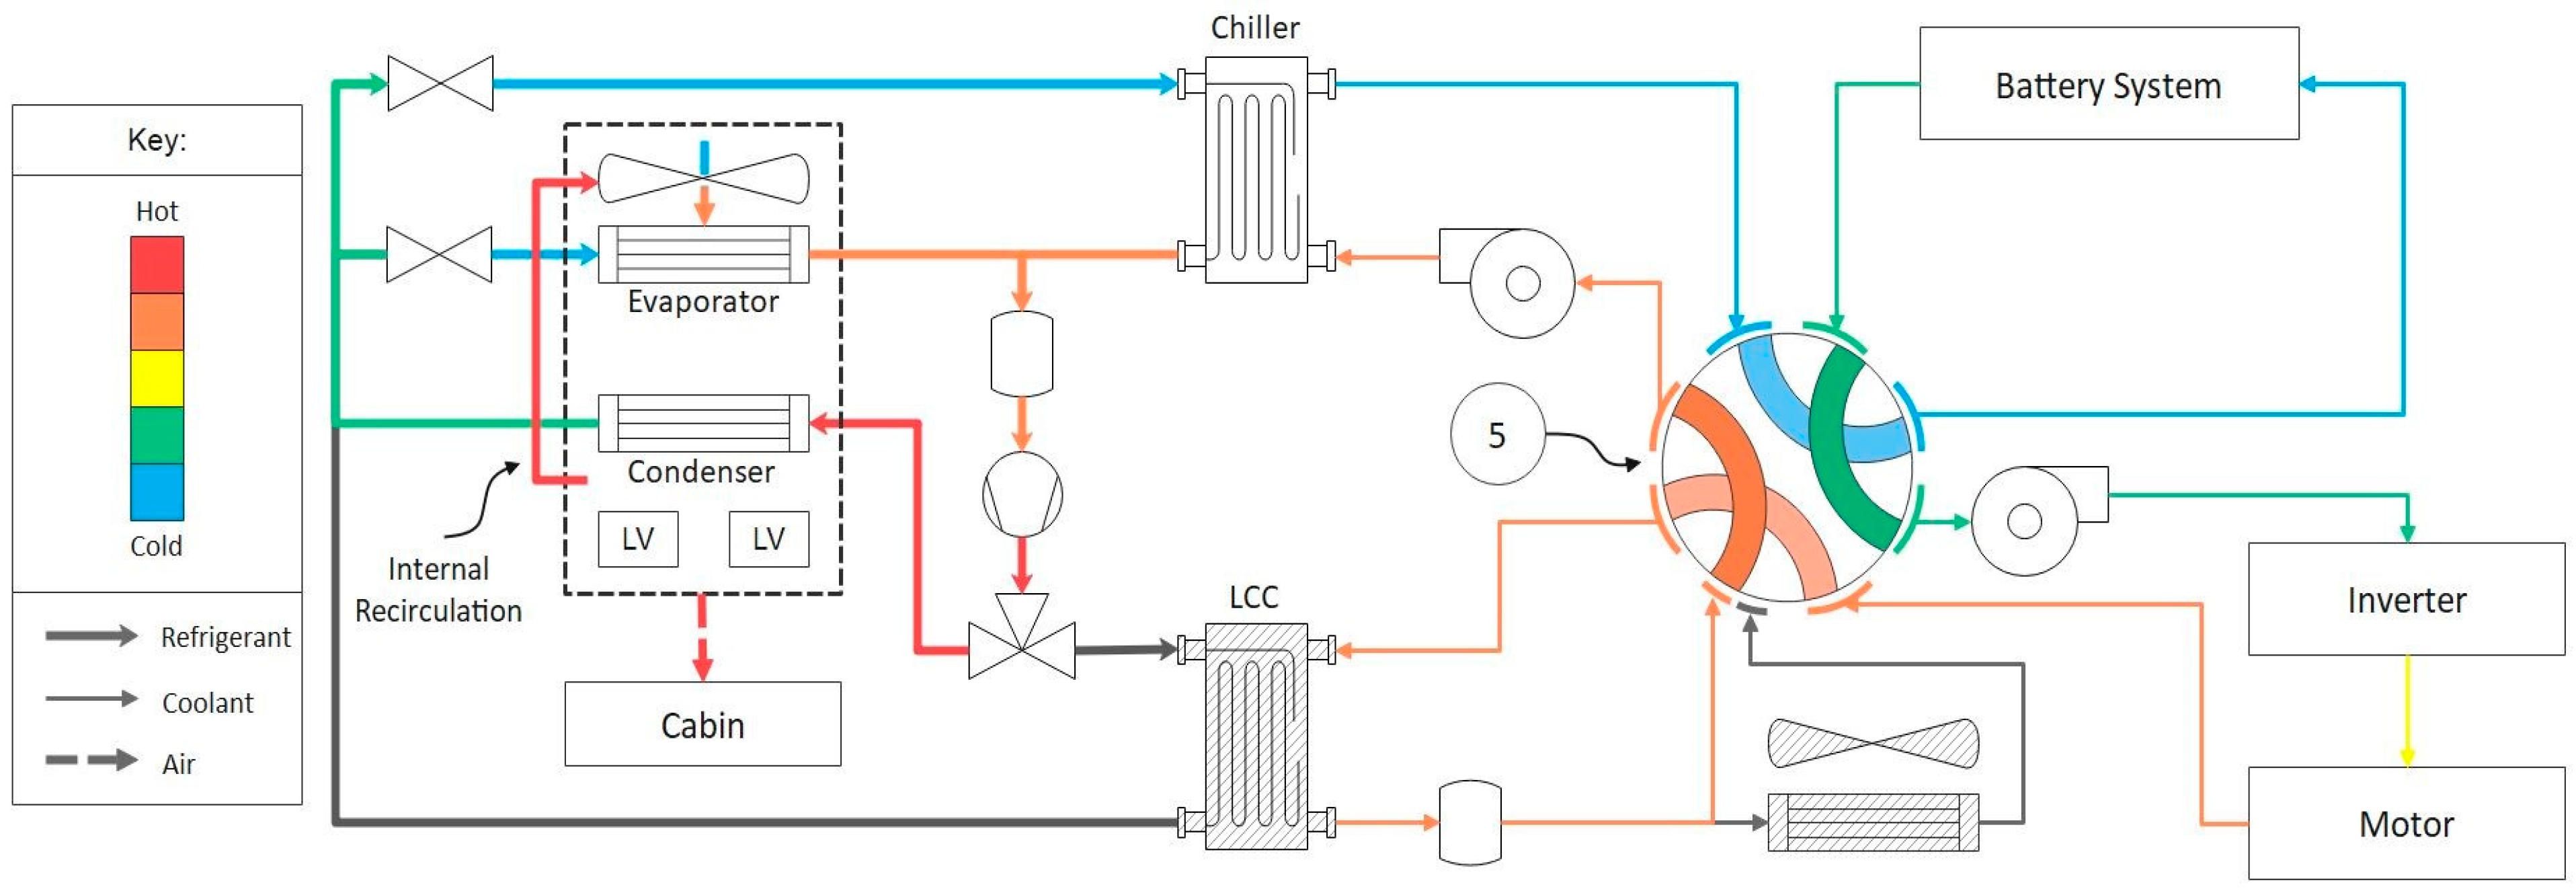
If the system still cannot supply the demand and the ambient temperature is lower than −10 °C, heating mode 3 shown in
Figure 11 will activate. In this mode, the system operates in a similar manner to mode 2b, with the extractor closed and LV heaters on. The HVAC internal recirculation duct is now open and moderating condenser exhaust heat back to the evaporator. Having the configuration in this way will increase the temperature of the evaporator, which will allow the compressor to run at higher power. By increasing the internal recirculation, the ambient source COP tends to 1. The recirculation duct requires optimal control to balance the heating objective with thermal comfort. Too much recirculation will result in starving the cabin of airflow and may cause the cabin to fog. Here there is finite powertrain heat sourcing which contributes to COP >> 1.
2.4.4. Mode 4
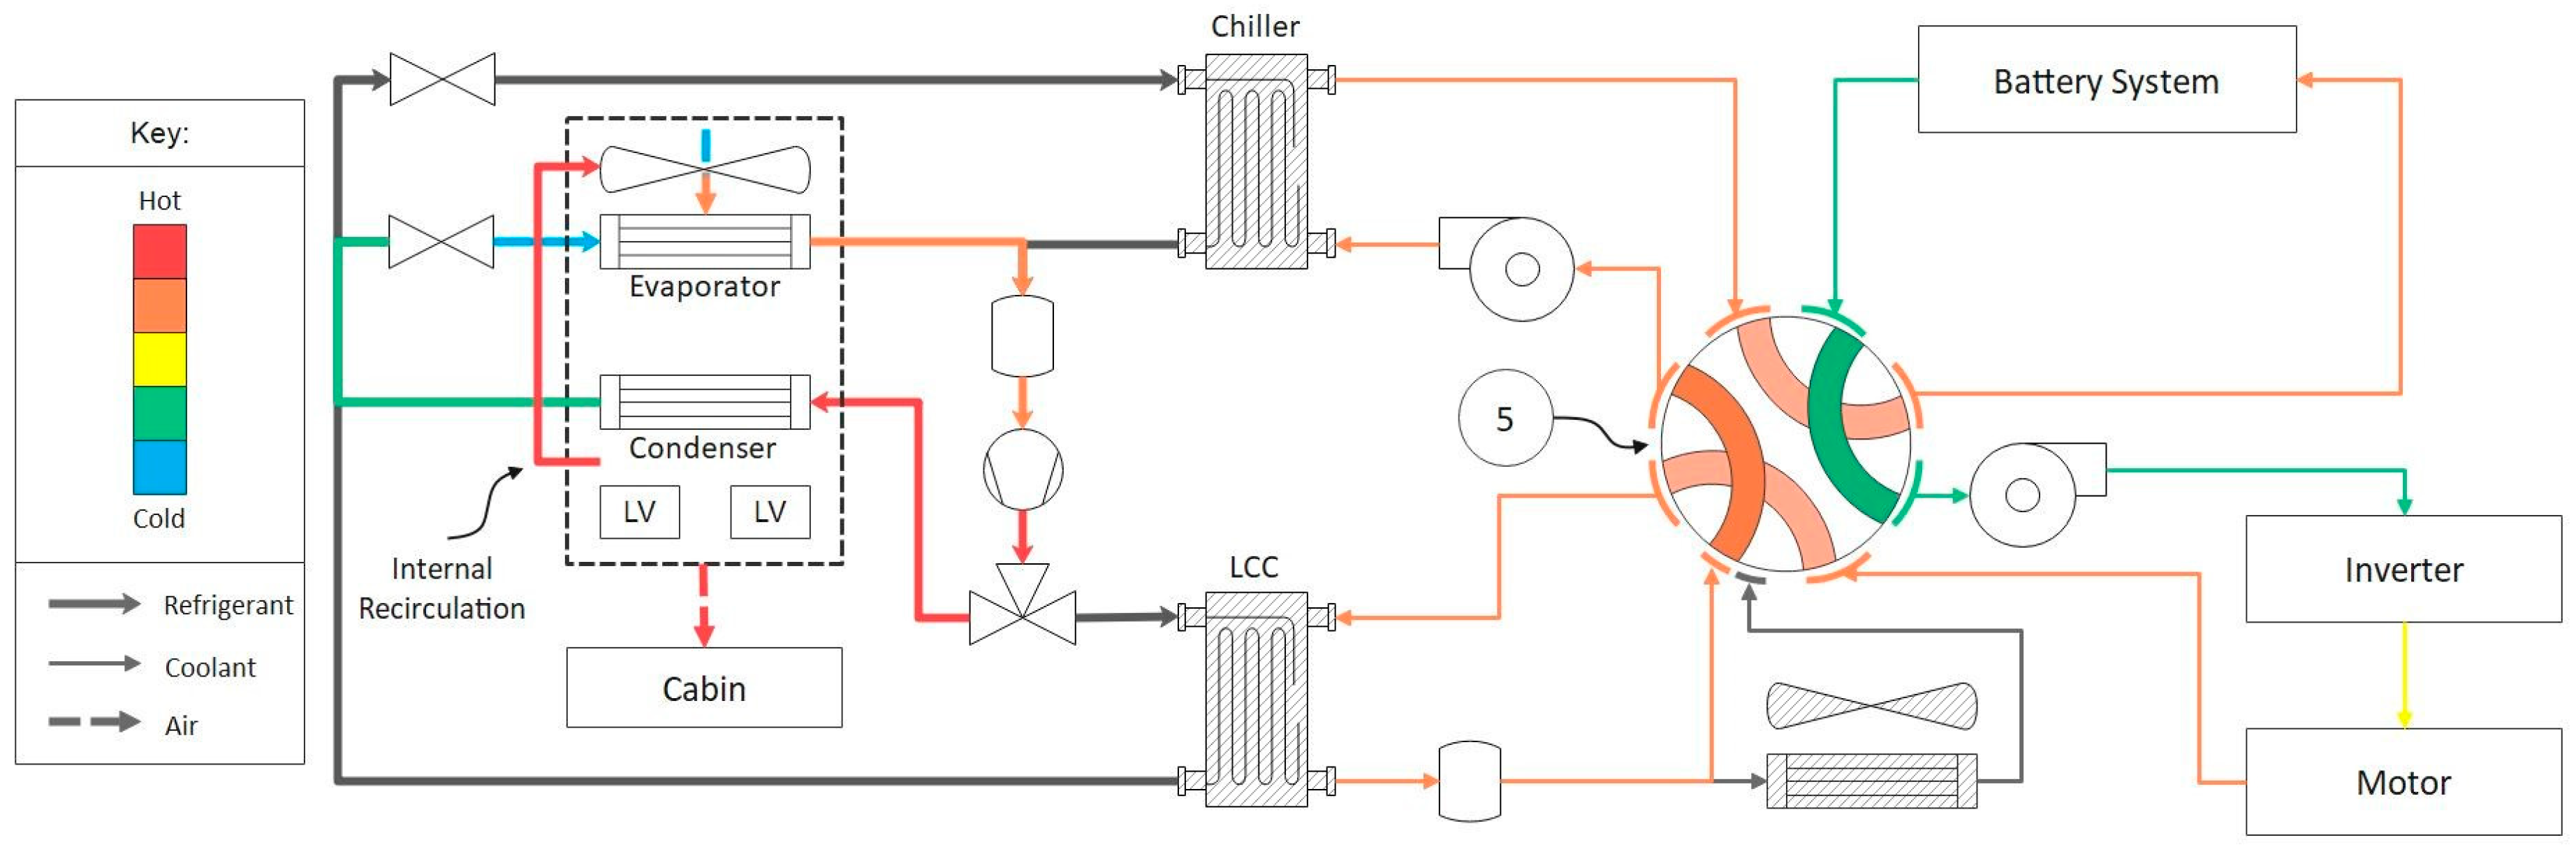
If the drivetrain coolant loop is not unfeasible and the conditions of mode 3 remain, mode 4 shown in
Figure 12 will be activated. Mode 4 is the least efficient cabin heating only mode, where the compressor acts as the heater at COP = 1. Here the octovalve can remain in position 2 with an inactive chiller so the drive unit can assist the natural warm-up of the battery system. On the heat pump side, only the cabin evaporator and condenser are active, and the internal recirculation mode is active. In this state, there is no thermal link between the drivetrain and the heat pump. The compressor acts as a high voltage heater, and if demands further increase or driver and passenger demands differ, the low voltage heat can be activated.
2.4.5. Mode 5
If the cabin requires heating in ambient < −10 °C and the battery system is in urgent need of preconditioning to be ready to drive, mode 5 shown in
Figure 13 is activated. The system operates in a similar manner to mode 4, but now the LCC is active (3-way valve directs refrigerant to both cabin condenser and LCC). This provides a thermal link between the heat pump and the drivetrain so the heat pump can supply energy to the drivetrain coolant. In this mode, the octovalve is in position 2, connecting the whole drivetrain coolant loop in series. Heat generated by the drivetrain and energy gained by the heat pump at the LLC is transferred to the battery for preconditioning. The heat pump is still operating at COP = 1 but sharing the output between the cabin and battery; the low voltage heaters can be activated to serve the cabin at higher demands.
2.4.6. Mode 6
Figure 14 shows the system in mode 6, which is a battery heat only mode. Active during the same conditions as mode 5, excluding demands to heat the cabin. The mode may also be active when charging the vehicle in extremely cold ambient conditions, heating the battery up to a temperature which will speed up charging and prevent long-term damage to the battery. On the heat pump side, the 3-way valve routes the refrigerant to the LCC, which returns via the EXV, chiller, and compressor. Having the LCC and chiller active sets the system in a compressor as heater mode (COP = 1). This is because, on the coolant side, the coolant absorbs heat at the LCC and the heat is then partially reabsorbed by the chiller. The addition to the coolant is equal to the energy input to the compressor. Therefore, in this mode, compressor input energy and drive unit waste heat are used to heat the battery system.
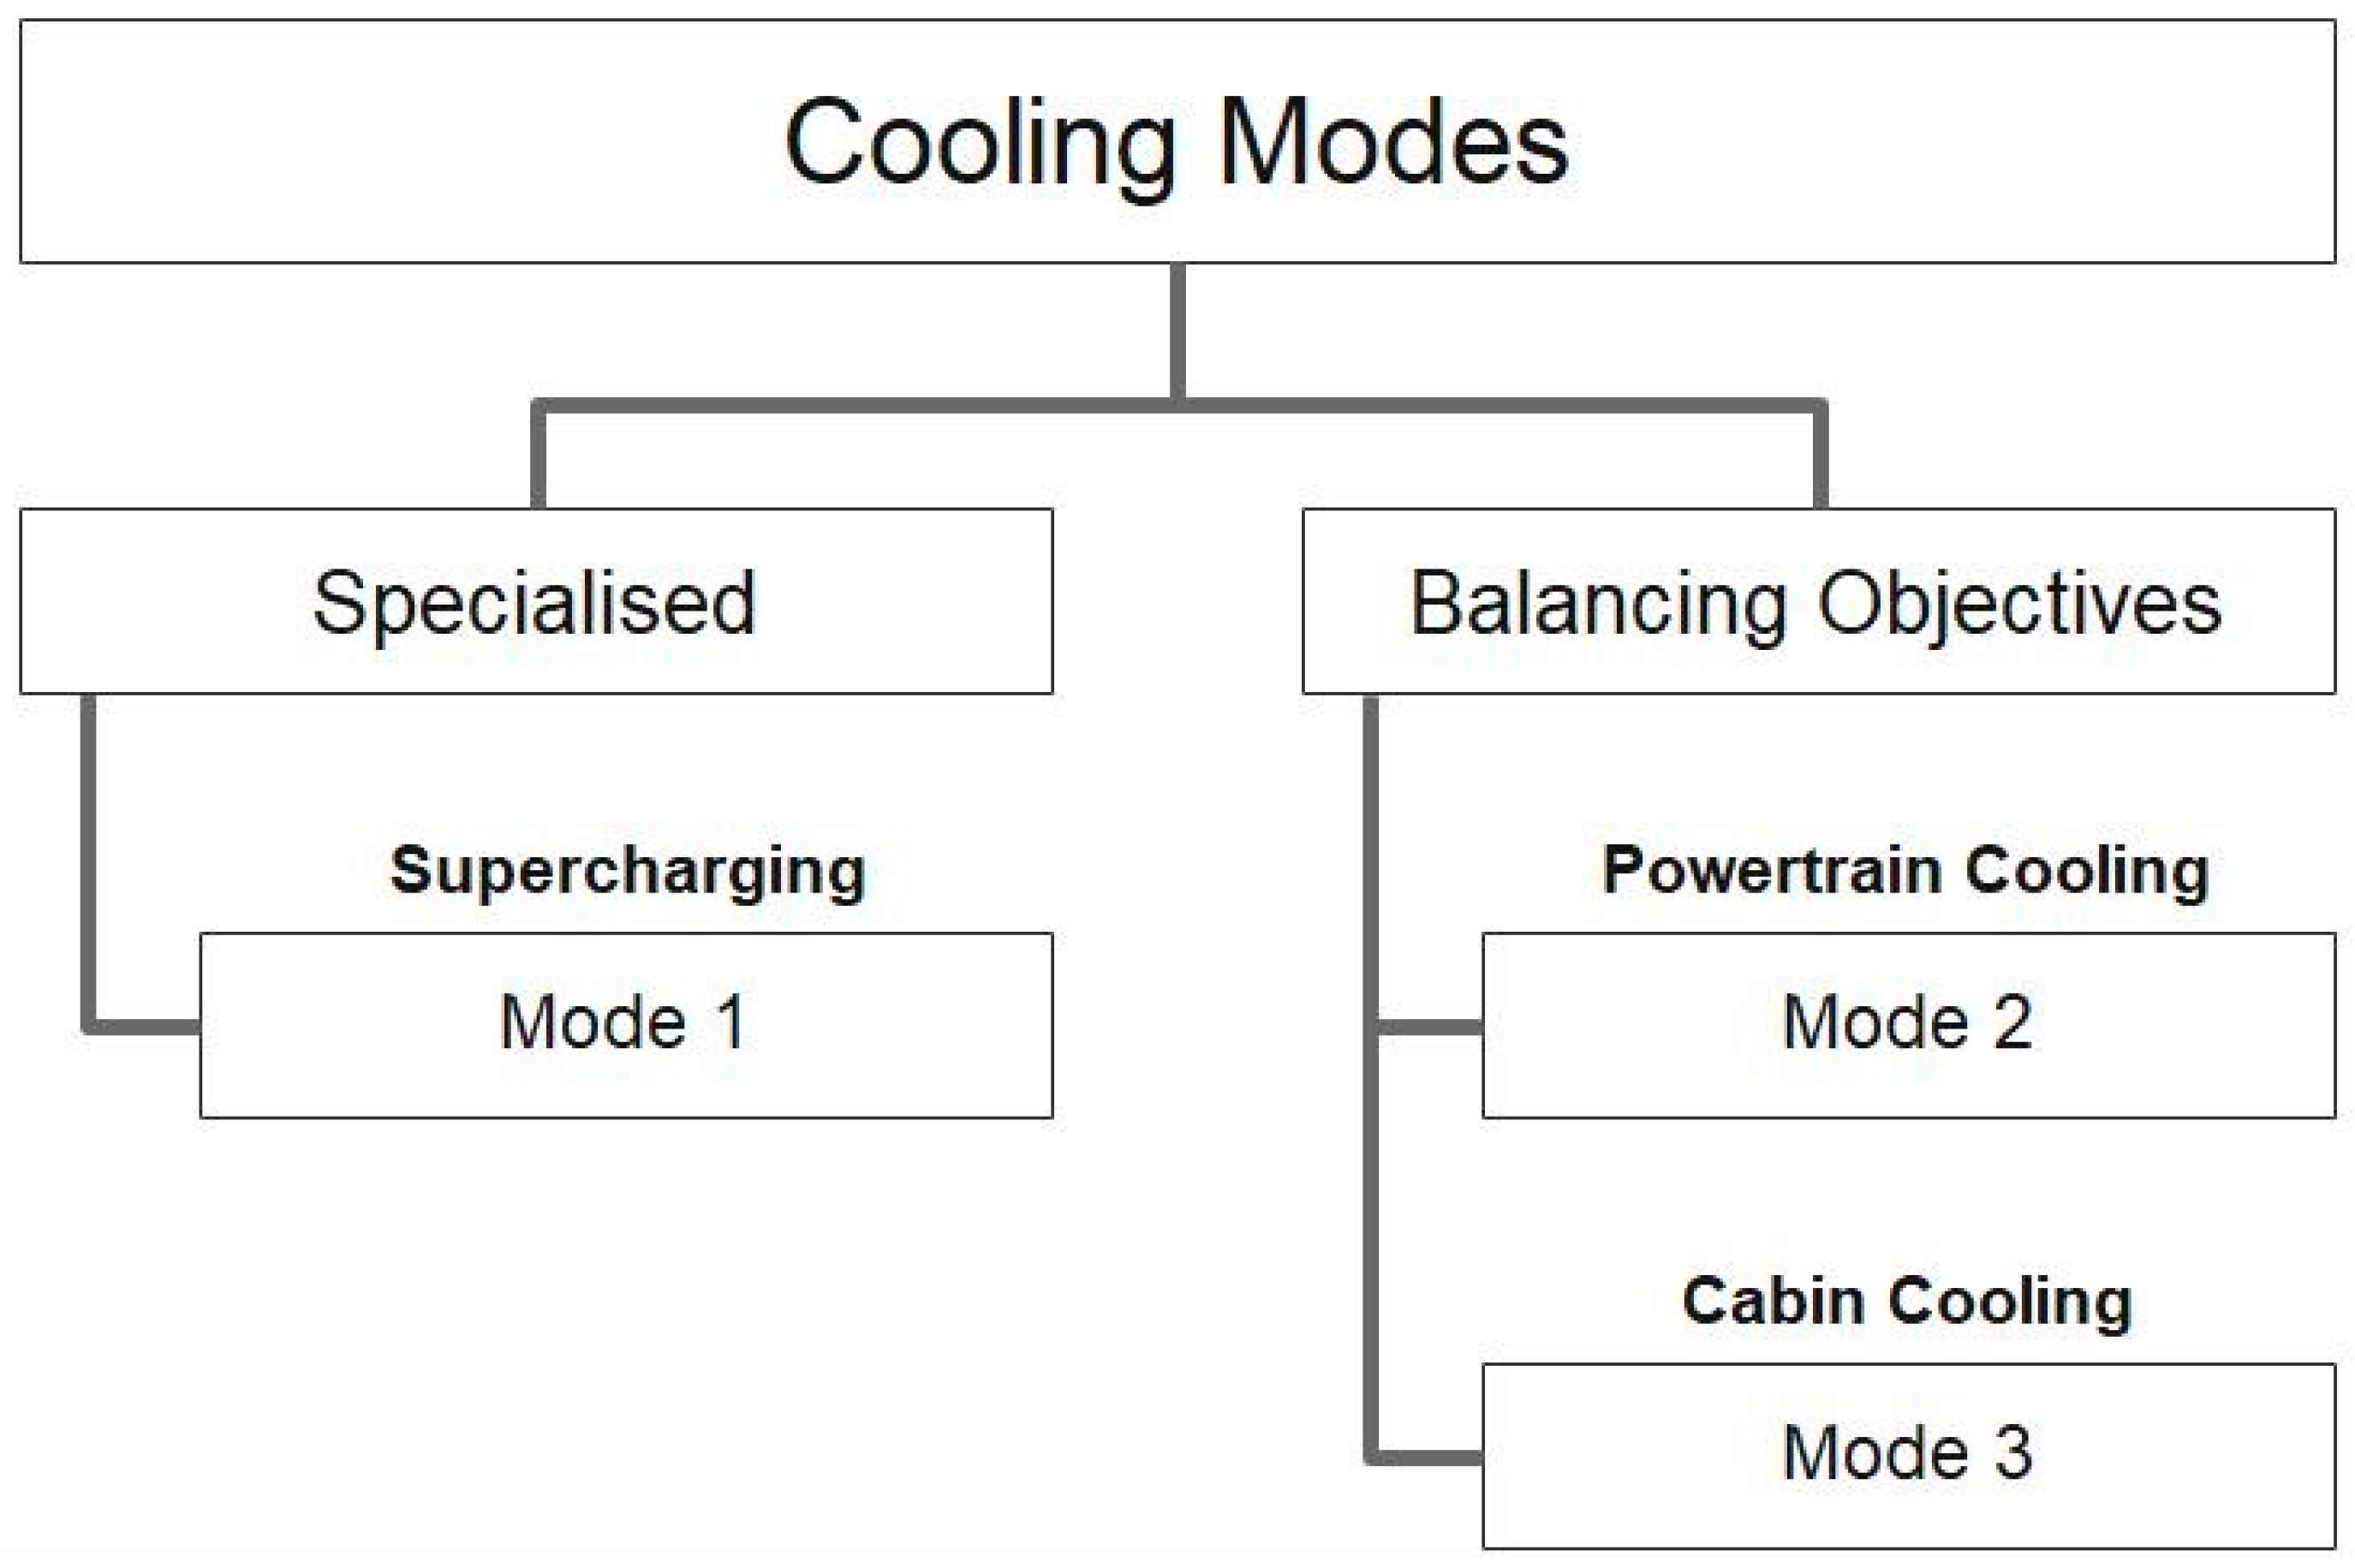
2.5. Cooling Modes
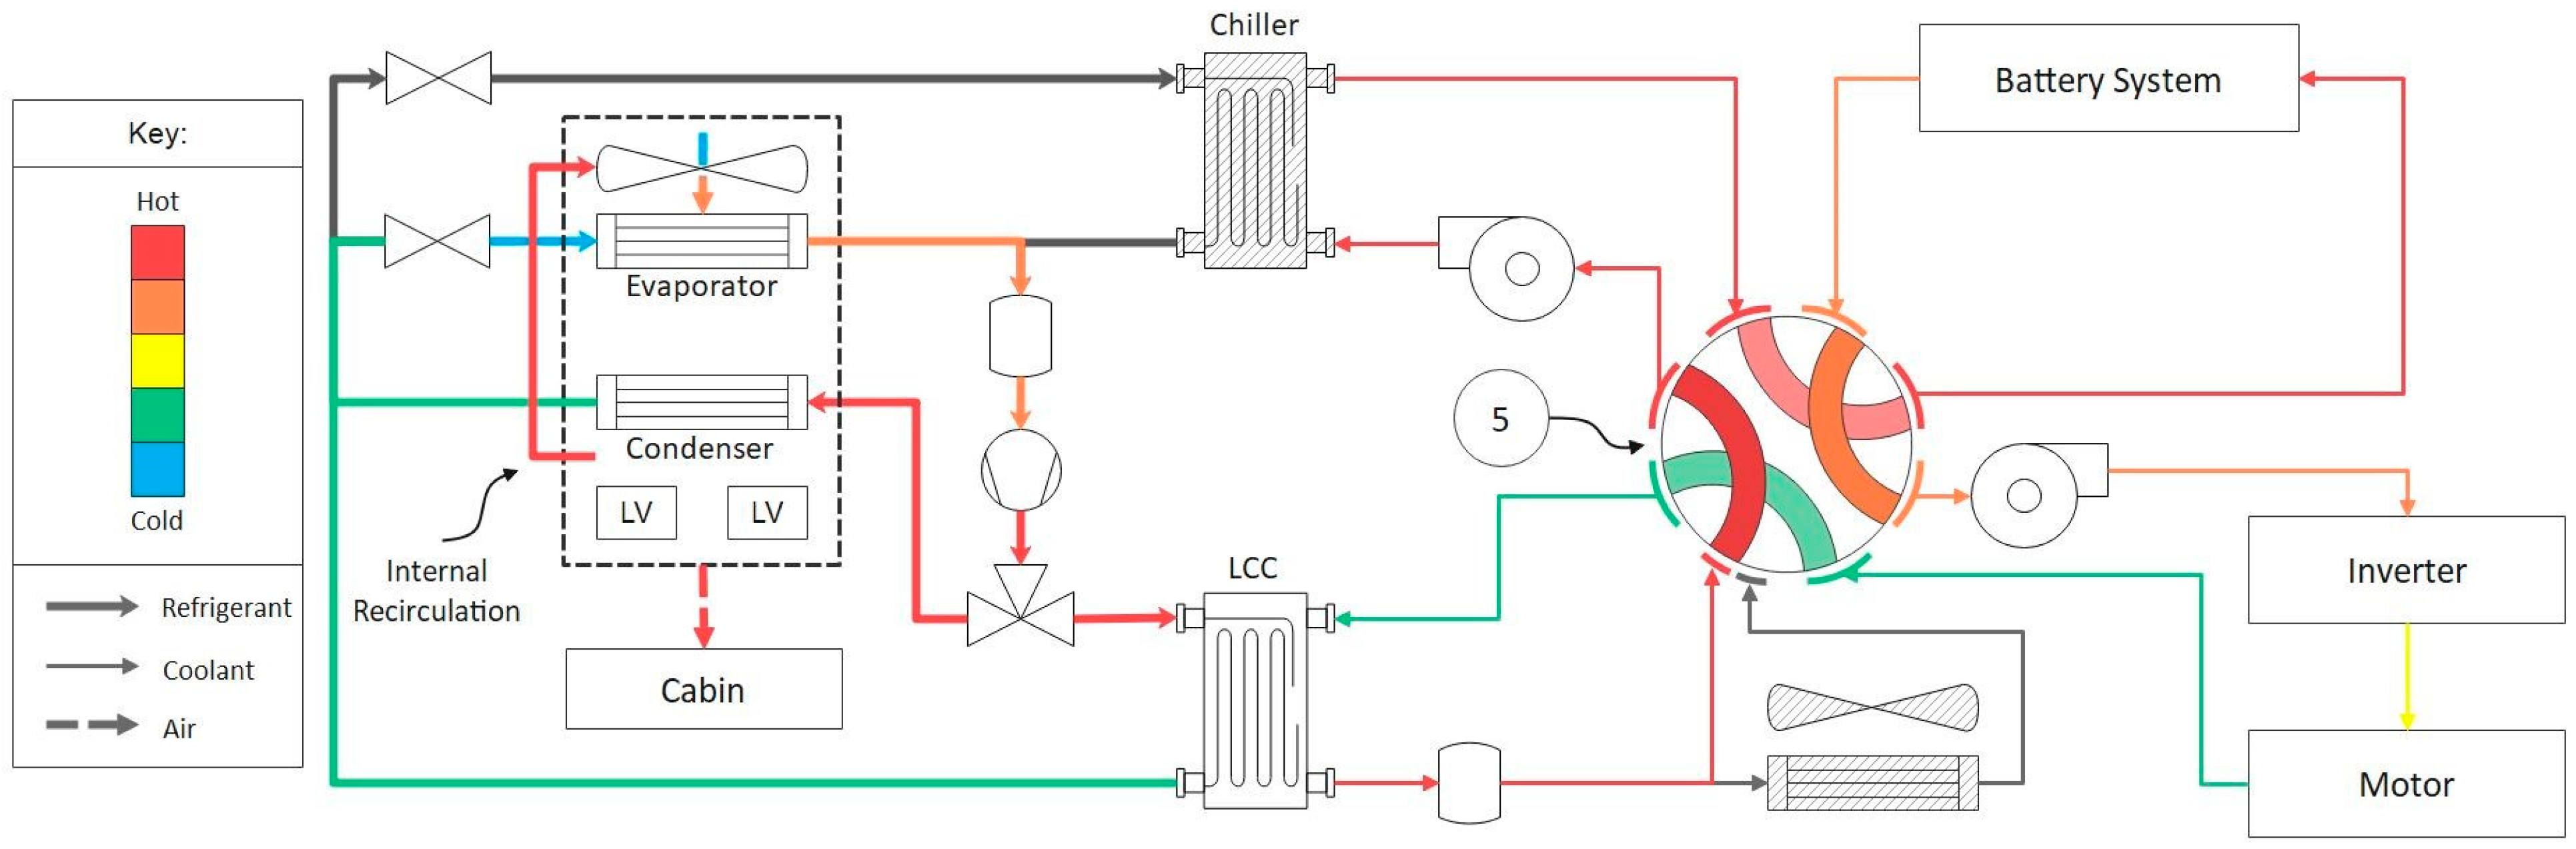
The system under analysis has a total of 3 cooling modes, each with a primary objective(s) where the net energy to the target components(s) is <0. There is one specialised mode for assisting battery cooling during supercharging and two balancing objectives modes, shown in
Figure 15. Only the core “Balancing Objectives” modes for cooling are explored.
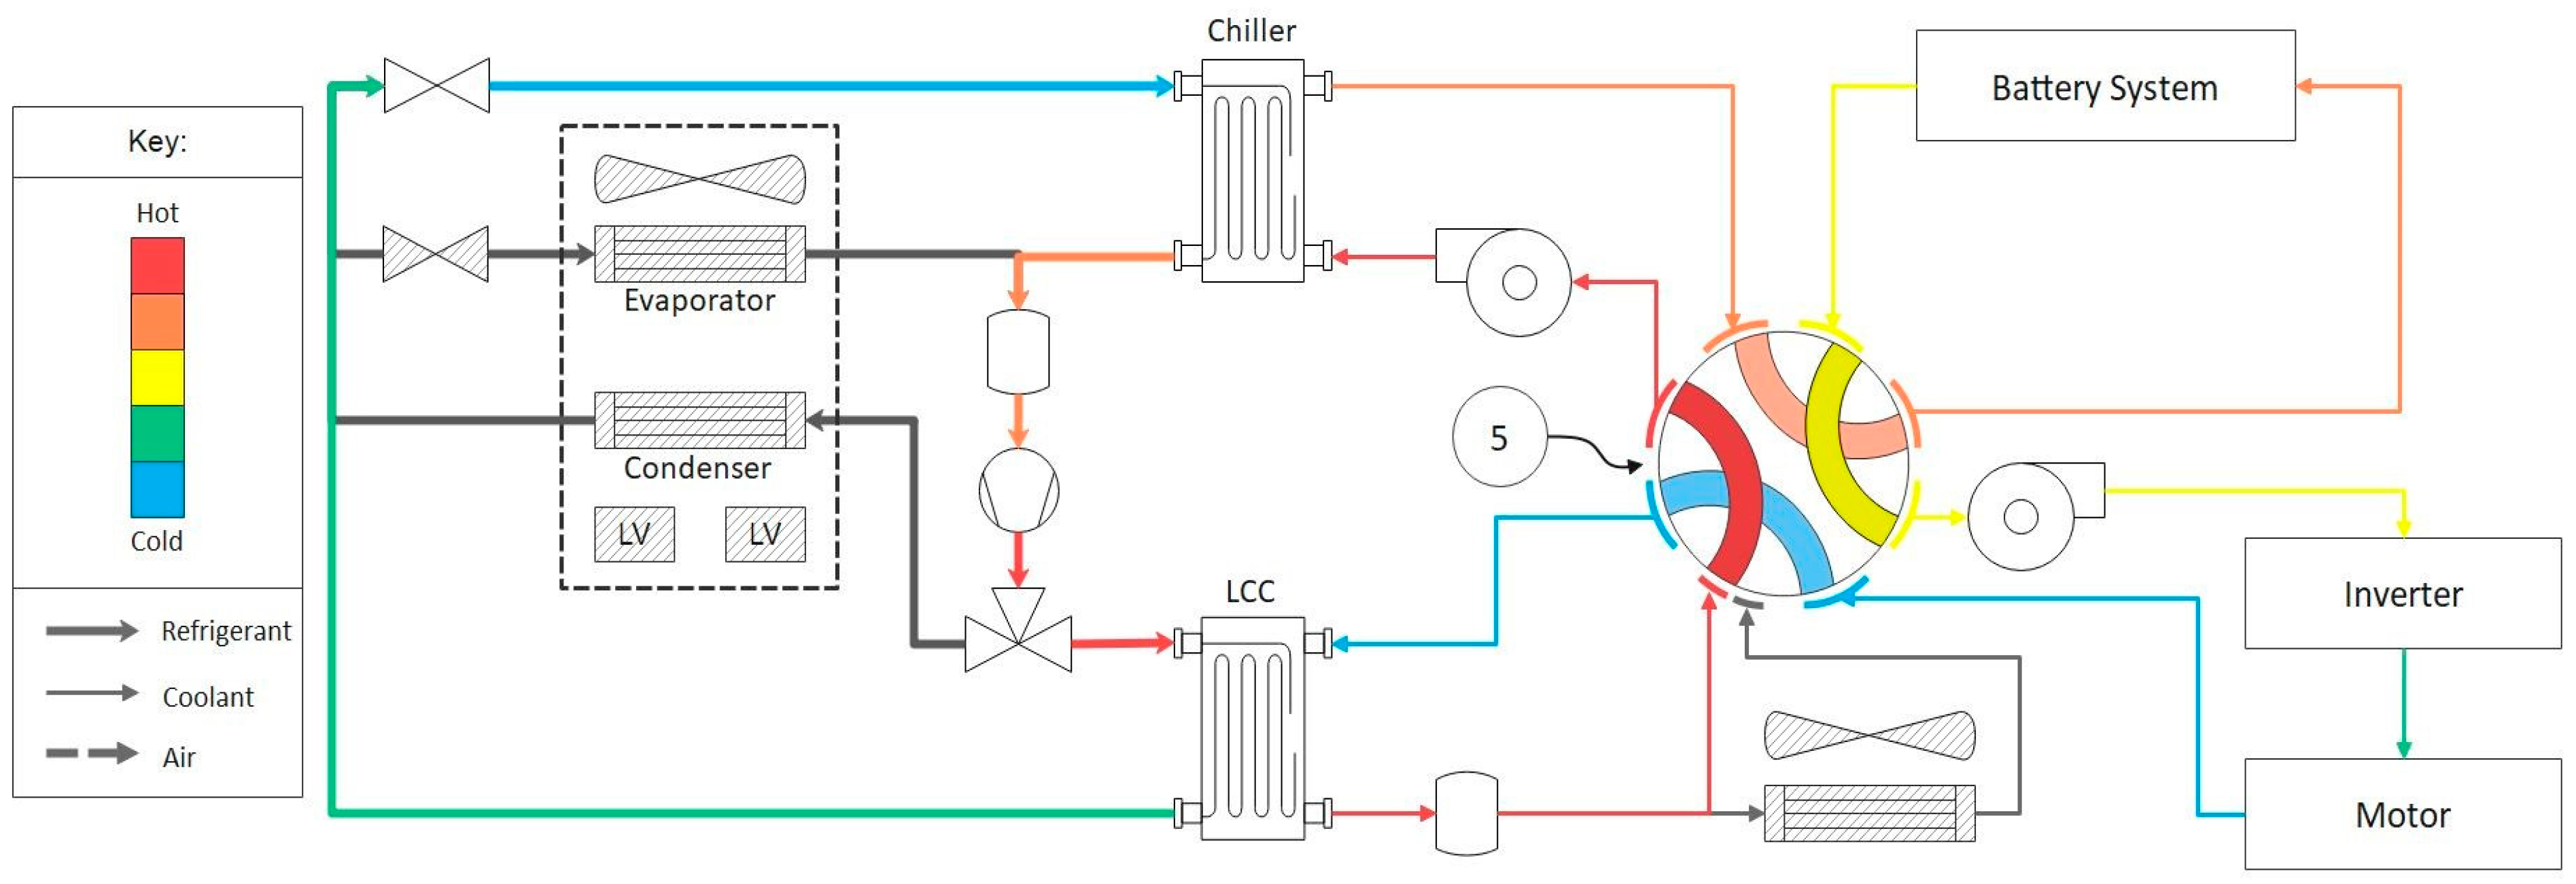
2.5.1. Mode 2
Mode 2 shown in
Figure 16 is a cooling mode used for optimal vehicle performance (e.g., on a track or a Vmax hill climb). In this mode, the chiller is active, removing heat from the coolant entering the battery. The heat transferred to the refrigerant is rejected through the radiator via the LCC. If the radiator cannot reject all the heat, then the condenser can be used to reject heat into the cabin if necessary. This mode operates with the octovalve in either position 1 or 2, depending on which powertrain component is limiting performance.
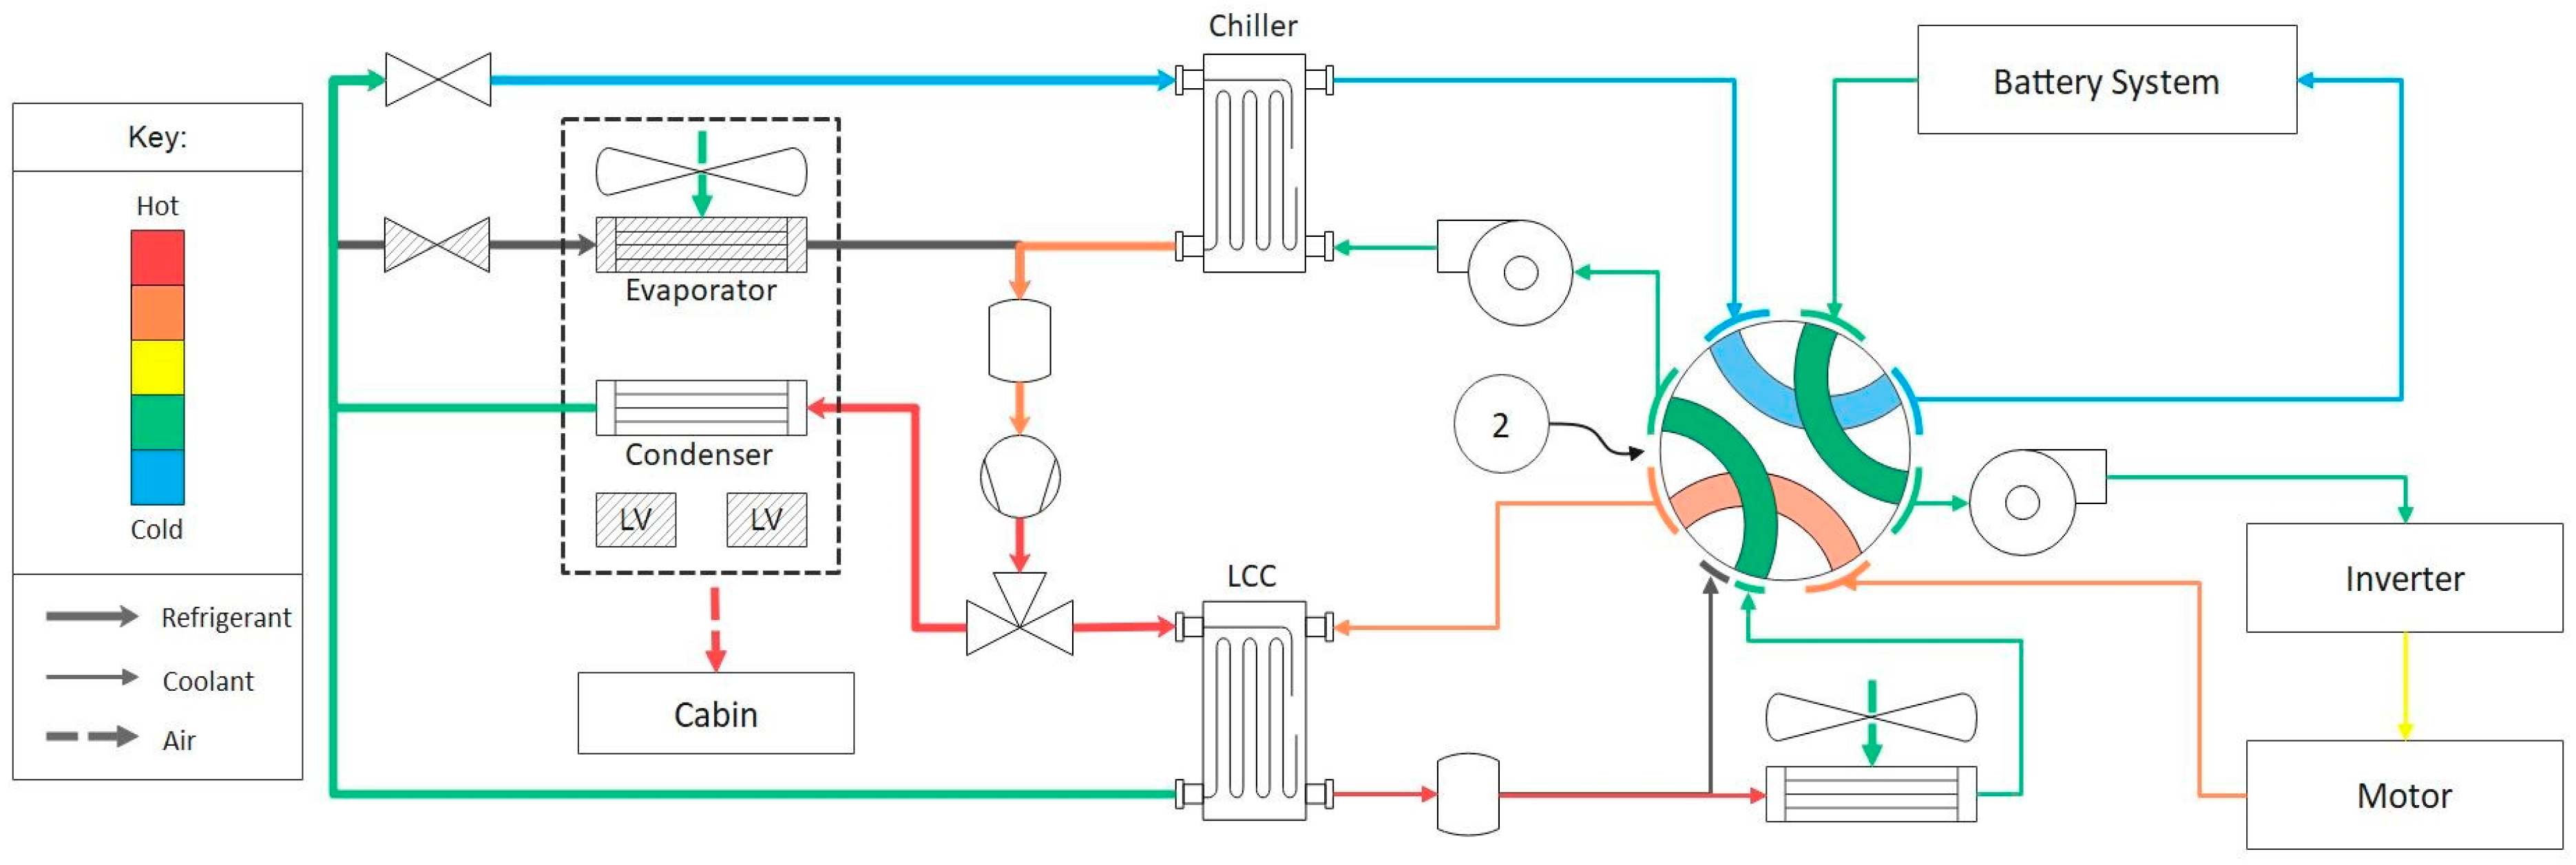
2.5.2. Mode 3
Figure 17 shows the cooling mode 3, a pure cabin pull-down mode. After a long day in the sun, the occupants may want to fill the cabin with cool air. The heat pump deactivates the condenser and the chiller and re-activates the evaporator to absorb heat from the air entering the cabin. The LLC rejects the heat to the coolant. If the battery is sufficiently cooled, the octovalve will move to position 2 so heat is rejected to ambient, drive unit, and battery. Otherwise, all heat will be rejected to ambient in position 1, and the battery will remain in a closed loop.
2.6. Operating Mode Summary
To summaries the operating modes described in
Section 2.3 and
Section 2.4,
Table 1 has been created.
Table 1 shows the heating modes listed as H1-H6 and cooling modes listed as C2-C3. Each mode has an objective description, conditions for operation and the operating states of the octovalve and heat pump.
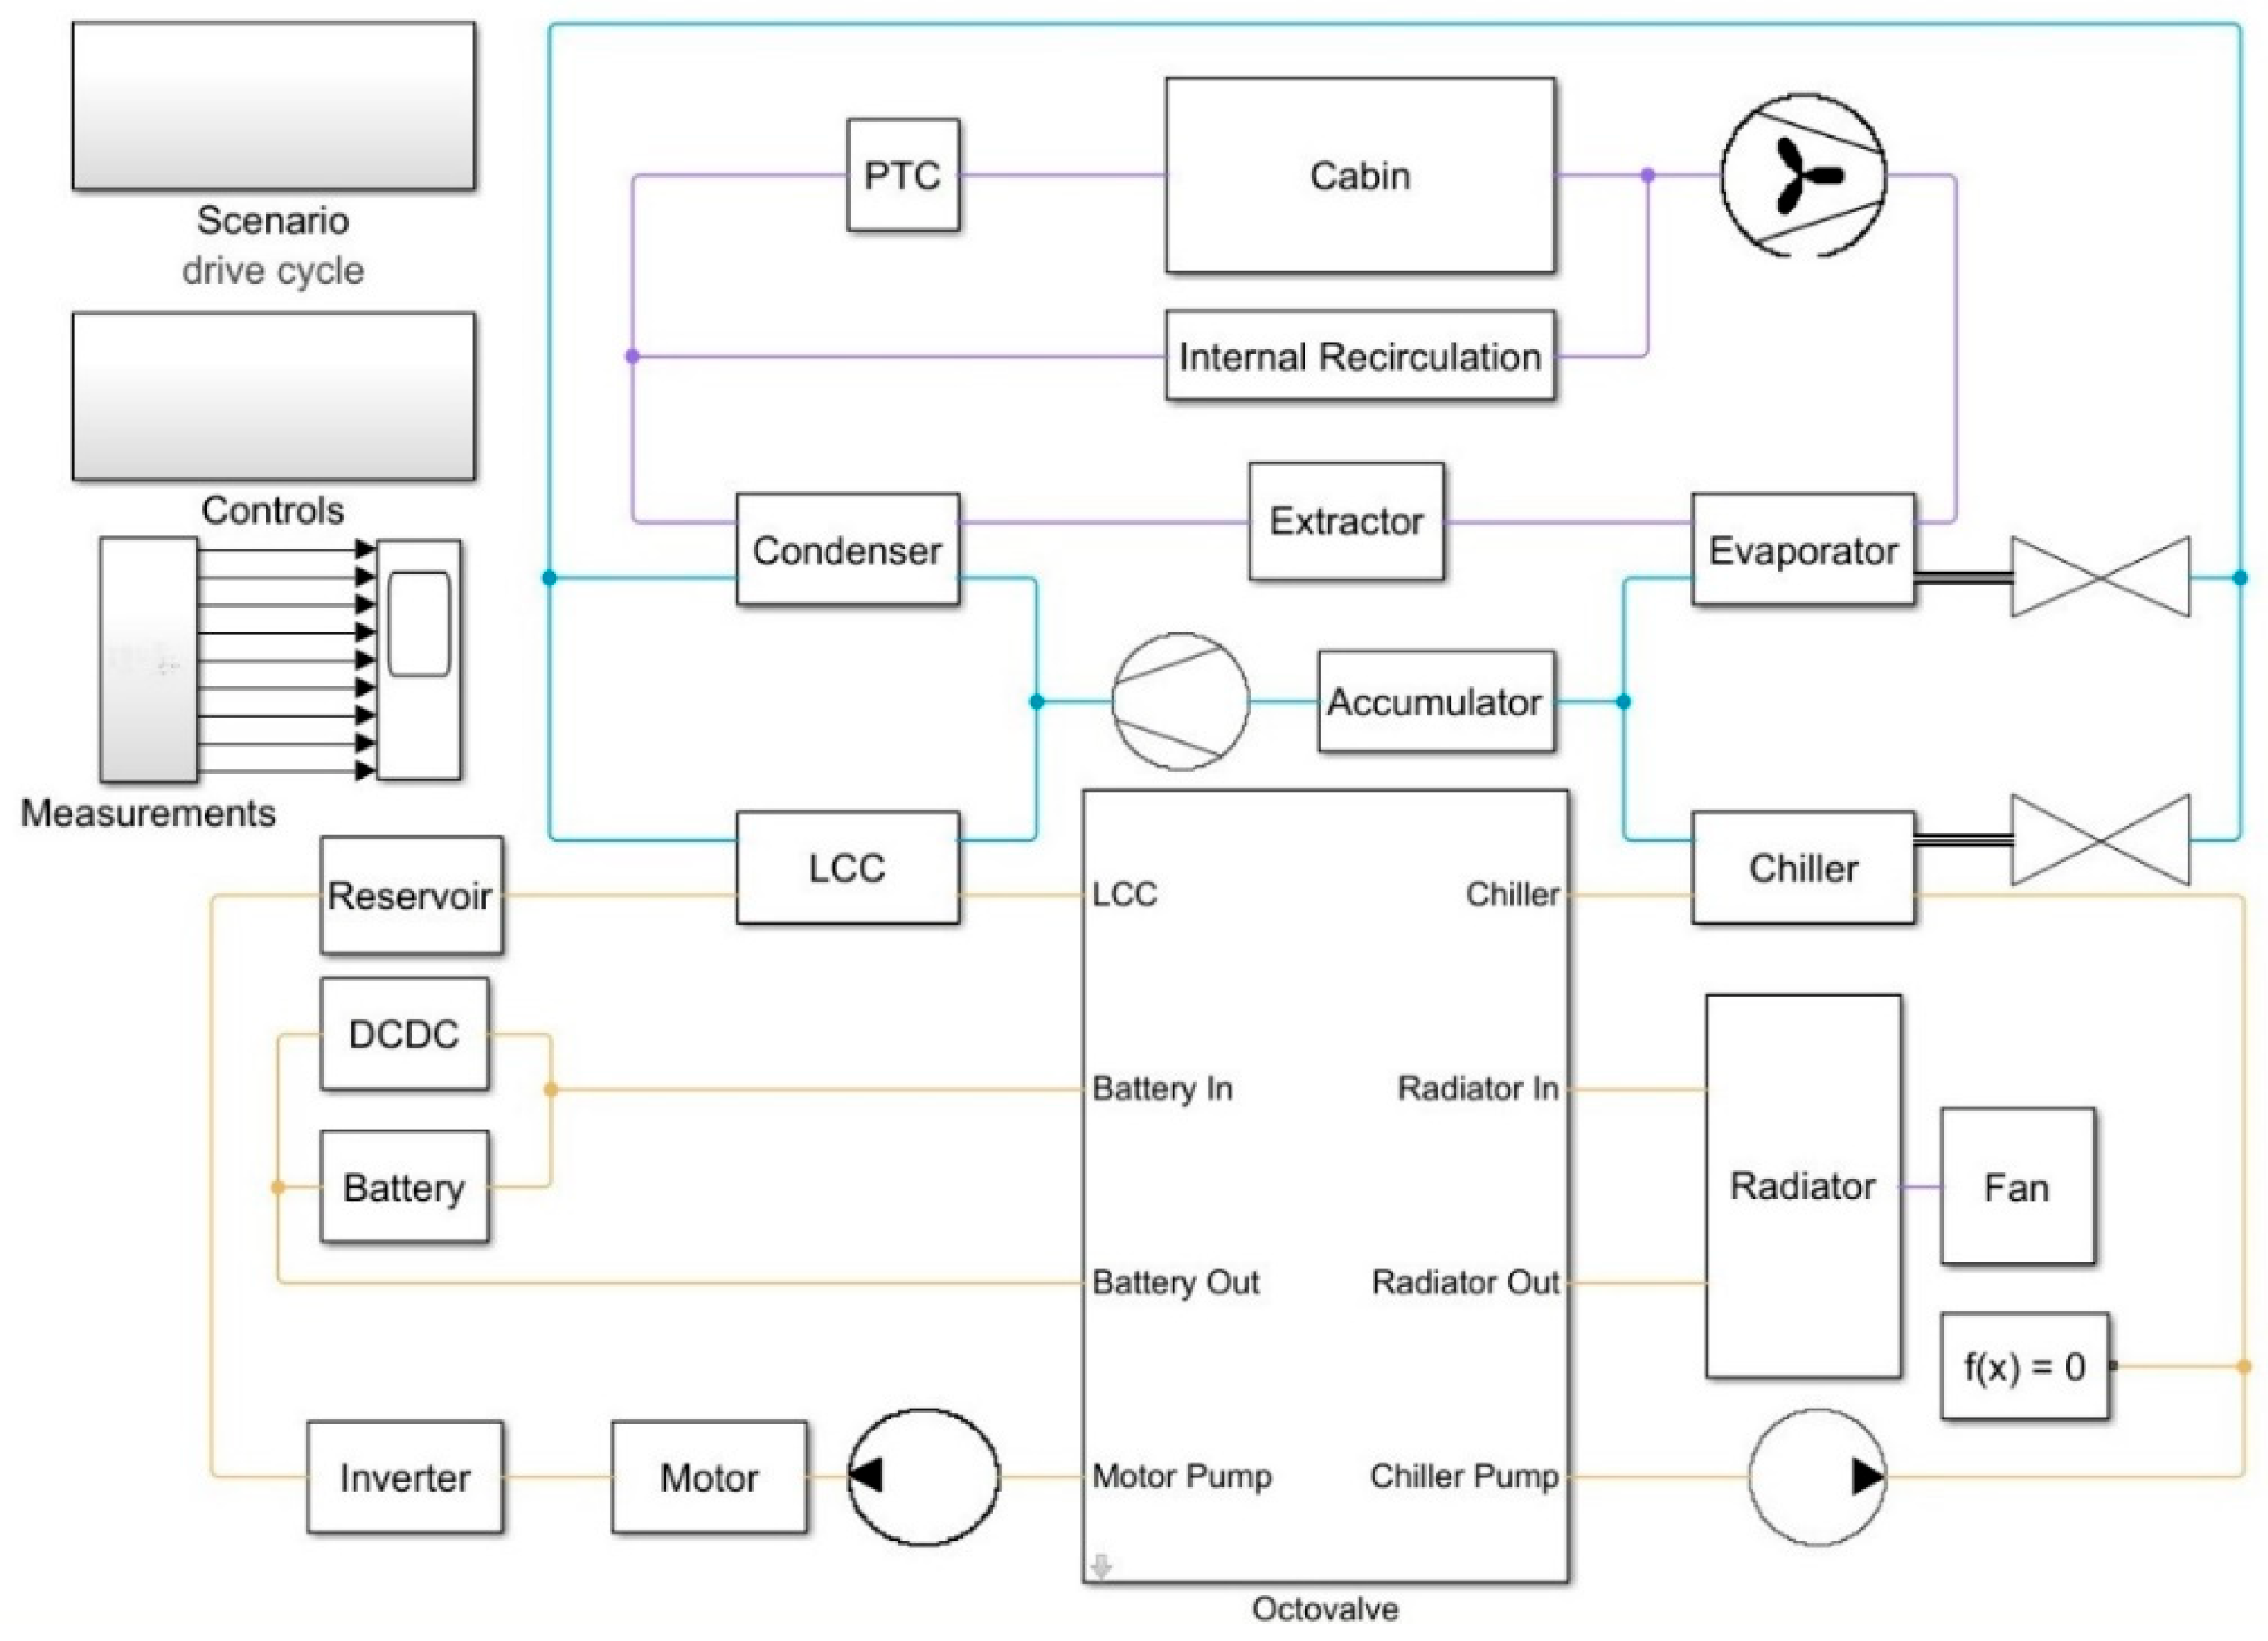
3. Octovalve Production System
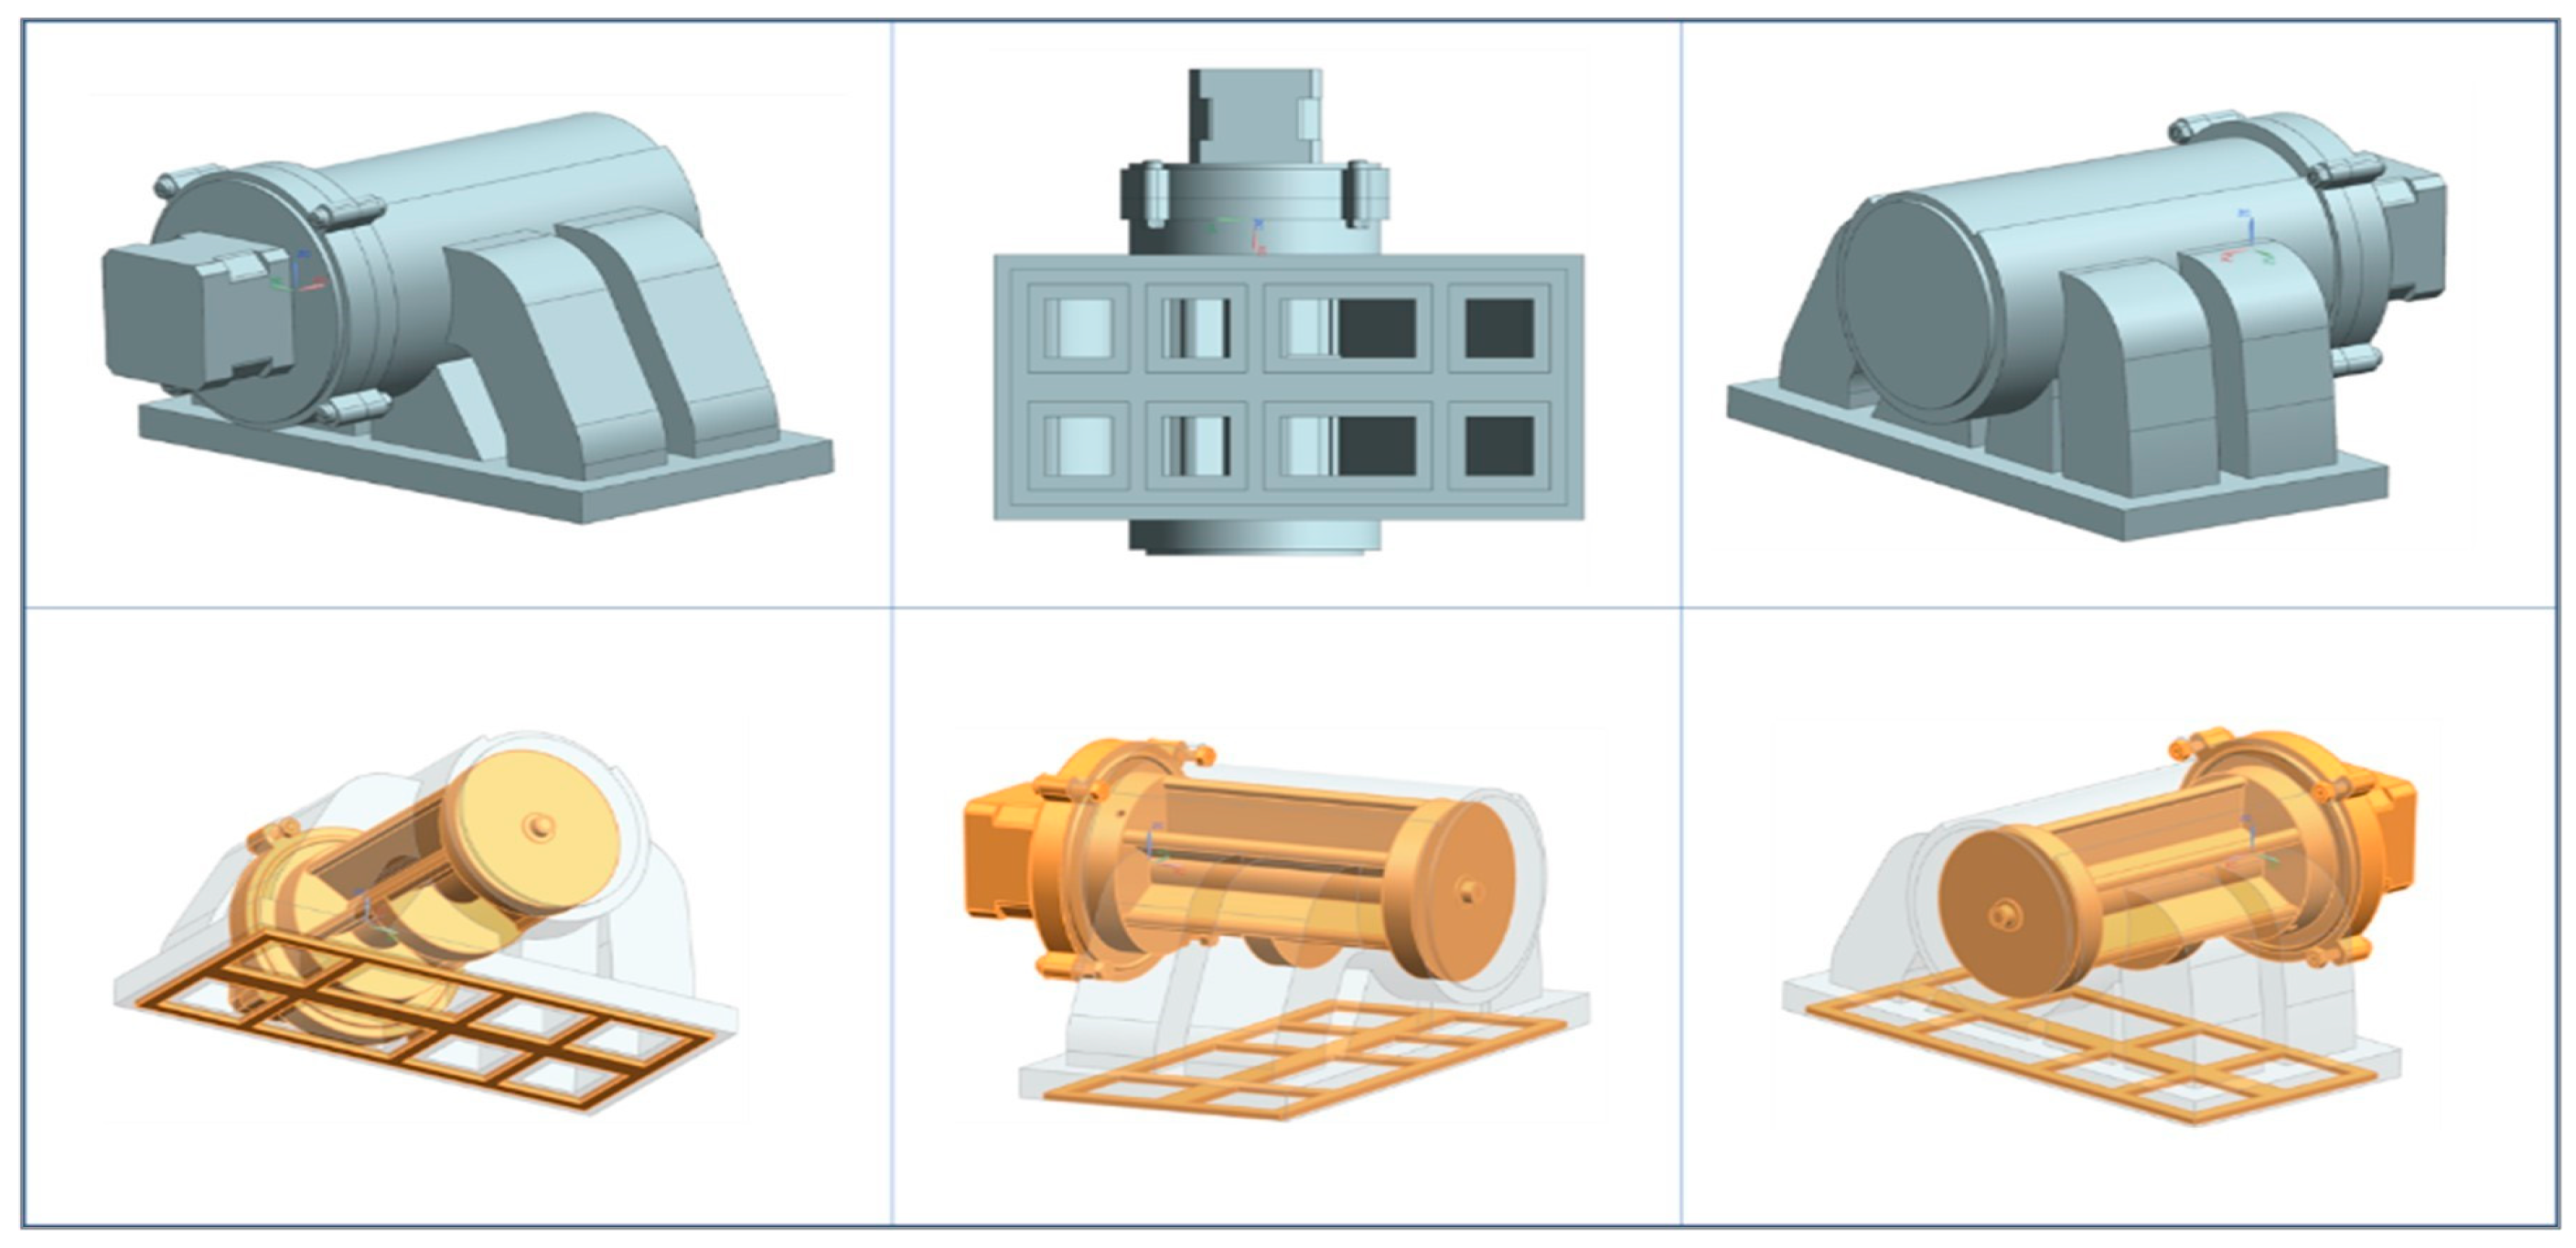
Sandy Munro [
25] released a CT scan of the octovalve internals. This details a rotation wheel with a housing containing eight ports: four ports along the radius by two ports along the axial length. The wheel has four dividers, each directing flow between two axially opposite ports and two adjacent divides directing flow between two neighbouring radial ports. From the scan, an NX model has been developed to help better understand the inner workings of the octovalve (
Figure 18).
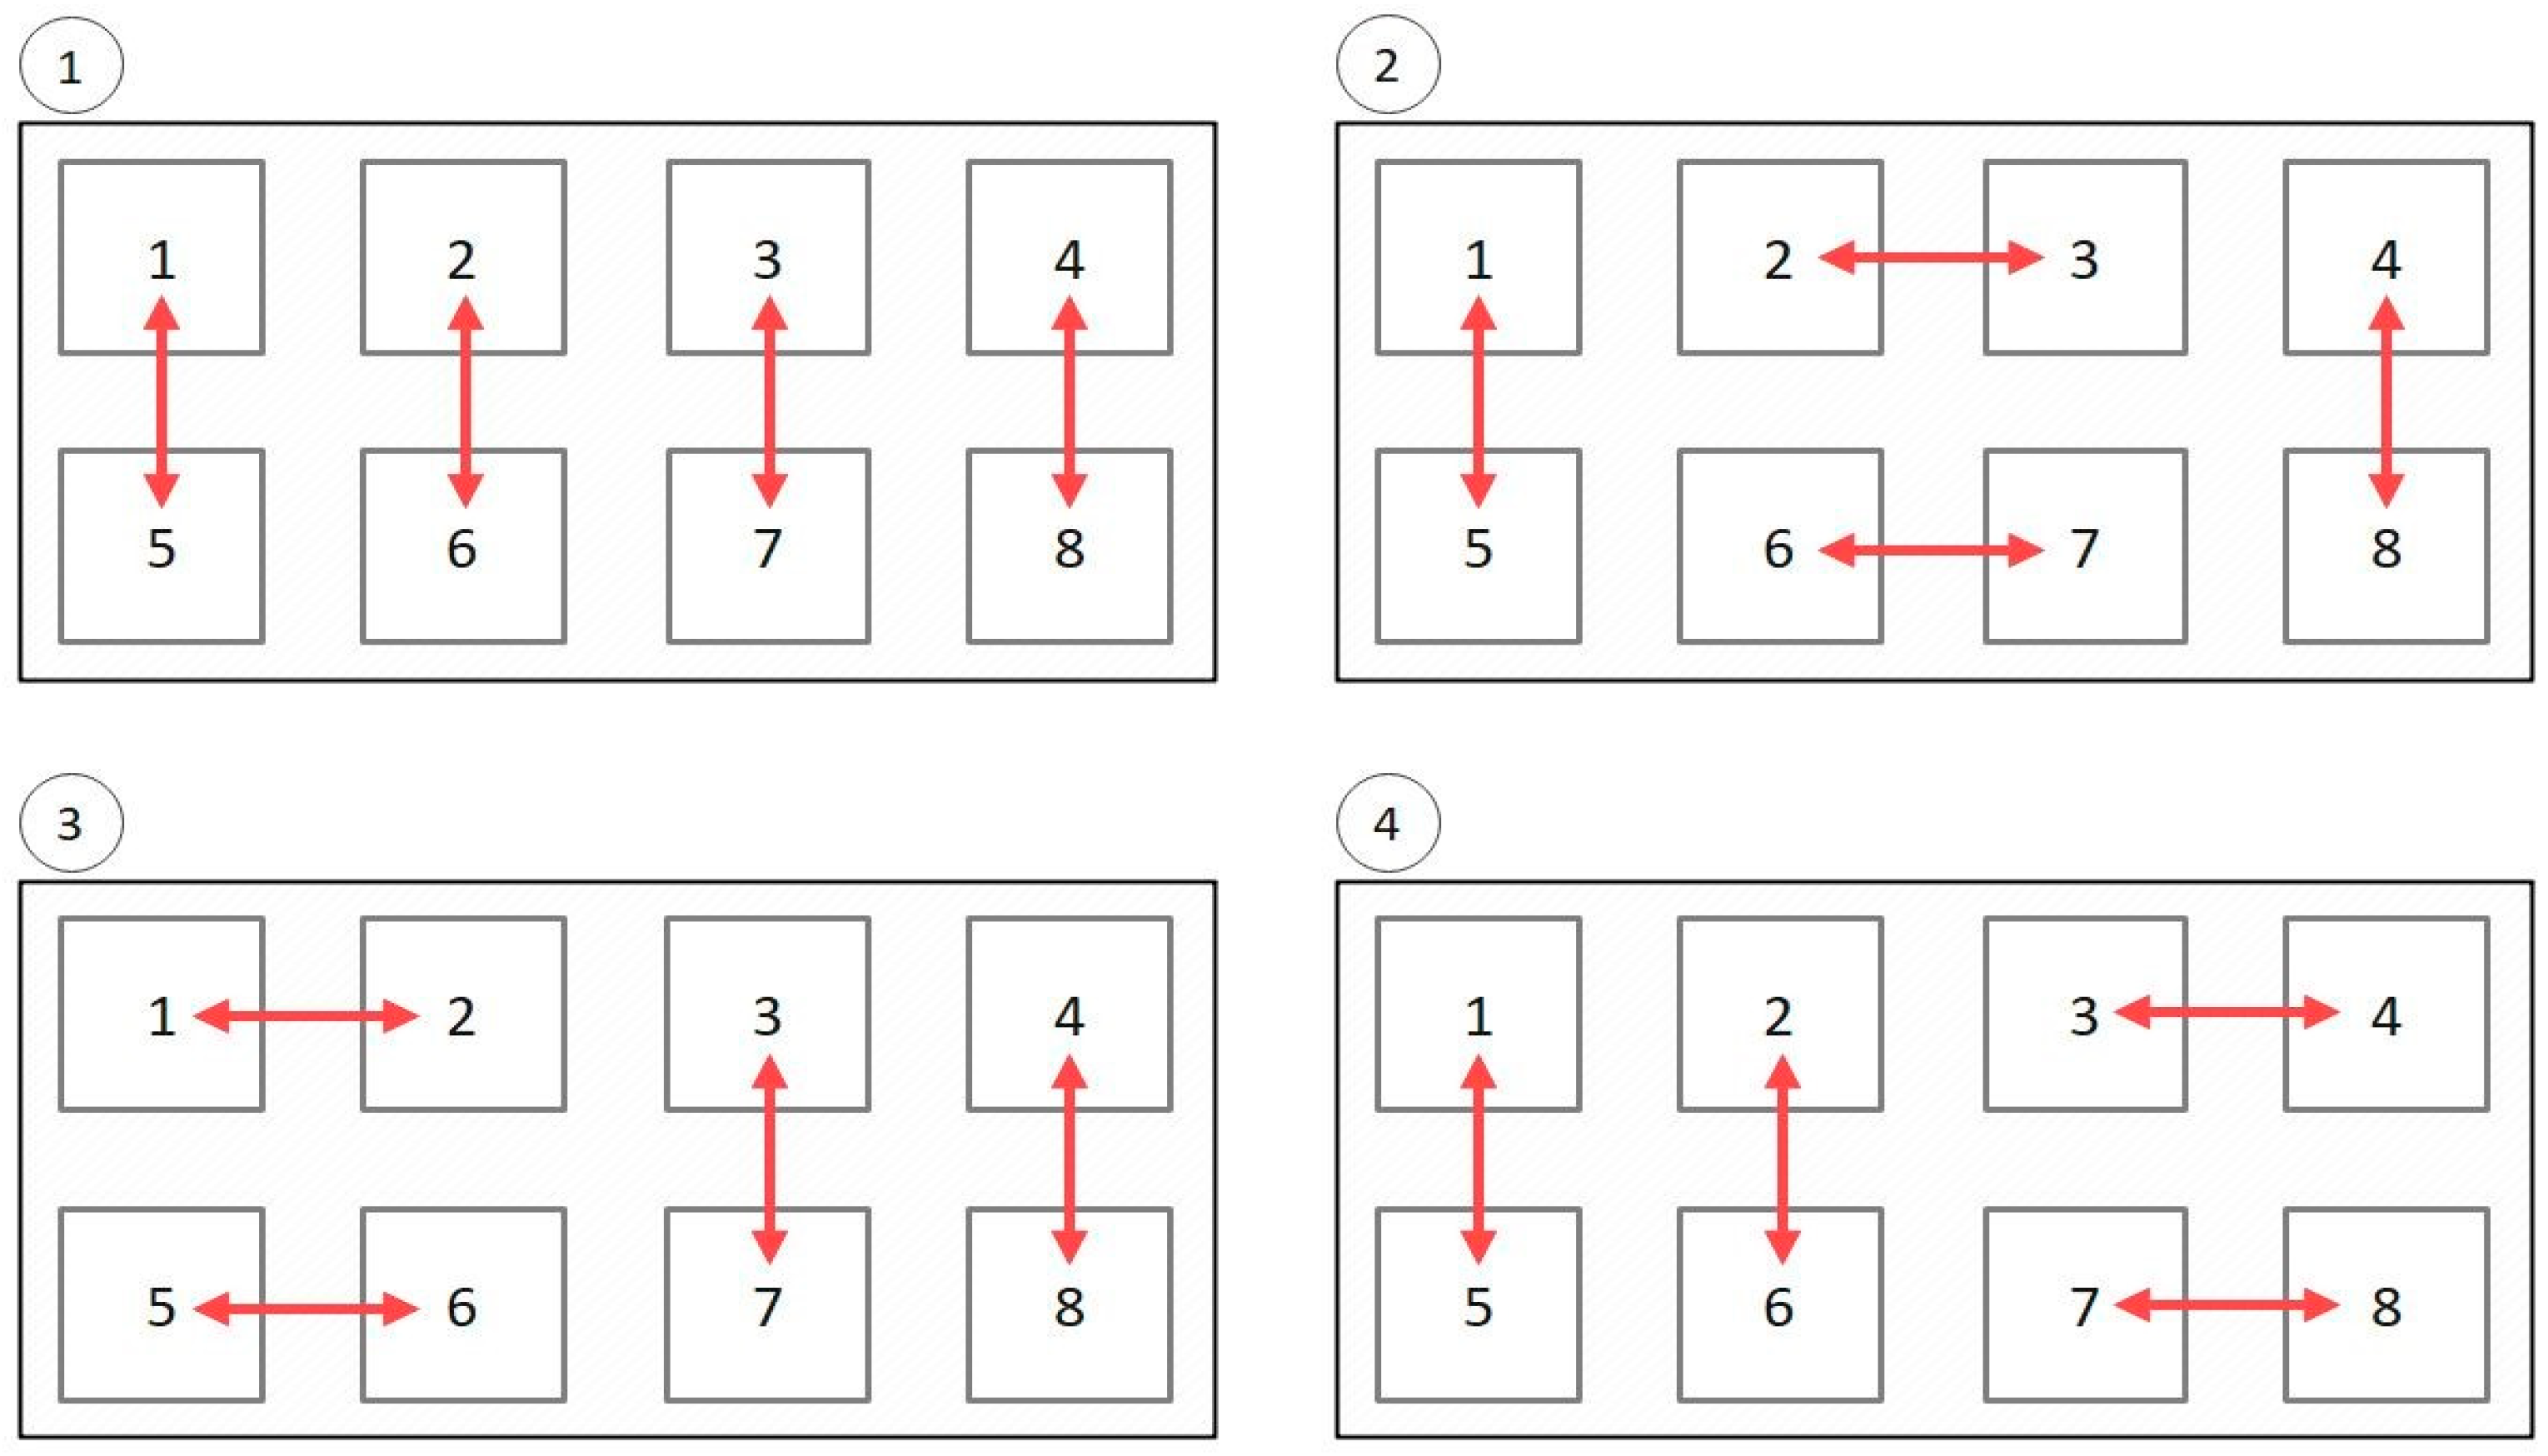
From
Figure 18, it can be determined that the valve has only four possible states, which does not align with the number of states in the patent. The four port combinations are shown in
Figure 19.
From Sandy Munro’s and his colleagues’ descriptions of the production system [
25], along with the detailed footage of the system with labels, the following coolant layout has been assumed (
Figure 20). On the production system, the LCC is now in series following drive unit and reservoir. This is believed to have been changed to reduce the complexity of the octovalve or reduce the total number of electronic actuators required to obtain the ninth output port shown in
Figure 1. Munro’s colleague confirms the only actuators on the coolant side of the system are the single valve (octovalve), the two pumps, fan, and radiator shutters to open/close air flow to the radiator. As a result, it is not possible to have the six octovalve states present in the patent. With both the battery loop and chiller loop remaining the same, the only viable layout is shown in
Figure 20.
With the changes from patent to production, all modes discussed in this paper can operate as the patent intended.
Table 2 shows the updated
Figure 20 valve states, which align with the patent states shown in
Figure 1 and
Figure 2.


