Abstract
Renewable power is expected to increase drastically in the coming years due to the energy transition. A large part of the newly installed generators will be connected to the power system through inverters and electronic converters, whose behaviour differs from the generators connected synchronously to the network. One of the main differences is the current contribution during symmetrical and asymmetrical faults which can affect protection systems. New grid codes establish requirements for fast current injection, but the converter’s maximum current limitations during faults make it difficult to establish control strategies for such current contribution. This paper studies the performance of faulted phase selector algorithm of a commercial relay under the current contribution from renewables before unbalanced faults. Two positive and negative sequence current injection strategies in compliance with new Spanish grid code requirements are proposed and tested under fault conditions in HiL (Hardware in the Loop). Test results show that the selected injection strategy affects the fault phase identification algorithm. Furthermore, the negative sequence injection requirements established in the new grid code improve the relay performance when line-to-line faults are applied, but they are not enough to identify all fault types.
1. Introduction
In recent years, the renewable generation penetration has been increasing to reduce the dependence on fossil fuels and carbon emissions, displacing conventional synchronous generation. Many of these renewable generators (mainly photovoltaic solar and wind power) are connected to the electric grid through power electronics converters whose behaviour differs from the conventional generator in normal operation and during disturbances.
In the case of faults in the electric power system, synchronous generators may inject fault current around 3–6 p.u. of nominal rating [1]. By contrast, the fault current typically provided by converters is limited to a range of 1.1–1.3 p.u. [2,3]. In addition to such lower fault current contribution [4,5], the fault characteristic differs from synchronous generators. Fault characteristic of renewable generators based on power electronics depends on the converter size, control strategy and the fault-ride-through requirements established by the network grid code [5,6,7]. The difference in the fault characteristic affects the protection system behaviour [8], endangering system stability and affecting the fault detection and protection selectivity [9,10].
During faults in the electric power system, renewable generators based on power electronics must help overcome the voltage dip by supplying reactive current as established in the network grid codes [11,12,13]. In some grid codes, the reactive current requirements only consider positive sequence current injection under balanced (symmetrical) and unbalanced (asymmetrical) faults [14]. Thus, in asymmetrical faults, the renewable generators provide a balanced reactive current that increases the voltage in all phases producing overvoltage in the healthy phases, affecting the safety of the system [1,15]. Moreover, the lack of negative sequence current also affects the behaviour of protection, causing maloperation [16,17,18].
New grid codes establish positive and negative sequence injection requirements to address these drawbacks. The European directive [19] allows network operators in coordination with transmission system operators (TSO) to define the requirements of fast fault current injection before asymmetrical faults. For example, the Spanish transmission system operator (Red Eléctrica de España, REE) specifies in the 12.2 Operating Procedure [20] the requirements for negative sequence current injection, the same as the German [21,22] or Greek [23]. Generally, all these grid codes state that the increment of reactive current in the positive and negative sequences should be proportional to the depth of the voltage dip.
Several studies have been performed regarding negative sequence contributions from converted-based renewable generators and their impact on the performance of protection relays [24,25,26,27,28,29,30,31]. Negative sequence current injection is analysed in [24]. This paper proposes and analyses several injection strategies from a voltage support point of view but does not analyse the influence of these strategies on the behaviour of protection relay algorithms. Most of the indicated studies ([25,26,27,28]) only consider simulation in different software, and some of them are only focused on directional algorithm misoperation ([28,29,30,31]) and do not consider phase fault identification (FID).
From these studies, it is worth highlighting [25,27], which investigate the influence of inverter-based resource control on several protection functions of the relay by comparing negative sequence impedance. The protection functions analysed are Negative-Sequence Overcurrent (50Q), Negative-Sequence Time Overcurrent (51Q), Negative-Sequence Directional Overcurrent (67Q) and Phase Fault Identification (FID). They show the malfunction of 51Q and 67Q through simulation examples run in transient electromagnetic programs (EMTP). These studies consider coupled and decoupled sequence control strategies but do not explain the positive and negative sequence injection priorities used to obtain these results. Although [27] also explains that FID may be influenced by the negative sequence current phase angle, the study only focuses on the negative and zero-sequence current angle relationship. However, it does not analyse the angular relationship between negative and the pure positive sequence current usually used in protection relays. Furthermore, it does not explain the negative sequence injection priorities used to carry out the study. In [25], Hardware in the Loop (HiL) is used, but only 67Q behaviour is tested before a single line-to-ground fault, and the main results are obtained by simulation.
In [26], the need to inject a negative sequence current is pointed out along with the influence of the control of the generators on distance protection installed in transmission systems. In this document, directionality is also considered. The authors of [31] report on the impact of negative-sequence current injection from solar plants connected to the transmission grid in the operation of negative sequence directional elements of the protective relays by recorded data, but only single-line-to-ground and line-to-line faults are analysed. Nevertheless, in [26,31], the control of the power converters is unknown, and no conclusions about the influence of such control can be obtained.
The objective of the study is to check whether compliance with these new grid code requirements will help the protection systems select the faulted phase correctly, or it will be necessary to develop new algorithms to achieve it. For that aim, this paper proposes two strategies to establish the priority of positive and negative sequence injection under unbalanced faults considering the maximum current limit of the power converter. These strategies, which fulfil the new Spanish grid code requirements, are implemented in a decoupled converter control. Once the strategies are implemented, their effect on FID algorithms typically used in commercial protection relays installed in the distribution grid has been analysed and tested in a lab environment. These FID algorithms are based on the angular relation between negative and pure positive sequence current.
A HiL configuration with a Real-Time Digital Simulator (RTDS) is used to carry out this task. In HiL, the RTDS reproduces events that can appear in an electric power system modelled in RSCAD software, generating currents and voltages seen by the relay during a fault and recording the relay behaviour. In this study, two strategies compliant with the Spanish grid code are proposed and implemented in the decoupled sequence control used by Photovoltaic generator (PV) and Type-IV wind turbines RSCAD models.
To describe the developed work, the paper is structured as follows. Section 2 describes the faulted phase selection algorithm implemented in the commercial relay to test during this study. Section 3 summarises the grid code requirements regarding low voltage ride-through and fast fault current injection. These requirements are based on synchronous generator behaviour during unbalanced faults; therefore, this section shows an example of such behaviour. Section 4 proposes fast fault current injection strategies to fulfil grid code requirements. After that, Section 5 describes the general control block diagram implemented in the power electronic interfaces model used by PV and Type-IV wind turbines to fulfil grid code requirements. The laboratory test bench used to evaluate the new strategies in relay behaviour is described in Section 6. Finally, the main results and conclusions are included in Section 7 and Section 8.
2. Faulted Phase Selection Algorithm
The main function of faulted phase selectors is to identify the type of fault (single-line-to-ground, line-to-line-fault, line-to-line-to-ground fault or three-phase fault) and the phases involved. Once this identification is performed, the results are provided to the different protection algorithms whose operation depends on this information, for example, the release of impedance loops of a distance function or directional elements.
The faulted phase selection logic of the overcurrent commercial protection relay has been tested in this study. The operation principle of this logic, which is based on sequence-current theory, is illustrated in Figure 1. This figure shows the angular relationship between the negative sequence current (I2) and the pure positive sequence current (I1_f) used by the commercial relay to identify the faulted loop in case of asymmetrical faults. Figure 1a) is used to identify single-phase- or two-phase-to-ground faults, and Figure 1b) to identify two-phase faults. The faulted phase logic identifies the faulted phases by determining which sector the angle relationship falls. For example, the fault is classified as AB if the phase angle between I2 and I1_f is 60° in a line-to-line fault. By contrast, if the phase angle falls at 180°, the faulted phase is identified as BC.
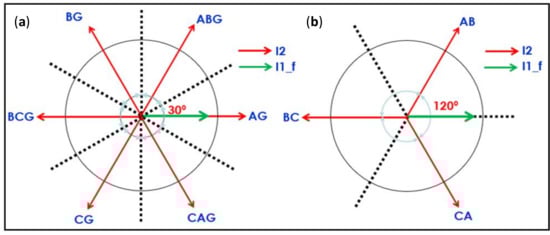
Figure 1.
Angular relationship between the negative current (I2) and the pure positive sequence current (I1_f): (a) Single-phase- and two-phase-to-ground fault diagram; (b) two-phase fault diagram [32].
The right operation of the faulted phase selection logic described in Figure 1 depends on the angular relationship between I2 and I1_f, which is based on the fault current contribution behaviour of synchronous generators. In this study, this logic is tested when fault current comes from renewable generators connected to the electric grid by means of power electronic devices and considering different injection strategies.
3. European Grid Code Requirements Review: Spanish Example
All generators must meet the requirements established by the TSO of the network to which they are connected. These requirements depend on the maximum capacity and/or the voltage at the connection point. In [33], power-generating modules are classified into Type A, Type B, Type C and Type D according to different capacity and voltage ranges. Table 1 shows this classification.

Table 1.
Power-generating modules classification in the Spanish grid Code [33].
This paper is focused on distributed generation connected in a medium voltage distribution network. Hence, Type D generating modules, which consider voltages above 110 kV, are dismissed. Furthermore, Type A generating modules are also dismissed because they do not provide a low voltage-ride through control. Therefore, only requirements for Type B and Type C are considered in the following sections.
When there is a fault in the electric grid, the PV and Type-IV wind turbine generation must remain connected to the grid for a minimum time to ensure that power system operation is secure and reliable. This operational behaviour is known as Low-Voltage Ride-Through (LVRT) [34]. Figure 2 shows the LVRT profile according to the Spanish grid code that must be satisfied by Type B and Type C generation modules. It shows the relationship between the voltage dip depth (∆U in p.u.) measured at the connection point and the minimum time that the electrical power module shall remain connected to the grid.
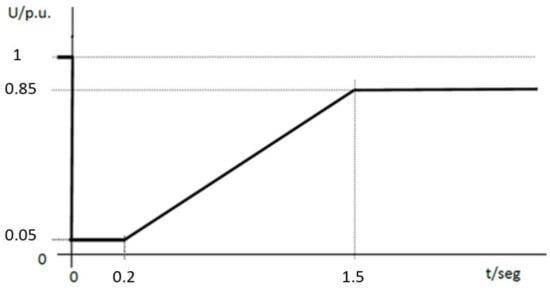
Figure 2.
Low-voltage ride-through profile applied to type B and type C electric power-generating module [20].
Additionally, before a voltage dip, the reactive current injection must increase depending on the voltage depth. The new grid code published in July 2020 [33] specifies positive and negative sequence current injection requirements for Type B and Type C generators when an asymmetrical fault is applied. The reactive current injection must comply with the profiles shown in the Figure 3.
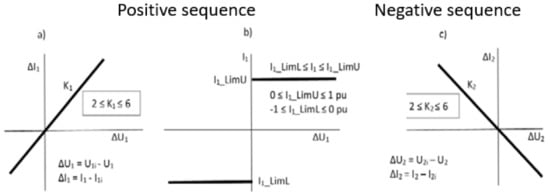
Figure 3.
(a) Injection/consumption of additional positive reactive current (∆I1,r) depending on positive voltage drop; (b) total reactive current Injection/Consumption limitation (Ir); (c) injection/consumption of additional negative reactive current (∆I2,r) depending on negative voltage drop [20].
Where ∆U1 represents the voltage drop/rise in the positive sequence, ∆U2 represents the voltage drop/rise in the negative sequence, and K1 and K2 are proportional constants in the positive and negative sequences. These constant values must be adjustable in the range of 2–6, although the default value is 3.5 p.u., unless specifically indicated by the DSO in coordination with the TSO. In the following sections, these proportional constants will be called K-factor.
From Figure 3, it is concluded that under unbalanced faults, the control of the power-generating module injects positive and negative sequence reactive current proportional to the voltage deep by a factor K. Furthermore, the figure shows the maximum current provided by the control of the power converter.
The Figure 4 shows the contribution of a synchronous generator to a two-phase AB fault. During the fault, for a 30% depth voltage dip (∆U1 and ∆U2), the generator supplies reactive currents in positive (I1,r) and negative (I2,r) sequences proportional to the voltage dip (K1 = 2.8 and K2 = 2), as indicated in the grid code. This synchronous generator injects a phase current that reaches 2.2 p.u. in phase A and 1.8 p.u. in phase B. This behaviour is not possible in a power electronics-based generator due to the current limitations imposed by the converter. Therefore, it is necessary to analyse how this type of generator can supply positive and negative sequence currents during unbalanced faults without exceeding the power converter limits. With this objective, the next section proposes different active and reactive current injection strategies under unbalanced faults. After that, the general control diagram implemented in the power electronic interfaces model used by PV and Type-IV wind turbines is described.
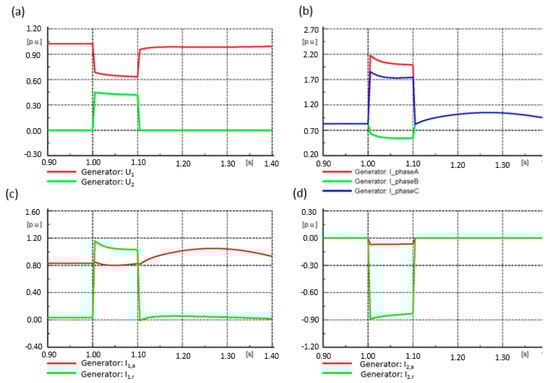
Figure 4.
Contribution of a synchronous generator to a two-phase AB fault: (a) positive (U1) and negative (U2) sequence voltage; (b) phase current injection; (c) active (I1,a) and reactive (I1,r) current in positive sequence; (d) active (I2,a) and reactive (I2,r) current in negative sequence.
4. Current Fault Injection before Unsymmetrical Faults by Power Electronic-Based Generator
The traditional protection schemes are designed based on the current contribution of conventional synchronous generators under fault conditions, but the behaviour of power electronic-based generators differs during faults. As explained in Section 3, conventional synchronous generators can provide currents several times greater than nominal current during unbalanced faults. In contrast, fault current in power electronic-based generators is limited to avoid exceeding their designed current ratings. Therefore, it is not always possible to provide the reactive current in positive and negative sequence and the active current in the positive sequence from the direct application of Figure 3 without exceeding the limits of the power converter, and it is necessary to establish a system of injection priorities so as not to exceed the current ratings of the converters.
From an analysis of grid code requirements described in Section 3 [33], two injection strategies (strategy A and B) have been proposed. These strategies establish the priority of positive and negative sequence current injection before unbalanced faults, considering the limits of the power converter and applying the same K-factor for positive (K1) and negative sequence (K2) based on synchronous generator behaviour. Furthermore, the strategies do not consider the negative sequence active current injection during a voltage dip to resemble the performance of the negative sequence network of a synchronous generator, where the impedance is predominantly reactive.
Figure 5 shows the flowchart from strategy A. If an unbalanced fault is applied, this strategy prioritizes the active and reactive current injection in the positive sequence over the negative sequence reactive current injection. In the first step, active and reactive current in the positive sequence is calculated based on Figure 3a and compared with the maximum phase current limit (Imax,phase). If such limit is not reached, the negative sequence reactive current is calculated according to Figure 3c, considering the same K-factor (K1 = K2). Still, if the value obtained exceeds the maximum phase current limit, K2 is reduced until the limit is fulfilled. Moreover, it must be considered that this strategy does not define a minimum negative sequence reactive current.
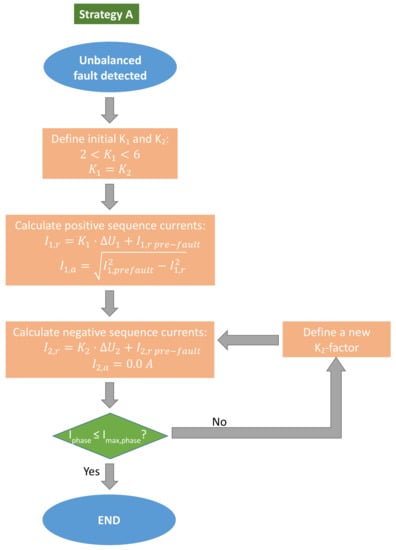
Figure 5.
Strategy A flowchart to fulfil fast fault current injection requirement.
In strategy B, described in Figure 6, the power converter control prioritises the positive and negative sequence reactive current injection over the positive sequence active current injection during unbalanced faults. The same K-factors between 2 and 6 are initially selected to calculate the reactive current injection (K1 =K2) in the first step. Still, they will be reduced at the same proportion during the fault to fulfil the maximum reactive current injection limitation (I1_LimU), which is lower than the maximum phase current limit (Imax,phase). The active current injection in the positive sequence is calculated considering the margin between the maximum phase current limit and the maximum reactive current injection.
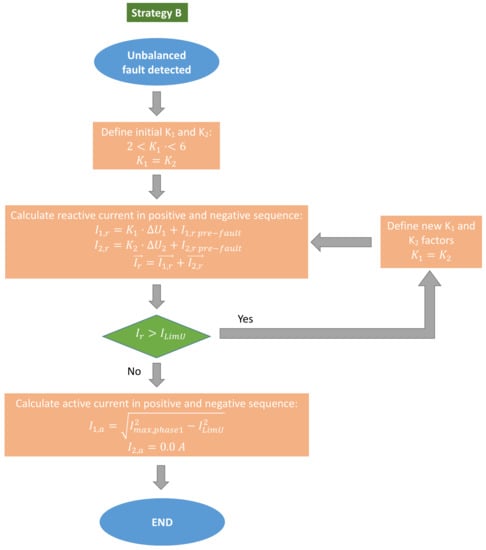
Figure 6.
Strategy B flowchart to fulfil fast fault current injection requirement.
5. Control Diagram of Power Electronic Interfaces Devices to Be Used during the Study
The strategies proposed in the previous section are modelled in the outer control loop of a PV and a Type-IV wind turbine power converter, whose structure is shown in Figure 7. The control technique used by the power converter is based on the decoupled control structure in a d-q reference framework that permits managing active and reactive power independently [35,36,37]. Figure 7 shows a schematic diagram of the implemented control.
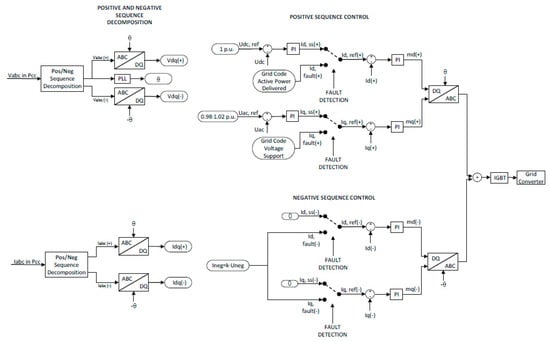
Figure 7.
Schematic control diagram.
As shown in Figure 7, under normal conditions, the active current loop controls the DC bus voltage of the power converter and the active power delivered by the generator. Moreover, the reactive current control manages the voltage at the converter connection point or fixes the reactive power provided to the grid.
During fault conditions, the reactive current control must provide voltage support based on the grid code requirements, considering the maximum current supplied by the converter to avoid undesirable damage to the equipment.
To carry out these tasks, as a first step, the three-phase voltages (Vabc) and current (Iabc) waveforms are measured at the point of common coupling (PCC). After that, these time-domain waveforms are decomposed in stationary frame α-β using the power variant Clarke transform [38,39]. After the decomposition, voltage and current values are split into a positive and negative sequence. From the decomposition and using Park transformation [39,40], d-q parameters in both sequences are obtained (Vdq(+), Vdq(−), Idq(+) and Idq(−)). The control uses these d-q values in steady-state conditions and under fault conditions.
In normal conditions, currents and voltages in negative sequence are close to zero. Therefore, the negative sequence control loop is deactivated, and only the positive sequence control operates. By contrast, in unbalanced faults, according to grid code requirements described in Section 3, the power converter must supply positive and negative sequence current, and as a result, positive and negative control loops are activated.
Based on the control diagram described and considering the strategies previously detailed, the scheme shown in Figure 8 is introduced in the control diagram (Figure 7) during Id,fault and Iq,fault calculation in positive and negative sequences under fault conditions:
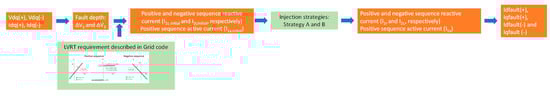
Figure 8.
Control methodology to inject positive and negative sequence current.
To analyse the influence of these strategies on faulted phase selection algorithm operation described in Section 4, several tests were carried out in the laboratory test bench described in the next section.
6. Laboratory Test Bench
The two injection strategies proposed are tested in the benchmark grid model shown in Figure 9. In this benchmark grid, the external grid is represented by a Thevenin equivalent, and it is connected to the distribution level by a 55/12 kV transformer. The MV side grounding of the transformer is set to consider a grounded and an ungrounded distribution grid topology in the analysis. An 11 MW renewable generator is connected at the point indicated as “RES” in the figures. During tests, two technologies are considered: PV and a Type-IV wind turbine. Overhead lines connect renewable technologies to the distribution grid, and the lightning symbol represents the fault inception point. The following fault types have been applied at this point:
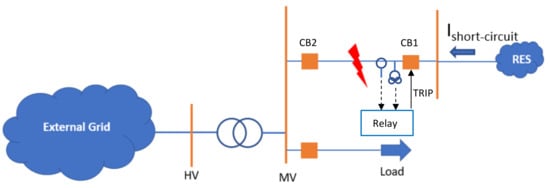
Figure 9.
Benchmark distribution grid used to analyse relay performance.
- Single-line-to-ground faults (SLG): AG, BG and CG.
- Line-to-line faults (LL): AB, BC and CA.
- Line-to-line-to-ground faults (LLG): ABG, BCG and CAG.
The figure shows the fault point, the current and voltage transformers’ location and the fault current contribution from the renewable source, which in the figure is denoted as Ishort-circuit. Breaker CB2 is closed during the simulations to analyse the faulted phase selector in the protection relay.
The analysis of commercial protection systems is performed by Hardware in the Loop (HiL) configuration with an RTDS simulator. Figure 10 shows the scheme used during the study.
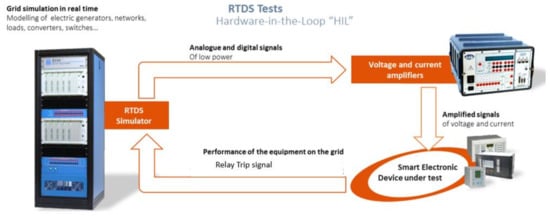
Figure 10.
Hardware in the loop configuration.
RTDS is a real-time digital simulator that reproduces events that can appear in the electric grid, generates currents and voltages seen by the relay during a fault, and records the relay behaviour under this scenario.
The benchmark distribution grid is modelled in RSCAD software to perform the study and simulate it by the RTDS, which generates the current and voltage values to be measured by relay. These values are in the range ±10 V, so the amplifier amplifies them to represent the actual secondary values measured by the relay. The amplifier has six current and voltage channels with a maximum output voltage and current values of 300 Vrms and 70 Arms. Once the current and voltage values are amplified, they are used to supply the voltage and current analogue inputs of the protection relay. The relay produces a trip signal when a fault current is detected and sends this signal to the RTDS to continue the simulation.
7. Results and Discussion
Table 2 summarises the results obtained in the tests described in the previous section when the renewable source is a PV generator. These results show that both strategies improve faulted phase selection in LL faults compared to current controls, in which only a positive sequence current is supplied during unbalanced faults. Consequently, the faults are identified as three-phase faults [41]. Nevertheless, they still cannot correctly identify LLG faults.
Table 2.
Study cases to evaluate negative current injection in current protection relays located in distribution grids (K1 = K2).
Regarding SLG faults, two situations can be distinguished in the table. In ungrounded systems, these faults cannot be detected using phase overcurrent protection. This fact is indicated in the table as NA (not applicable). In the grounded distribution system, the faulted phase selector results before SLG faults depend on the current injection strategy, identifying it correctly with Strategy A but not with Strategy B.
In LL faults, the phase selection is subjected to the initial K-factor with Strategy A; for example, it fails if K-factor is 3.5, but the faulted phase is correctly identified if this parameter is set to 2.5. However, Strategy B uses a calculated K-factor that considers the current limit of the converter for the other fault types, but the behaviour is still wrong for this fault type.
To perform a detailed analysis of the obtained results, the negative sequence current phasors (I2) with respect to the pure positive sequence current (I1_f) obtained during an AG fault are represented in the angular diagram that describes the operation of the faulted phase selection logic (Figure 11). From this figure, it is concluded that the PV control, for both strategies, shifts the negative sequence phasor and makes that I2 falls within the angle sector defined for ABG faults with strategy B (green colour). In strategy A (red colour), the phase shift is not big enough to make that I2 falls in the ABG sector.
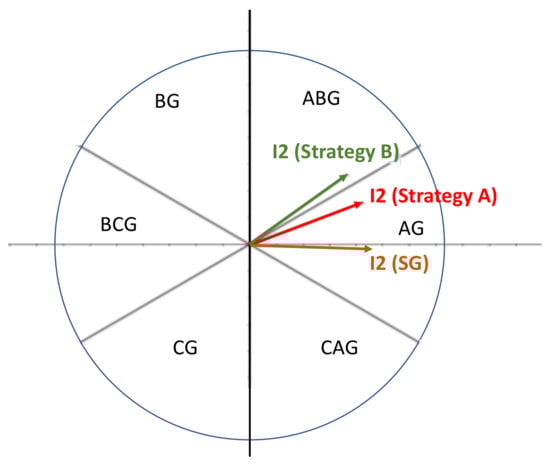
Figure 11.
Graphical representation of the angle sectors used to identify single-line and double-line-to-ground faults and I2 phasor when strategy A and Strategy B with a K-factor = 2.5.
Furthermore, to observe the influence of the initial K-factor value in test results, the AB fault in the grounded system is analysed when the initial K-factor is set to 2.5 or 3.5. The results obtained from this study are gathered in Figure 12, Figure 13, Figure 14 and Figure 15. These figures show the phase voltages (VA, VB and VC) and phase currents (IA, IB and IC) measured by the protection relay. These figures also show the digital signals included in the oscillography, which are indicated in Table 3. When one of these digital signals is activated, it is indicated by an orange rectangle whose length depends on the time that signal remains active. For example, in Figure 12, the fault detector (FD) is activated after a few milliseconds after t = 0 s and is deactivated a few milliseconds before t = 0.7 s indicating that the protection relay detects a fault during such time.
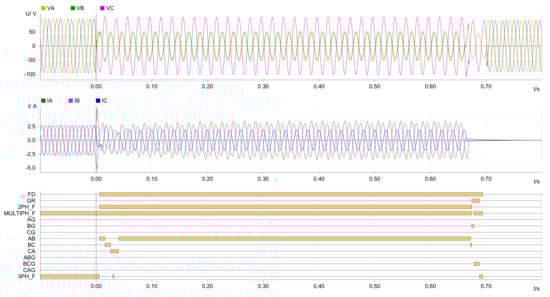
Figure 12.
Faulted phase selector when AB fault is applied and K-factor = 2.5 using Strategy A.
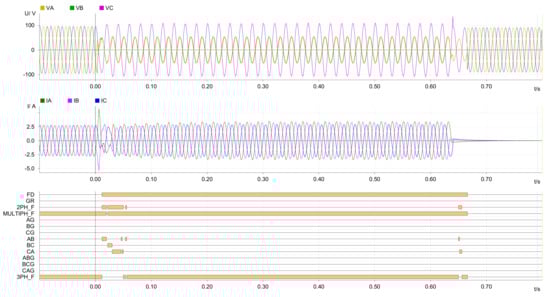
Figure 13.
Faulted phase selector when AB fault is applied and K-factor = 3.5 using Strategy A.
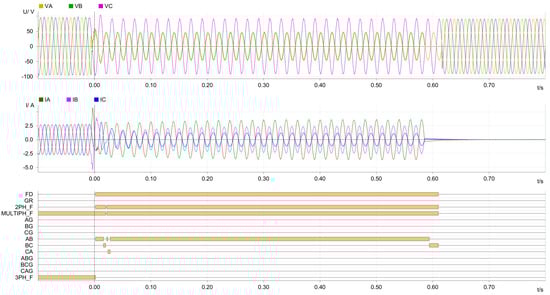
Figure 14.
Faulted phase selector when AB fault is applied and K-factor = 2.5 using Strategy B.
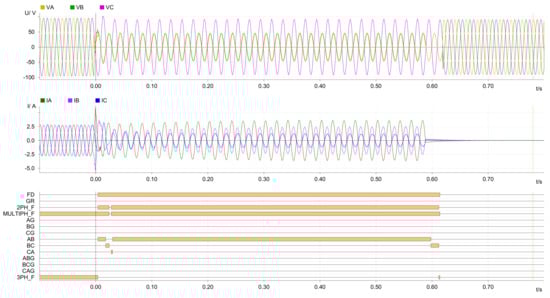
Figure 15.
Faulted phase selector when AB fault is applied and K-factor = 3.5 using Strategy B.
Table 3.
Digital signals definition.
In these conditions, when strategy A is used, faulted phase selector operation depends on such initial K-factor, as shown in Figure 12 and Figure 13. If the K-factor is set to 2.5 (Figure 12), the relay can identify the AB fault correctly (digital signal AB is activated), but the faulted phase selection algorithm identifies a three-phase fault (3PH_F) when 3.5 is used (Figure 13). By contrast, Strategy B provides the same faulted phase identification for both initial K-factor values (AB fault). Therefore, Strategy A is more sensitive to the initial K-factor than Strategy B because faulted phase selector operation changes depending on such value. Thus, strategy B is the most stable because the result does not depend on the initial settings, but K-factor during the fault is out of the range defined in the grid codes.
Moreover, the maximum current limit of the power converter can make the K-factor fall below the minimum indicated in the grid code when Strategy B is used. When an unbalanced fault is applied in this strategy, the reactive current increments in positive and negative sequences are calculated depending on the voltage dip depth and the initial K-factor value selected. Nevertheless, these reactive current values may exceed the imposed limit of 0.9 p.u. In these conditions, initial K1 and K2 factors are reduced in the same proportion to satisfy the required limit for reactive current values. This effect is shown in Figure 16 for a PV generator before an AB fault in the undergrounded system. In the example, the initial K-factor value is 2.5. When the fault is applied, the reactive current changes depending on the dip depth shown in Figure 16a, but the calculated current is above the maximum limit, activating the limitation flag (Figure 16c). This flag indicates that the K-factor must be reduced to avoid converter damage and satisfy the reactive current injection requirement.
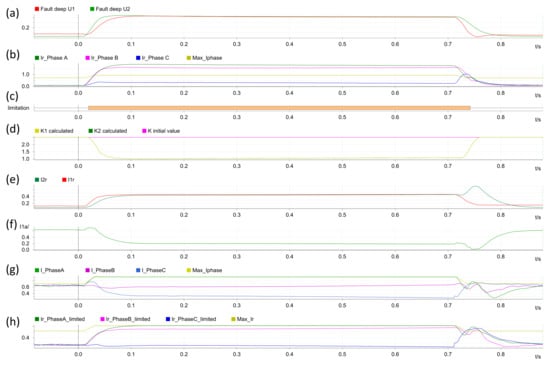
Figure 16.
K-factor when AB fault is applied and PV plant is connected: (a) voltage dip depth in positive (Fault deep U1) and negative (Fault deep U2) sequences; (b) reactive current in each phase (Ir_Phase A, Ir_Phase B and Ir_Phase C) calculated without consider the maximum current limit of the power converter; (c) limitation flag; (d) K-factor values; (e) reactive current in positive (I1r) and negative (I2r) sequences; (f) Active current in positive sequence; (g) phase current; (h) reactive current injected in each phase considering the maximum reactive current injection limitation (Max_Ir).
This strategy has been tested in the benchmark grid described in Section 6, obtaining the results shown in Table 4, which summarises the K-factor average value obtained in the simulations. In all these simulations, the reactive current before the event is 0.129 p.u., the initial K-factor value is 2.5, and the fault has been produced at 50% of the line shown in Figure 9. In each case, the depth of the voltage dip depends on the fault type; for example, in the AB fault simulated in the grounded configuration, the voltage dip depth is 0.42 p.u., and for the AG fault, 0.2 p.u. The highest values of the K-factor are obtained for SLG faults, but they are still below the 2.0 limit defined in the grid code requirements, even for low values of voltage dip depth. This scenario is not considered in the network code, but it is in the technical standards for the compliance of generators (NTS-generators) [42] that are used to verify the compliance of the generation unit. It specifies that if the factors are less than indicated, it will be considered valid if the positive and negative sequence components are limited to the same proportion or the positive sequence component will be higher than 40% of the apparent nominal current. In this case, the first condition is met. It should be noted that a different K-factor is obtained when fault current comes from PV or Type-IV wind turbine. It is due to the different impedances between the renewable resources and the fault locations in both generator models.
Table 4.
K-factor values when strategy B is applied for negative current injection.
8. Conclusions
This paper analyses the performance of the faulted phase selection algorithm of a commercial overcurrent relay before short circuit current contribution according to new Spanish grid code requirements, which indicate that in case of unbalanced faults, negative sequence current input must be performed.
Two different injection strategies that prioritise positive and negative sequence current injection have been defined, considering the grid code requirements and the limitations imposed by power converters from renewable generators. To check the influence of new current injection requirements in commercial relays, these strategies were implemented and tested by HiL. In these tests, a real-time digital simulator reproduces events in a benchmark distribution grid, generates currents and voltages measured by the commercial relay during a fault, and records the relay behaviour under these scenarios.
As expected, test results show that the new grid code requirements improve the behaviour of the faulted phase selection compared to those obtained with a current contribution without negative sequence. However, such behaviour depends on the current injection strategy and is still insufficient to identify faulted phase in every unbalanced fault type correctly. In fact, line-to-line-to-ground faults are not correctly identified in any test performed. Consequently, new fault phase selection algorithms are still needed to guarantee the correct faulted phase identification and ensure the reliability of the protection installed and, thus, the stability of the electric power system.
Another conclusion is related to the effect of the current injection defined in the grid code. On the one hand, the fact that different results with the two strategies described in this paper are obtained indicates the need for a further definition of the requirements noted in the grid codes, such as, for example, a minimum level of negative sequence current during the unbalanced fault. On the other hand, comparing the proposed injection strategies, phase selection with Strategy B, which prioritises the positive and negative current injection, is less sensitive to the initial K-factor value selected because the faulted phase selection algorithm provides the same faulted phase when K-factor is varied. Furthermore, it is seen that the K-factor obtained by the algorithms depends on the injection strategy, the fault type, the voltage dip depth and the maximum current injection from the power converter during faults. The tests show that the initial K-factor is reduced during unbalanced faults, even outside the defined range.
Author Contributions
Investigation, M.T.V., M.P.C. and E.M.C.; Methodology, M.T.V., M.P.C. and E.M.C.; Writing—original draft, M.T.V.; Writing—review & editing, M.P.C., E.M.C. and A.A.P.H. All authors have read and agreed to the published version of the manuscript.
Funding
This work was supported in by the FLEXIGRID project from European Union’s Horizon 2020 research and innovation programme under grant agreement No 864579. This paper reflects the FLEXIGRID consortium view, and European Commission is not responsible for any use that may be made of the information it contains.
Institutional Review Board Statement
Not applicable.
Informed Consent Statement
Not applicable.
Data Availability Statement
Not applicable.
Conflicts of Interest
The authors declare no conflict of interest.
Nomenclature
| FID | Phase fault identification |
| LVRT | Low-voltage ride-through |
| PV | Photovoltaic generator |
| I2 | Negative sequence current |
| I1_f | Pure positive sequence current |
| U1 | Voltage in positive sequence |
| U2 | Voltage in negative sequence |
| ∆U1 | Voltage drop/rise in the positive sequence |
| ∆U2 | Voltage /drop/rise drop in the negative sequence |
| K1 | Proportional constant in positive sequence |
| K2 | Proportional constant in positive negative sequence |
| I1,r | Reactive current in positive sequence |
| I1,a | Active current in positive sequence |
| I2,r | Reactive current in negative sequence |
| I2,a | Active current in negative sequence |
| Imax,phase | Maximum phase current limit |
| I1_LimU | Maximum reactive current injection limitation |
| ∆I1,r | Reactive current variation in positive sequence |
| ∆I2,r | Reactive current variation in negative sequence |
| PCC | Point of common coupling |
| Vdq(+) | Positive sequence voltage in the dq-frame |
| Vdq(−) | Negative sequence voltage in the dq-frame |
| Idq(+) | Positive sequence current in the dq-frame |
| Idq(−) | Negative sequence current in the dq-frame |
| Idfault (+) | Positive sequence current under fault conditions in d-axis |
| Idfault (−) | Negative sequence current under fault conditions in d-axis |
| Iqfault (+) | Positive sequence current under fault conditions in q-axis |
| Iqfault (−) | Negative sequence current under fault conditions in q-axis |
References
- Thengius, S. Fault Current Injection from Power Electronic Interfaced Devices. Master’s Thesis, KTH, School of Electrical Engineering and Computer Science (EECS), Stockholm, Sweden, 2020. [Google Scholar]
- Li, R.; Booth, C.; Dyśko, A.; Roscoe, A.; Urdal, H.; Zhu, J. Protection Challenges in Future Converter Dominated Power Systems: Demonstration through Simulation and Hardware Tests. In Proceedings of the International Conference on Renewable Power Generation (RPG 2015), Beijing, China, 17–18 October 2015; pp. 1–6. [Google Scholar]
- Quispe, J.C.; Orduña, E. Transmission Line Protection Challenges Influenced by Inverter-Based Resources: A Review. Prot. Control Mod. Power Syst. 2022, 7, 28. [Google Scholar] [CrossRef]
- Dahal, M.; Jha, A.K.; Ghimire, R. Impact of Renewable Distributed Generation on Protection Coordination of Distribution System. Int. J. Eng. Appl. Sci. 2019, 6, 36–42. [Google Scholar] [CrossRef]
- Fang, Y.; Jia, K.; Yang, Z.; Bi, T.; Li, Y. Impact of Inverter-Interfaced Renewable Energy Generators on Distance Protection and an Improved Scheme. IEEE Trans. Ind. Electron. 2018, 66, 7078–7088. [Google Scholar] [CrossRef]
- Chakrapani, V.; Voloh, I. Impact of Renewable Generation Resouce on the Distance Protection and Solutions. In Proceedings of the 16th International Conference on Developments in Power System Protection (DPSP 2022), Newcastle, UK, 7–10 March 2022; pp. 238–243. [Google Scholar]
- Aljarrah, R.; Marzooghi, H.; Yu, J.; Terzija, V. Monitoring of Fault Level in Future Grid Scenarios with High Penetration of Power Electronics-based Renewable Generation. IET Gener. Transm. Distrib. 2021, 15, 294–305. [Google Scholar] [CrossRef]
- Paladhi, S.; Pradhan, A.K. Adaptive Distance Protection for Lines Connecting Converter-Interfaced Renewable Plants. IEEE J. Emerg. Sel. Top. Power Electron. 2021, 9, 7088–7098. [Google Scholar] [CrossRef]
- Jones, K.W.; Pourbeik, P.; Kobet, G.; Berner, A.; Fischer, N.; Huang, F.; Holbach, J.; Jensen, M.; O’Connor, J.; Patel, M. Impact of Inverter Based Generation on Bulk Power System Dynamics and Short-Circuit Performance; PES-TR68; IEEE: Piscataway, NJ, USA, 2018. [Google Scholar]
- Johnson, S.C.; Rhodes, J.D.; Webber, M.E. Understanding the Impact of Non-Synchronous Wind and Solar Generation on Grid Stability and Identifying Mitigation Pathways. Appl. Energy 2020, 262, 114492. [Google Scholar] [CrossRef]
- Camacho, A.; Castilla, M.; Miret, J.; Guzman, R.; Borrell, A. Reactive Power Control for Distributed Generation Power Plants to Comply with Voltage Limits During Grid Faults. IEEE Trans. Power Electron. 2014, 29, 6224–6234. [Google Scholar] [CrossRef]
- Khan, A.; Ahmad, H.; Ahsan, S.M.; Gulzar, M.M.; Murawwat, S. Coordinated LVRT Support for a PMSG-Based Wind Energy Conversion System Integrated into a Weak AC-Grid. Energies 2021, 14, 6588. [Google Scholar] [CrossRef]
- Karimi, H.; Haddadi, A.; Karimi-Ghartemani, M.; Sadabadi, M. A Robust Vector Current Controller with Negative-Sequence Current Capability for Grid-Connected Inverters. Energies 2021, 14, 4549. [Google Scholar] [CrossRef]
- Baeckeland, N.; Herteleer, B.; Kleemann, M. Modelling Fault Behaviour of Power Electronic Converters. Int. J. Electr. Power Energy Syst. 2020, 123, 106230. [Google Scholar] [CrossRef]
- Jia, J.; Yang, G.; Nielsen, A.H. A Review on Grid-Connected Converter Control for Short-Circuit Power Provision Under Grid Unbalanced Faults. IEEE Trans. Power Deliv. 2018, 33, 649–661. [Google Scholar] [CrossRef]
- Chen, B.; Shrestha, A.; Ituzaro, F.A.; Fischer, N. Addressing Protection Challenges Associated with Type 3 and Type 4 Wind Turbine Generators. In Proceedings of the 2015 68th Annual Conference for Protective Relay Engineers, College Station, TX, USA, 30 March–2 April 2015; pp. 335–344. [Google Scholar]
- Hooshyar, A.; Azzouz, M.A.; El-Saadany, E.F. Distance Protection of Lines Emanating from Full-Scale Converter-Interfaced Renewable Energy Power Plants—Part I: Problem Statement. IEEE Trans. Power Deliv. 2015, 30, 1770–1780. [Google Scholar] [CrossRef]
- Power System Relaying and Control Committee (Subcommittee C). System Protection Working Group C32, Protection Challenges and Practices for Interconnecting Inverter Based Resources to Utility Transmission Systems; IEEE: New York, NY, USA, 2020. [Google Scholar]
- Commission Regulation (EU) 2016/631 of 14 April 2016 Establishing a Network Code on Requirements for Grid Connection of Generators. 2016, pp. 1–68. Available online: https://eur-lex.europa.eu/eli/reg/2016/631/oj (accessed on 7 July 2022).
- Ministerio para la Transición Ecológica y el Reto Demográfico. Orden TED/749/2020, de 16 de Julio, Por La Que Se Establecen Los Requisitos Técnicos Para La Conexión a La Red Necesarios Para La Implementación de Los Códigos de Red de Conexión. 2020. BOE-A-2020-8965. pp. 62406–62458. Available online: https://www.boe.es/eli/es/o/2020/07/16/ted749/con (accessed on 7 July 2022).
- VDE_AR_N_4110 Technical Requirements for the Connection and Operation of Customer Installations to the Medium Voltage Network (TAR Medium Voltage). November 2018. Available online: https://www.vde.com/en/fnn/topics/technical-connection-rules/tcr-for-medium-voltage (accessed on 7 July 2022).
- VDE-AR-N-4120 “Technical Requirements for the Connection and Operation of Customer Installations to the High Voltage Network (TAR High Voltage)”. November 2018. Available online: https://www.vde.com/en/fnn/topics/technical-connection-rules/tar-for-high-voltage (accessed on 7 July 2022).
- IPTO. “Integration of the Regulation EU 631/2016 into the Greek Regulatory Framework”, (Public Consultation Document). Available online: http://www.admie.gr/fileadmin/groups/ADMIE_DSAS/Integration_of_the_Regulation_EU_631-2016_into_the_Greek_Regulatory_Framework.pdf (accessed on 7 July 2022).
- Shamseh, M.B.; Inzunza, R.; Fukasawa, I.; Tanaka, T.; Ambo, T. Grid Support During Asymmetrical Faults Using Negative Sequence Current Injection. In Proceedings of the 2019 IEEE 4th International Future Energy Electronics Conference (IFEEC), Singapore, 25–28 November 2019; pp. 1–6. [Google Scholar]
- Haddadi, A.; Zhao, M.; Kocar, I.; Karaagac, U.; Chan, K.; Farantatos, E. Impact of Inverter-Based Resources on Negative Sequence Quantities-Based Protection Elements. IEEE Trans. Power Deliv. 2021, 36, 289–298. [Google Scholar] [CrossRef]
- Behnke, M.R.; Custer, G.; Farantatos, E.; Fischer, N.; Guttromson, R.; Isaacs, A.; Majumder, R.; Pant, S.; Patel, M.; Reddy-Konala, V.; et al. Impact of Inverter Based Resource Negative Sequence Current Injection on Transmission System Protection. 2020. Available online: https://www.osti.gov/biblio/1595917/ (accessed on 7 July 2022).
- Haddadi, A.; Kocar, I.; Mahseredjian, J.; Karaagac, U.; Farantatos, E. Negative Sequence Quantities-Based Protection under Inverter-Based Resources Challenges and Impact of the German Grid Code. Electr. Power Syst. Res. 2020, 188, 106573. [Google Scholar] [CrossRef]
- Liang, Y.; Li, W.; Lu, Z. Effect of Inverter-Interfaced Renewable Energy Power Plants on Negative-Sequence Directional Relays and a Solution. IEEE Trans. Power Deliv. 2021, 36, 554–565. [Google Scholar] [CrossRef]
- Adeosun, O.; Rahman, M.F.; Shoubaki, E.; Cecchi, V.; Manjrekar, M. Effect of Inverter-Interfaced Distributed Generation on Negative Sequence Directional Element Using Typhoon Real-Time Hardware in the Loop (HIL). In Proceedings of the 2021 IEEE Applied Power Electronics Conference and Exposition (APEC), Phoenix, AZ, USA, 14–17 June 2021; pp. 2097–2104. [Google Scholar]
- Sahoo, S.; Achlerkar, P.D.; Jena, M.K. Rethinking Grid Codes from Protection Perspective: A Case Study on Negative Sequence Directional Relay. In Proceedings of the 2021 IEEE 2nd International Conference on Smart Technologies for Power, Energy and Control (STPEC), Bilaspur, India, 19–22 December 2021; pp. 1–6. [Google Scholar]
- Kou, G.; Jordan, J.; Cockerham, B.; Patterson, R.; VanSant, P. Negative-Sequence Current Injection of Transmission Solar Farms. IEEE Trans. Power Deliv. 2020, 35, 2740–2743. [Google Scholar] [CrossRef]
- Castañón, A.; Cimadevilla, R.; Villén, M.T.; Carrasco, E.M. Impact of Renewable Energy Sources on the Protection of MV Distribution Networks. In Proceedings of the PAC World Conference 2022, Prague, Czech Republic, 20–23 June 2022. [Google Scholar]
- Ministerio para la Transición Ecológica y el Reto Demográfico. Real Decreto 647/2020, de 7 de Julio, Por El Que Se Regulan Aspectos Necesarios Para La Implementación de Los Códigos de Red de Conexión de Determinadas Instalaciones Eléctricas. 2020. BOE-A-2020-7439. pp. 48722–48757. Available online: https://www.boe.es/eli/es/rd/2020/07/07/647 (accessed on 7 July 2022).
- Hossain, M.E. Low Voltage Ride-through Capability Improvement Methods for DFIG Based Wind Farm. J. Electr. Syst. Inf. Technol. 2018, 5, 550–561. [Google Scholar] [CrossRef]
- Gonzalez-Longatt, F.; Rueda, J. PowerFactory Applications for Power System Analysis; Springer: Cham, Switzerland, 2015; ISBN 978-3-319-12958-7. [Google Scholar]
- Egea-Alvarez, A.; Fekriasl, S.; Hassan, F.; Gomis-Bellmunt, O. Advanced Vector Control for Voltage Source Converters Connected to Weak Grids. IEEE Trans. Power Syst. 2015, 30, 3072–3081. [Google Scholar] [CrossRef]
- López, D.; Andrino, R.; Martínez, E.; Pindado, L.; Borroy, S.; Popov, M.; Villén, M.; Orduñez, M.A.; Vaquero, J.; Grasse, H. Negative Sequence Current Injection by Power Electronics Based Generators and Its Impact on Faulted Phase Selection Algorithms of Distance Protection. In Proceedings of the Western Protective Relay Conference 2018, Spokane, WA, USA, 15–18 October 2018. [Google Scholar]
- Bellan, D. Clarke Transformation Solution of Asymmetrical Transients in Three-Phase Circuits. Energies 2020, 13, 5231. [Google Scholar] [CrossRef]
- Chattopadhyay, S.; Mitra, M.; Sengupta, S. Clarke and Park Transform. In Electric Power Quality. Power Systems; Springer: Dordrecht, The Netherlands, 2011. [Google Scholar] [CrossRef]
- Krause, P.C.; Wasynczuk, O.; Sudhoff, S.D.; Pekarek, S. Analysis of Electric Machinery and Drive Systems; Wiley-IEEE Press: Piscataway, NJ, USA, 2013; ISBN 978-1-118-52433-6. [Google Scholar]
- Martínez Carrasco, E.; Comech Moreno, M.P.; Villén Martínez, M.T.; Borroy Vicente, S. Improved Faulted Phase Selection Algorithm for Distance Protection under High Penetration of Renewable Energies. Energies 2020, 13, 558. [Google Scholar] [CrossRef]
- Norma Técnica de Supervisión de Generadores (NTS), Julio 2021. Available online: https://www.esios.ree.es/es/pagina/codigos-red-conexion (accessed on 7 July 2022).
Publisher’s Note: MDPI stays neutral with regard to jurisdictional claims in published maps and institutional affiliations. |
© 2022 by the authors. Licensee MDPI, Basel, Switzerland. This article is an open access article distributed under the terms and conditions of the Creative Commons Attribution (CC BY) license (https://creativecommons.org/licenses/by/4.0/).