
Carbon Intensity and Green Transition in the Chinese Manufacturing Industry


Abstract
:1. Introduction
2. Hypotheses
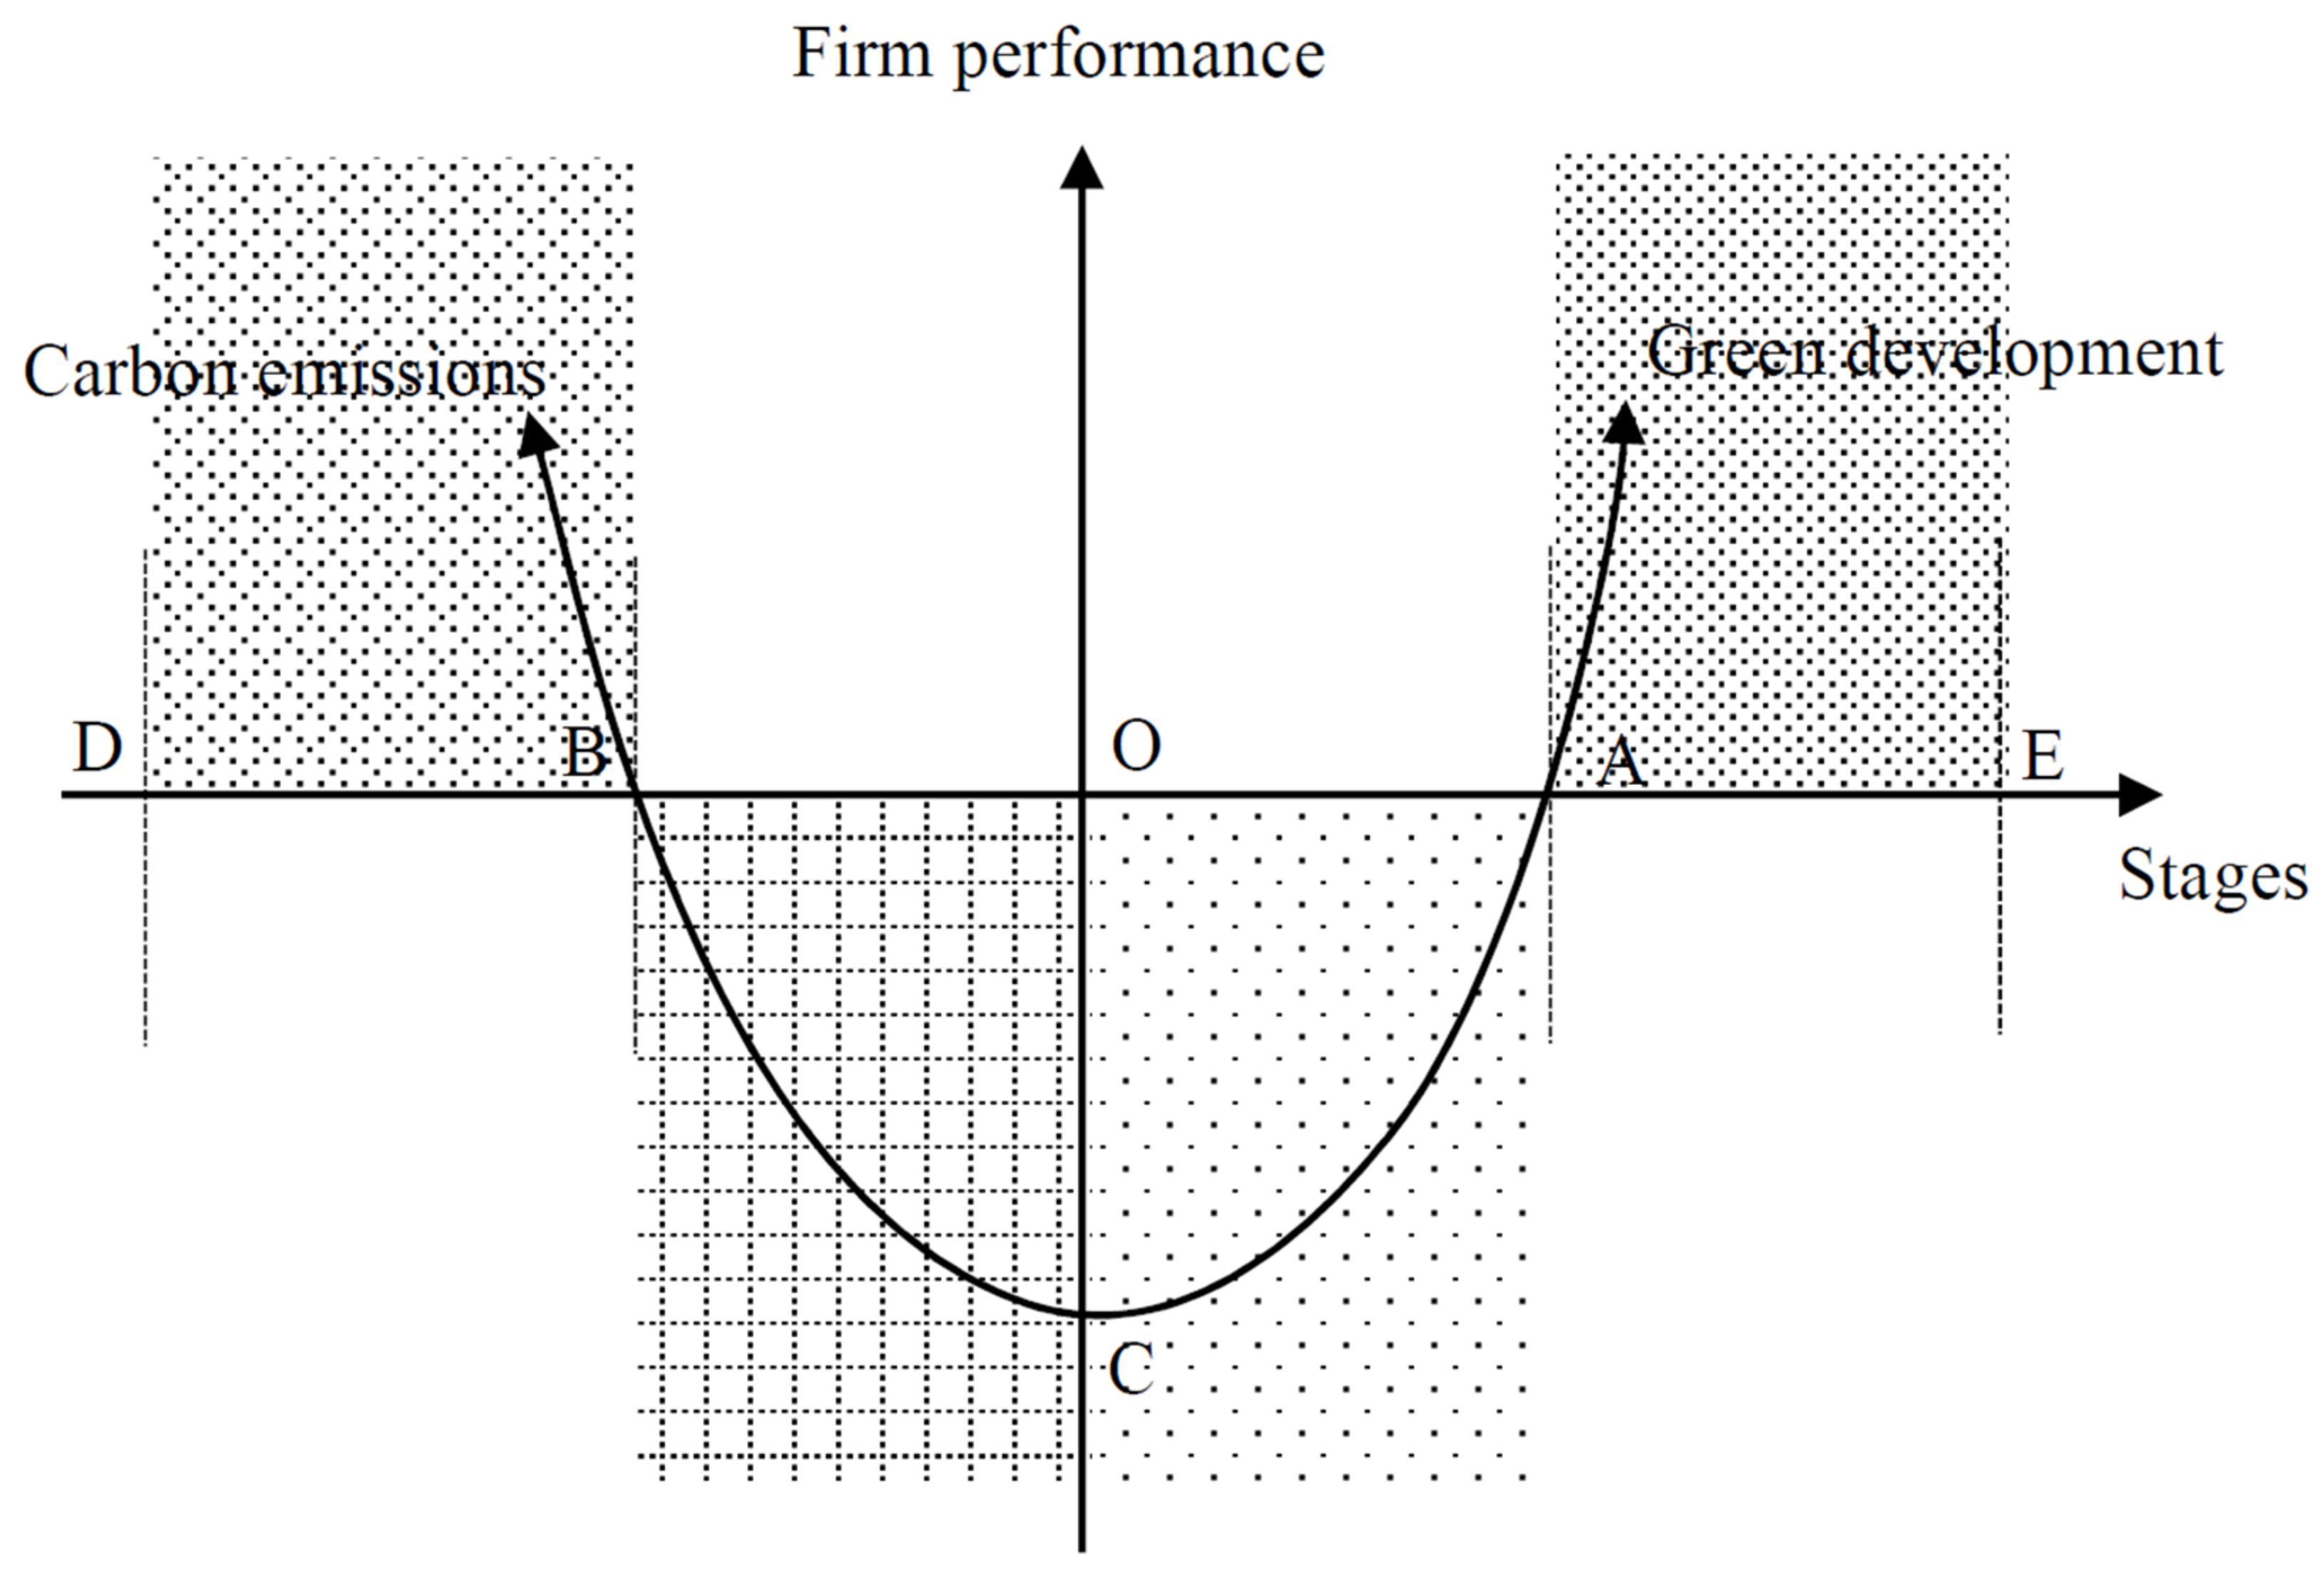
2.1. The Impact of Carbon Emissions on Green Transition
2.2. Provincial Heterogeneity
2.3. Intermediary Effect of Financial Performance
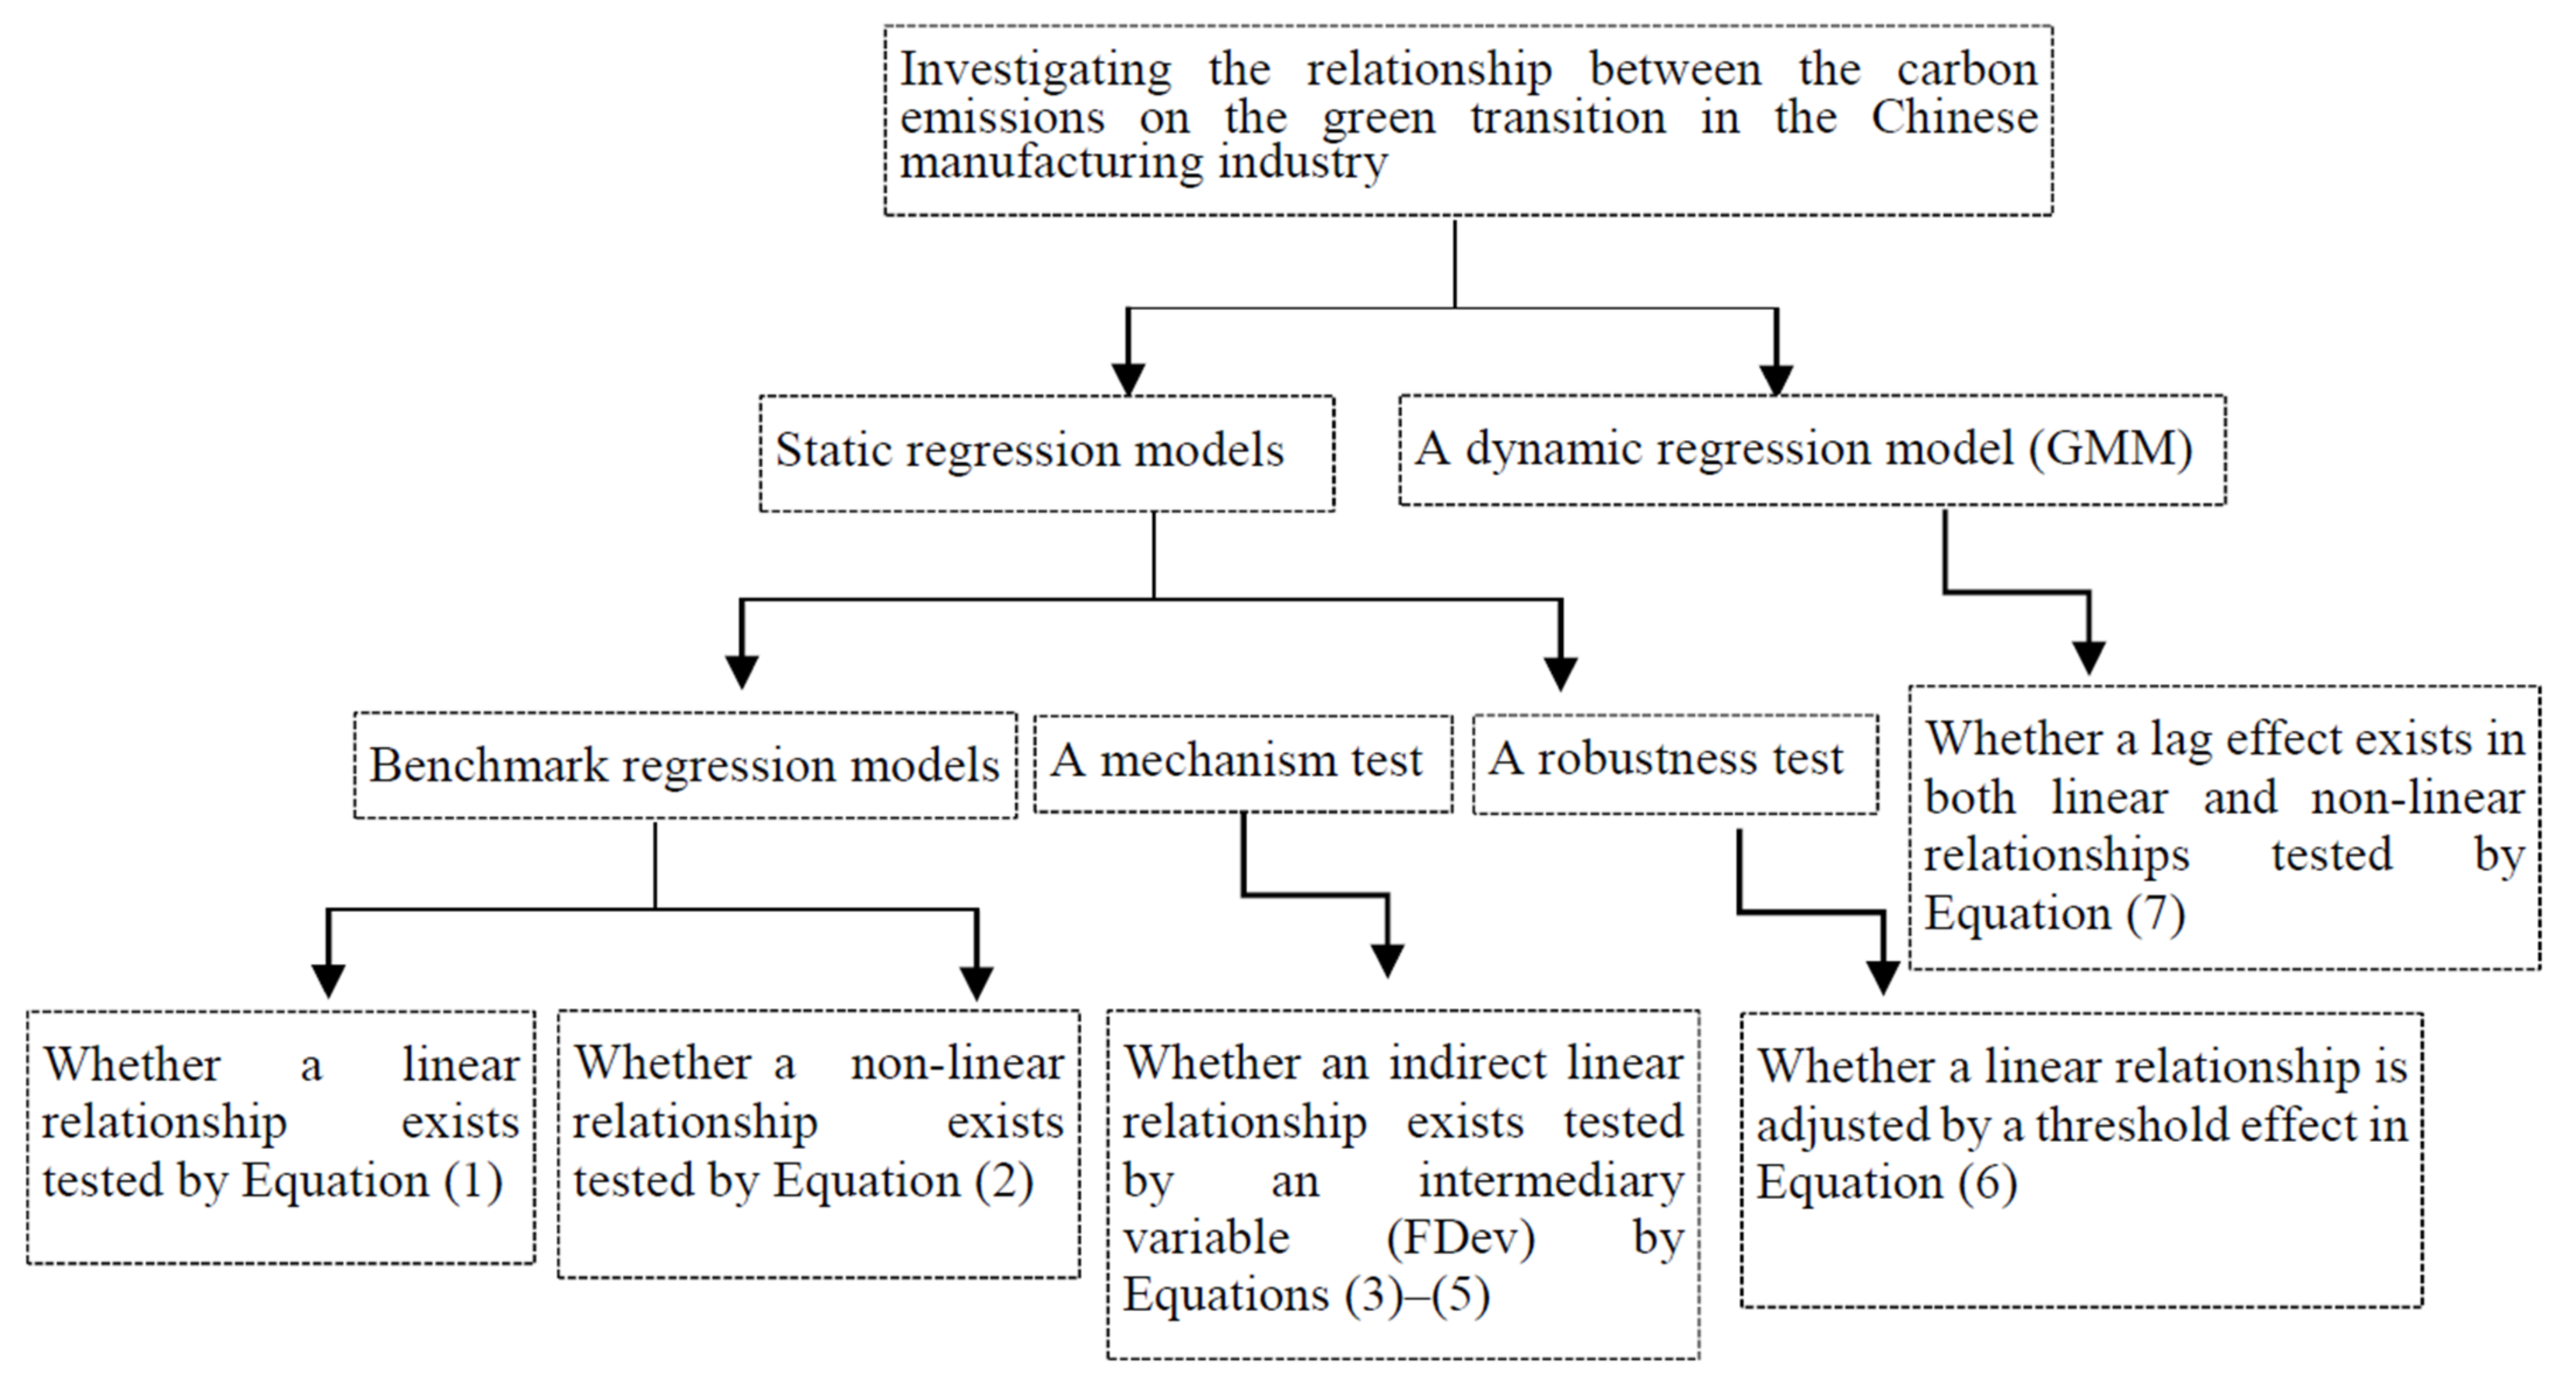
3. Research Design and Data
3.1. Regression Models
3.1.1. Benchmark Regression Models
3.1.2. Mechanism Test Models
3.1.3. Further Test of Threshold Effects
3.1.4. Dynamic Test
3.2. Variables
3.3. Data
4. Results and Analysis
4.1. Regression Results
4.1.1. Descriptive Analysis
4.1.2. Benchmark Regression Results
4.1.3. Provincial Heterogeneity
4.2. Mechanism Test Results
4.3. Dynamic Test Results
5. Discussion
6. Conclusions
Author Contributions
Funding
Institutional Review Board Statement
Informed Consent Statement
Data Availability Statement
Conflicts of Interest
References
- Elzen, M.D.; Fekete, H.; Höhne, N.; Admiraal, A.; Forsell, N.; Hof, A.F.; Oliver, J.G.; Roelfsema, M.; Soest, H. Greenhouse gas emissions from current and enhanced policies of China until 2030: Can emissions peak before 2030? Energ. Policy 2016, 89, 224–236. [Google Scholar] [CrossRef]
- Hu, C. Discussion on transition and development of China’s manufacturing sector during “The Twelfth Five Plan”—Evidence from the Chinese Top 500 firms. Rev. Econ. Rese. 2012, 24, 1–16. (In Chinese) [Google Scholar]
- Sun, D.; Liu, F.; Chen, Z. Chinese manufacturing industry transformation and upgrading and the new smiling curve theory. Sci. Technol. Prog. Policy 2017, 34, 49–54. (In Chinese) [Google Scholar]
- Zhang, M.Z.; Sun, T.; Li, J. Will the made in China 2025 carbon reduction target be achieved? J. Guangdong Uni. Financ. Econ. 2017, 32, 4–14. [Google Scholar]
- Zhang, J.H.; Cheng, F.P. Distribution of carbon emission reduction responsibilities for China’s manufacturing industry under the “dual carbon” target. China Popul. Resour. Environ. 2021, 31, 64–72. [Google Scholar]
- Cao, J.; Karplus, V.J. Firm-level determinants of energy and carbon intensity in China. Energ. Policy 2014, 75, 167–178. [Google Scholar] [CrossRef]
- Hou, J.; Teo, T.S.H.; Zhou, F.; Lim, M.K.; Chen, H. Does industrial green transformation successfully facilitate a decrease in carbon intensity in China? An environmental regulation perspective. J. Clean. Prod. 2018, 184, 1060–1071. [Google Scholar] [CrossRef]
- Lin, B.; Liu, K. How efficient is China’s heavy industry? A perspective of input-output analysis. Emerg. Mark. Financ. Trad. 2016, 52, 2546–2564. [Google Scholar] [CrossRef]
- Lee, M.; Zhang, N. Technical efficiency, shadow price of carbon dioxide emissions, and substitutability for energy in the Chinese manufacturing industries. Energy Econ. 2012, 34, 1492–1497. [Google Scholar] [CrossRef]
- Chang, N.; Lahr, M.L. Changes in China’s production-source CO2 emissions: Insights from structural decomposition analysis and linkage analysis. Econ. Syst. Res. 2016, 28, 224–242. [Google Scholar] [CrossRef]
- Chen, S.; Yan, F.; Wu, R. Capital deepening, productivity promotion and CO2 emission in China. Financ. Trade Econ. 2010, 12, 111–119. [Google Scholar]
- Zhao, X.; Zhang, X.; Shao, S. Decoupling CO2 emissions and industrial growth in China over 1993–2013: The role of investment. Energy Econ. 2016, 60, 275–292. [Google Scholar] [CrossRef]
- Huw, M.K. China as a global manufacturing powerhouse: Strategic considerations and structural adjustment. China World Econ. 2010, 18, 1–32. [Google Scholar]
- Chambers, R.G.; Chung, Y.; Färe, R. Profit, directional distance functions, and nerlovian efficiency. J. Optimiz. Theory Appl. 1998, 2, 351–364. [Google Scholar] [CrossRef]
- Lu, Q.; Wu, Q.; Zhou, Y.; Zhou, H. Analysis on the assessment of greenery transformation-upgrading of industry in Guangdong. China Popul. Resour. Envir. 2013, 7, 34–41. (In Chinese) [Google Scholar]
- Ghazilla, R.A.R.; Sakundarini, N.; Abdul-Rashid, S.H.; Ayub, N.S.; Olugu, E.U.; Musa, S.N. Drivers and barriers analysis for green manufacturing practices in Malaysian SMEs: A preliminary finding. Procedia Cirp. 2015, 26, 658–663. [Google Scholar] [CrossRef]
- Gandhi, N.S.; Thanki, S.J.; Thakkar, J.J. Ranking of drivers for integrated lean-green manufacturing for Indian manufacturing SMEs. J. Clean. Product. 2018, 171, 675–689. [Google Scholar] [CrossRef]
- IMF. Vulnerability, Legacies, and Policy Challenges: Risks Rotating to Emerging Markets; IMF: Washington, DC, USA, 2015; pp. 119–120. [Google Scholar]
- Cheng, Z.; Li, W. Independent R&D, technology introduction, and green growth in China’s manufacturing. Sustainability 2018, 10, 311. [Google Scholar]
- Dou, J. Developing countries’ source from comparative advantage to competitive advantage—Creation and technology. Sci. Manag. Res. 2008, 5, 13–16. (In Chinese) [Google Scholar]
- Poon, T.S.-C. Beyond the global production networks: A case of further upgrading of Taiwan’s information technology industry. Intl. J. Technol. Globali. 2004, 1, 130–144. [Google Scholar] [CrossRef]
- Ren, S.; Li, B. Research on the influence of Emission right trading on corporate labor demands and its path: A quasi-natural experiment test based on China carbon emission right trading experiment. West Forum 2019, 29, 101–113. (In Chinese) [Google Scholar]
- Yi, M.; Fang, X.; Wen, L.; Guang, F.; Zhang, Y. The heterogeneous effects of different environmental policy instruments on green technology innovation. Int. J. Environ. Res. Public Health 2019, 16, 4660. [Google Scholar] [CrossRef]
- Yuan, Y.; Xie, R. Research on industrial structure adjustment effect of environmental regulation—Empirical test based on panel data of Chinese provinces. China Ind. Econ. 2014, 8, 57–69. [Google Scholar]
- Pan, X.Y.; Pan, X.F.; Wu, X.; Jiang, L.; Guo, S.; Feng, X. Research on the heterogeneous impact of carbon emission reduction policy on R&D investment intensity: From the perspective of enterprise’s ownership structure. J. Clean. Prod. 2021, 328, 129532. [Google Scholar]
- Qin, C.; Wang, J.; Ge, C.; Su, J. Simulating the cost-effectiveness of China’s green transition based on emission reduction targets during the 12th Five-year Plan period. J. Clean. Prod. 2019, 208, 19–34. [Google Scholar] [CrossRef]
- Zhang, L.; Ma, L. The relationship between industrial structure and carbon intensity at different stages of economic development: An analysis based on a dynamic threshold panel model. Environ. Sci. Pollut. Res. 2020, 27, 33321–33338. [Google Scholar] [CrossRef]
- Sun, H. What are the roles of green technology innovation and ICT employment in lowering carbon intensity in China? A city-level analysis of the spatial effects. Resour. Conserv. Recycl. 2022, 186, 106550. [Google Scholar] [CrossRef]
- Jiao, J.; Chen, C.; Bai, Y. Is green technology vertical spillovers more significant in mitigating carbon intensity? Evidence from Chinese industries. J. Clean. Prod. 2020, 257, 120354. [Google Scholar] [CrossRef]
- Zhang, K.; Li, Y.; Qi, Y.; Shao, S. Can green credit policy improve environmental quality? Evidence from China. J. Environ. Manag. 2021, 298, 113445. [Google Scholar] [CrossRef]
- Li, X.P.; Wang, Y. A study on the convergence of carbon productivity in the major countries of the One Road One Belt and the analysis of its influencing factors. Wuhan Uni. J. 2017, 70, 58–76. (In Chinese) [Google Scholar]
- Xu, G.Y.; Song, D.Y. An empirical study on the environmental Kuznets curve for China’s carbon emissions: Based on provincial panel data. Chin. J. Popul. Resour. Environ. 2011, 9, 66–76. (In Chinese) [Google Scholar]
- Cai, L.; Firdousi, S.F.; Li, C.; Luo, Y. Inward foreign direct investment, outward foreign direct investment, and carbon dioxide emission intensity-threshold regression analysis based on interprovincial panel data. Environ. Sci. Pollut. Res. 2021, 28, 46147–46160. [Google Scholar] [CrossRef] [PubMed]
- Ang, B.W.; Pandiyan, G. Decomposition of energy CO2 emissions in manufacturing. Energy Eco. 1997, 17, 363–374. [Google Scholar] [CrossRef]
- Lin, B.Q.; Du, K.R. Exploring the momentum of the energy productivity growth in China—Based on distance functions. Financ. Res. 2013, 9, 84–96. (In Chinese) [Google Scholar]
- Fu, H.; Li, G.P.; Zhu, T. Carbon emissions of China’s manufacturing industry: Industry differences and decomposition of driving factors. Reform 2021, 5, 38–52. [Google Scholar]
- Wang, Q.W.; Hang, Y.; Su, B.; Zhou, P. Contributions to sector-level carbon intensity change: An integrated decomposition analysis. Energy Econ. 2018, 70, 12–25. [Google Scholar] [CrossRef]
- Fu, Y.; Ye, X.; Wang, Z. Structure changes in the manufacturing industry and efficiency improvement in economic growth. Econ. Res. J. 2016, 8, 86–100. [Google Scholar]
- Mijiyawa, A.G. Drivers of structural transformation: The case of the manufacturing sector in Africa. World Develop. 2017, 99, 141–159. [Google Scholar] [CrossRef]
- Apergis, N.; Ozturk, I. Testing environmental kuznets curve hypothesis in Asian countries. Ecol. Indic. 2015, 52, 16–22. [Google Scholar] [CrossRef]
- He, J. Research on the manufacturing transition and upgrading of Zhejiang province in the green finance context. Mode. Econ. Info. 2020, 31, 196–198. (In Chinese) [Google Scholar]
- Luo, J. How Does the servitization transformation of manufacturing industry promote the employment in sevice industry. J. Shanxi Financ. Econ. Uni. 2020, 42, 58–69. (In Chinese) [Google Scholar]
- Arellano, M.; Bond, S. Some tests of specification for panel data: Minte Carlo evidence and an application to employment equations. Rev. Econ. Stud. 1991, 58, 277–297. [Google Scholar] [CrossRef]
- Blundell, R.; Bond, S.R. Initial conditions and moment restrictions in dynamic panel data models. J. Econ. 1998, 87, 115–143. [Google Scholar] [CrossRef]
- Wu, C.; Fu, G.; Lv, X.; Lu, X. Research on spatial relationship pattern evolution of provincial green transition capacity in China. Sci. Technol. Manag. 2018, 20, 1–7. (In Chinese) [Google Scholar]
- Zou, Z.H.; Yi, Y.; Sun, J.N. Entropy method for determination of weight of evaluating indicators in fuzzy synthetic evaluation for water quality assessment. Envir. Sci. 2006, 18, 1020–1023. [Google Scholar] [CrossRef]
- Wang, Q.; Zhou, D.; Zhou, P. Regional difference of the total factor carbon emission performance in China. Fin. Trade Econ. 2010, 9, 112–117. (In Chinese) [Google Scholar]
- Tang, X.H.; Liu, X.F. Energy intensity and industrial structure optimization of China’s manufacturing industry. China Popul. Resour. Envir. 2016, 26, 78–85. [Google Scholar]
- Lu, F.; Yang, H. Industrial co-agglomeration and environmental pollution control: Impetus or resistance. J. Guangdong Uni. Financ. Econ. 2020, 35, 16–29. (In Chinese) [Google Scholar]
- Zhang, Q.; Li, L. Transformation and upgrading of manufacturing industry and regional economic growth. Res. Econ. Manag. 2017, 38, 97–111. (In Chinese) [Google Scholar]
- Porter, M.E.; Linde, C.V.D. Green and comparative: Ending the stalemate. Harvard Bus. Rev. 1995, 73, 120–134. [Google Scholar]
- Lin, B.Q.; Jiang, Z.J. A forecast for China’s environmental Kuznets Curve for CO2 emission, and an analysis of the factors affecting China’s CO2 Emission. Manag. World. 2009, 4, 27–36. (In Chinese) [Google Scholar]
- Li, J.; Qu, T.; Chen, Y.S.; Li, J.W. On the path and mechanism of manufacturing transformation and upgrading driven by servicing: Empirical study based on the manufacturing industry in Foshan from 2010 to 2018. J. Guangdong Uni. Fin. Econ. 2022, 37, 75–86. (In Chinese) [Google Scholar]
- Xi, M.M.; Li, X.; He, B.L. Does financial inclusion improve the manufacturing employment rate? An empirical study based on the county-level panel data. Secur. Mark. Herald. 2021, 3, 13–22. (In Chinese) [Google Scholar]
- Li, Y.M.; Zhang, L.; Chen, X.L. A decomposition model and reduction approaches for carbon dioxide emissions in China. Res. Sci. 2010, 32, 218–222. (In Chinese) [Google Scholar]


| Dependent Variable | First Level | Second Level |
|---|---|---|
| Green upgrading | Manufacturing performance | Gross production in manufacturing sector |
| Rate of total assets to employees in manufacturing sector | ||
| Fiscal revenue per capita on average | ||
| Manufacturing ecosystem | Gross production per volume of waste water discharge | |
| Gross production per volume of solid waste discharge | ||
| The green patient rate | ||
| Green sustainability | The rate of R&D employees to total employees in manufacturing sector | |
| The rate of R&D expenditure to total fiscal expenditure | ||
| The rate of the government expenditure to the national GDP |
| Variable | Obs | Mean | Std. | Min | Max |
|---|---|---|---|---|---|
| upgrading | 360 | 3266.235 | 3134.759 | 442.836 | 17,674.750 |
| CE | 360 | 2.710 | 1.626 | 0.792 | 9.340 |
| FDI | 360 | 0.023 | 0.020 | 0.000 | 0.108 |
| AIS | 360 | 1.098 | 0.615 | 0.519 | 4.165 |
| EI | 360 | 0.415 | 0.151 | 0.073 | 0.689 |
| urban | 360 | 0.559 | 0.130 | 0.336 | 0.893 |
| Gfin | 360 | 0.169 | 0.099 | 0.060 | 0.692 |
| PG | 360 | 0.014 | 0.007 | 0.004 | 0.038 |
| TL | 360 | 0.376 | 0.088 | 0.120 | 0.526 |
| Ileve | 360 | 0.752 | 0.243 | 0.237 | 1.371 |
| IL | 360 | 8.461 | 10.492 | 0.445 | 49.262 |
| market | 360 | 0.335 | 0.231 | 0.035 | 2.093 |
| FDev | 360 | 0.061 | 0.031 | 0.014 | 0.185 |
| Variables | (1) | (2) | (3) | (4) | (5) | (6) | (7) |
|---|---|---|---|---|---|---|---|
| OLS | GLS | FE | Eastern | Central | Western | ||
| Upgrading | Upgrading | Upgrading | Upgrading | Upgrading | Upgrading | ||
| CE | −0.255 *** | −0.308 *** | −0.152 ** | −0.145 * | 0.389 | −0.524 *** | −0.163 ** |
| (−10.989) | (−3.826) | (−2.399) | (−1.790) | (1.495) | (−3.480) | (−2.191) | |
| CE2 | 0.032 *** | 0.011 ** | 0.014 ** | −0.031 | 0.050 ** | 0.017 ** | |
| (3.933) | (2.269) | (2.167) | (−1.259) | (2.224) | (2.484) | ||
| FDI | 1.905 | 3.110 *** | 3.160 *** | −0.554 | −1.143 | 21.827 *** | |
| (1.193) | (3.300) | (2.699) | (−0.267) | (−0.327) | (4.263) | ||
| AIS | −1.042 *** | −0.043 | −0.078 | 0.215 | −0.246 | −0.788 ** | |
| (−5.849) | (−0.512) | (−0.747) | (0.988) | (−1.394) | (−2.029) | ||
| EI | 1.054 *** | −0.307 | −0.153 | −0.380 | 1.274 *** | −0.236 | |
| (4.501) | (−1.306) | (−0.521) | (−0.413) | (4.735) | (−0.726) | ||
| Gfin | 8.157 *** | −1.380 ** | −0.778 | 1.064 | 4.000 ** | 3.552 | |
| (8.094) | (−2.419) | (−1.061) | (0.856) | (2.199) | (1.399) | ||
| PG | −15.260 *** | 0.420 | −0.546 | 6.257 | −14.539 *** | −3.913 | |
| (−2.839) | (0.192) | (−0.205) | (1.233) | (−2.869) | (−0.642) | ||
| TL | −1.817 * | 1.302 *** | 1.040 ** | −0.740 | 2.220 *** | −3.492 ** | |
| (−1.947) | (3.201) | (2.060) | (−0.716) | (2.778) | (−2.209) | ||
| Ileve | 0.511 *** | 0.391 *** | 0.459 *** | 1.345 *** | 0.271 | −1.050 *** | |
| (3.162) | (4.706) | (4.458) | (5.581) | (1.459) | (−3.975) | ||
| IL | 0.007 | 0.003 | 0.000 | −0.003 | 0.014 | 0.012 | |
| (1.195) | (1.004) | (0.175) | (−0.591) | (0.874) | (0.576) | ||
| _cons | 8.433 *** | 7.994 *** | 6.787 *** | 7.471 *** | 6.700 *** | 6.882 *** | 9.841 *** |
| (114.843) | (14.624) | (24.441) | (21.495) | (7.874) | (12.361) | (10.148) | |
| Year | Yes | Yes | Yes | Yes | Yes | ||
| Province | Yes | Yes | Yes | Yes | Yes | ||
| F values | 186.810 | 7.900 | |||||
| N | 360 | 360 | 360 | 360 | 144 | 108 | 108 |
| R2 | 0.252 | 0.587 | 0.968 | 0.951 | 0.928 | 0.913 | 0.847 |
| (1) | (2) | (3) | (4) | (5) | (6) | |
|---|---|---|---|---|---|---|
| FE Upgrading | FDev | Upgrading | GMM Upgrading | FDev | Upgrading | |
| CE | −0.547 *** | −0.009 *** | −0.630 *** | −0.087 *** | −0.006 *** | −0.095 *** |
| (−8.540) | (−3.511) | (−10.376) | (−3.121) | (3.556) | (9.787) | |
| CE2 | 0.047 *** | 0.001 *** | 0.056 *** | 0.010 *** | 0.001 *** | 0.011 *** |
| (7.421) | (3.978) | (9.331) | (3.863) | |||
| FDev | −9.498 *** | −1.093 * | ||||
| (−7.280) | (−1.812) | |||||
| upgrading−1 | 0.939 *** | −0.005 *** | 0.934 *** | |||
| (52.113) | (−9.003) | (51.181) | ||||
| FDI | 4.182 *** | 0.011 | 4.283 *** | 0.040 | 0.020 | 0.053 |
| (3.387) | (0.222) | (3.726) | (0.074) | (1.264) | (0.099) | |
| AIS | −0.739 *** | 0.023 *** | −0.521 *** | −0.110 * | 0.010 *** | −0.098 |
| (−5.267) | (4.223) | (−3.885) | (−1.727) | (5.368) | (−1.525) | |
| EI | 0.937 *** | 0.025 *** | 1.175 *** | 0.120 | 0.047 *** | 0.158 * |
| (5.189) | (3.571) | (6.859) | (1.396) | (17.630) | (1.787) | |
| Gfin | 5.083 *** | 0.029 | 5.355 *** | 0.693 * | 0.100 *** | 0.805 ** |
| (6.307) | (0.917) | (7.128) | (1.951) | (9.538) | (2.238) | |
| PG | −2.590 | 0.403 ** | 1.239 | 0.041 | 0.150 *** | 0.207 |
| (−0.604) | (2.424) | (0.308) | (0.023) | (2.880) | (0.116) | |
| TL | 0.171 | −0.023 | −0.042 | −0.351 | −0.088 *** | −0.434 |
| (0.228) | (−0.773) | (−0.061) | (−1.068) | (−8.928) | (−1.312) | |
| Ileve | −0.575 *** | −0.007 | −0.641 *** | 0.015 | 0.007 *** | 0.023 |
| (−3.908) | (−1.226) | (−4.673) | (0.266) | (3.999) | (0.414) | |
| IL | −0.015 *** | 0.001 *** | −0.008 * | −0.004 * | 0.001 *** | −0.003 |
| (−2.905) | (3.445) | (−1.726) | (−1.951) | (18.414) | (−1.418) | |
| _cons | 8.753 *** | 0.037 ** | 9.107 *** | 0.826 *** | 0.079 *** | 0.915 *** |
| (19.840) | (2.173) | (22.018) | (3.319) | (10.266) | (3.615) | |
| N | 360 | 360 | 360 | 330 | 330 | 330 |
| AR(1) | 0.000 | 0.000 | 0.000 | |||
| AR(2) | 0.130 | 0.165 | 0.135 | |||
| Sargan | 0.181 | 0.000 | 0.183 |
| Variables | Single Threshold Model | |
|---|---|---|
| Statistic Values | F Values | |
| Urbanization | I = 0.580 | 57.790 *** (0.004) |
| Marketization | I = 0.321 | 50.080 *** (0.002) |
| Variables | (1) | (2) |
|---|---|---|
| Upgrading | Upgrading | |
| CE(I ≤ λ) | 0.157 * | 0.265 *** |
| (1.902) | (3.200) | |
| CE(I > λ) | 0.245 *** | 0.336 *** |
| (2.974) | (3.974) | |
| CE2 | −0.005 | −0.017 ** |
| (−0.674) | (−2.386) | |
| FDI | 1.442 | 1.523 |
| (1.083) | (1.140) | |
| AIS | −0.002 | 0.092 |
| (−0.020) | (0.809) | |
| EI | −1.898 *** | −1.527 *** |
| (−6.443) | (−5.104) | |
| Gfin | 3.302 *** | 3.109 *** |
| (4.558) | (4.271) | |
| PG | −1.725 | −1.070 |
| (−0.581) | (−0.359) | |
| TL | −0.017 | 0.109 |
| (−0.032) | (0.204) | |
| Ileve | 0.814 *** | 0.740 *** |
| (7.455) | (6.860) | |
| IL | −0.005 | −0.004 |
| (−1.162) | (−0.847) | |
| _cons | 6.957 *** | 6.546 *** |
| (19.800) | (18.418) | |
| N | 360 | 360 |
| R2 | 0.738 | 0.736 |
| Variables | (1) | (2) | (3) | (4) | (5) |
|---|---|---|---|---|---|
| FE | GLS | DGMM | SGMM | ||
| Upgrading | Upgrading | Upgrading | Upgrading | Upgrading | |
| CE | −0.145 * | −0.126 * | −0.125 ** | −0.299 * | −0.087 *** |
| (−1.790) | (−1.941) | (−2.116) | (−1.778) | (−3.121) | |
| CE2 | 0.014 ** | 0.014 *** | 0.012 ** | 0.032 * | 0.010 *** |
| (2.167) | (2.656) | (2.526) | (1.941) | (3.556) | |
| upgradingt−1 | 0.862 *** | 0.652 *** | 0.835 *** | 0.939 *** | |
| (19.775) | (10.811) | (7.673) | (52.113) | ||
| FDI | 3.160 *** | 1.254 | 1.375 | 2.961 | 0.040 |
| (2.699) | (1.255) | (1.554) | (1.058) | (0.074) | |
| AIS | −0.078 | −0.032 | 0.016 | −0.027 | −0.110 * |
| (−0.747) | (−0.372) | (0.209) | (−0.146) | (−1.727) | |
| EI | −0.153 | −0.150 | −0.012 | −0.556 | 0.120 |
| (−0.521) | (−0.645) | (−0.054) | (−1.558) | (1.396) | |
| Gfin | −0.778 | 0.632 | −0.306 | 1.246 | 0.693 * |
| (−1.061) | (1.156) | (−0.577) | (1.018) | (1.951) | |
| PG | −0.546 | 0.797 | 0.339 | 4.757 * | 0.041 |
| (−0.205) | (0.364) | (0.171) | (1.985) | (0.023) | |
| TL | 1.040 ** | −0.230 | 0.382 | −0.125 | −0.351 |
| (2.060) | (−0.559) | (0.983) | (−0.123) | (−1.068) | |
| Ileve | 0.459 *** | −0.003 | 0.146 * | −0.141 | 0.015 |
| (4.458) | (−0.039) | (1.858) | (−0.711) | (0.266) | |
| IL | 0.001 | −0.002 | 0.000 | −0.004 | −0.004 * |
| (0.175) | (−0.612) | (0.129) | (−0.637) | (−1.951) | |
| _cons | 7.471 *** | 1.424 *** | 2.544 *** | 0.826 *** | |
| (21.495) | (3.481) | (5.090) | (3.319) | ||
| Year | Yes | Yes | Yes | ||
| Province | YES | Yes | Yes | ||
| F value | 7.900 | 145.320 | 227.190 | ||
| AR (1) | 0.046 | 0.000 | |||
| AR (2) | 0.230 | 0.130 | |||
| Sargan | − | 0.181 | |||
| Hansen test | 1.000 | − | |||
| N | 360 | 330 | 330 | 300 | 330 |
| R2 | 0.951 | 0.966 | 0.976 | ||
Publisher’s Note: MDPI stays neutral with regard to jurisdictional claims in published maps and institutional affiliations. |
© 2022 by the authors. Licensee MDPI, Basel, Switzerland. This article is an open access article distributed under the terms and conditions of the Creative Commons Attribution (CC BY) license (https://creativecommons.org/licenses/by/4.0/).
Share and Cite
Peng, C.; Guo, X.; Long, H. Carbon Intensity and Green Transition in the Chinese Manufacturing Industry. Energies 2022, 15, 6012. https://doi.org/10.3390/en15166012
Peng C, Guo X, Long H. Carbon Intensity and Green Transition in the Chinese Manufacturing Industry. Energies. 2022; 15(16):6012. https://doi.org/10.3390/en15166012
Chicago/Turabian StylePeng, Cheng, Xiaolin Guo, and Hai Long. 2022. "Carbon Intensity and Green Transition in the Chinese Manufacturing Industry" Energies 15, no. 16: 6012. https://doi.org/10.3390/en15166012
APA StylePeng, C., Guo, X., & Long, H. (2022). Carbon Intensity and Green Transition in the Chinese Manufacturing Industry. Energies, 15(16), 6012. https://doi.org/10.3390/en15166012