1. Introduction
Among the main causes of global pollution, the transport sector plays a primary role, causing more than a quarter of CO
2eq emissions. All types of transport, with different proportions, cause emissions and, among them, rail vehicles have the highest emissions/consumption ratio (measured in kgCO
2eq/kWh). According to 2015 data, rail transport is responsible for more than 1% of CO
2eq emissions but consumes less than 0.5% of global energy [
1]. Even though electricity is the primary energy source for approximately 40% of the lines, less than 10% of the energy used for traction is derived from renewable sources, while more than 85% is derived from fossil fuels. In Europe, which accounts for 8% of global CO
2eq emissions, the situation is partially improved; the emissions/consumption ratio is lower than the global value. Considering the EU’s total energy demand, the railway sector needs just over 0.5% of energy, causing about 0.8% of European CO
2eq emissions. The reason for these results lies in the greater diffusion of electrified lines, which reaches about 60%, and, above all, from the reduced use of fossil fuels (61.2%) and the consequent diffusion of renewable energy (20.7%) and nuclear energy (18.1%). In the national context, on the other hand, Italy appears to be a virtuous country, reaching, together with Korea, the highest worldwide percentage of diffusion of electrified lines, with a value of around 80% [
1]. However, these electrified lines are not evenly distributed across the territory, and the percentages vary significantly region by region, ranging from about 95% electrified lines in Liguria and Umbria to 0% in Sardinia and Val d’Aosta. In the Calabrian area, the prevalence of electrified lines is among the lowest, with an overall value of 60%, well below the national average [
2]. In addition, it should be underlined that, during normal operating phases, trains are a source not only of direct emissions, caused primarily by diesel engines, but also indirect emissions, caused by traditional electric vehicles and the use of fossil fuels in the production of electrified lines. In the analysis of the emissions of traditional electric vehicles, the impact caused by the construction of the necessary infrastructure for rail traction cannot be ignored, since it produces, on average, approximately 85 tons of CO
2eq/km, as highlighted in the case studies that analyzed the Spanish railway system [
3] and the San Francisco–Anaheim line [
4].
However, global projections by 2050 foresee a marked increase in energy demand for the railway sector of around 72%, from 53 Mtoe (million tons of oil equivalent) in 2017 to 90 Mtoe by 2050, with a slight increase in polluting emissions, of 24%, going from 0.25 GtonCO
2eq in 2017 to about 0.32 GtonCO
2eq by 2050. The European projections are significantly more optimistic, as they predict an increase in energy demand of 42%, which is lower compared to the world case, going from 7 Mtoe in 2017 to 10 Mtoe by 2050, but with a reduction in emissions of over 50%, from 26 MtonCO
2eq in 2017 to approximately 12.5 MtonCO
2eq by 2050 [
5].
It is only possible to achieve the goals outlined in these optimistic scenarios, such as the European one, if the railway industry approaches them with innovative and sustainable actions. In order to reduce environmental impact and improve the performance of railway vehicles, various innovative powertrains with onboard energy sources useful for replacing and/or supplementing conventional propulsion systems are analyzed in both the academic and industrial sectors.
At the same time, a technical–economic analysis is crucial for establishing the potential advantages of using innovative powertrains. In [
6], for example, two non-electrified railway lines (one in Norway and the other in the USA) were analyzed to evaluate potential electrification or the use of battery, hydrogen, or fuel cell–battery hybrid powertrains. The Norwegian route, between Trondheim and Bodø, was about 750 km, while the American one, from Kansas City to Los Angeles, was almost 3000 km long. The trains ware sized to obtain the performance required for each configuration; therefore, the weight varied according to the powertrain, with consequent variations in the transportable load and in the annual journeys performed. In terms of performance analysis, several works can be found in literature, both for fuel-cell- and battery-based powertrains.
Regarding the battery-based train, when the storage system is the main component and the power line is not available, the battery is used to supply the needed amount of energy. For these applications, numerical methods are used for the propulsion system sizing, such as the one developed by Alfieri et al. in [
7], based on optimization methods. In the mentioned paper, three vehicles were tested, not connected to the catenary, with different characteristics based on the considered application, namely passenger train, urban metro, and tram, with a weight of 300 t, 82 t, and 36 t, respectively. Thanks to the resulting energy consumption, the propulsion system was sized using 95 Wh/kg and 4 kW/kg battery modules: the passenger train resulted to consume 86 kWh and to require a battery with a total weight of approximately 950 kg, and the urban metro resulted to consume 22.5 kWh with a 205 kg battery, while approximately 7 kWh were needed for the tram, with a 60 kg battery. Finally, the contribution of regenerative braking was analyzed, which involves a 22% reduction in energy consumption for the passenger train, while only 12% in the other two cases, as it is possible to recover only 50% of the energy in deceleration.
As can be deduced, in sizing powertrain components, the use of numerical simulation could be essential to calculate beforehand the pros and cons of the introduction of storage systems and is still of great interest given the highly innovative nature of this technology and the numerous parameters that can be suitably set to obtain performance improvements. For instance, in [
8], the use of a battery-powered vehicle (battery electric multiple units—BEMU) was numerically tested in the Matlab environment to replace a diesel engine on a 12 km city track, from Ubungo Maziwa at the central station (Dar es Salaam, Tanzania); a 70 ton-train was used, for six complete daily journeys (round trip). The battery pack was composed of a stack of Altairnano 24 V modules, with an overall electrical performance of 384 V and 120 Ah and a total weight of about 900 kg; the pack was sized and connected to the inverter through a bidirectional DC/DC converter, to allow the charging and discharging phases. With the introduction of the battery-powered vehicle, the obtained results showed savings in terms of fuel costs of 87% and in terms of CO
2 emissions of 65%, compared to the case with a diesel engine.
Parallel to the numerical modeling, experimental tests allow comprehensive model validation and they represent the last step before prototyping and subsequent marketing. Among the representative studies that deal with numerical and experimental simulations, in [
9], a battery-powered train development for a non-electrified line connecting Manchester and York (Great Britain) was numerically analyzed. The train weighed 276 tons, the route was about 210 km long, and about 3 MWh were required for a full cycle. Particular attention was paid to the analysis of the C-rate to study the behavior of different types of batteries. Toshiba’s 5 MWh lithium–titanium battery pack, which was tested numerically and experimentally but in scale, taking into account only a battery module with one-fifth of the required energy capacity, was selected. Maximum power during the discharge and charge phases was 900 kW and 1500 kW, respectively, and the final state of charge was greater than 56%.
A method for optimizing the speed profile of a Li-ion battery train without an overhead line is presented in [
10]. The used train was a four-car Bombardier that was modified with the addition of a 550 Ah battery pack and weighed 185 tons. The model was evaluated using experimental data obtained from 18 km-long rail tests conducted between the stations of Manningtree and Wrabness (Great Britain). With the application of the optimization method, it was possible to achieve savings of less than 1% on the analyzed short section, but over 30% on standard train routes. Given the importance of the battery energy system in such vehicles, the performance of electric batteries under constrained operation has been assessed using a variety of complex models developed in the literature. To ensure secure and effective charging, Wei et al. [
11] created a Deep-Reinforcement-Learning (DRL)-based optimization model. The authors of [
12] suggested a unique method for observing and assessing the thermal characteristics of lithium-ion battery power systems. Hu et al. [
13] used an optimization technique for the same systems to find sensor faults.
The East Japan Railway Company introduced a hybrid electric–battery line train in [
14] to reduce emissions from diesel powertrains on line segments without electrical infrastructure. In areas where there is no power grid, the battery pack is the only source of propulsion, while it provides auxiliary power in areas where the power grid is predominant. The 40-ton, 19-m-long train was equipped with a 9-unit lithium-ion battery system with a total capacity of 72 kWh. The battery packs were positioned beneath the seats so as to not reduce the amount of space available to passengers. In addition, approximately 10 kWh of energy was recovered during regenerative braking as a result of the introduction of batteries, which reduced the voltage fluctuations of the power line.
Contrary to what happens for the design of battery-based powertrains, in the case of hydrogen railway vehicles, the sizing of the fuel cell and the tank is not a predominant and highly analyzed aspect. This is mainly due to the fuel cell role in the powertrain as a prime mover and therefore as a supplier of all energy demands; the use of plug-in vehicles or integrated overhead line fuel cell systems is not widespread in literature. Consequently, the size and dimensions of the hydrogen propulsion system are highly dependent on the application under consideration, and standard sizing methodologies are of little relevance. For example, in [
15], 25 different configurations for a regional hybrid train are analyzed, based on the sizes of the fuel cell and battery. The 126-seat British Rail Class 150 DMU (76.5 tons) was numerically tested between Stratford Upon Avon and Birmingham Moore Street Station on a section of the Birmingham Snow Hill line (Great Britain). Based on the obtained performance, the optimal configuration consists of a 670 kW fuel cell and a 60–90 kWh battery pack. With this configuration, 27 kg/cycle of hydrogen is required, resulting in a CO
2 reduction of approximately 150 kg compared to a conventional diesel vehicle.
In addition, whereas the size of the battery has a significant impact on the performance and service life of the component, the size of the hydrogen system has a nearly exclusive impact on performance if used within the recommended operating range. As in the case of batteries, the useful life remains a fundamental parameter that is intensively studied through numerical and experimental analysis on control systems that manage the operating phases of each energy source.
Among these, in [
16,
17], a hybrid tram, consisting of fuel cell and battery, was numerically tested in an urban section of Seville (Spain), comparing various control systems. In the employed configuration, the fuel cell was coupled to the load via a unidirectional DC/DC converter, whereas the nickel–metal-hydride (Ni-MH) battery, which served as a secondary storage system, was coupled directly to the motor unit. In detail, compare cascade control and fuzzy logic control were studied in [
16]. The former, which consists of three control loops, calculates the fuel cell power, taking into account its voltage and current limitations, based on the deviation between the actual SOC value and the reference value. The second system, fuzzy logic control, is based on “IF-THEN” rules; each input and output is divided into levels, and the output value is selected based on the input values and the implemented laws. In the analyzed case, two inputs (the power request and the battery’s SOC) and an output are considered (the fuel cell power). Both controls revealed satisfactory results, but fuzzy logic reduces the operating range of the DC bus voltage, recovers more energy during regenerative braking, and reduces hydrogen consumption by enhancing fuel cell efficiency. In contrast, it is more difficult to implement and more computationally intensive than cascade control. In [
17], the tram was managed by the equivalent consumption minimization strategy, in which the fuel cell optimum power is selected by minimizing the equivalent hydrogen consumption of the vehicle; the objective function takes into account both the direct consumption of hydrogen due to the fuel cell and the indirect (or equivalent) consumption of the battery. The simulations confirmed the good results in this instance as well, with an average efficiency of approximately 50% and a hydrogen consumption of approximately 1.7 kg/cycle.
In the past few decades, prototypes have been constructed to evaluate the introduction of hydrogen in rail propulsion and to test the performance of fuel cells in large-scale applications. The first commercial tram with a fuel cell-supercapacitor powertrain, weighing 51 tons and measuring 30 m in length, was tested in [
18]. A 150 kW Ballard fuel cell and a 45 F supercapacitor pack (11 in series and 3 in parallel) were located on the vehicle’s roof; the motor group consisted of four 50 kW components. The vehicle was managed with an innovative strategy that calculated the optimal efficiency at any given time based on the working conditions; four distinct phases (traction, braking, neutral, and parking) were considered, and a dedicated strategy was implemented for each of them. The tests were conducted in October 2017, evaluating the performance over a standard 30 min city cycle with a power demand ranging from −100 kW to 250 kW. Comparing the results to numerical simulations revealed a 9% reduction in hydrogen consumption compared to other control strategies.
After an exhaustive literature research, despite the fact that several works present the analysis performance of fuel-cell-based or battery rails, only a few papers show a comparison between these two powertrains. For instance, in [
19], a comparison of three different powertrains, namely fuel cell–battery, fuel cell–supercapacitor and battery–supercapacitor, was carried out; numerical modeling of the power system was performed with a fuzzy logic control. On a 7 km tramway route, the configurations were numerically tested with power variations between −100 kW and 300 kW. The fuel cell–battery configuration consumed 2.1 kg of hydrogen, while the fuel cell–supercapacitor configuration saved nearly 5% of hydrogen because the supercapacitor was more efficient than the battery and could recover all of the regenerative braking energy. Regarding the battery–supercapacitor configuration, a large battery was utilized to ensure 12 operational hours; as a result, the battery SOC varied in a 3% interval between each cycle.
Nevertheless, the review of the literature reveals that the introduction of fuel-cell- and battery-based powertrains in regional trains has not been subjected to a thorough critical analysis, despite the fact that it would be extremely beneficial to comprehend the pros and cons of these innovative technologies in a widespread application such as interurban railways.
To address this research gap, the paper examines the energy performance and the weight and space requirements for four innovative powertrains, based on fuel cell and/or battery systems, using a dynamical and numerical tool developed by some of the authors in [
20].
As a novelty, four configurations are selected based on the function of each energy source, using combinations of four devices: a proton exchange membrane fuel cell, an overhead line, and a lithium iron phosphate and a lithium nickel manganese cobalt oxide battery.
To this end, the purpose of this manuscript is to investigate the feasibility of integrating hydrogen- and battery-based propulsion systems into a passenger train for a regional railroad in Italy, with the ultimate goal of replacing the line’s current diesel trains. Trenitalia Spa, Italy’s main train operator, is supporting the research. The aim is to compare and contrast the most viable options in terms of sustainability, powertrain performance, and quality of service to customers.
With the goal to simulate real-life performance, the powertrains are introduced on a real vehicle, the Hitachi Blues, and numerically tested on a real regional line, between Catanzaro Lido and Reggio Calabria, managed by Trenitalia Spa. The achieved performance in terms of fuel cell efficiency, hydrogen consumption, recovered braking energy, and battery SOC is investigated. In addition, the actual space and weight occupied are estimated, with adjustments made to account for auxiliary systems and safety distance, as well as an evaluation of the reduction in passenger space and seats. Additionally, a comprehensive comparison of the four powertrains is conducted.
3. System Modeling
After the vehicle description, with the discussion of the four different powertrain configurations analyzed, the system modeling, already presented by some of the authors in [
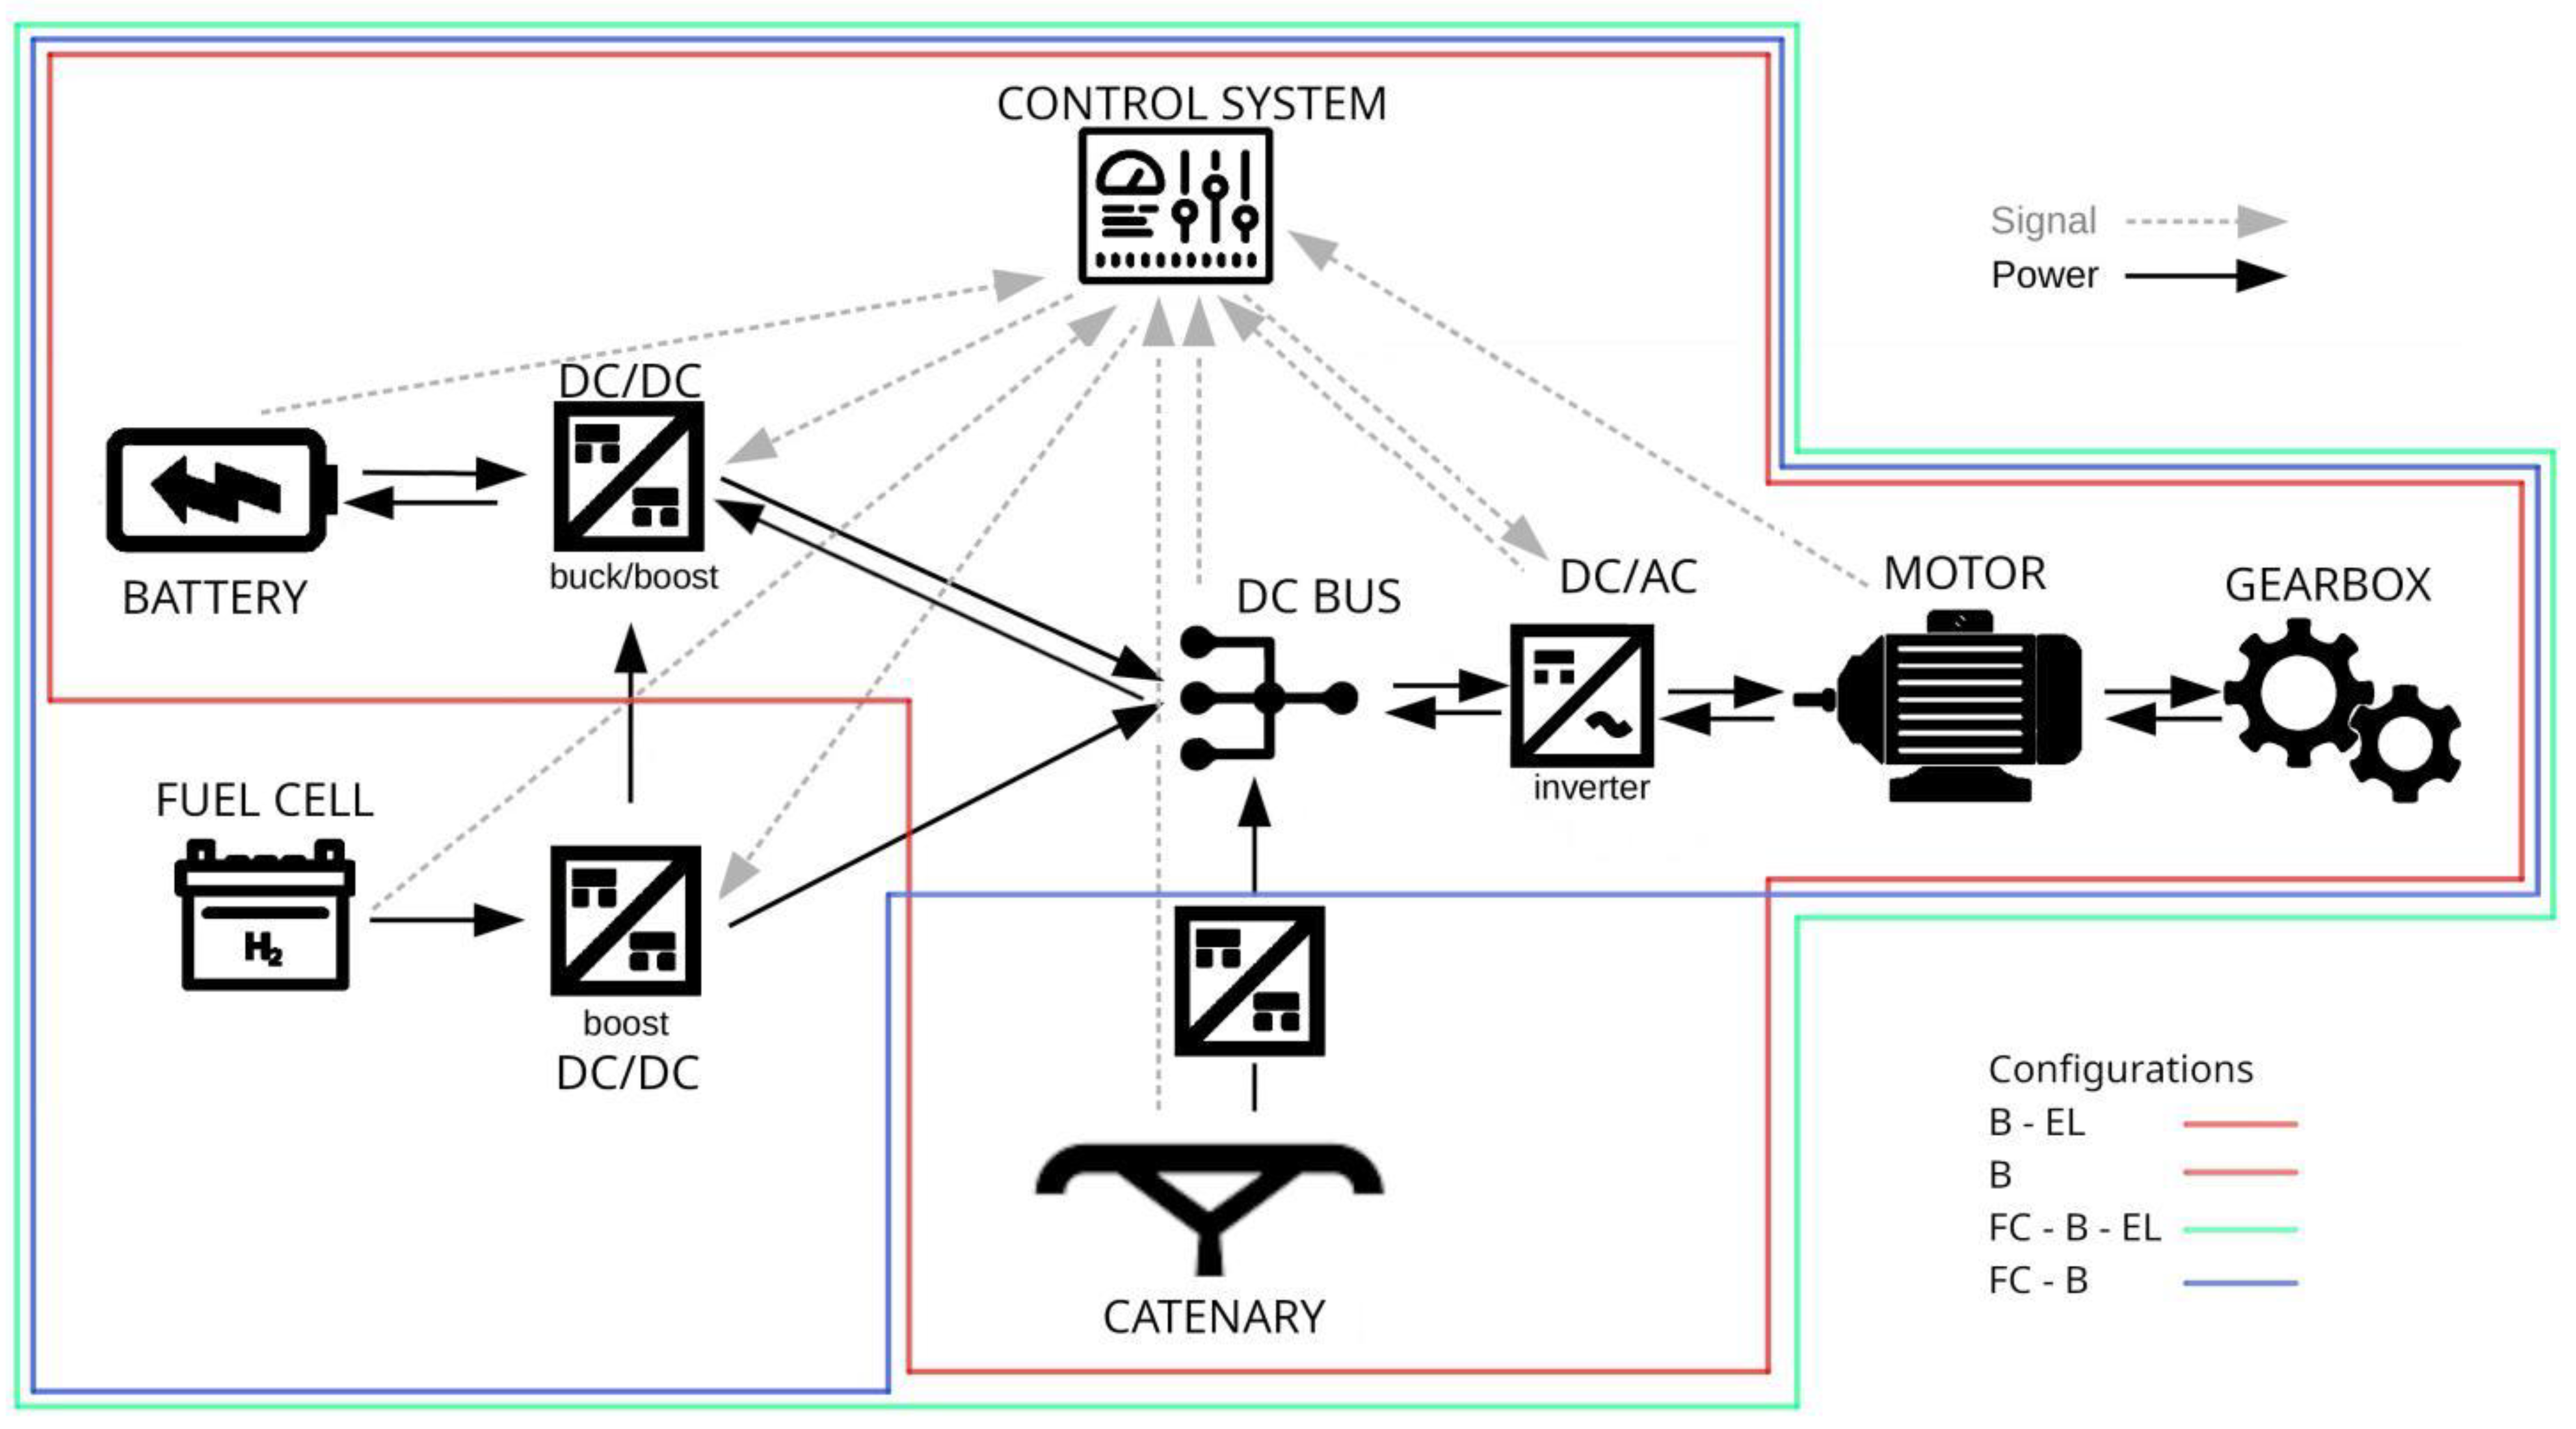
20], is discussed by means of a summary description of the main components, as reported below. In the simulation phase, the overall model allows the simultaneous and dynamic operations of the powertrain primary elements, i.e., the fuel cell, battery, electrified line, DC/DC converters, inverters, motor, and gearbox. All subsystems are deeply investigated and their modeling is completed in three main steps: equation formalization, model implementation, and system validation. The modeling has been carried out handling a multi-physics domain, achieved by means of thermodynamic, chemical, electrical, mechanical, and logical equations.
The components considered in the powertrain, which, conveniently coupled, compose a specific configuration, are:
Proton exchange membrane (PEM) fuel cells, used as a prime mover, which are the most commonly used fuel cells in transport systems [
26,
27] because of their low operating temperature, fast start-up time, high power density, and high specific energy (1–2 kW/kg and 1.195 kWh/kg for 350 bar tanks) [
28];
Lithium iron phosphate (LFP) batteries, which work as a secondary system (1.2–1.6 kW/kg, 90–110 Wh/kg) [
29];
Nickel–Manganese–Cobalt (NMC) batteries, used as primary source (0.5–1 kW/kg, 150–220 Wh/kg) [
30];
Standard electrified line, 3 kV in DC, a provider of energy and power demands.
To allow the connection between the energy sources and the motor system, the power electronics components are implemented, i.e., DC/DC and DC/AC converters. Since these components do not constitute the core of the model, a reduced implementation was carried out so as not to increase the computational load of the simulations. For this reason, switches, mosfets, IGBTs, and PWM strategies are neglected and simplified models are used, with a variable efficiency according to the voltage difference on the two-component sides and according to the power involved.
The motor system consists of a permanent magnet synchronous motor, implemented by means of a second-order state-space model capable of describing the electrical and mechanical subsystem, and a gearbox, with a single gear ratio, taking into account by means of simplified relations to convert torque and speed from motor to wheel values. Finally, the control system is composed of different strategies chosen, implemented, and adopted for the power-sharing, depending on the used configuration, and a rule-based strategy for the motor control.
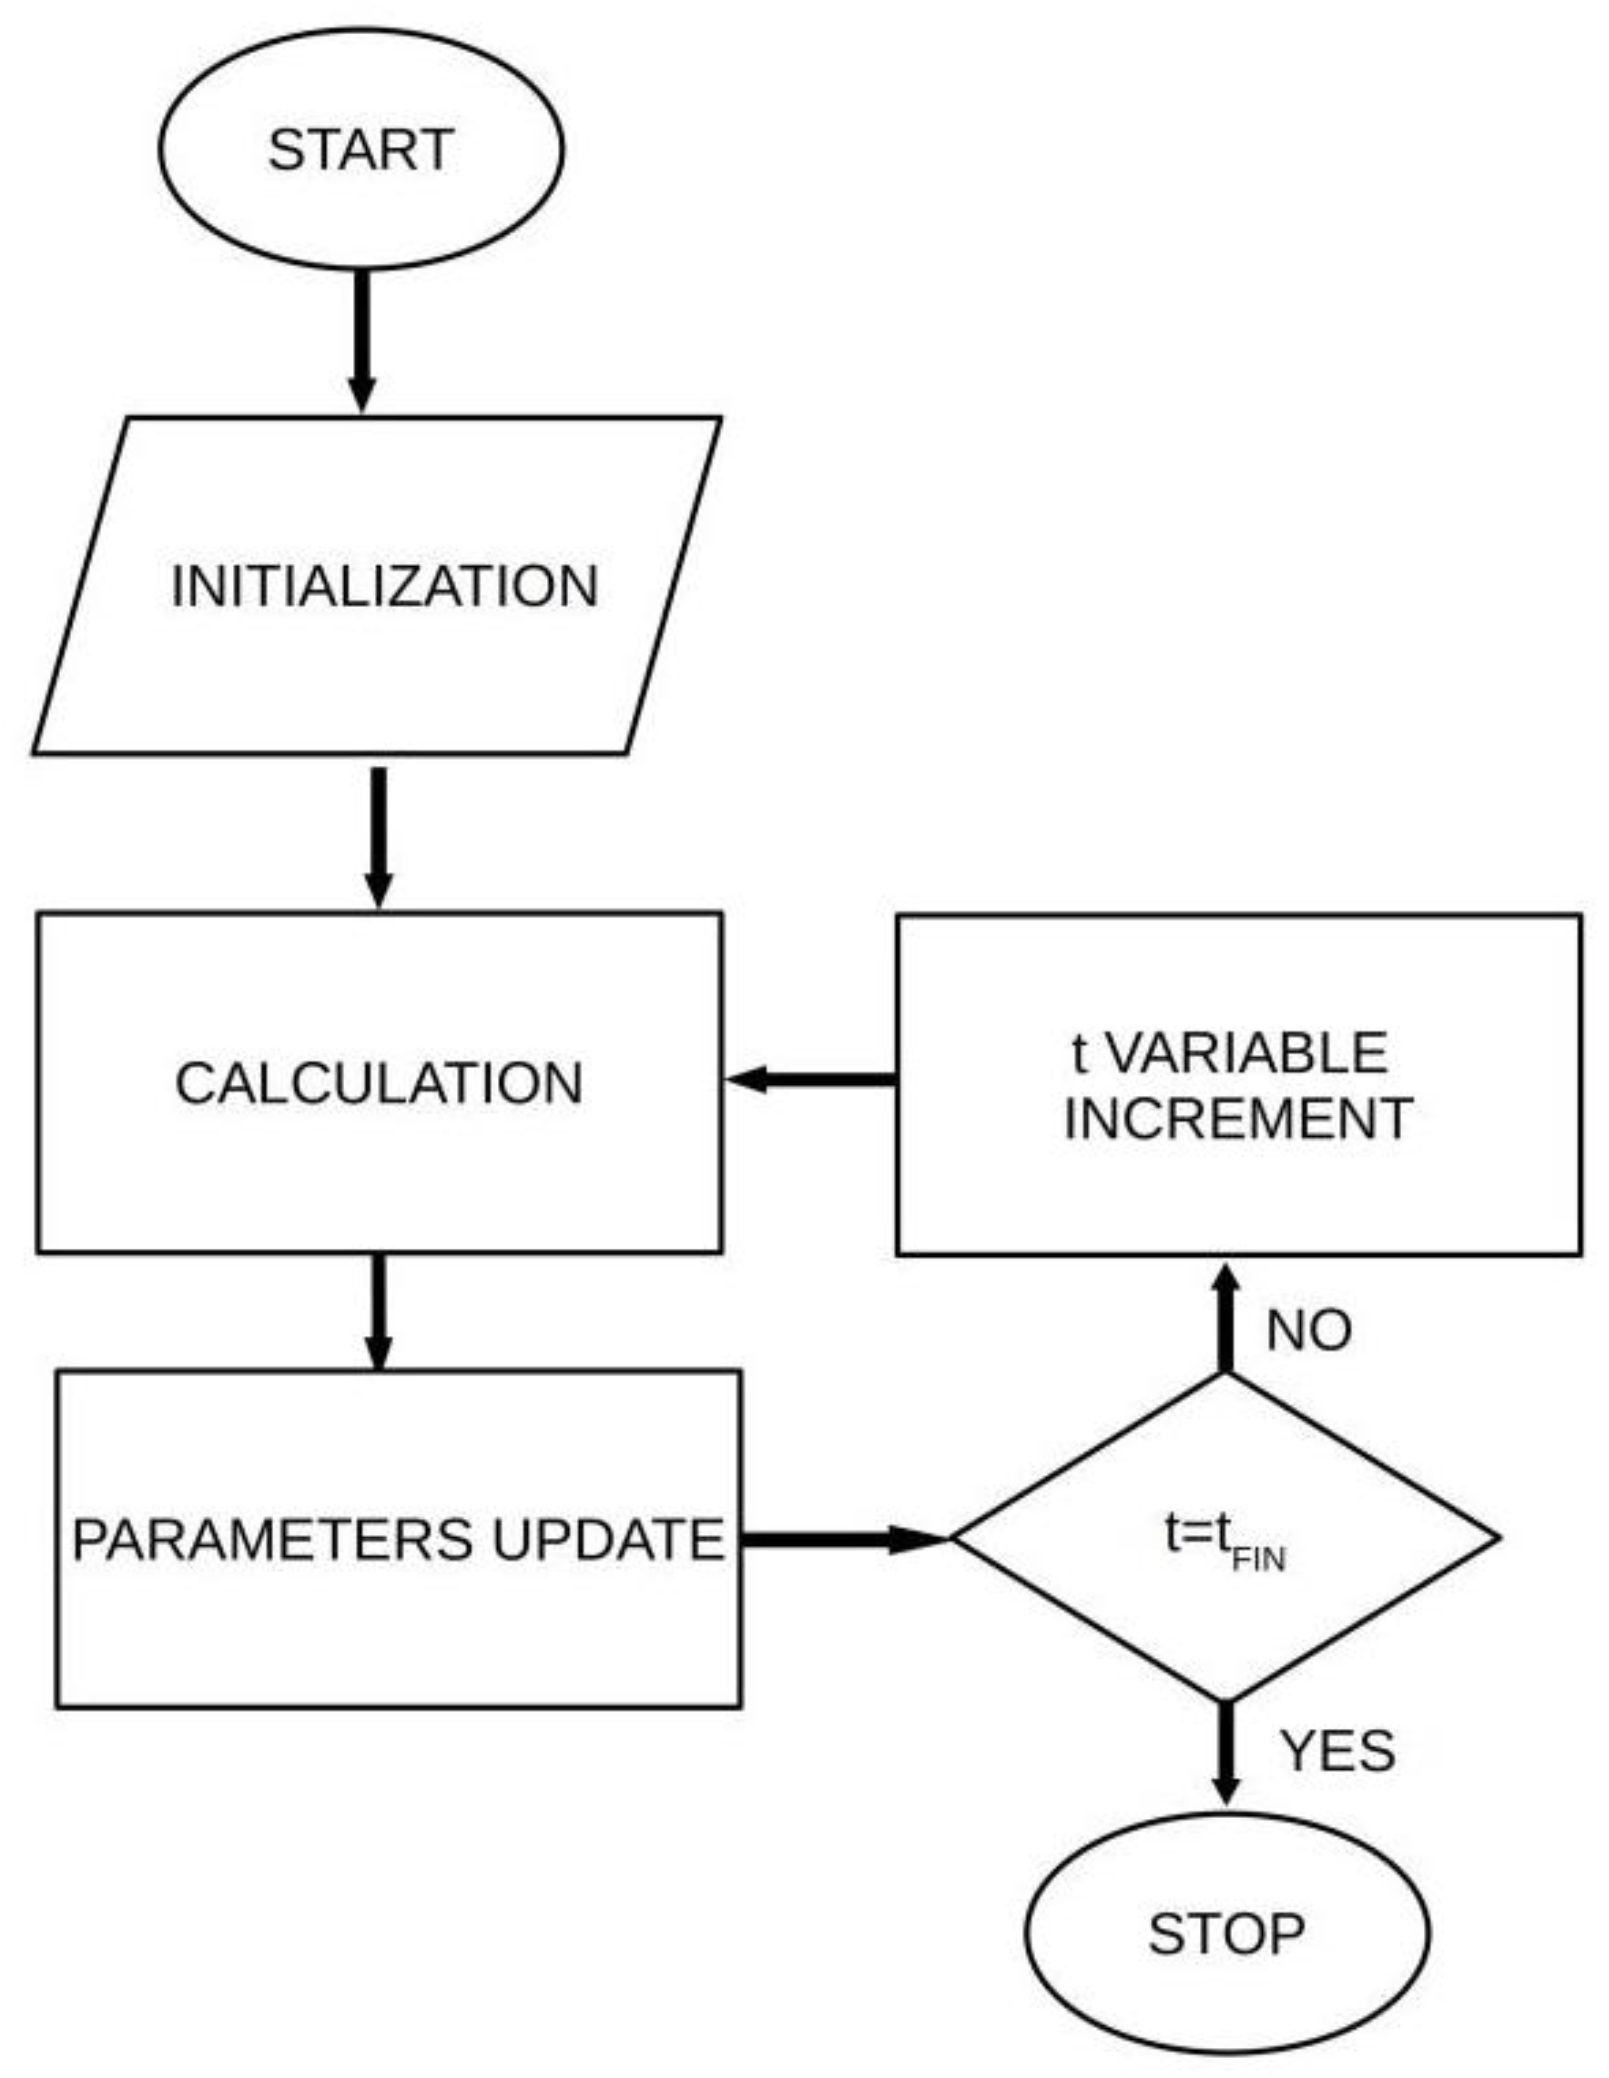
The model operations are schematically described and summarized in the flow chart presented in
Figure 3. Firstly, after the initialization of all parameters, the implemented dynamic model performs the calculation process, starting from input parameters (such as the track altitude, drive-cycle speed, and vehicle characteristics) and monitoring and calculating the performance of each main component of the powertrain, i.e., fuel cell, battery, overhead line, DC/DC converter, inverter, motor, and gearbox systems, according to the implemented control strategies. After that, the powertrain parameters are updated and the time variable (t) is monitored: the simulation completes if the final time value is reached; otherwise, the t variable is incremented and the calculation phase restarts.
Therefore, to better analyze the designed configurations, a description of the energy source models used is presented in the following sections, examining their structure and the primary features, for each configuration.
3.1. Electrified Line–Battery Configuration
The first configuration is composed of the overhead line and the battery. Since the battery is used to recover energy in deceleration, a lithium iron phosphate pack is used.
The battery system is implemented as a voltage source in series with a resistance that assumes a constant value both for the charging and discharging phases. An electrical subsystem allows for determining the battery State of Charge (SOC
B), as reported in Equation (2), considering the battery current (I
B) imposed by the control system on the battery DC/DC converter and the capacity when the battery is fully charged (Q
B,full).
In the same way, the overhead line is considered as a 3 kV voltage source in series with a small resistance, used only to allow a suitable connection with the powertrain.
A simple control strategy is considered for this powertrain configuration; it allows the battery to store all the energy recoverable during the braking phases and provides it at the wheels in nominal conditions (1 C-rate) during acceleration phases.
3.2. Full-Battery Configuration
In the second configuration, the battery is the only power source; since it has to provide a significant amount of energy, a nickel–manganese–cobalt type is needed. Regarding its modeling, the same approach as the first configuration is adopted because the implemented model is suitable for all lithium battery types. Nevertheless, some input parameters are changed to consider NMC features. In the full-battery configuration, the power sharing is not required, since only one energy source is present and, hence, all the energy amount is managed by the battery; however, a simple strategy is implemented to allow regenerative braking operations.
3.3. Fuel Cell–Battery–Electrified Line Configuration
The third configuration includes all the considered energy sources, i.e., fuel cell, battery, and electrified line. Fuel cell and battery systems provide the energy demand during the cycle, while the electrified line recharges the battery at the station. For this reason, a nickel–Manganese–cobalt battery is chosen, as for the full-battery powertrain. Battery and overhead line are implemented as described in the previous configurations.
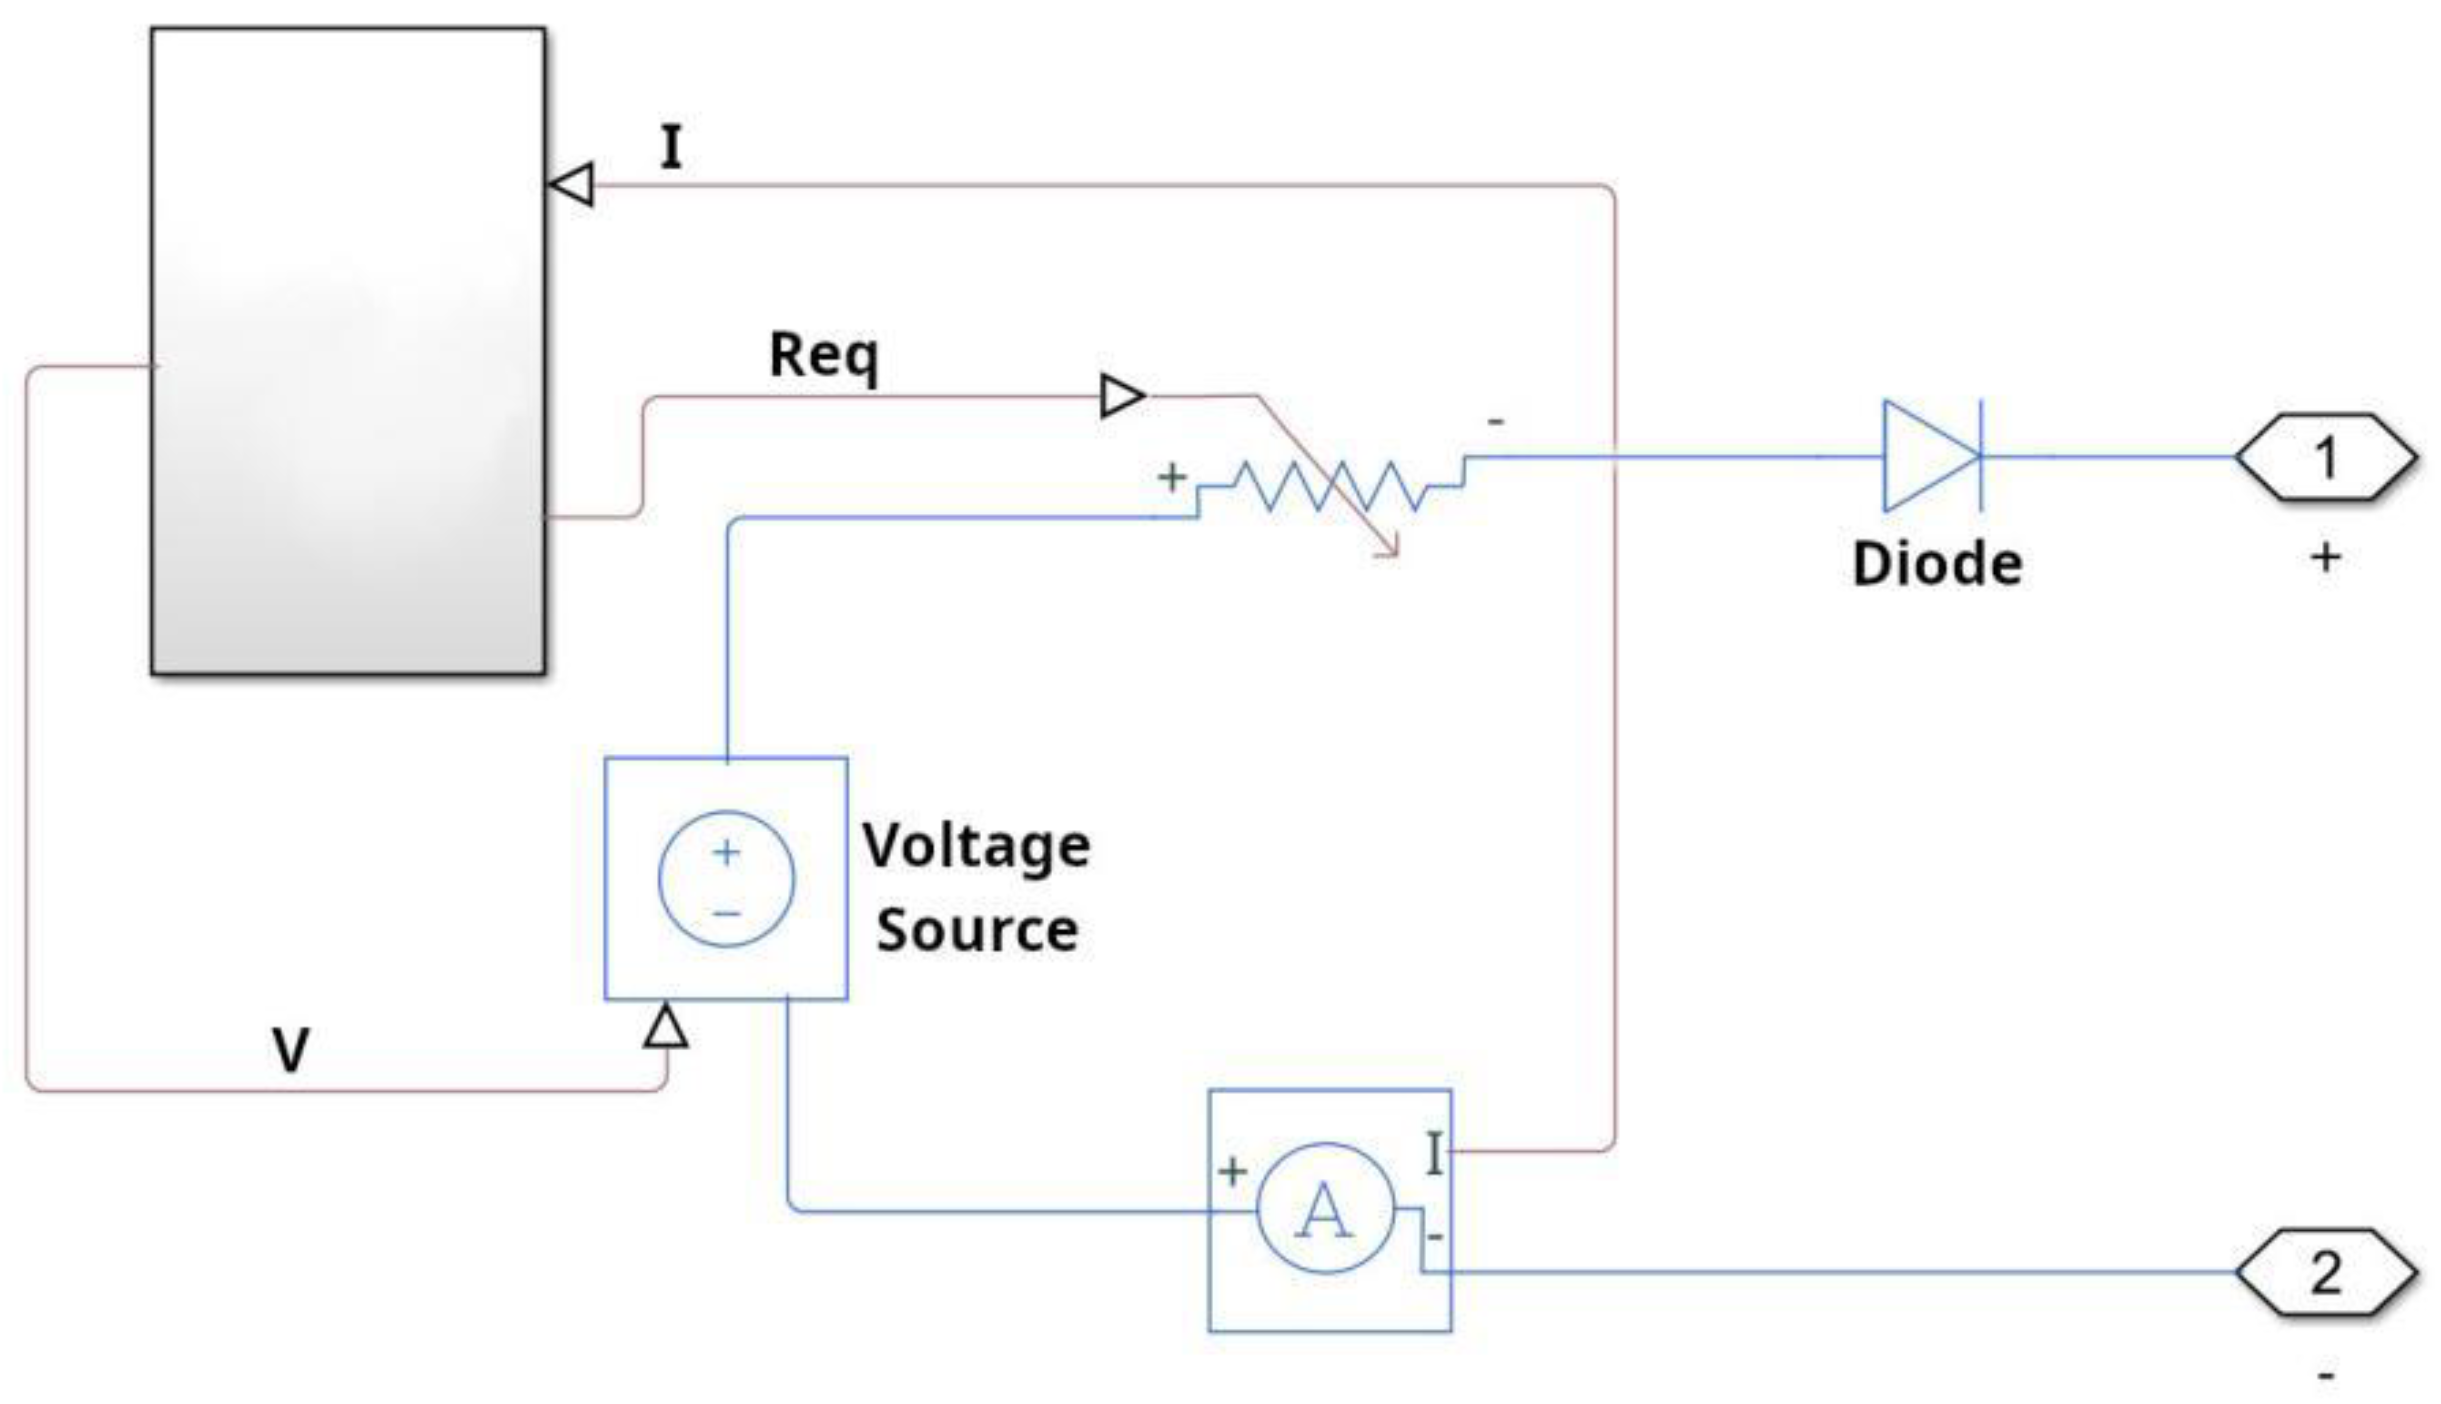
Regarding the fuel cell system, it is modeled with a controlled voltage source in series with a variable resistance, illustrated in
Figure 4; an electrochemical subsystem is modeled to calculate output voltage (V
FC) and equivalent resistance (R
eq), considering the fuel cell current (I
FC) imposed by the control system on the DC/DC converter (Equation (3)). Regarding the fuel cell efficiency, it is calculated as the ratio between the fuel cell power (P
FC) and the product of the hydrogen mass flow rate (ṁ
H2) and its low heating value (LHV), as shown in Equation (4).
The energy source control strategy is based on the equivalent consumption minimization strategy, which is an algorithm capable of setting the fuel cell power value by minimizing the objective function, shown in Equation (5), composed of the hydrogen mass flow rate, the equivalent battery consumption (ṁ
eq,B) and the k
B factor, achieved considering the SOC value and the energy required by the battery.
3.4. Fuel Cell–Battery Configuration
The last configuration is composed of fuel cell and battery systems; the fuel cell provides the whole amount of energy, while the battery covers the peaks. For this reason, a lithium iron phosphate battery is chosen, which has higher power density and lower energy density compared to other Li-ion battery types. The powertrain modeling is performed by means of two simplified models already presented in the previous paragraphs: the fuel cell implementation and the battery one.
The power-sharing strategy is the same as for the fuel cell–battery–electrified line configuration. Nevertheless, the kB factor of Equation (5), is tuned for the FC-B vehicle configuration to guarantee the total energy supply by the fuel cell, while for the FC-B-EL configuration the tuning was performed to allow a balanced energy distribution between fuel cell and battery.
5. Results
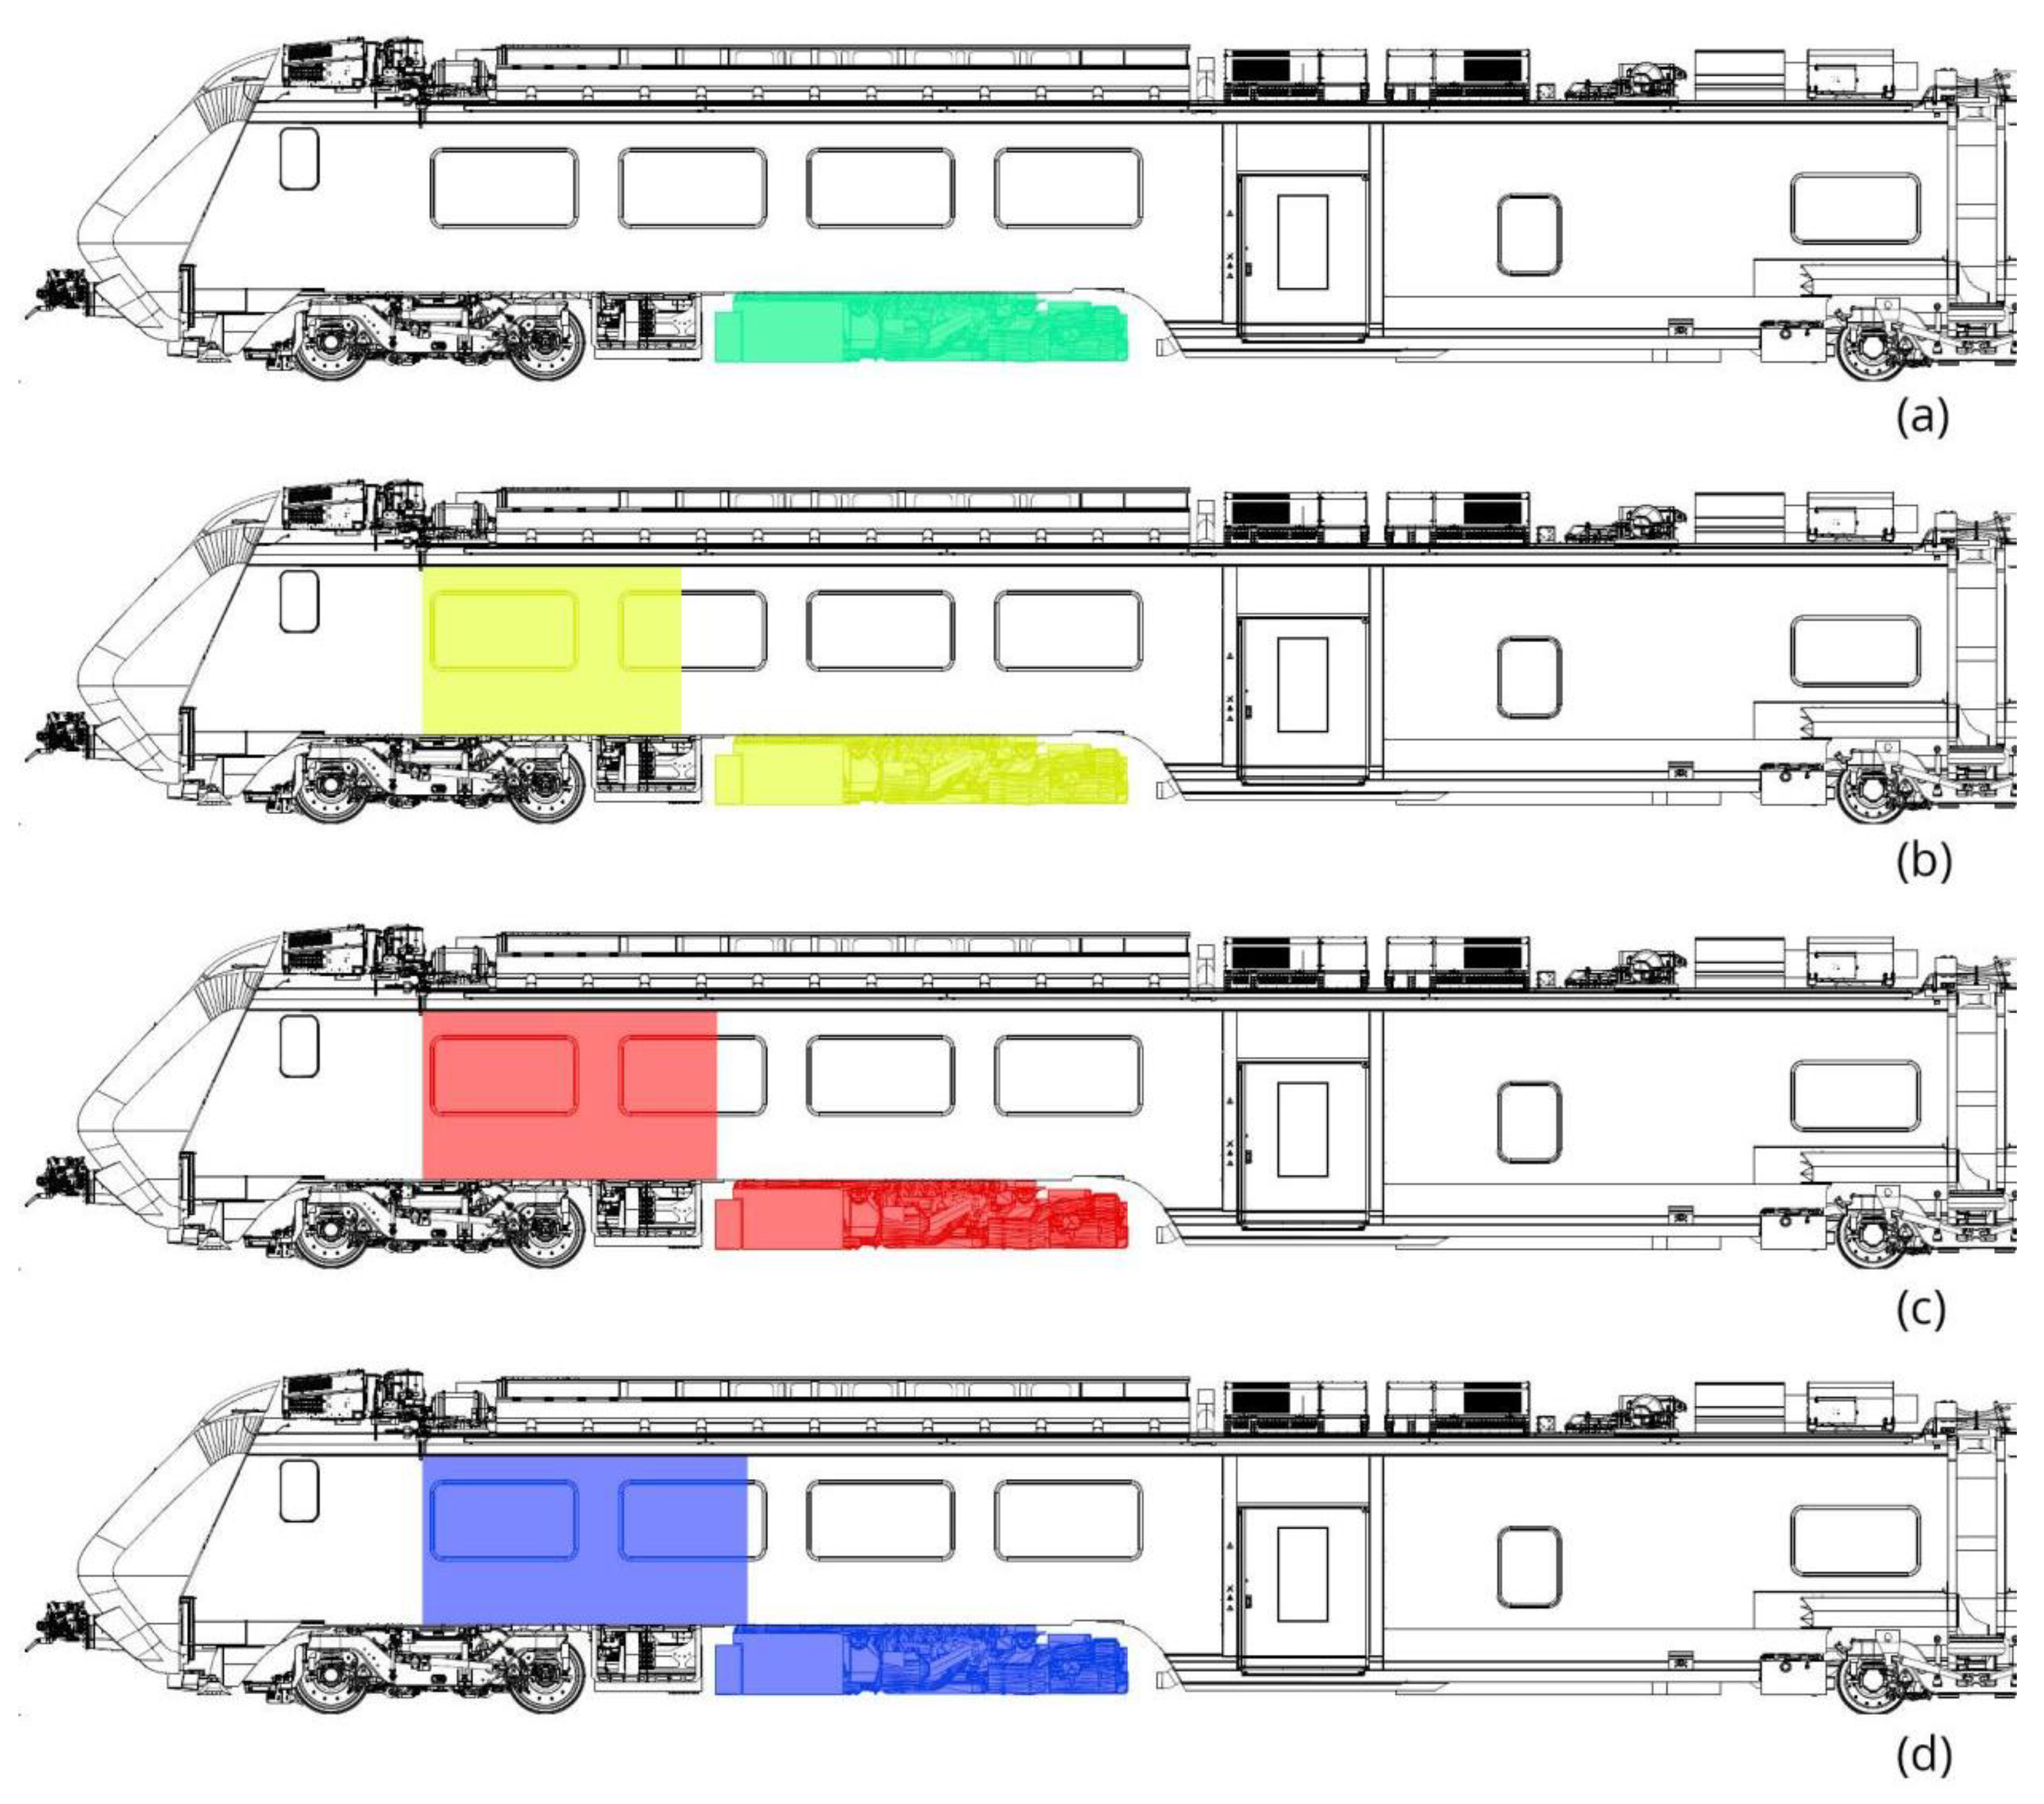
After the definition of the main parameters of the case studies, i.e., drive cycle features and powertrain sizing, the numerical simulations are discussed in two separate sections. Firstly, the onboard layouts of the energy sources are presented, considering the introduction of the innovative powertrains in a conventional train, the Hitachi Blues, powered by hybrid electrified line–diesel propulsion. Weight and space values are calculated considering appropriate adjustments for taking into account auxiliary systems and safety distances. It should be highlighted that the powertrain-occupied space, shown in
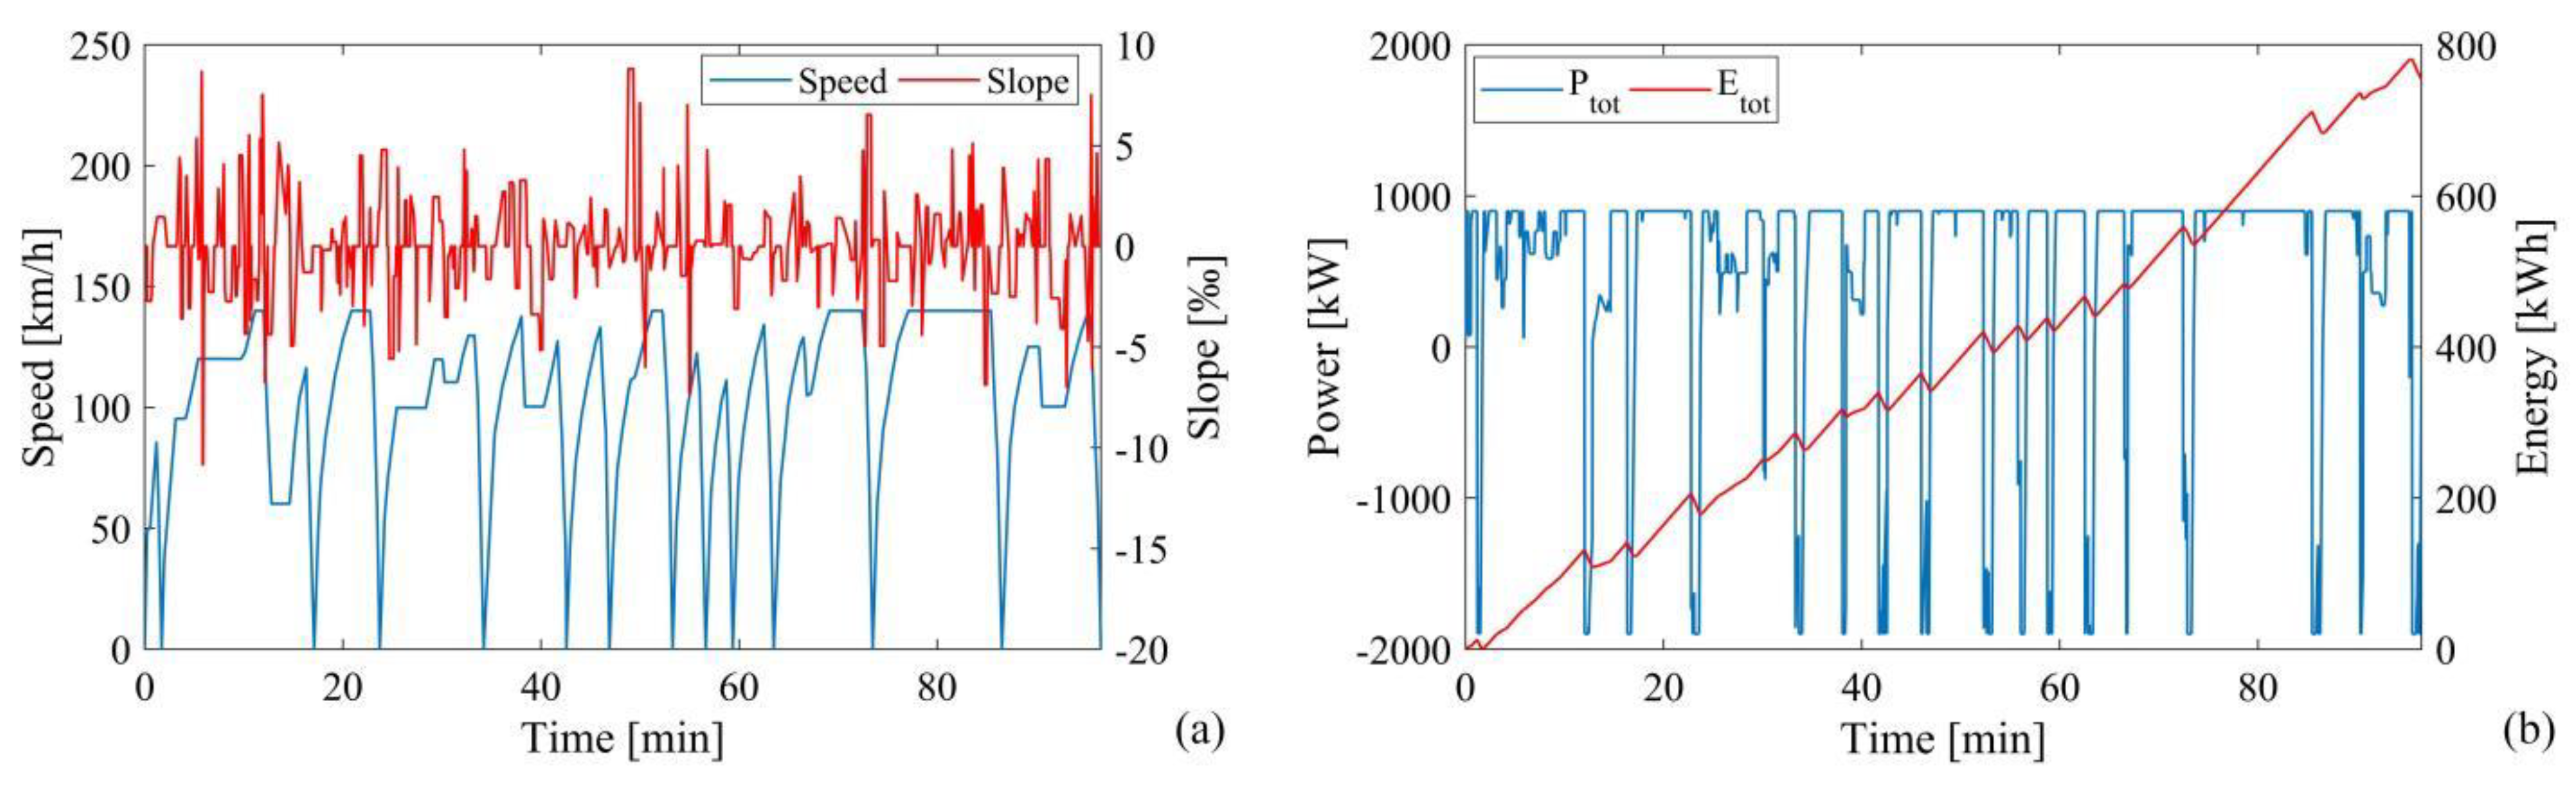
Figure 6 for all the configurations, concerns only half of the onboard occupied space since it is illustrated with only one locomotive, while the train is a top-and-tail vehicle. In a second phase, the energy performance is analyzed, such as power, energy efficiency, and SOC, highlighting the pros and cons of the analyzed powertrains. Due to the characteristics of the drive cycle, such as the narrow slope variations, the data obtained for a one-way trip can be extrapolated to a round trip, thereby doubling the energy required, hydrogen consumption, and regenerative braking energy.
A dedicated sub-paragraph is presented for each configuration.
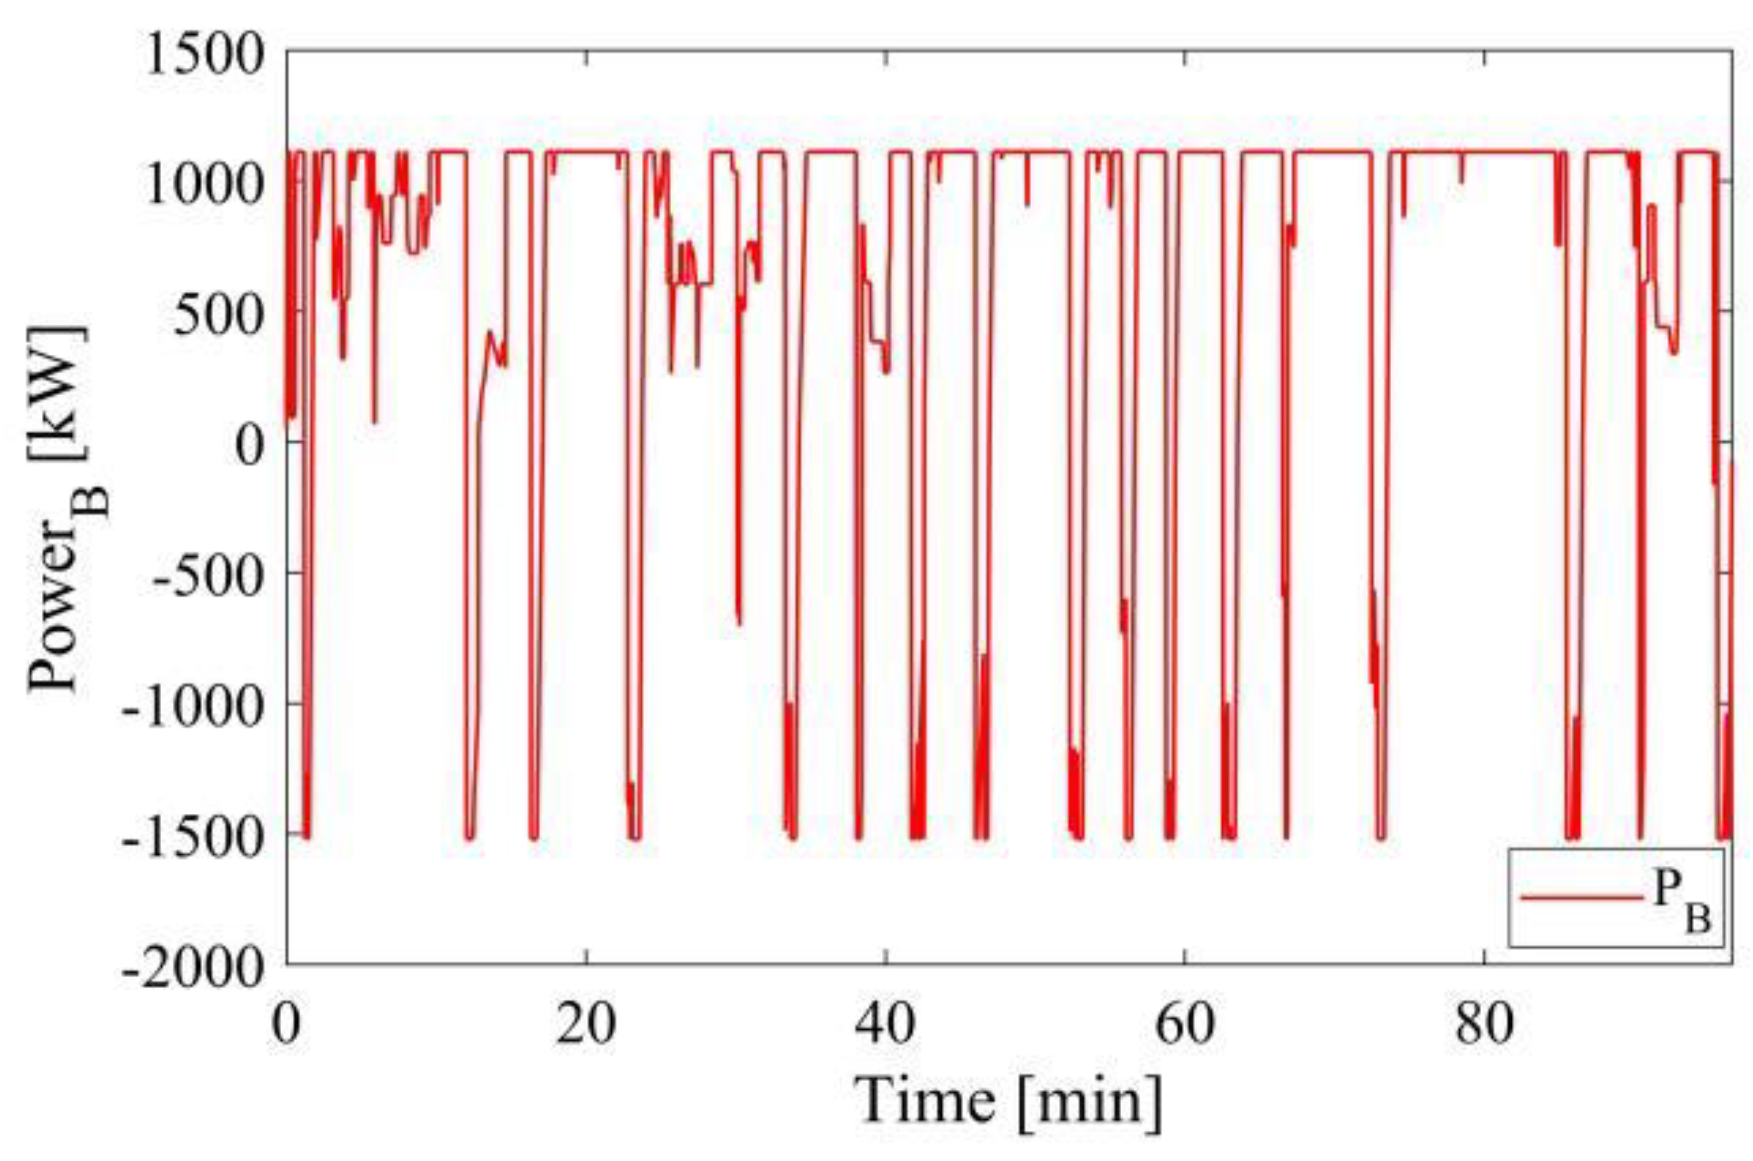
5.1. Electrified Line–Battery Configuration
The first configuration is the electrified line–battery driven powertrain. In this powertrain, the electrified line is present along the track and provides energy and power variations, while the battery is turned on during braking phases to recover energy that is later provided to the wheels in nominal battery conditions for LFP batteries (C-rate equal to 1).
The powertrain designed for this configuration implicates a reduced volume on board, since the electrified line remains the propulsion heart, while the battery pack is a secondary element. Therefore, the battery introduction does not lead to a decrease in the space on board, intended for passengers, but can be performed by substituting the diesel motor and occupying the green space shown in the simplified train scheme (
Figure 6a). The battery pack occupies almost 20 m
3 in volume and 12 tons in weight.
The performance achieved is shown in
Figure 7 and
Table 3. The electrified line and battery power are depicted in green on the left axis and red on the right axis, respectively, in
Figure 7. The electrified line has a power trend between 0 kW and 1100 kW, with an energy consumption of 1060 kWh. The battery instead recovers all the energy during deceleration, almost 295 kWh, reaching −1500 kW, but, at the end of the cycle, it has consumed 0 kWh of the stored energy, since the final SOC has the same value as the initial SOC; in other words, all the energy recovered is provided, for a total value of almost 250 kWh at wheels. The SOC variation remains within a narrow range (5%), and the battery may appear to be oversized; however, in order to recover the whole braking energy, the battery pack has to reach high negative power and consequently, high charge current, which is a limiting factor in battery design since causes high temperatures and rapid deterioration [
35]. Consequently, the battery is appropriately sized if the primary purpose is to recover all braking energy.
5.2. Full-Battery Configuration
The battery pack is the only power source in the second configuration; therefore, both energy demand and power variations are provided by the battery, and a simplified control system is needed for allowing the regenerative braking operations. For these reasons, the NMC battery is selected, in a 15,000 cell system, with a total weight for the power system of approximately 35 tons and an occupied volume of 55 m
3. Owing to the huge space needed, the passenger area is reduced, supposing an occupied volume shown in
Figure 6b. As in the previous configurations, the diesel propulsion is removed; in addition, to integrate the new power system, 20 m
3 space (intended for passengers) is occupied, with a surplus of 5 m
3 compared to the net value (15 m
3), to allow movements between the cabin and coaches. Almost 30 seats are removed for each locomotive. Regarding the vehicle balance, the added weight on board for the power system is less than the weight in the conventional configuration, considering 30 passengers; therefore, issues linked to the vehicle stability are prevented.
Figure 8 and
Table 4 show the performance achieved for the full-battery configuration. The vehicle demand is fully satisfied and the battery precisely follows the train power trend. The power is in a wide interval, between −1550 kW and 1100 kW, with an energy consumption of 1060 kWh. The whole amount of deceleration energy is recovered through regenerative braking strategies and the SOC has a variation of 45%; in this way, if the train leaves the departure station with a fully-charged battery, it can carry out a round trip and come back to the initial station.
5.3. Fuel Cell–Battery–Electrified Line Configuration
The third powertrain is the most complex, since three different energy sources are used, i.e., fuel cell, battery, and electrified line. The combination of the three energy sources makes the train well integrated with the existing infrastructure, enhancing performance and lowering the size of the power system on board, but with sophisticated interface and control systems. The degree of energy hybridization (DoEH) is highly variable, depending primarily on design decisions but also on drive cycle characteristics, estimated hydrogen consumption, and the presence of hydrogen fueling stations along the track. For this case study, a fuel cell DoEH of 50% is chosen, while the battery provides the energy and power variations along the track and the electrified line is present only at the track end, useful for charging the battery at the end of the drive cycle; for these reasons, nickel–manganese–cobalt batteries are used. For each instant of time, the control strategy, ad hoc implemented, imposes the fuel cell power, considering the performance parameters assumed as initial conditions.
Regarding the sizing, both hydrogen and battery systems are sized for a round trip. The hydrogen system is composed of 3 PEM stacks (2.5 tons and 7.5 m
3), and a 35 MPa hydrogen tank system (1.75 tons and 23 m
3); the battery pack, which supplies 50% of the energy consumption during the journey, is constituted by 8000 NMC cells (18 tons and 30 m
3). The amount of space available for passengers is also reduced in this case (30 seats are removed). Compared to the second configuration, the occupied space is comparable, but the power system is lighter; therefore, vehicle balance issues are avoided in this instance as well. Moreover, the installation of hydrogen systems on a conventional train cannot be accommodated by using space on the train’s roof; therefore, it is essential to occupy just locomotive space. In order to prevent damage in the event of an accident, it is necessary to consider the following: a robust air recycling system, a complex and well-located hydrogen leak sensor system, and greater safety distances surrounding the hydrogen system. The hydrogen system occupies the space within the coaches, while the battery system is located in place of the Diesel powertrain. Additional space is also added in this case to allow passage between the cabin and coaches; each locomotive is estimated to require a total of 22.5 m
3, as shown in
Figure 6c.
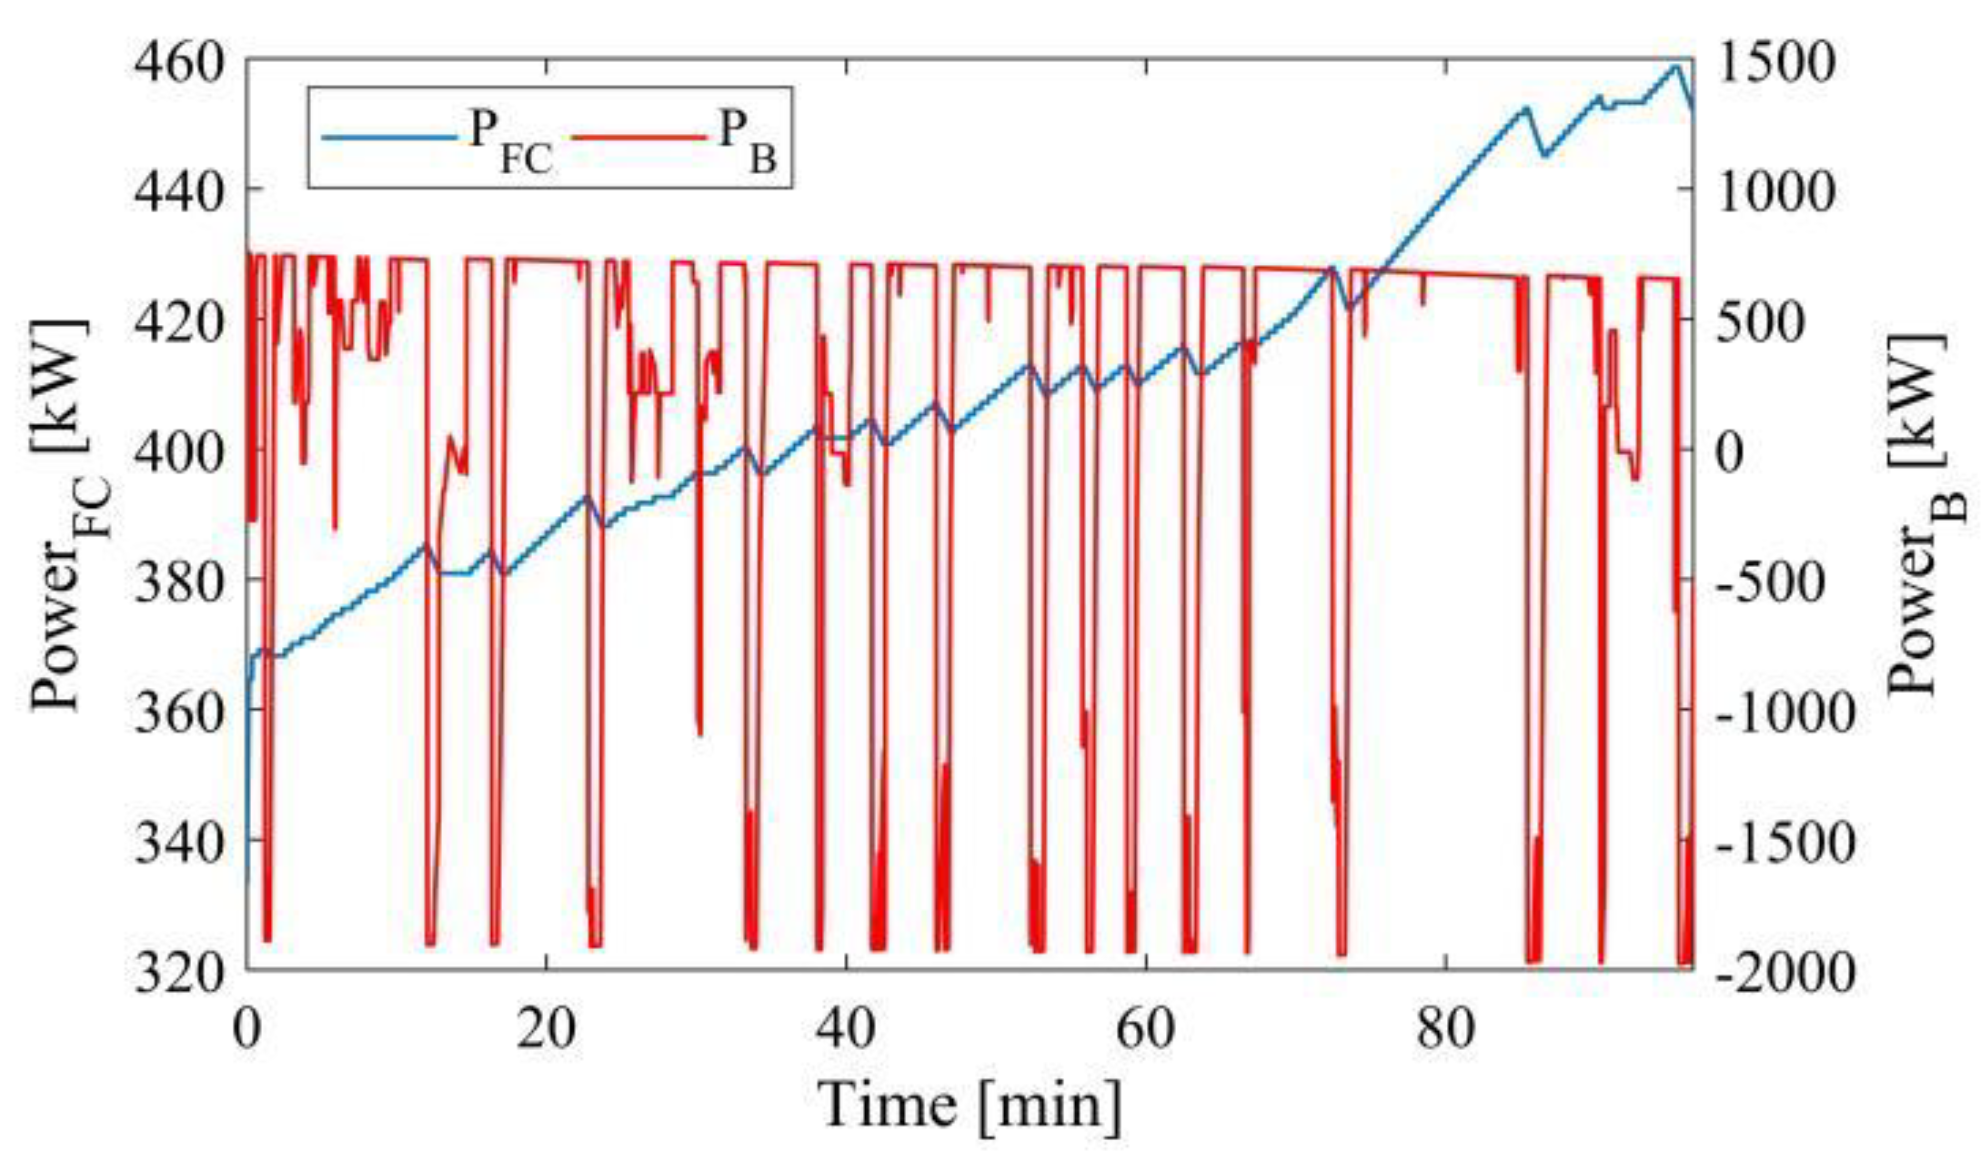
The major performance characteristics of the fuel cell–battery–electrified line powertrain are presented in
Table 5 and
Figure 9, where the fuel cell power is plotted in blue on the left axis and the battery power is plotted in red on the right axis. The FC system operates within a narrow range, between 360 kW and 460 kW, with slow variations imposed by the control system to reduce fuel-cell-starvation-related issues. The supplied energy is 655 kWh, with a hydrogen consumption of 43 kg and an average efficiency of 50%. In contrast, the battery delivers the rapid power changes of the drive cycle, varying its outputs between −2000 kW and 800 kW, consuming 405 kWh, and recovering all regenerative braking, with a SOC variation of 45%.
5.4. Fuel Cell–Battery Configuration
The last implemented configuration is a hybrid fuel cell–battery powertrain. In this configuration, the fuel cell is managed by the control strategy to meet the total energy demand. Instead, the battery is exploited to cover power peaks and recover energy during deceleration phases. In addition, the fuel cell charges the battery system throughout the cycle to reach the same level of initial charge at the final station.
Regarding the sizing (
Figure 6d), the fuel cell system that works as a prime mover is composed of five stacks, with a weight of 5 tons and an occupied volume of almost 12 m
3. Together with the electrochemical component, a 350 bar hydrogen tank system of 3 tons and 40 m
3 is chosen, capable of providing the hydrogen required for a round trip, considering only one refueling infrastructure at the departure or arrival station [
36]. Regarding the battery, it works as a secondary system, providing energy and power variations; for these reasons, LFP batteries are chosen, characterized by high power density, with a discharge C-rate higher than 10 C; however, their energy density is lower compared the other Li-ion battery types, but, in a hybrid system with the fuel cell, this is not an essential characteristic. This configuration requires a pack of 5500 LFC cells with the following features: 13 m
3 and 15 tons.
The whole powertrain needs 65 m3 and almost 40 seats should be removed. Since the weight is lower than the full-battery powertrain, with a larger space occupied, there are no issues linked to the train stability.
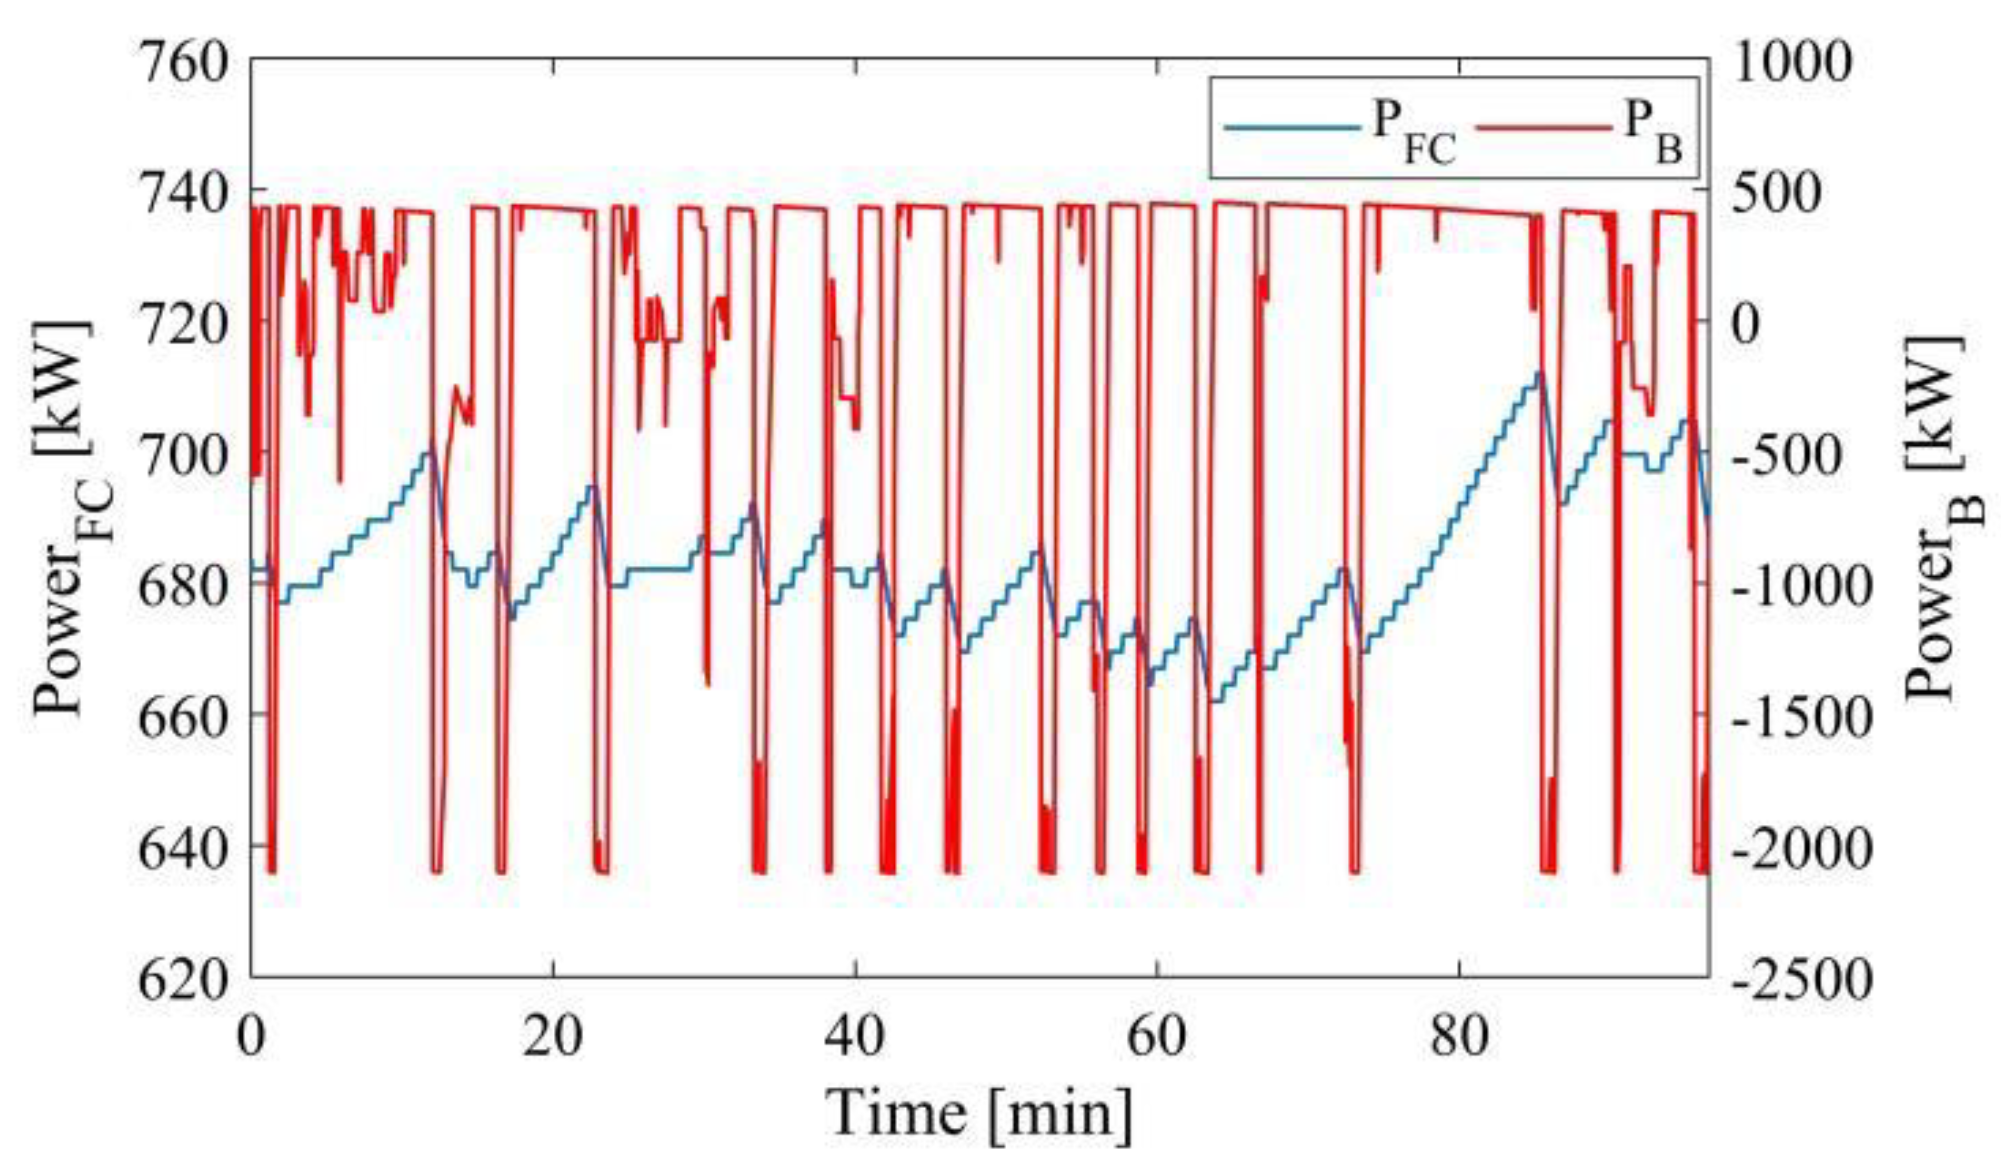
Regarding the performance, shown in
Figure 10 and
Table 6, the fuel cell power (the blue line on the left axis) varies between 660 kW and 720 kW, generating 1075 kWh; during these phases of operation, the fuel cell system achieves high efficiency, approximately 47%, with a hydrogen consumption of 72 kg. The battery power (the red line on the right axis) fluctuates rapidly between −2100 kW and 500 kW. The regenerative braking strategy recovers approximately 275 kWh, but 15 kWh of the deceleration energy is lost, resulting in higher fuel cell energy consumption; however, the battery SOC lies within a moderate range variation, 15%, and assumes the same value at the initial and final time, i.e., it has consumed 0 kWh of the stored energy and only the energy recovered during deceleration phases. Consequently, the battery system is appropriately sized, with an appropriate trade-off. In reality, a larger battery size permits a faster rate of energy recovery, but the SOC interval would be too limited, indicating that the battery is oversized. In contrast, with a smaller size, the SOC varies over a larger range, but the energy recovered during deceleration phases would be less, resulting in a higher hydrogen consumption, and consequently a downsized battery.
5.5. Overall Performance and Conclusive Considerations
Four configurations, based on innovative powertrains, were numerically tested on a real drive cycle to analyze the behavior of each energy source. Firstly, the powertrain sizing was carried out, considering a 180 kW proton exchange membrane fuel cell, a 52 Ah nickel–manganese–cobalt battery, and a 38 Ah lithium iron phosphate battery:
An electrified line–battery configuration, where the energy storage system is used only to recover energy during deceleration phases, requiring a 4000-LFP pack (20 m3 and 12 tons);
A full-battery powertrain, with 15,000 NMC cells (55 m3 and 32 tons);
A fuel cell–battery–electrified line configuration, with a DoEH of 40% for the fuel cell and where the fuel cell and battery provide the total energy demand in equal proportions and the electrified line is used to charge the battery at the initial and final stations; this powertrain configuration is composed of 3 fuel cell system, 350 bar tanks, and 8000 NMC cells (60.5 m3 and 22 tons);
A fuel cell–battery configuration, where the 5-fuel-cell system supplies the whole energy demand while 5500 LFP cells cover the power peaks (65 m3 and 23 tons).
In the last three configurations, a portion of the space intended for passengers has been occupied, from 10 m3 to 18 m3 for each locomotive, without compromising vehicle stability.
Once the sizing analysis was carried out, the performance achieved was discussed and extended for a round trip.
In the first powertrain, the electrified line–battery configuration, the maximum energy recoverable during braking (about 590 kWh for a round trip) is stored and then supplied to the cycle. In the second configuration, the full-battery vehicle, the whole deceleration energy rate is also recovered, and the power system satisfies the load during the acceleration phase, varying its power range between −1500 kW and 1100 kW. In the fuel cell–battery–electrified line configuration, the fuel cell provides the same energy rate (about 1310 kWh) as the battery, which recovers all the braking energy, and the vehicle consumes approximately 86 kg of hydrogen for a round trip. The last configuration, the fuel cell–battery hybrid powertrain, requires about 145 kg of hydrogen for a round trip, since more than 80% of the energy is supplied by the fuel cell, while the remaining part, approximately 560 kWh, is the braking energy, which is stored in the battery system, then provided to the wheels. In conclusion, the achieved results demonstrate satisfactory performance for each of the innovative powertrains presented; therefore, the selection of a particular configuration depends on design conditions, primarily relating to drive cycle characteristics, the required train schedule, and the presence of hydrogen fueling stations along the track.
6. Conclusions
In this paper, four innovative rail powertrains (electrified line–battery, full-battery, fuel cell–battery–electrified line, and fuel cell–battery) were numerically tested on a real regional route with the aim of evaluating the substitution or integration with a conventional propulsive system. After the study of the drive-cycle features, the paper analyzed the definition of the energy source roles, the component sizing along with their implementation on board, and the performance investigation. Although all the configurations have been deeply investigated, only the most important results are presented in the conclusion section, for sake of brevity.
In the first powertrain, the electrified line–battery combination, braking energy is saved and supplied back into the cycle. In the second arrangement, with a full battery, all deceleration energy is collected and the power system covers the load during acceleration. In the fuel cell–battery–electric arrangement, the fuel cell produces the same amount of energy as the battery, which recovers all the braking energy. In the last option, the fuel cell–battery hybrid drive, more than 80% of the energy is supplied by the fuel cell and the remaining half is stored braking energy transmitted to the wheels. Each of the novel powertrains showcased showed good performance. The choice of a specific configuration depends on design variables, such as driving cycle characteristics, the intended timetable, and the existence of hydrogen refueling stations along the route.
More specifically, among the configurations, the full-battery powertrain, with 15,000 nickel–manganese–cobalt cells of 52 Ah (45 m3 and 35 tons), occupies almost half of both locomotives of the train and guarantees a round trip of almost 360 km. It can recover the whole deceleration energy rate and satisfy the load during the acceleration phase, varying its power range between −1500 kW and 1100 kW. The fuel cell–battery–electrified line configuration was designed with a 40% degree of energy hybridization: the fuel cell and battery supplied the total energy demand in equal proportions, and the electrified line was used to charge the battery at the initial and final stations. It consists of three 180 kW fuel cell systems, 350 bar tanks, and 8000 52 Ah-NMC cells, taking up 40 m3 and 22 tons on board. The fuel cell system operates for only 16% of the total power range, between 360 kW and 460 kW, consuming 43 kg of hydrogen, whereas the battery operates over a wide power range, between −2000 kW and 800 kW, consuming the same amount of energy as the fuel cell (approximately 655 kWh) and recovering all available braking energy. It should be emphasized that the other two analyzed configurations, i.e., electrified lines–battery and fuel cell–battery, consider lithium iron phosphate cells, as the battery is used as a power variation provider and not as a primary power source.
The achieved results demonstrate the promising results of each configuration, highlighting the promising role of hydrogen and battery systems in railways in the near future. In addition, this paper demonstrates that the integration of these innovative powertrains can be a valuable solution for improving vehicle efficiency, ensuring the energy independence of the railway sector, and, most importantly, reducing the train’s environmental impact, as they can be viewed as a supplement to the traditional electrified vehicle or as a replacement for conventional diesel vehicles in situations where the line is impractical or economically not convenient to construct.


 ,
, 


