Article

Evaluating China’s Role in Achieving the 1.5 °C Target of the Paris Agreement

1
School of Economics and Management, China University of Geosciences, Wuhan 430074, China
2
Laboratoire des Sciences du Climat et de l’Environnement (LSCE), IPSL, CEA/CNRS/UVSQ, Université Paris-Saclay, 91191 Gif-sur-Yvette, France
3
Earth System Risk Analysis Section, Earth System Division, National Institute for Environmental Studies (NIES), Tsukuba 305-8506, Japan
*
Authors to whom correspondence should be addressed.
Energies 2022, 15(16), 6002; https://doi.org/10.3390/en15166002
Submission received: 13 July 2022 / Revised: 14 August 2022 / Accepted: 16 August 2022 / Published: 18 August 2022
(This article belongs to the Section B1: Energy and Climate Change)

Abstract

:
Now that many countries have set goals for reaching net zero emissions by the middle of the century, it is important to clarify the role of each country in achieving the 1.5 °C target of the Paris Agreement. Here, we evaluated China’s role by calculating the global temperature impacts caused by China’s emission pathways available in global emissions scenarios toward the 1.5 °C target. Our results show that China’s contribution to global warming in 2050 (since 2005) is 0.17 °C on average, with a range of 0.1 °C to 0.22 °C. The peak contributions of China vary from 0.1 °C to 0.23 °C, with the years reached distributing between 2036 and 2065. The large difference in peak temperatures arises from the differences in emission pathways of carbon dioxide (CO2), methane (CH4), and sulfur dioxide (SO2). We further analyzed the effect of the different mix of CO2 and CH4 mitigation trajectories in China’s pathways on the global mean temperature. We found that China’s near-term CH4 mitigation reduces the peak temperature in the middle of the century, whereas it plays a less important role in determining the end-of-the-century temperature. Early CH4 mitigation action in China is an effective way to shave the peak temperature, further contributing to reducing the temperature overshoot along the way toward the 1.5 °C target. This underscores the necessity for early CO2 mitigation to ultimately achieve the long-term temperature goal.

1. Introduction

Climate change can seriously damage natural ecosystems, the economy, and social systems [1,2]. To avoid severe climate impacts, the Paris Agreement stipulates the goals of holding the increase in the global average temperature to well below 2 °C above preindustrial levels and pursuing efforts to limit the temperature increase to 1.5 °C above preindustrial levels [3]. Keeping the warming below 1.5 °C can avoid a fraction of the damage that may still occur with the 2 °C target [4,5]. For example, the probability of extreme precipitation in China occurring under 1.5 °C can be reduced by 33% compared to under 2 °C [6]. Moreover, tens of billions of dollars in economic losses caused by drought can be saved [7]. On the other hand, the IPCC report indicated that global surface temperature was already 1.09 °C higher in 2011–2020 than in 1850–1900 [8]. It further indicates at least a 50% chance of exceeding the 1.5 °C warming level before 2040 under all scenarios considered.
The Paris Agreement requires countries to reduce emissions according to their Nationally Determined Contributions (NDCs). Compared to the 2 °C target, the 1.5 °C target requires countries to strengthen their respective NDCs, which was emphasized in COP26, to reduce the gap between existing emission reduction plans and emission reduction requirements [9]. For example, accelerating the implementation of renewable technology policies and improving energy efficiency are needed for countries with high greenhouse gas emissions (GHGs) [10]. China, a country with massive CO2 emissions at present, plays an essential role in global efforts to mitigate climate change [11]. The Chinese government has pledged to peak its CO2 emissions before 2030 and achieve carbon neutrality before 2060 [12,13]. Our analysis assumes that China’s net zero applies only to CO2, although there is a debate on whether carbon neutrality is for CO2 or GHGs [14,15,16].
Plenty of studies have explored pathways to achieve the 2 °C target [17,18,19,20]. Recent studies focus more on the 1.5 °C target and the differences in the implications between the 2 °C and 1.5 °C targets [4,21,22,23,24,25,26,27,28,29,30,31,32]. While different emission pathways for China have been proposed [23,24,31], little attention has been paid to the effects of China’s pathways on global warming, except for Chen et al. [33]. The Chen study looked into the global temperature effect of China’s carbon neutrality target.
The objective of this study is to explore China’s role in achieving the 1.5 °C target and evaluate how China can decrease its warming contribution effectively. We analyze here the contribution of China to global emission pathways toward the 1.5 °C target, considering the climate effect from GHGs and air pollutants. In particular, we examine how the mitigation strategies of CO2 and CH4 emissions shape China’s contributions toward the 1.5 °C target. This study provides new insights into the effects of China’s GHGs and air pollutant emissions under the 1.5 °C target, and long-term implications of near-term CH4 mitigation in China are also analyzed.
Integrated Assessment Models (IAM) are a modeling approach to assess climate policies [34], and multimodel analyses using different IAMs have become a well-established approach in climate research. Multimodel analysis allows for an understanding of the differences in emission pathways, providing a basis for robust policy recommendations [29,35]. Thus, we evaluate the climate responses to China’s emission pathways under the 1.5 °C target generated by IAMs.

2. Methodology

To calculate the temperature responses to emission pathways, we used a simple climate model Aggregated Carbon Cycle, Atmospheric Chemistry, and Climate model (ACC2) [25,36] developed on the basis of earlier work [37,38]. The model comprises four modules: carbon cycle, atmospheric chemistry, climate, and economy modules. Although ACC2 can be used as a simple IAM with an economy module to calculate least-cost pathways [39], this study uses ACC2 as a simple climate model without the economy module. The performance of this model was cross-compared with those of other simple climate models [40]. Our model describes CO2, CH4, N2O, as well as many other short-lived and long-lived gases, and air pollutants. The model can calculate the temperature contributions of gases and aerosols separately as it evaluates the radiative forcing of climate forcers individually. The physical climate module is an energy balance and heat diffusion model DOECLIM [36,41]. The carbon cycle module is a box model comprising three ocean boxes, a coupled atmosphere-mixed layer box, and four land boxes. With rising atmospheric CO2 concentration, the ocean CO2 uptake is saturated through changes in the thermodynamic equilibrium of carbonate species, and the land CO2 uptake increases due to the CO2 fertilization effect. Climate sensitivity is one of the major uncertain parameters that determine global average temperature changes in model calculations. It is likely in the range of 1.5 °C to 4.5 °C in AR5 [42], and the range is narrowed to 2.5–4.0 °C in AR6 [8]. In our research, the climate sensitivity is assumed to be 3 °C, the best estimate of IPCC [8]. Other uncertain model parameters are calibrated based on a Bayesian approach [43]. The model is written in GAMS and numerically solved using CONOPT3, a nonlinear optimization solver included in the GAMS software package.
We aim to evaluate China’s role in IAM-based global pathways toward the 1.5 °C target by investigating the effects of China’s emission reductions on global mean temperature changes. To this end, we collected emission pathways for the 1.5 °C target that explicitly involve China. The database of the ADVANCE project [23,24] meets our requirements, which is a set of global and regional pathways for various climate policy goals, including the 1.5 °C target. Note that we did not consider the pathways of IMACLIM and GEM, as their historical CO2 emissions significantly differ from China’s actual CO2 emissions, especially the former, due to the lack of the CO2 emissions of land-use emissions and industrial processes in the database [23]. Though Duan et al. [31] also generated several pathways with domestic IAM models to first examine the pathways of the 1.5 °C warming limit for China, they mainly presented CO2 emissions for the period of 2015–2050, which is not suited for our purpose. As a result, we adopted a total of 24 of China’s emission pathways from the ADVANCE database. Though all pathways aim at the 1.5 °C target, there are differences in the carbon price level, the time to take mitigation action, and the carbon budget. We adopted the four categories of the ADVANCE project (Table 1) to classify the pathways.
GHGs and air pollutants considered in our study are shown in Table 2. These include energy-related emissions (e.g., energy and industrial processes) and nonenergy-related emissions (e.g., agriculture, forestry, and land-use sector). Emission pathways were linearly interpolated into yearly data for our temperature calculations. It is important to emphasize that the outcome of an analysis such as ours is sensitive to the period of emissions considered (e.g., [44]). The emissions scenarios we collected start in 2005 and end in 2100. In other words, we consider the temperature effect of emissions only from 2005.

3. Results

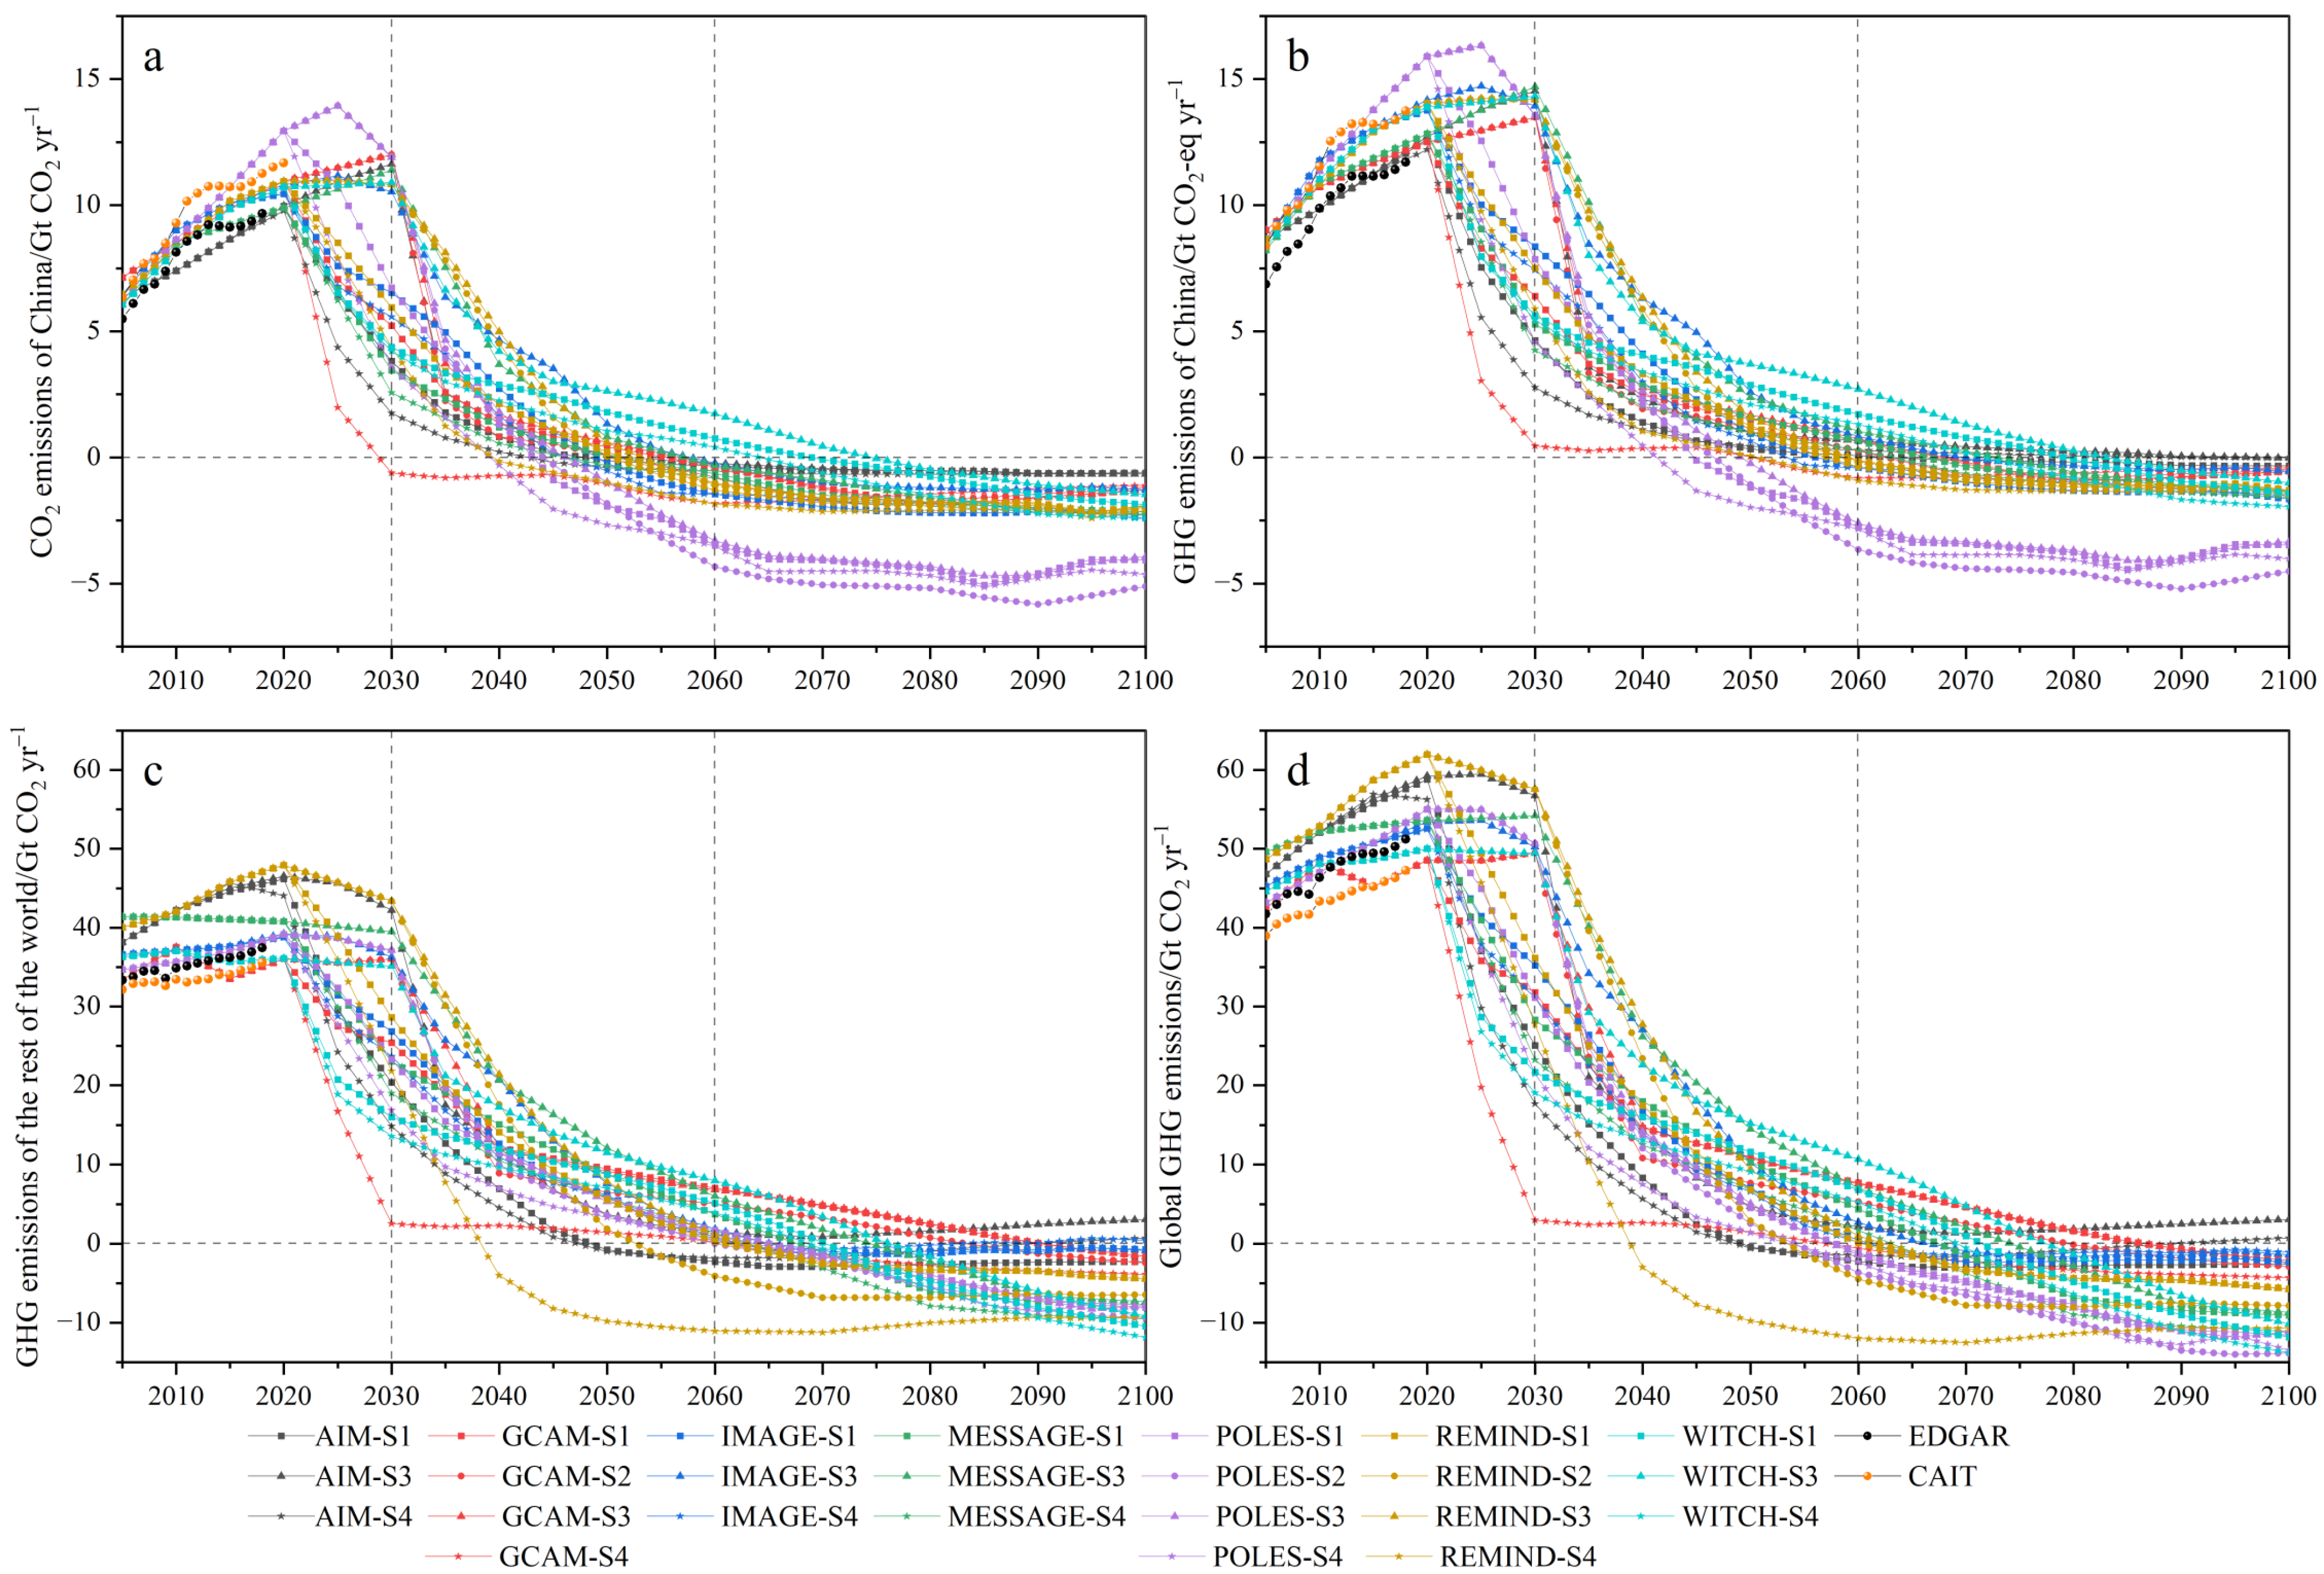
3.1. Global and China’s Emission Pathways

To understand China’s role in climate change mitigation, we first looked into the levels of emission pathways. Figure 1 shows China’s CO2 emission pathways, China’s GHG emission pathways, and global GHG emission pathways. Emissions of nonCO2 GHGs are translated into CO2-equivalent emissions, with the 100-year Global Warming Potential (GWP100) metric being the conversion factor [45]. While various issues have been raised associated with GWP100 [46,47,48,49,50], we used this metric for our analysis, following the decision taken by the Parties to the Paris Agreement [45].
Under all pathways, China’s CO2 emissions peak before 2030. The pathway with the highest peak of CO2 emissions is from POLES, with 16.3 GtCO2 in 2025. The pathway with the lowest peak of CO2 emissions and earliest peak date is from AIM-S4, which gives 12.2 GtCO2 in 2020. Since CO2 is the dominant GHG emitted from China, the trends of CO2-equivalent (GWP100 basis) emissions largely follow those of CO2. In addition, these pathways show that China is projected to achieve net zero CO2 emissions before 2060, except those from WITCH. CO2 emissions of POLES are significantly lower than others after 2060. We further found that more than half of the pathways considered do not achieve net zero GHG emissions in China by 2060. If net zero GHG emissions are achieved, this happens one to two decades after net zero CO2 emissions have been achieved, as also found by Tanaka and O’Neill [25] at the global level and van Soest et al. [53] at the regional level. WITCH-S3 is the scenario that reaches net zero CO2 emissions at last (in 2075), arriving at net zero GHG emissions in 2084.

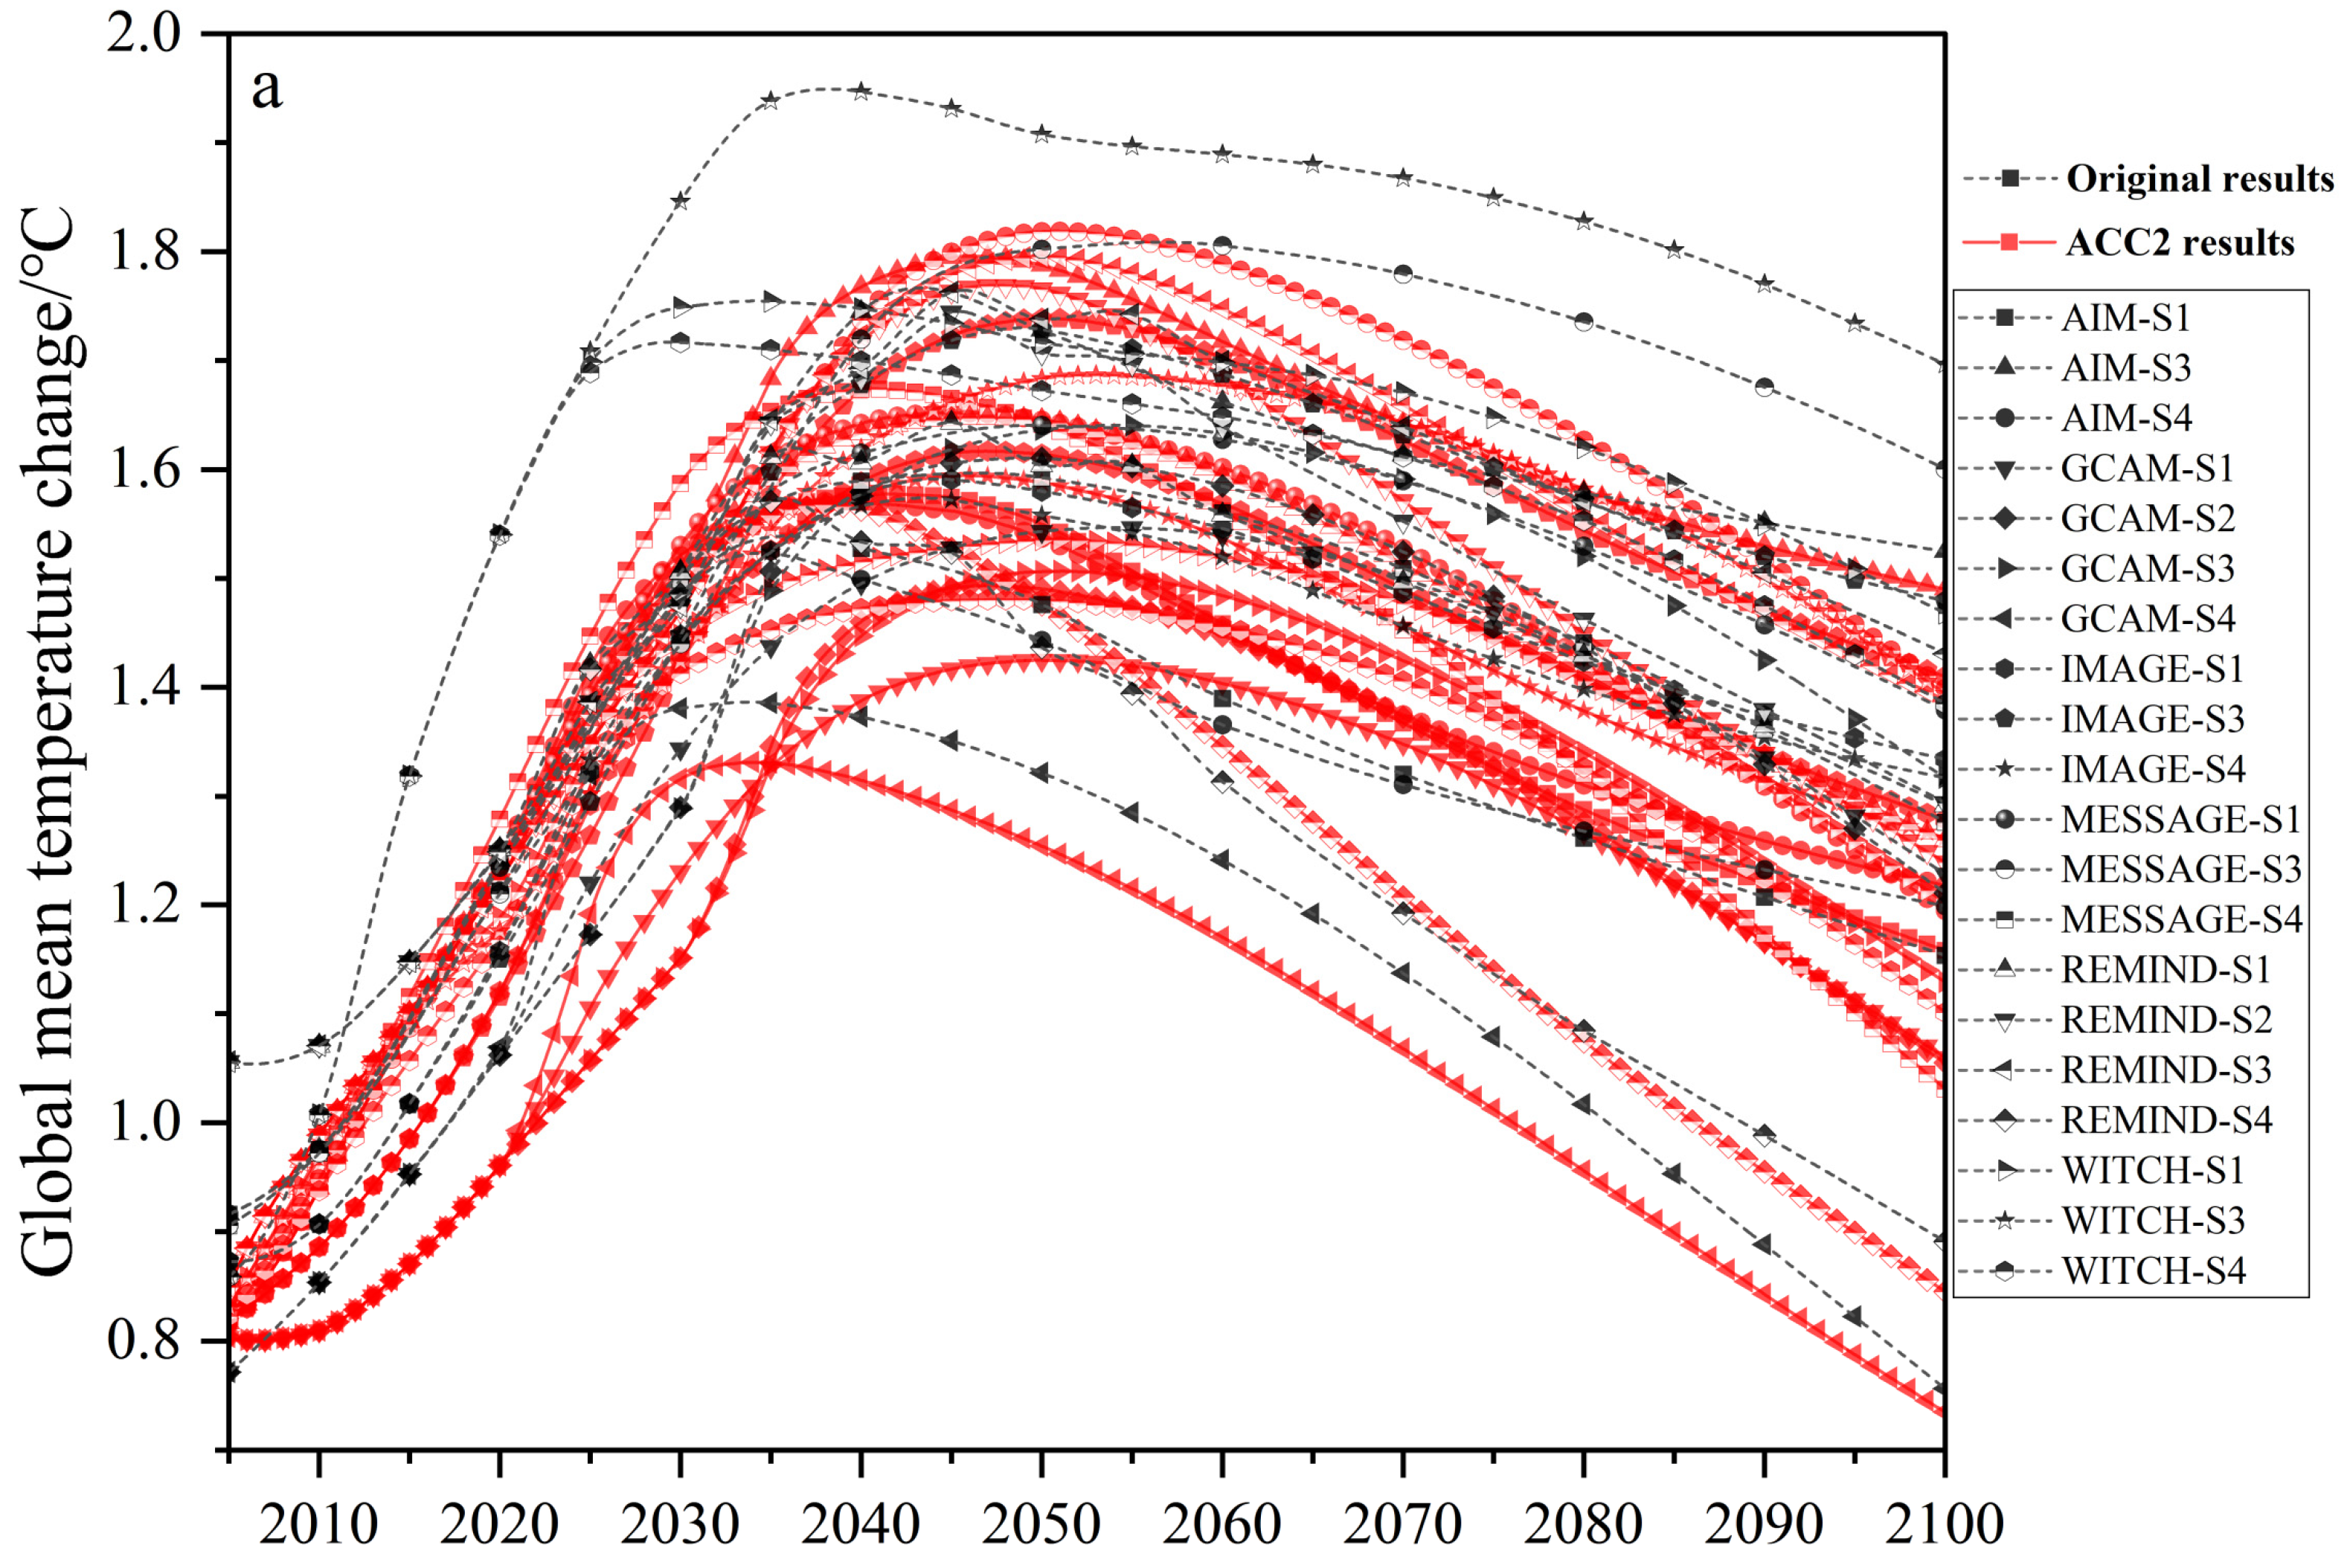
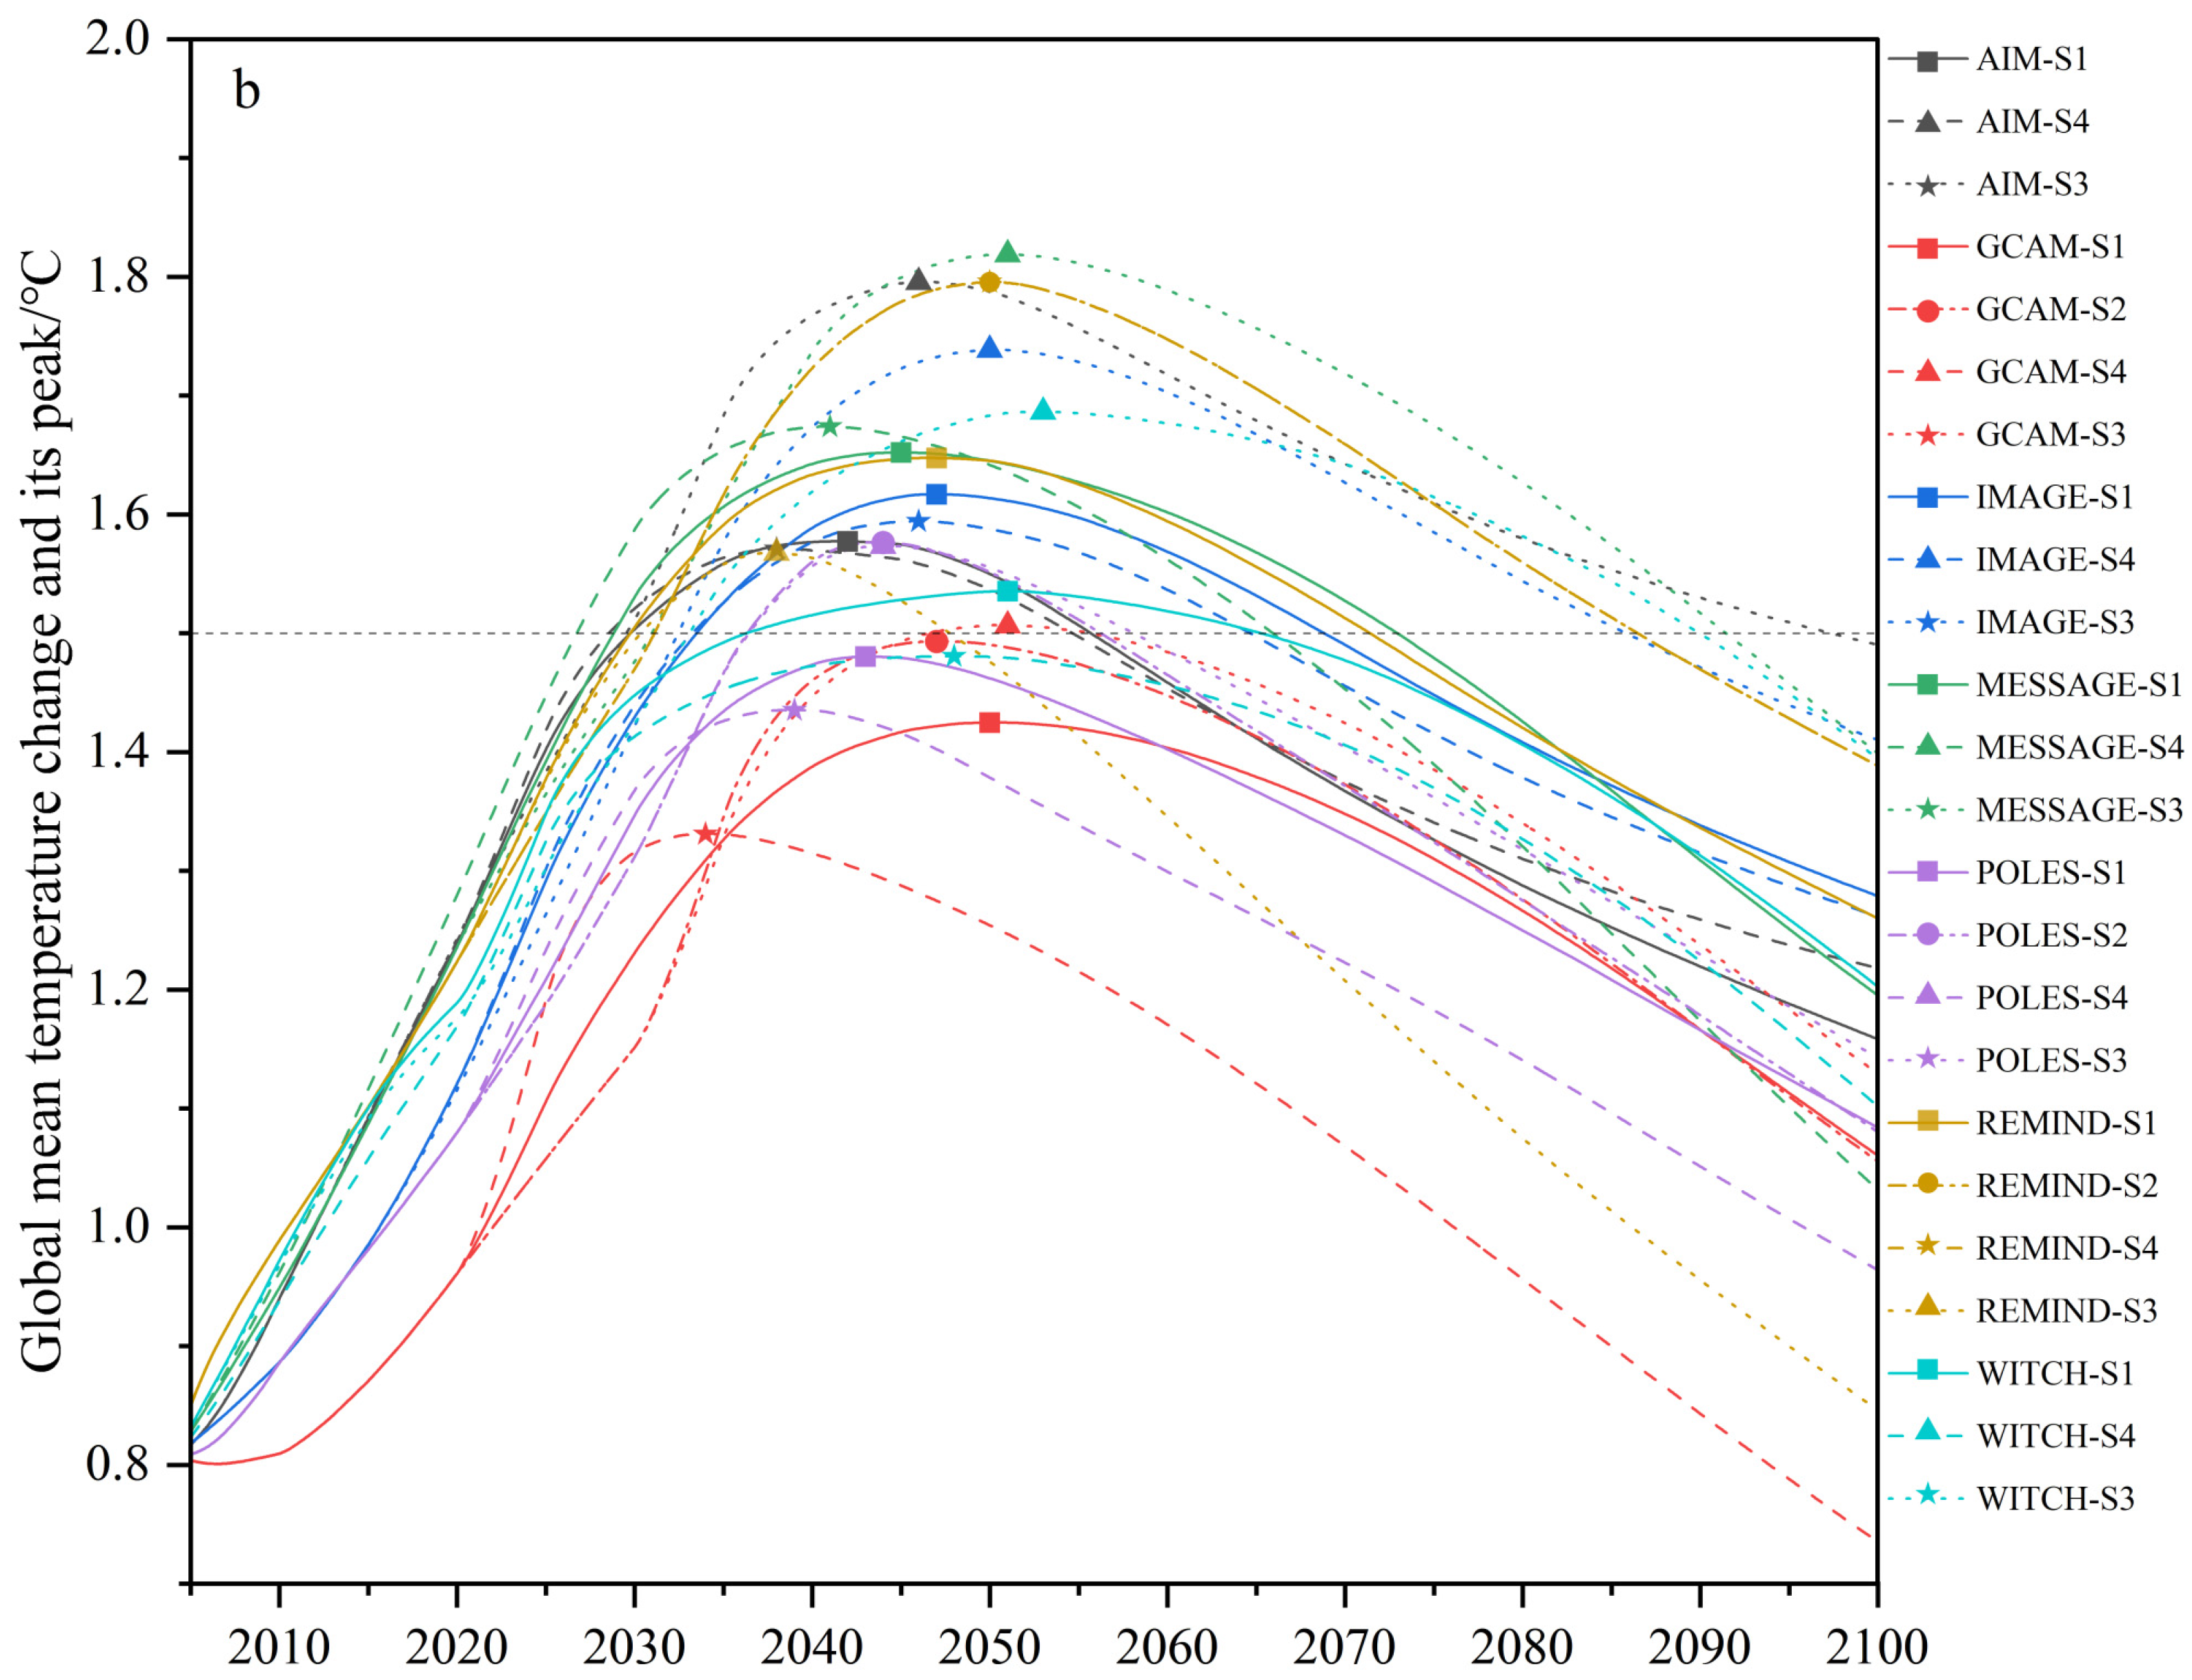
3.2. Global Mean Temperature Projections

The original database contains global mean temperature projections for most of the emission pathways used in this study, which can be compared with corresponding temperature projections from ACC2. The results (Figure 2a and Figure S1 in Supplementary Materials) show that temperature outcomes of ACC2 agree reasonably well with respective original projections, except for a few cases of WITCH. We therefore used ACC2 to examine the temperature implications of emission pathways in the analysis that follows. This approach allows evaluating the temperature implications of emission pathways based on the same methodological framework.
Figure 2b shows a considerable range in the global mean temperature pathways calculated from ACC2. The temperature peaks lie between 1.33 °C (GCAM-S4) and 1.82 °C (MESSAGE-S3), and the year that reaches peak temperatures varies from 2034 (GCAM-S4) to 2053 (WITCH-S3). All pathways eventually come to the 1.5 °C level by 2100, with the AIM-S3 scenario achieving it at last (in 2098). Most of these pathways show an overshoot above the 1.5 °C target, a finding consistent with IPCC [4]. There are six pathways that keep the global mean temperature change below 1.5 °C all the time, while none of the S3 scenarios achieve the 1.5 °C target without overshoot.

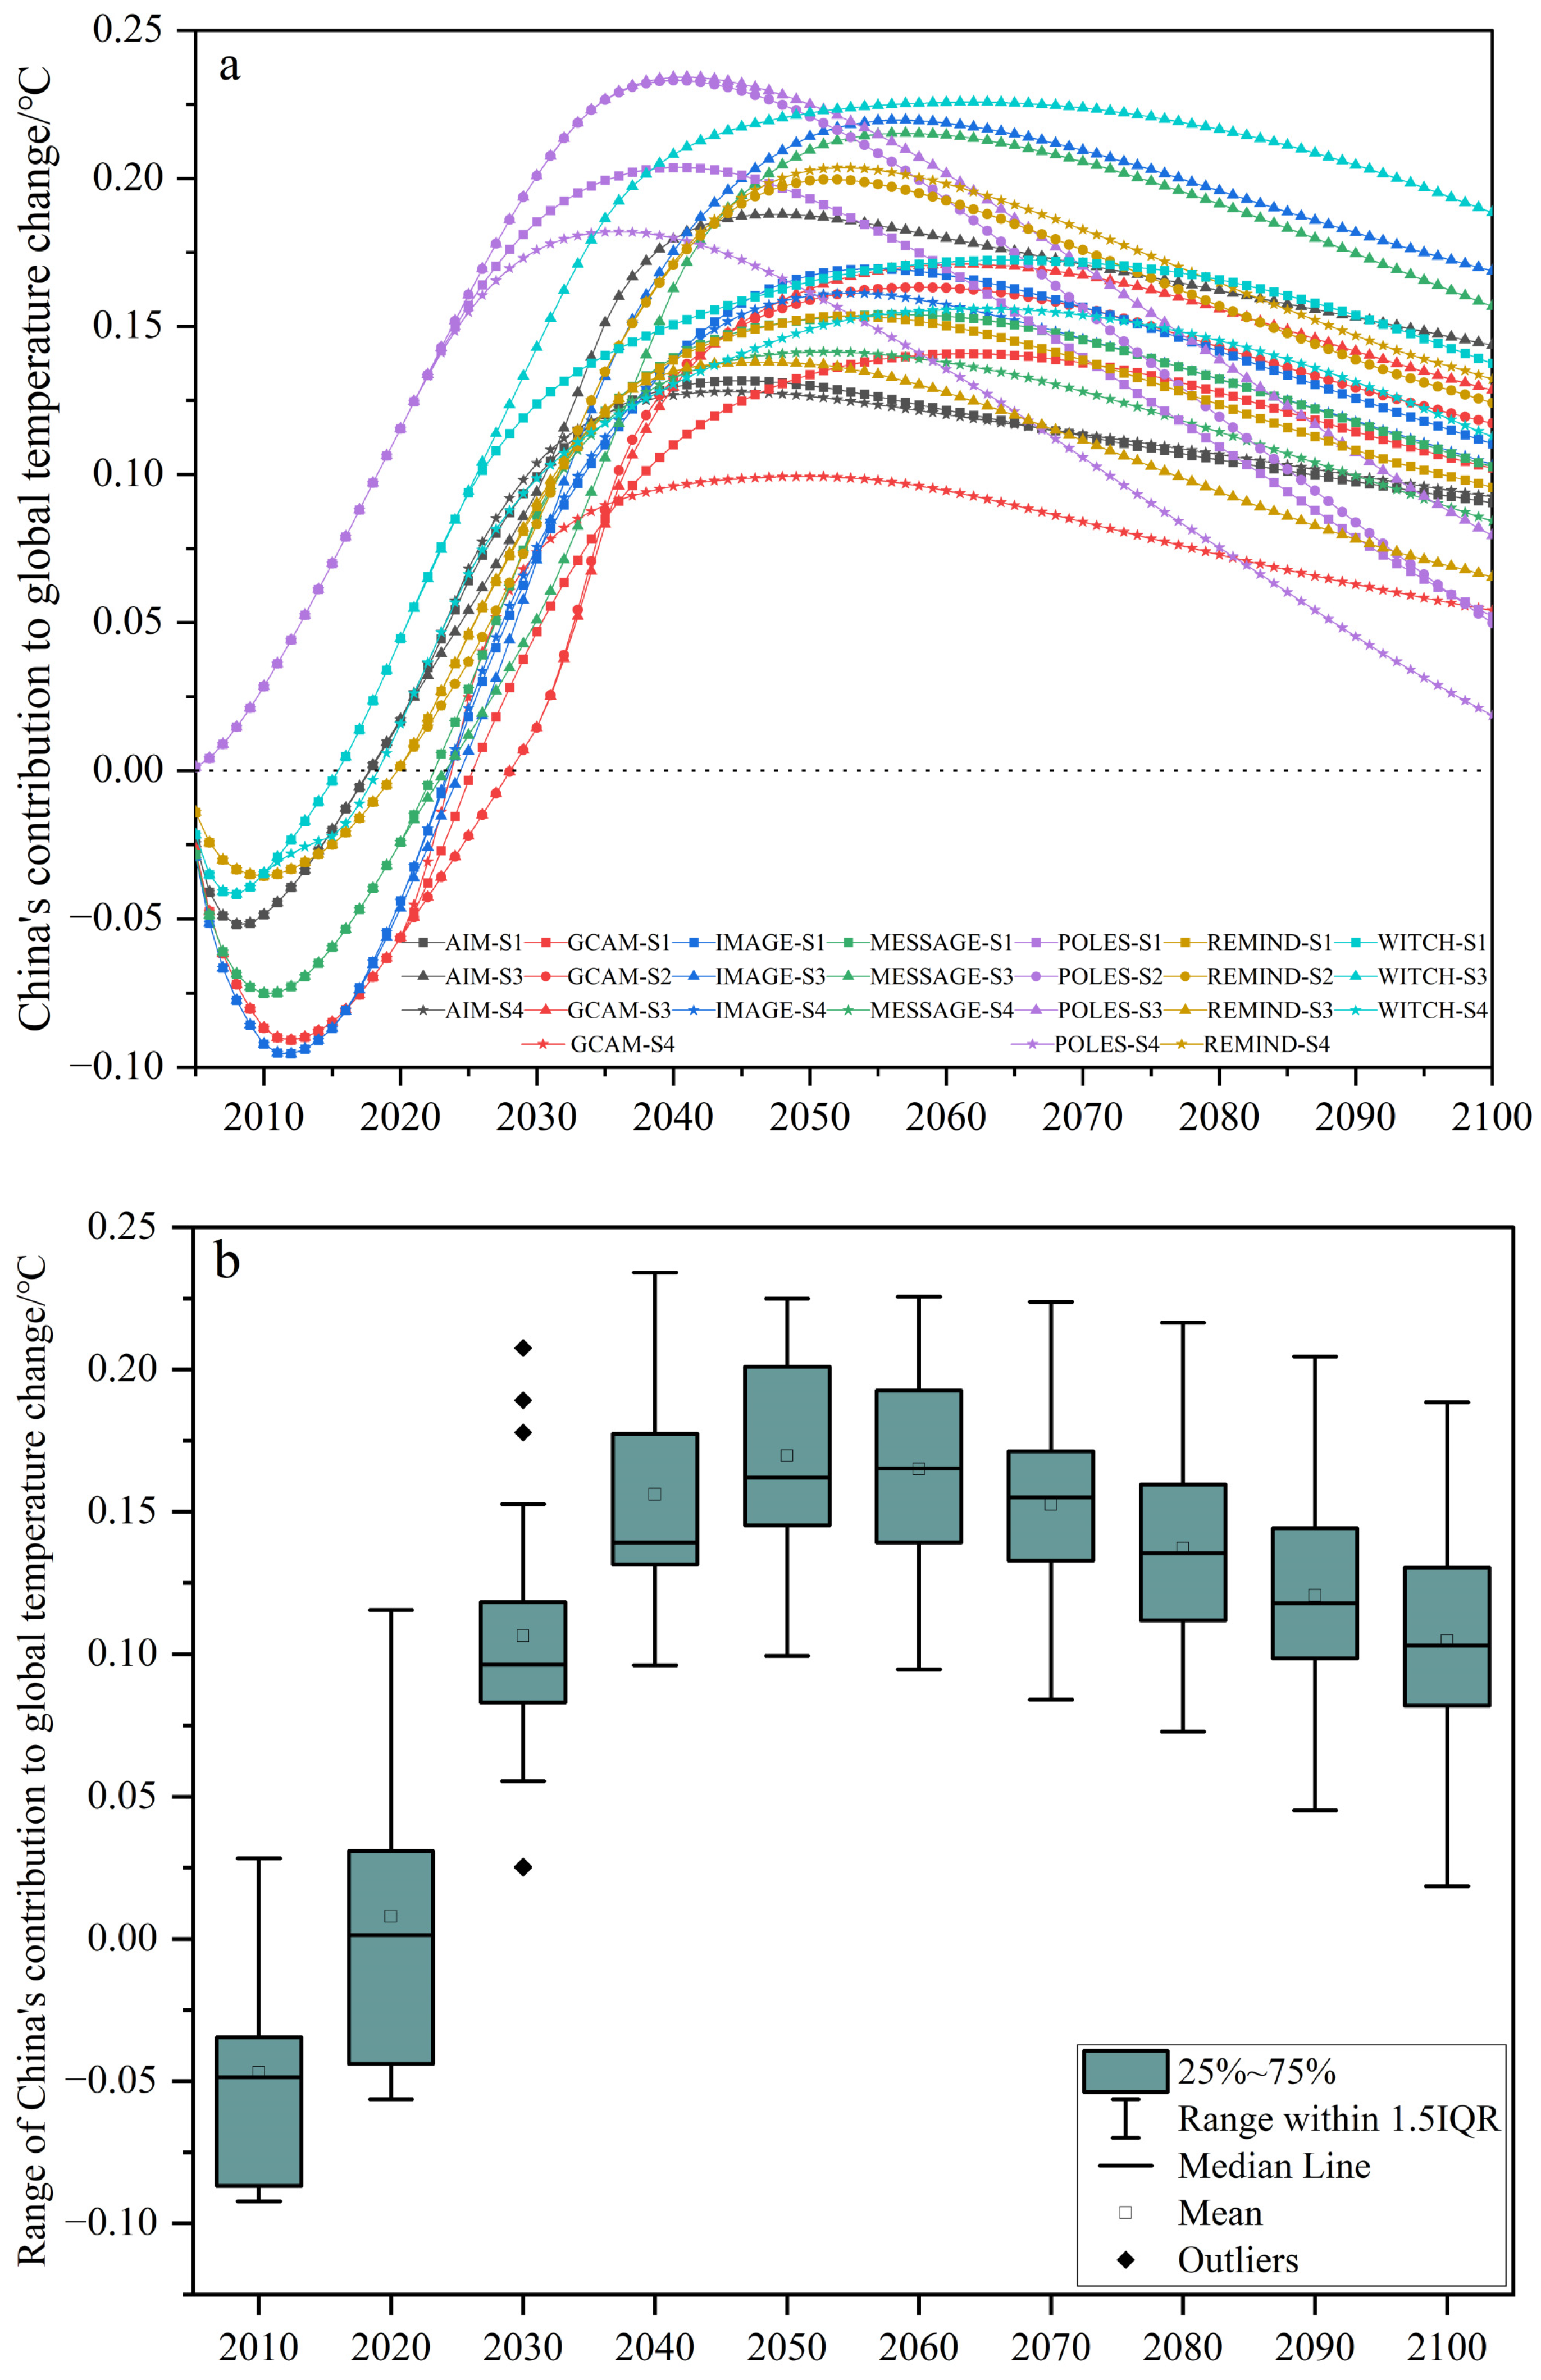
3.3. Effects of China’s Emissions on the Global Mean Temperature

Now we focus on emissions from China and explore how they influence the global mean temperature. We used the emissions of all countries except China from the AIM-S1 scenario, which is roughly in the middle of the ensemble (Figure 1c,d), as a baseline and calculated the temperature change. We then added China’s emissions from each IAM on the baseline and calculated the temperature change. The difference in warming between the two temperature time series for each IAM is shown in Figure 3. The way in which China will influence the global mean temperature is highly dependent on pathways (Figure 3a). Overall, China’s temperature contributions are negative until around 2025 (2028 at the latest), with several pathways being an exception, and then they turn positive thereafter. Pathways from POLES, among others, are such examples, with the highest contribution at 0.234 °C in 2041. Negative contributions in early periods are caused by the cooling effect of air pollutants [54,55,56].
Figure 3b shows that China’s contribution to the global mean temperature since 2005 is as high as 0.170 °C [0.099, 0.223] in the middle of the century (in 2051), dropping to 0.105 °C [0.019, 0.188] by the end of this century (square brackets indicate the range of pathways). The peak contributions of these pathways range from 0.099 °C to 0.234 °C, and the years reached are distributed between 2036 and 2065. In comparison, Chen et al. [33] estimated that China’s carbon neutrality can reduce global warming by 0.16–0.21 °C in 2100. The difference in the estimates of the end-of-the-century temperature contribution between the two studies can be explained in the following. The Chen study considered China’s carbon neutrality pathways based only on CO2 emissions from 2020 onward. In contrast, our study deals with 1.5 °C pathways involving deeper mitigation than that required for carbon neutrality and considers GHG emissions since 2005. While our emissions starting in 2005 should increase China’s contribution to the global mean temperature, this effect is overcompensated by net negative CO2 emissions after carbon neutrality. As a result, it causes a lower temperature contribution by China at the end of the century than estimated in the Chen study. The difference between the two studies also appears in China’s temperature contribution in the middle of the century primarily because of CH4 considered in our study to be discussed in the next section.

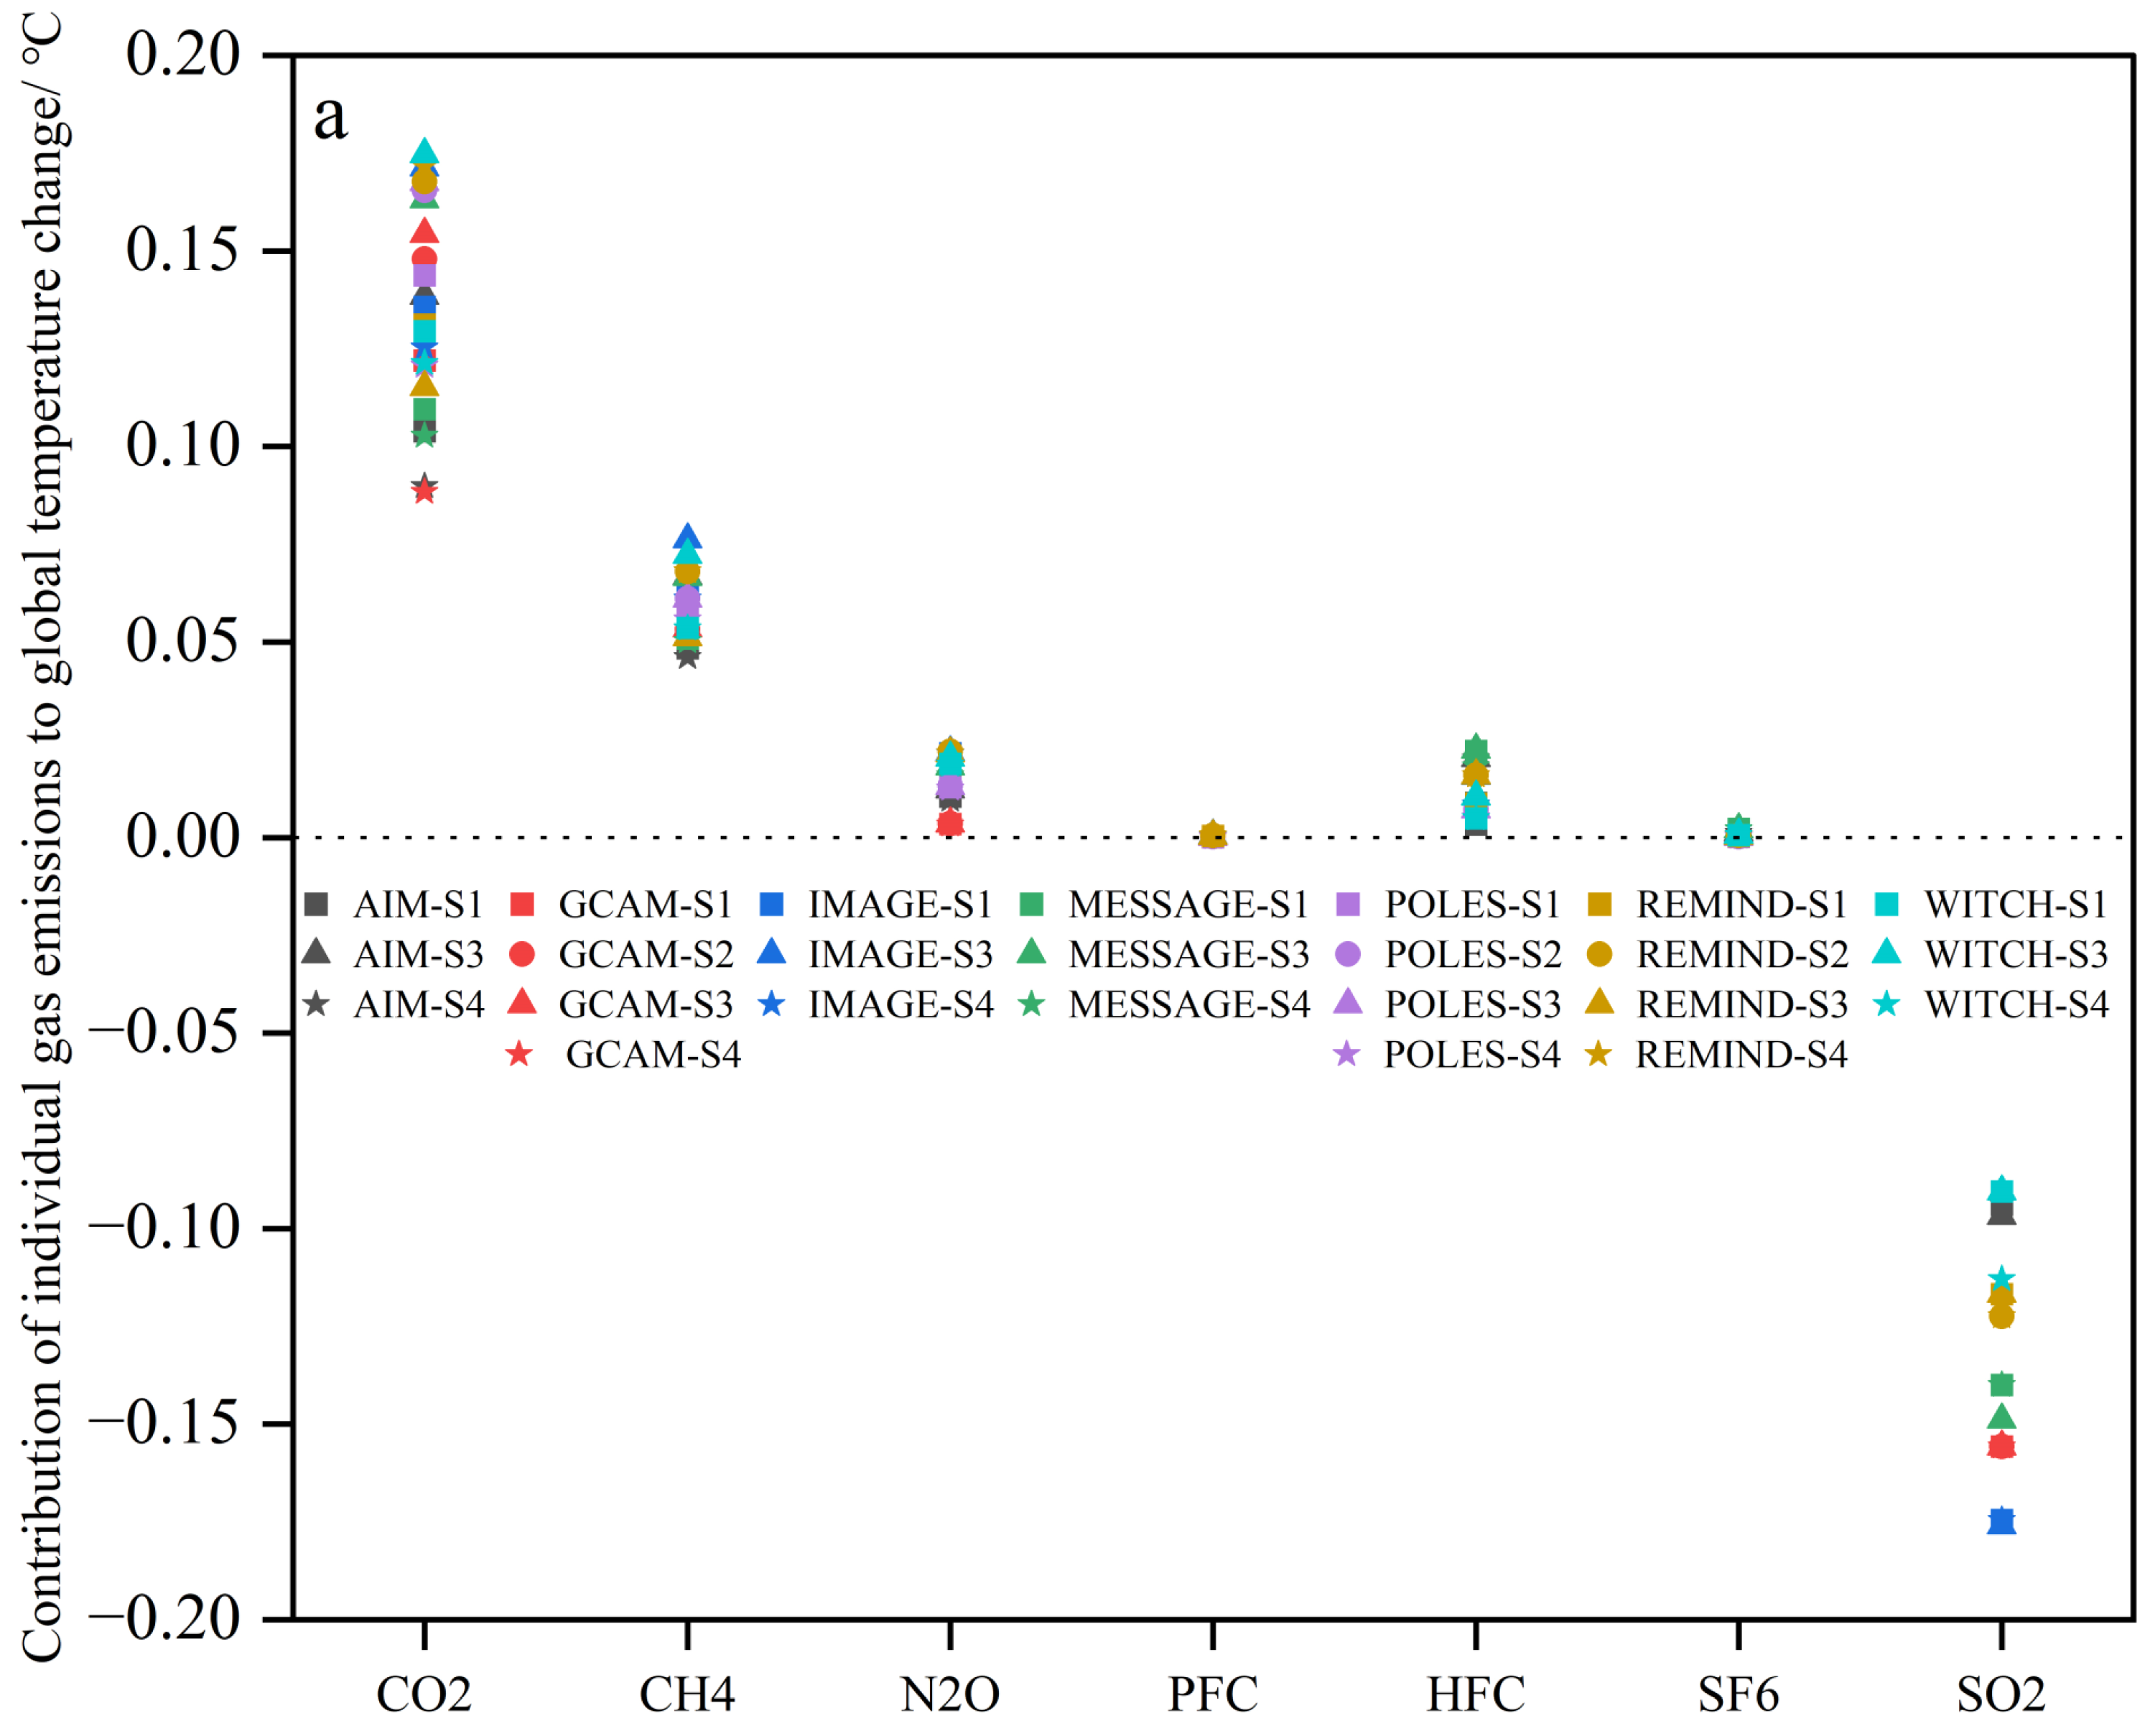
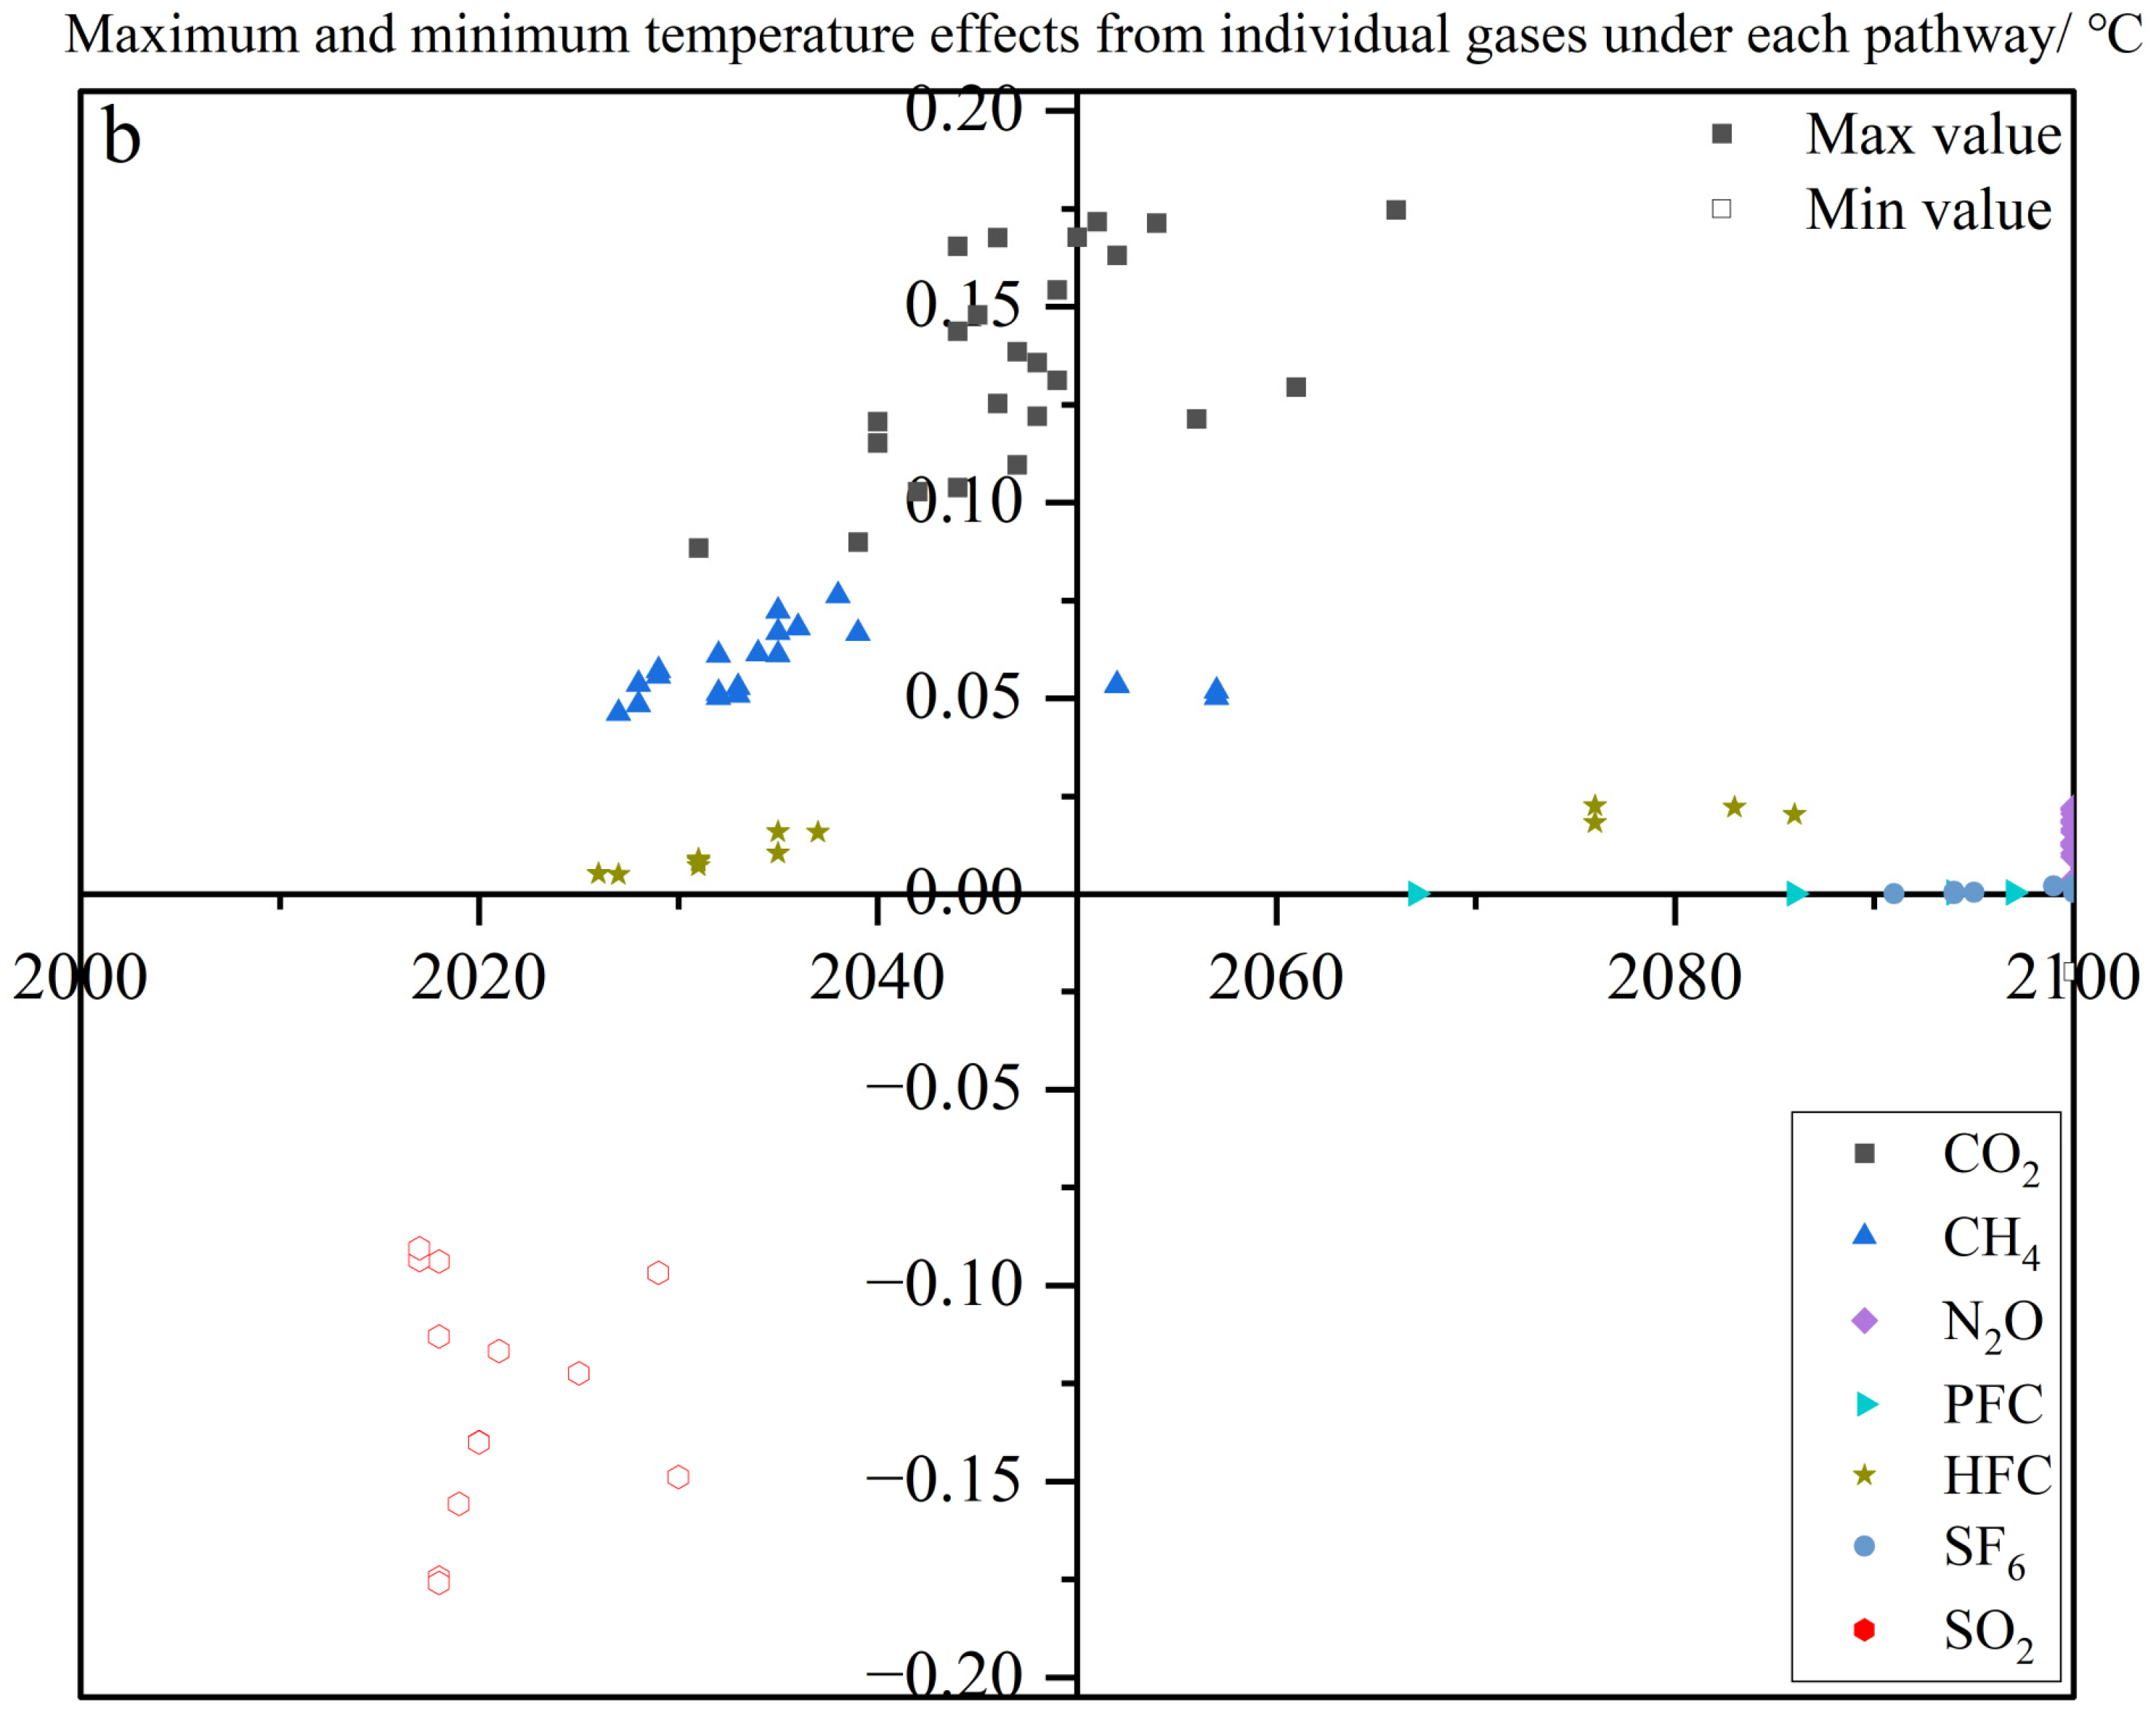
3.4. Effects of Emissions from Individual Gases and Aerosols on Global Mean Temperature

We further analyzed the effect of individual gases and aerosol precursors emitted by China on the global mean temperature. Our analysis considers Kyoto gases, as well as SO2, which has strong cooling effects. Note that other air pollutants, such as NOx, CO and VOC, are not considered here because they are not part of Kyoto gases and are not primarily crucial in the analysis here in terms of the effect on global warming through their influence on CH4 and ozone [57]. We found that climate forcers that are important for China’s temperature contributions are CO2, CH4, and SO2 (Figure 4a and Figure S2 in Supplementary Materials). The contribution from SO2 is also important but in the opposite direction. The peak contribution from CO2 is by far the largest, followed by that from CH4. The peak contributions from N2O and HFC are smaller than those from CO2 and CH4, and they can occur later in this century or beyond.
Different GHGs and air pollutants influence the temperature in different ways (Figure 4b). The years of peak contribution of CO2 occur between 2040 and 2060. Those of CH4 and SO2 happen earlier (in around the 2030s and 2020s, respectively), reflecting the short-lived nature of these components [58] and the early mitigation efforts assumed in the emission pathways (the moderate scatter of the points in Figure 3b shows that IAMs are broadly consistent with each other in the emission pathways of each species). The temperature impact from N2O increases over time, indicating the long-lived nature of this gas and the difficulty in abating its emissions from certain sectors.

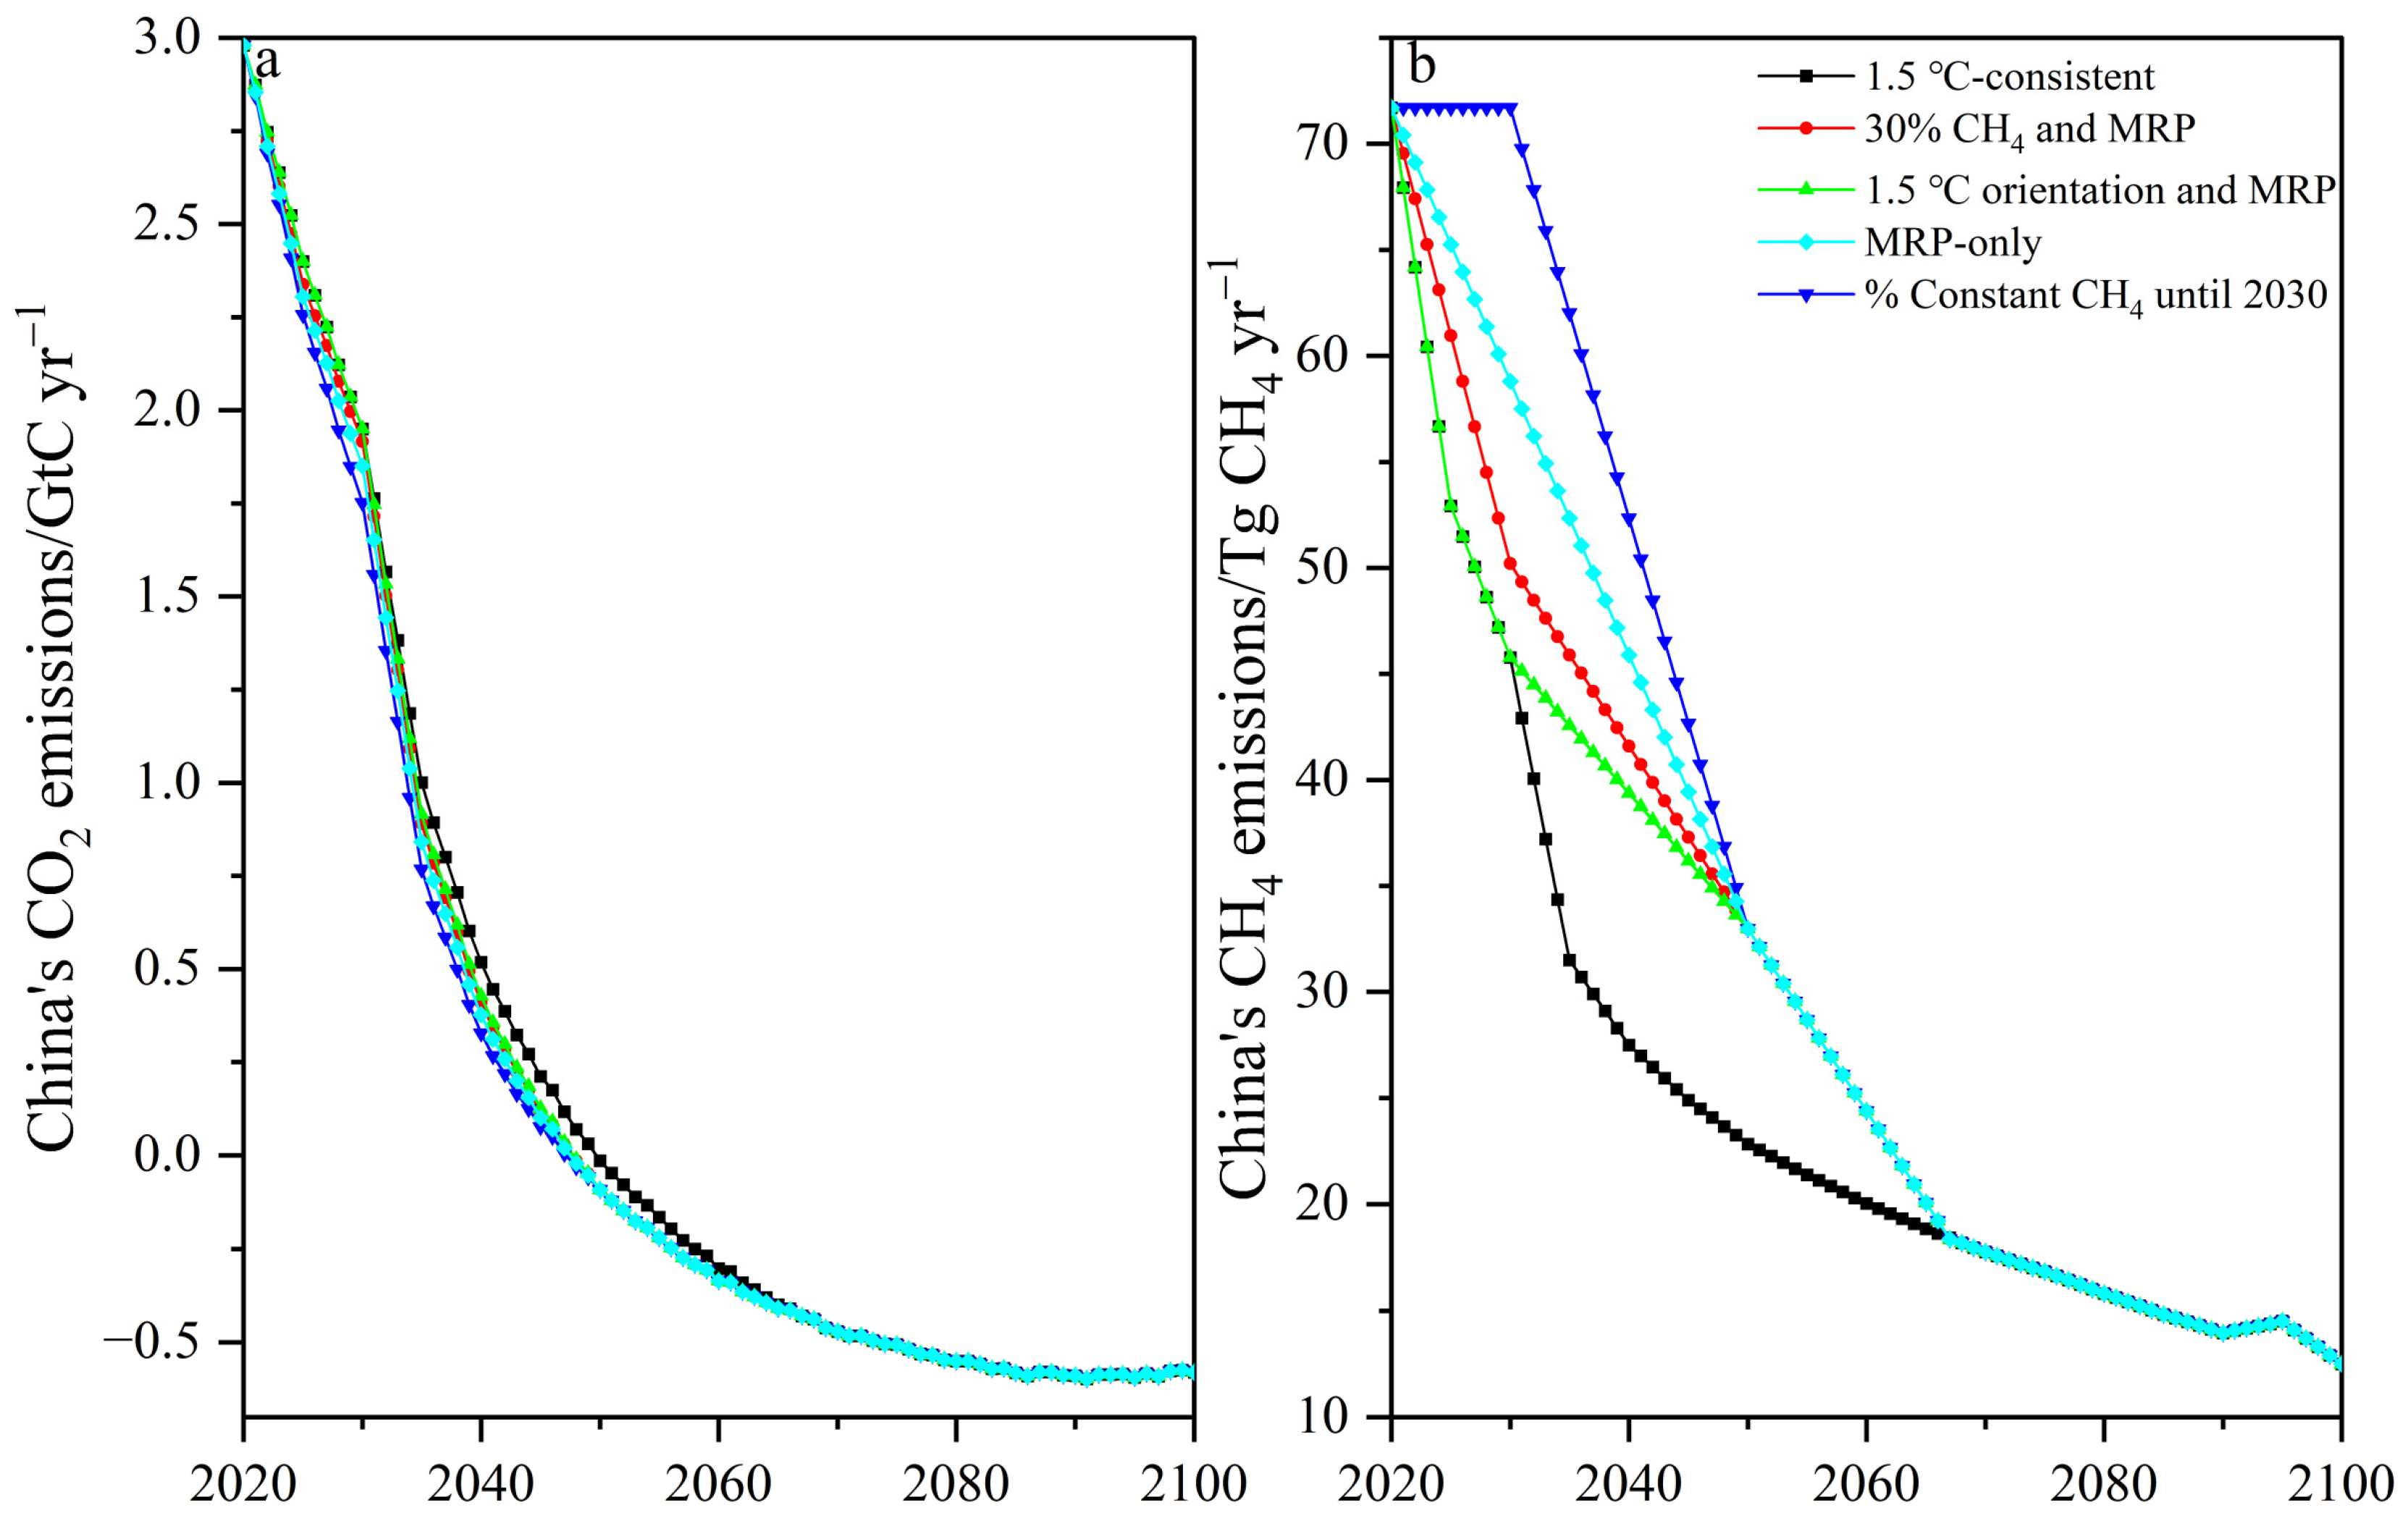
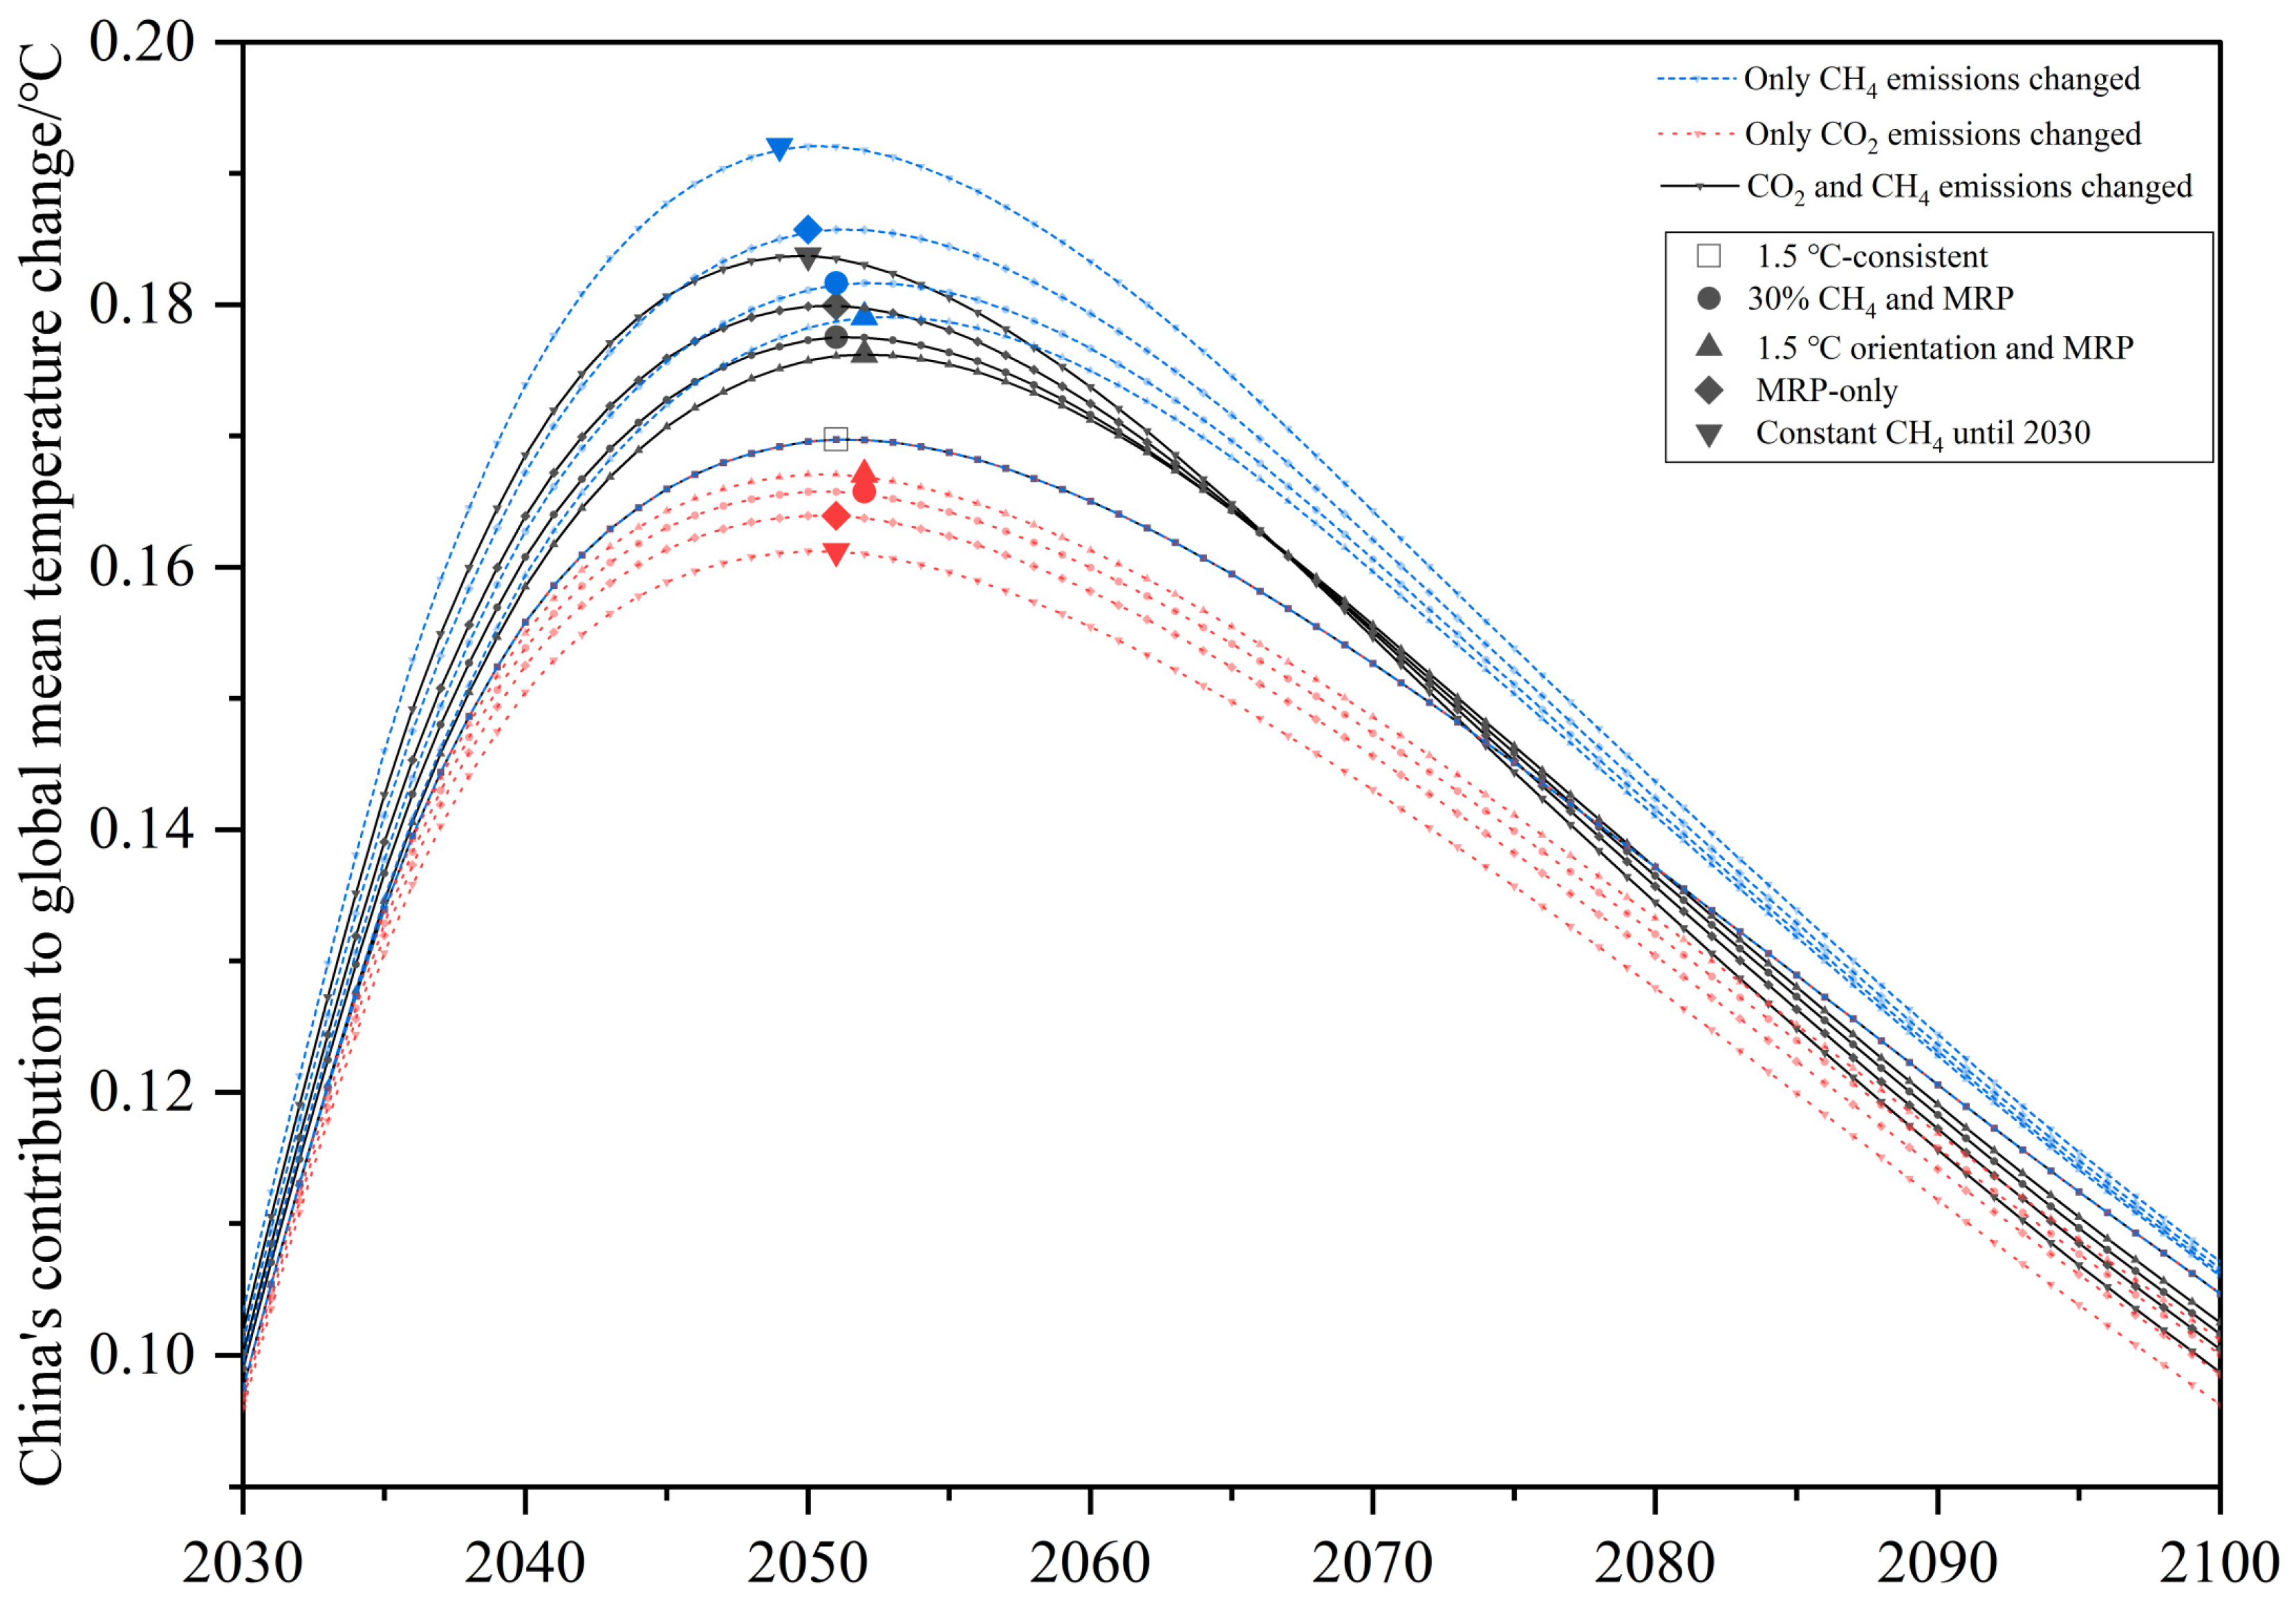
3.5. China’s CH4 Mitigation

The results of the previous section suggest that both CO2 and CH4 play an important role in determining the temperature contribution of China’s emissions. These two gases are the most important long-lived and short-lived climate forcers to the current warming, respectively [8]. It was shown that ratios of CO2 and CH4 emissions would influence global mean temperature projections [27]. Any pledge or target expressed as GHGs is therefore ambiguous in terms of what this might mean for the global temperature change [25,50,59]. Here we explore how the proportions of these two gases can affect China’s contributions to the global mean temperature by developing scenarios dedicated to this question, in particular, the role of CH4 mitigation in meeting the 1.5 °C target. Near-term CH4 mitigation is gaining increasing attention [60,61], and its long-term implications have been analyzed by several previous studies at the global level [62,63,64]. However, this has not been analyzed specifically for China’s emissions, to our knowledge.
During COP26 in November 2021, the U.S. and the EU pledged to reduce anthropogenic CH4 emissions by 30% by 2030 compared with 2020 levels [65]. Many countries followed suit, although China and India did not indicate participation in this pledge. Ocko et al. [66] showed that global CH4 emissions could be cut by 57% in 2030 based on existing technologies, while Höglund-Isaksson et al. [67] gave the maximum technically feasible reduction potential (MRP) of 54% in 2050 compared to 2015 levels. Given these political pledges and mitigation assessments, we set up the following scenarios, called China’s CH4 mitigation scenarios (Table 3 and Figure 5).
The way in which we constructed China’s CH4 mitigation scenarios is as follows. We took the 1.5 °C-consistent emission scenario, the average of the 24 scenarios analyzed earlier (Table 1), as the reference here. We then varied the CH4 emission pathway in the 1.5 °C-consistent scenario to reflect alternative cases, such as a 30% CH4 emission reduction by 2030 relative to 2020 levels. Since the 1.5 °C-consistent scenario already assumes very ambitious CH4 mitigation, we increased CH4 emissions in all other scenarios relative to the reference level in the 1.5 °C-consistent scenario (Figure 5b). To understand the trade-off between the abatement of CO2 and CH4 emissions, we further hypothetically decreased CO2 emissions in each scenario by the amount equivalent to the reduction in CH4 emissions relative to the level in the 1.5 °C-consistent scenario. In doing so, we equated CH4 emissions on a common scale of CO2-equivalents by using GWP100. This approach allows exploring the temperature implication of emission pathways with different GHG compositions while maintaining the same total GHG emissions each year. Although it is known that this method does not ensure the same temperature outcome [50,68,69], we applied this method because GWP100 has been adopted by the Parties to the Paris Agreement for its implementation [45]. Note that emissions of the ROW are kept the same with the levels in the 1.5 °C-consistent scenario.
Large differences in temperature contributions were found around 2050 across the scenarios with changes in both CO2 and CH4 emissions (black lines of Figure 6), while those in 2030 and 2100 were less pronounced. In 2050, the temperature contribution of the Constant CH4 until 2030 scenario is 0.184 °C, 0.014 °C higher than the 1.5 °C-consistent scenario. In 2100, on the contrary, the temperature contributions of all scenarios become lower than that of the 1.5 °C-consistent scenario. The opposite effect on the temperature depending on the period can be explained by the distinct temperature effects of CO2 and CH4 emissions [58].
Figure 6 also shows the effects of CO2 and CH4 separately (red and blue lines, respectively, of Figure 6). Differences in peak warming are larger in the CH4-only cases than in the cases changing both CO2 and CH4, with the largest contribution of 0.192 °C in the Constant CH4 until 2030 scenario. On the other hand, differences in peak years are only three years (2050 for the Constant CH4 until 2030 scenario and 2053 for the 1.5 °C-consistent and MRP scenario). Thus, a stronger near-term CH4 mitigation in China can have a pronounced effect on reducing temperature contribution in the middle of the century. However, it may not bring the earlier peak year of China’s contribution to the warming.
Furthermore, our results indicate that CH4 has stronger effects on the near-term temperature than CO2 does in terms of the emission of the same quantity (GWP100 basis). The temperature contribution of CH4 in 2050 in the Constant CH4 until 2030 scenario is 0.022 °C higher than the 1.5 °C-consistent scenario. CO2’s warming contribution in the Constant CH4 until 2030 scenario is 0.009 °C lower than the 1.5 °C-consistent scenario. In 2100, on the contrary, the temperature difference for the scenarios for CH4 is only 0.002 °C, but those for CO2 remain at the same level persistently (0.009 °C).
These results are qualitatively consistent with Sun et al. [64], a related study on the global scale. The Sun study also reported a large temperature effect of near-term CH4 mitigation in the middle of the century (about 0.2 °C) but showed a small temperature effect at the end of this century (0.05 °C). It also shows that the temperature effect of CO2 mitigation persists throughout the century.
The trade-off between CO2 and CH4 can be further seen in Table 4. If we look at the pathway changing only CH4 in the Constant CH4 until 2030 scenario, the temperature effect of CH4 is more pronounced in 2050 (13.27% increase) than in 2100 (2.33% increase). On the other hand, if we look at the case changing only CO2, the temperature effect of CO2 is larger in 2100 (8.05% decrease) than in 2050 (4.93% decrease). In pathways changing both CO2 and CH4, the interplay of two gases becomes evident. The temperature effect from CH4 outcompetes that of CO2 in the middle of the century (8.35% increase). However, the effect from CO2 outcompetes at the end of the century (5.71% decrease).

4. Discussion

4.1. Significant Contribution of China’s Mitigation to the Global Efforts toward the 1.5 °C Target

The magnitude of China’s contribution to the global mean temperature over time can differ significantly, even if all pathways considered are intended for the 1.5 °C target. The peak of China’s temperature contribution from the average of the IAM pathways in 2051 is 0.170 °C with the range of 0.099 °C to 0.223 °C. The peak years of these pathways range from 2036 to 2065. Thereafter, China’s contribution will decline to 0.105 °C [0.019, 0.188] in 2100. The significant temperature contribution of China, as well as the range of contributions, highlight the importance of the course of China’s mitigation actions toward the 1.5 °C target.

4.2. Differences in the Temperature Contribution from Individual Gases

Emissions of CO2, CH4, and SO2 play a major role in determining the temperature contribution from China. Our pathway analysis showed that peak temperature contributions of these three gases are 0.136 °C [0.088, 0.175], 0.058 °C [0.046, 0.076], and −0.132 °C [−0.176, −0.091], respectively. The peak (negative) contribution from SO2 occurs around 2020 in most pathways, while that from CO2 and CH4 can be found around 2050 and 2030, respectively. Most pathways showed the peak contribution from China’s CO2 emissions earlier than 2060, the target year of China’s carbon neutrality.
Even though SO2 brings about a short-term cooling effect, it is a source of air pollution and harmful to human health [70]. There is thus a trade-off for SO2 abatements; while reducing the emissions of SO2 improves air quality, it unmasks warming currently hidden by SO2. However, the implementation of clean air policies is rapidly progressing in China [20]. With further penetration of clean air policies in China, the cooling effect of aerosols will weaken, giving rise to warming, which makes it important to tackle CH4 mitigation in China to reduce near-term warming, a point that has been made globally [8].

4.3. Impact of China’s CH4 Mitigation on the Global Peak Temperature

The significance of China’s CH4 mitigation in determining the peak temperature brings us to the question of how China should tackle CH4 mitigation. If China leverages a shift from the Constant CH4 until 2030 scenario (i.e., maintaining the same CH4 emissions from 2020 until 2030) to the 1.5 °C-consistent scenario, China’s contribution to peak temperature in 2050 will be decreased by 7.61% (i.e., the case changing both gases). Therefore, near-term CH4 actions can reduce China’s peak impact on global warming while noting that the year of peak temperature contribution is largely unaffected.
Abatement strategies on CH4 should be determined by policy priorities. For the purpose of reducing China’s temperature contribution in the middle of the century, taking deep near-term CH4 mitigation is an effective policy choice. However, this is not necessarily an adequate measure if the purpose is to reduce China’s contribution to the end-of-the-century temperature. There are other concerns that are outside the scope of this study but are relevant to such policy decisions: most notably, the CH4 effect on air pollution through the production of tropospheric O3 [71]. China’s CH4 mitigation strategies may further help enhance the coordination of international climate efforts with other parties.
There are many mitigation opportunities for CH4. The energy sector, especially coal and natural gas [72], accounts for 46% of the anthropogenic CH4 emissions from China in 2019 [73]. The agricultural sector is an equally important CH4 source, although it is known to be generally more difficult to mitigate CH4 from the agricultural sector than from the energy sector.
Finally, early CH4 action from China can reduce the global peak temperature in mid-century, potentially contributing to reducing the temperature overshoot [74] along the way toward the 1.5 °C target. On the other hand, since CO2 is the determinant for the long-term temperature outcome, it is of paramount importance that CH4 mitigation goes hand in hand with CO2 mitigation. Our findings also underscore the need for early CO2 mitigation in China to keep up with the global challenges associated with the long-term temperature goal.

5. Conclusions

This study explored how China’s emissions can shape global mean temperature projections toward the 1.5 °C target and examined the contributions of individual gases separately. It further discussed the trajectories to reduce China’s contribution to global warming from the perspective of CH4 mitigation. The results suggest that China’s contribution to global warming in 2050 (since 2005) is 0.17 °C on average, with a range of 0.1 °C to 0.22 °C. The IAMs show large differences in temperature effects from China’s emissions due to the differences in CO2, CH4, and SO2. China’s near-term CH4 mitigation reduces the peak temperature at the middle of the century, while having little effect on the end-of-the-century temperature. Thus, greater efforts to mitigate China’s CH4 emissions in the near term can reduce the adverse impact of overshooting the 1.5 °C warming level.
Our study investigated the temperature outcome of China’s emission pathways without considering economic implications. Further research can explore China’s cost-effective strategies for CO2 and CH4 mitigation toward the 1.5 °C target.

Supplementary Materials

The following supporting information can be downloaded at: https://www.mdpi.com/article/10.3390/en15166002/s1, Figure S1: The results of global mean temperature change between the original and the ACC2 for different pathways; Figure S2: Global mean temperature change caused by China’s emissions of individual gases; Figure S3: China’s contribution to global warming under the different CH4 mitigation scenarios.

Author Contributions

Conceptualization, W.X. and K.T.; methodology, W.X. and K.T.; formal analysis, W.X.; writing—original draft preparation, W.X. and K.T.; writing—review and editing, P.C. and L.Y. All authors have read and agreed to the published version of the manuscript.

Funding

This research was funded by the National Research Agency in France under the Programme d’Investissements d’Avenir, grant number ANR-19-MPGA-0008.

Institutional Review Board Statement

Not applicable.

Informed Consent Statement

Not applicable.

Data Availability Statement

All data supporting the results are available on Zenodo with the doi:10.5281/zenodo.5844488.

Acknowledgments

W.X. gratefully acknowledges financial support from the China Scholarship Council.

Conflicts of Interest

The authors declare no conflict of interest.

References

  1. IPCC. Summary for Policymakers. In Climate Change 2022: Impacts, Adaptation, and Vulnerability. Contribution of Working Group II to the Sixth Assessment Report of the Intergovernmental Panel on Climate Change; Cambridge University Press: Cambridge, UK, 2022; In Press. [Google Scholar]
  2. Yokohata, T.; Tanaka, K.; Nishina, K.; Takahashi, K.; Emori, S.; Kiguchi, M.; Iseri, Y.; Honda, Y.; Okada, M.; Masaki, Y.; et al. Visualizing the Interconnections Among Climate Risks. Earths Future 2019, 7, 85–100. [Google Scholar] [CrossRef]
  3. UNFCCC. Adoption of the Paris Agreement; FCCC/CP/2015/L.9/Rev.1; UNFCCC: New York, NY, USA, 2015. [Google Scholar]
  4. IPCC. “Global Warming of 1.5 °C”, Chapter 3: Impacts of 1.5°C of Global Warming on Natural and Human Systems; IPCC Special Report; IPCC: Geneva, Sswitzerland, 2018. [Google Scholar]
  5. Hoegh-Guldberg, O.; Jacob, D.; Taylor, M.; Bolaños, T.G.; Bindi, M.; Brown, S.; Camilloni, I.A.; Diedhiou, A.; Djalante, R.; Ebi, K.; et al. The Human Imperative of Stabilizing Global Climate Change at 1.5 °C. Science 2019, 365, eaaw6974. [Google Scholar] [CrossRef] [PubMed]
  6. Li, W.; Jiang, Z.; Zhang, X.; Li, L.; Sun, Y. Additional Risk in Extreme Precipitation in China from 1.5 °C to 2.0 °C Global Warming Levels. Sci. Bull. 2018, 63, 228–234. [Google Scholar] [CrossRef]
  7. Su, B.; Huang, J.; Fischer, T.; Wang, Y.; Kundzewicz, Z.W.; Zhai, J.; Sun, H.; Wang, A.; Zeng, X.; Wang, G.; et al. Drought Losses in China Might Double between the 1.5 °C and 2.0 °C Warming. Proc. Natl. Acad. Sci. USA 2018, 115, 10600–10605. [Google Scholar] [CrossRef]
  8. IPCC. Summary for Policymakers. In Climate Change 2021: The Physical Science Basis. Contribution of Working Group I to the Sixth Assessment Report of the Intergovernmental Panel on Climate Change; Cambridge University Press: Cambridge, UK; New York, NY, USA, 2021; pp. 3–32. [Google Scholar]
  9. UNFCCC. Glasgow Climate Pact; FCCC/PA/CMA/2021/10/Add.1; UNFCCC: New York, NY, USA, 2022. [Google Scholar]
  10. Roelfsema, M.; van Soest, H.L.; Harmsen, M.; van Vuuren, D.P.; Bertram, C.; den Elzen, M.; Höhne, N.; Iacobuta, G.; Krey, V.; Kriegler, E.; et al. Taking Stock of National Climate Policies to Evaluate Implementation of the Paris Agreement. Nat. Commun. 2020, 11, 2096. [Google Scholar] [CrossRef]
  11. Jackson, R.B.; Le Quéré, C.; Andrew, R.M.; Canadell, J.G.; Peters, G.P.; Roy, J.; Wu, L. Warning Signs for Stabilizing Global CO2 Emissions. Environ. Res. Lett. 2017, 12, 110202. [Google Scholar] [CrossRef]
  12. NDRC. China’s Achievements, New Goals and New Measures for Nationally Determined Contributions. Available online: https://unfccc.int/sites/default/files/NDC/2022-06/China%E2%80%99s%20Achievements%2C%20New%20Goals%20and%20New%20Measures%20for%20Nationally%20Determined%20Contributions.pdf (accessed on 12 July 2022).
  13. UNFCCC. China’s Mid-Century Long-Term Low Greenhouse Gas Emission Development Strategy. Available online: https://unfccc.int/documents/307765 (accessed on 12 July 2022).
  14. Thomas, H.; Takeshi, K.; John, L.; Brendan, M.; Steve, S.; Ria, A.; Richard, B.; Mirte, B.; Peter, C.; Frederic, H.; et al. Net Zero Tracker. Energy and Climate Intelligence Unit, Data-Driven EnviroLab, NewClimate Institute, Oxford Net Zero. 2022. Available online: https://zerotracker.net/ (accessed on 19 August 2022).
  15. Zhao, X.; Ma, X.; Chen, B.; Shang, Y.; Song, M. Challenges toward Carbon Neutrality in China: Strategies and Countermeasures. Resour. Conserv. Recycl. 2022, 176, 105959. [Google Scholar] [CrossRef]
  16. He, J.; Li, Z.; Zhang, X.; Wang, H.; Dong, W.; Du, E.; Chang, S.; Ou, X.; Guo, S.; Tian, Z.; et al. Towards Carbon Neutrality: A Study on China’s Long-Term Low-Carbon Transition Pathways and Strategies. Environ. Sci. Ecotechnol. 2022, 9, 100134. [Google Scholar] [CrossRef]
  17. Rogelj, J.; den Elzen, M.; Höhne, N.; Fransen, T.; Fekete, H.; Winkler, H.; Schaeffer, R.; Sha, F.; Riahi, K.; Meinshausen, M. Paris Agreement Climate Proposals Need a Boost to Keep Warming Well below 2 °C. Nature 2016, 534, 631–639. [Google Scholar] [CrossRef]
  18. Wollenberg, E.; Richards, M.; Smith, P.; Havlík, P.; Obersteiner, M.; Tubiello, F.N.; Herold, M.; Gerber, P.; Carter, S.; Reisinger, A.; et al. Reducing Emissions from Agriculture to Meet the 2 °C Target. Glob. Chang. Biol. 2016, 22, 3859–3864. [Google Scholar] [CrossRef]
  19. Tokimatsu, K.; Wachtmeister, H.; McLellan, B.; Davidsson, S.; Murakami, S.; Höök, M.; Yasuoka, R.; Nishio, M. Energy Modeling Approach to the Global Energy-Mineral Nexus: A First Look at Metal Requirements and the 2 °C Target. Appl. Energy 2017, 207, 494–509. [Google Scholar] [CrossRef]
  20. Wang, H.; Chen, W. Modeling of Energy Transformation Pathways under Current Policies, NDCs and Enhanced NDCs to Achieve 2-Degree Target. Appl. Energy 2019, 250, 549–557. [Google Scholar] [CrossRef]
  21. Su, X.; Takahashi, K.; Fujimori, S.; Hasegawa, T.; Tanaka, K.; Kato, E.; Shiogama, H.; Masui, T.; Emori, S. Emission Pathways to Achieve 2.0°C and 1.5°C Climate Targets. Earths Future 2017, 5, 592–604. [Google Scholar] [CrossRef]
  22. Shi, Y.; Zhang, D.-F.; Xu, Y.; Zhou, B.-T. Changes of Heating and Cooling Degree Days over China in Response to Global Warming of 1.5 °C, 2 °C, 3 °C and 4 °C. Adv. Clim. Chang. Res. 2018, 9, 192–200. [Google Scholar] [CrossRef]
  23. Luderer, G.; Vrontisi, Z.; Bertram, C.; Edelenbosch, O.Y.; Pietzcker, R.C.; Rogelj, J.; Boer, H.S.D.; Drouet, L.; Emmerling, J.; Fricko, O.; et al. Residual Fossil CO2 Emissions in 1.5–2 °C Pathways. Nat. Clim. Chang. 2018, 8, 626–633. [Google Scholar] [CrossRef]
  24. Vrontisi, Z.; Luderer, G.; Saveyn, B.; Keramidas, K.; Lara, A.R.; Baumstark, L.; Bertram, C.; Boer, H.S.; de Drouet, L.; Fragkiadakis, K.; et al. Enhancing Global Climate Policy Ambition towards a 1.5 °C Stabilization: A Short-Term Multi-Model Assessment. Environ. Res. Lett. 2018, 13, 044039. [Google Scholar] [CrossRef]
  25. Tanaka, K.; O’Neill, B.C. The Paris Agreement Zero-Emissions Goal is not Always Consistent with the 1.5 °C and 2 °C Temperature Targets. Nat. Clim. Chang. 2018, 8, 319–324. [Google Scholar] [CrossRef]
  26. Jiang, K.; He, C.; Dai, H.; Liu, J.; Xu, X. Emission Scenario Analysis for China under the Global 1.5 °C Target. Carbon Manag. 2018, 9, 481–491. [Google Scholar] [CrossRef]
  27. Denison, S.; Forster, P.M.; Smith, C.J. Guidance on Emissions Metrics for Nationally Determined Contributions under the Paris Agreement. Environ. Res. Lett. 2019, 14, 124002. [Google Scholar] [CrossRef]
  28. Pedde, S.; Kok, K.; Hölscher, K.; Frantzeskaki, N.; Holman, I.; Dunford, R.; Smith, A.; Jäger, J. Advancing the Use of Scenarios to Understand Society’s Capacity to Achieve the 1.5 Degree Target. Glob. Environ. Chang. 2019, 56, 75–85. [Google Scholar] [CrossRef]
  29. Warszawski, L.; Kriegler, E.; Lenton, T.M.; Gaffney, O.; Jacob, D.; Klingenfeld, D.; Koide, R.; Costa, M.M.; Messner, D.; Nakicenovic, N.; et al. All Options, Not Silver Bullets, Needed to Limit Global Warming to 1.5 °C: A Scenario Appraisal. Environ. Res. Lett. 2021, 16, 064037. [Google Scholar] [CrossRef]
  30. Brutschin, E.; Pianta, S.; Tavoni, M.; Riahi, K.; Bosetti, V.; Marangoni, G.; van Ruijven, B.J. A Multidimensional Feasibility Evaluation of Low-Carbon Scenarios. Environ. Res. Lett. 2021, 16, 064069. [Google Scholar] [CrossRef]
  31. Duan, H.; Zhou, S.; Jiang, K.; Bertram, C.; Harmsen, M.; Kriegler, E.; van Vuuren, D.P.; Wang, S.; Fujimori, S.; Tavoni, M.; et al. Assessing China’s Efforts to Pursue the 1.5°C Warming Limit. Science 2021, 372, 378–385. [Google Scholar] [CrossRef]
  32. Zheng, J.; Duan, H.; Zhou, S.; Wang, S.; Gao, J.; Jiang, K.; Gao, S. Limiting Global Warming to below 1.5 °C from 2 °C: An Energy-System-Based Multi-Model Analysis for China. Energy Econ. 2021, 100, 105355. [Google Scholar] [CrossRef]
  33. Chen, J.; Cui, H.; Xu, Y.; Ge, Q. Long-Term Temperature and Sea-Level Rise Stabilization before and beyond 2100: Estimating the Additional Climate Mitigation Contribution from China’s Recent 2060 Carbon Neutrality Pledge. Environ. Res. Lett. 2021, 16, 074032. [Google Scholar] [CrossRef]
  34. Nordhaus, W.D. An Optimal Transition Path for Controlling Greenhouse Gases. Science 1992, 258, 1315–1319. [Google Scholar] [CrossRef] [PubMed]
  35. Duan, H.; Zhang, G.; Wang, S.; Fan, Y. Robust Climate Change Research: A Review on Multi-Model Analysis. Environ. Res. Lett. 2019, 14, 033001. [Google Scholar] [CrossRef]
  36. Tanaka, K.; Kriegler, E.; Bruckner, T.; Hooss, G.; Knorr, W.; Raddatz, T. Aggregated Carbon Cycle, Atmospheric Chemistry, and Climate Model (ACC2)—Description of the Forward and Inverse Modes. Retrieved from Hamburg. 2007. Available online: http://hdl.handle.net/11858/00-001M-0000-0011-FB8D-1 (accessed on 10 July 2022).
  37. Bruckner, T.; Hooss, G.; Füssel, H.M.; Hasselmann, K. Climate System Modeling in the Framework of the Tolerable Windows Approach: The ICLIPS Climate Model. Clim. Chang. 2003, 56, 119–137. [Google Scholar] [CrossRef]
  38. Hooss, G.; Voss, R.; Hasselmann, K.; Maier-Reimer, E.; Joos, F. A Nonlinear Impulse Response Model of the Coupled Carbon Cycle-Climate System (NICCS). Clim. Dyn. 2001, 18, 189–202. [Google Scholar] [CrossRef]
  39. Tanaka, K.; Boucher, O.; Ciais, P.; Johansson, D.J.A.; Morfeldt, J. Cost-Effective Implementation of the Paris Agreement Using Flexible Greenhouse Gas Metrics. Sci. Adv. 2021, 7, eabf9020. [Google Scholar] [CrossRef]
  40. Nicholls, Z.R.J.; Meinshausen, M.; Lewis, J.; Gieseke, R.; Dommenget, D.; Dorheim, K.; Fan, C.S.; Fuglestvedt, J.S.; Gasser, T.; Golüke, U.; et al. Reduced Complexity Model Intercomparison Project Phase 1: Introduction and Evaluation of Global-Mean Temperature Response. Geosci. Model Dev. 2020, 13, 5175–5190. [Google Scholar] [CrossRef]
  41. Kriegler, E. Imprecise Probability Analysis for Integrated Assessment of Climate Change; Universität Potsdam: Potsdam, Germany, 2005. [Google Scholar]
  42. IPCC. Summary for Policymakers. In Climate Change 2013: The Physical Science Basis. Contribution of Working Group I to the Fifth Assessment Report of the Intergovernmental Panel on Climate Change; Cambridge University Press: Cambridge, UK; New York, NY, USA, 2013. [Google Scholar]
  43. Tanaka, K.; Raddatz, T.; O’Neill, B.C.; Reick, C.H. Insufficient Forcing Uncertainty Underestimates the Risk of High Climate Sensitivity. Geophys. Res. Lett. 2009, 36, L16709. [Google Scholar] [CrossRef]
  44. Skeie, R.B.; Fuglestvedt, J.; Berntsen, T.; Peters, G.P.; Andrew, R.; Allen, M.; Kallbekken, S. Perspective Has a Strong Effect on the Calculation of Historical Contributions to Global Warming. Environ. Res. Lett. 2017, 12, 024022. [Google Scholar] [CrossRef]
  45. UNFCCC. Report of the Conference of the Parties Serving as the Meeting of the Parties to the Paris Agreement on the Third Part of Its First Session, Held in Katowice from 2 to 15 December 2018. Addendum 2. Part Two: Action Taken by the Conference of the Parties Serving as the Meeting of the Parties to the Paris Agreement; FCCC/PA/CMA/2018/3/Add.2 2019; UNFCCC: New York, NY, USA, 2018. [Google Scholar]
  46. O’Neill, B.C. The Jury Is Still Out on Global Warming Potentials. Clim. Chang. 2000, 44, 427–443. [Google Scholar] [CrossRef]
  47. Shine, K.P. The Global Warming Potential—The Need for an Interdisciplinary Retrial. Clim. Chang. 2009, 96, 467–472. [Google Scholar] [CrossRef]
  48. Tanaka, K.; Peters, G.P.; Fuglestvedt, J.S. Policy Update: Multicomponent Climate Policy: Why Do Emission Metrics Matter? Carbon Manag. 2010, 1, 191–197. [Google Scholar] [CrossRef]
  49. IPCC. Anthropogenic and Natural Radiative Forcing. In Climate Change 2013: The Physical Science Basis. Contribution of Working Group I to the Fifth Assessment Report of the Intergovernmental Panel on Climate Change; Cambridge University Press: Cambridge, UK; New York, NY, USA, 2013; pp. 659–740. ISBN 978-1-107-05799-9. [Google Scholar]
  50. Allen, M.; Tanaka, K.; Macey, A.; Cain, M.; Jenkins, S.; Lynch, J.; Smith, M. Ensuring That Offsets and Other Internationally Transferred Mitigation Outcomes Contribute Effectively to Limiting Global Warming. Environ. Res. Lett. 2021, 16, 074009. [Google Scholar] [CrossRef]
  51. CAIT. Greenhouse Gas (GHG) Emissions Climate Watch. Available online: https://www.climatewatchdata.org/ghg-emissions (accessed on 12 January 2022).
  52. Crippa, M.; Guizzardi, D.; Solazzo, E.; Muntean, M.; Schaaf, E.; Monforti-Ferrario, F.; Banja, M.; Olivier, J.; Grassi, G.; Rossi, S.; et al. GHG Emissions of All World Countries. Available online: https://publications.jrc.ec.europa.eu/repository/handle/JRC126363 (accessed on 12 July 2022).
  53. van Soest, H.L.; den Elzen, M.G.J.; van Vuuren, D.P. Net-Zero Emission Targets for Major Emitting Countries Consistent with the Paris Agreement. Nat. Commun. 2021, 12, 2140. [Google Scholar] [CrossRef]
  54. Andreae, M.O.; Jones, C.D.; Cox, P.M. Strong Present-Day Aerosol Cooling Implies a Hot Future. Nature 2005, 435, 1187–1190. [Google Scholar] [CrossRef]
  55. Tanaka, K.; Raddatz, T. Correlation between Climate Sensitivity and Aerosol Forcing and Its Implication for the “Climate Trap”: A Letter. Clim. Chang. 2011, 109, 815–825. [Google Scholar] [CrossRef]
  56. Samset, B.H.; Sand, M.; Smith, C.J.; Bauer, S.E.; Forster, P.M.; Fuglestvedt, J.S.; Osprey, S.; Schleussner, C.-F. Climate Impacts From a Removal of Anthropogenic Aerosol Emissions. Geophys. Res. Lett. 2018, 45, 1020–1029. [Google Scholar] [CrossRef]
  57. Prather, M.J. Lifetimes and Time Scales in Atmospheric Chemistry. Philos. Trans. R. Soc. Math. Phys. Eng. Sci. 2007, 365, 1705–1726. [Google Scholar] [CrossRef] [PubMed]
  58. Allen, M.R.; Peters, G.P.; Shine, K.P.; Azar, C.; Balcombe, P.; Boucher, O.; Cain, M.; Ciais, P.; Collins, W.; Forster, P.M.; et al. Indicate Separate Contributions of Long-Lived and Short-Lived Greenhouse Gases in Emission Targets. NPJ Clim. Atmos. Sci. 2022, 5, 5. [Google Scholar] [CrossRef] [PubMed]
  59. Fuglestvedt, J.; Rogelj, J.; Millar, R.J.; Allen, M.; Boucher, O.; Cain, M.; Forster, P.M.; Kriegler, E.; Shindell, D. Implications of Possible Interpretations of ‘Greenhouse Gas Balance’ in the Paris Agreement. Philos. Trans. R. Soc. Math. Phys. Eng. Sci. 2018, 376, 20160445. [Google Scholar] [CrossRef] [PubMed]
  60. UNEP. Air Pollution in Asia and the Pacific: Science-Based Solutions; UNEP: Nairobi, Kenya, 2019. [Google Scholar]
  61. Climate & Clean Air Coalition. Global Methane Assessment; UNEP: Nairobi, Kenya, 2021. [Google Scholar]
  62. Shoemaker, J.K.; Schrag, D.P.; Molina, M.J.; Ramanathan, V. What Role for Short-Lived Climate Pollutants in Mitigation Policy? Science 2013, 342, 1323–1324. [Google Scholar] [CrossRef] [PubMed]
  63. Harmsen, M.; van Vuuren, D.P.; Bodirsky, B.L.; Chateau, J.; Durand-Lasserve, O.; Drouet, L.; Fricko, O.; Fujimori, S.; Gernaat, D.E.H.J.; Hanaoka, T.; et al. The Role of Methane in Future Climate Strategies: Mitigation Potentials and Climate Impacts. Clim. Chang. 2020, 163, 1409–1425. [Google Scholar] [CrossRef]
  64. Sun, T.; Ocko, I.B.; Sturcken, E.; Hamburg, S.P. Path to Net Zero Is Critical to Climate Outcome. Sci. Rep. 2021, 11, 22173. [Google Scholar] [CrossRef]
  65. E.U. & U.S. Joint EU-US Press Release on the Global Methane Pledge. Available online: https://ec.europa.eu/commission/presscorner/detail/en/IP_21_4785 (accessed on 12 July 2022).
  66. Ocko, I.B.; Sun, T.; Shindell, D.; Oppenheimer, M.; Hristov, A.N.; Pacala, S.W.; Mauzerall, D.L.; Xu, Y.; Hamburg, S.P. Acting Rapidly to Deploy Readily Available Methane Mitigation Measures by Sector Can Immediately Slow Global Warming. Environ. Res. Lett. 2021, 16, 054042. [Google Scholar] [CrossRef]
  67. Höglund-Isaksson, L.; Gómez-Sanabria, A.; Klimont, Z.; Rafaj, P.; Schöpp, W. Technical Potentials and Costs for Reducing Global Anthropogenic Methane Emissions in the 2050 Timeframe—Results from the GAINS Model. Environ. Res. Commun. 2020, 2, 025004. [Google Scholar] [CrossRef]
  68. Tanaka, K.; O’Neill, B.C.; Rokityanskiy, D.; Obersteiner, M.; Tol, R.S.J. Evaluating Global Warming Potentials with Historical Temperature. Clim. Chang. 2009, 96, 443–466. [Google Scholar] [CrossRef]
  69. Wigley, T.M.L. The Relationship between Net GHG Emissions and Radiative Forcing with an Application to Article 4.1 of the Paris Agreement. Clim. Chang. 2021, 169, 13. [Google Scholar] [CrossRef]
  70. Khaniabadi, Y.O.; Polosa, R.; Chuturkova, R.Z.; Daryanoosh, M.; Goudarzi, G.; Borgini, A.; Tittarelli, A.; Basiri, H.; Armin, H.; Nourmoradi, H.; et al. Human Health Risk Assessment Due to Ambient PM10 and SO2 by an Air Quality Modeling Technique. Process Saf. Environ. Prot. 2017, 111, 346–354. [Google Scholar] [CrossRef]
  71. Shindell, D.; Kuylenstierna, J.C.I.; Vignati, E.; van Dingenen, R.; Amann, M.; Klimont, Z.; Anenberg, S.C.; Muller, N.; Janssens-Maenhout, G.; Raes, F.; et al. Simultaneously Mitigating Near-Term Climate Change and Improving Human Health and Food Security. Science 2012, 335, 183–189. [Google Scholar] [CrossRef] [PubMed]
  72. Tanaka, K.; Cavalett, O.; Collins, W.J.; Cherubini, F. Asserting the Climate Benefits of the Coal-to-Gas Shift across Temporal and Spatial Scales. Nat. Clim. Chang. 2019, 9, 389–396. [Google Scholar] [CrossRef]
  73. O’Rourke, P.R.; Smith, S.J.; Mott, A.; Ahsan, H.; McDuffie, E.E.; Crippa, M.; Klimont, Z.; McDonald, B.; Wang, S.; Nicholson, M.B.; et al. CEDS V_2021_02_05 Release Emission Data. Zenodo. 2021. Available online: https://doi.org/10.5281/zenodo.4509372 (accessed on 12 July 2022). [CrossRef]
  74. Melnikova, I.; Boucher, O.; Cadule, P.; Ciais, P.; Gasser, T.; Quilcaille, Y.; Shiogama, H.; Tachiiri, K.; Yokohata, T.; Tanaka, K. Carbon Cycle Response to Temperature Overshoot Beyond 2 °C: An Analysis of CMIP6 Models. Earths Future 2021, 9, 1–19. [Google Scholar] [CrossRef]
Figure 1. Original data of global and China’s emission pathways analyzed in our study. (a) China’s CO2 emission pathways under the 1.5 °C target; (b) China’s GHG emission pathways under the 1.5 °C target; (c,d) Rest of the world (ROW) (i.e., all countries except China) and global GHG emission pathways under the 1.5 °C target. We consider Kyoto gases as GHGs in this figure. The aggregation of GHG emissions uses the GWP100 metric. Historical emission data were obtained from CAIT [51] and EDGAR [52].
Energies 15 06002 g001
Figure 2. Global mean temperature projections of the emission pathways aiming at the 1.5 °C target. (a) Global mean temperature projections obtained from the original databases (i.e., ADVANCE project) (black dotted lines) are compared with those calculated by ACC2 using the emission pathways in the databases (solid red lines). See Table 2 for temperature calculation methods of the original databases. Note that only a subset of the IAMs report temperature results in the original databases; (b) Global mean temperature projections are calculated using ACC2 for the emission pathways in the original database, with peak temperatures indicated with respective symbols.
Energies 15 06002 g002aEnergies 15 06002 g002b
Figure 3. Effects of China’s emissions since 2005 on the global mean temperature. (a) Global mean temperature change arising from China’s emissions in each scenario; (b) Distribution characteristics of global warming contributions from China’s emissions.
Energies 15 06002 g003
Figure 4. China’s contribution to the global mean temperature from individual GHGs and air pollutants since 2005. (a) Maximum gas-by-gas contributions (in absolute terms) of China’s emissions to the global mean temperature; (b) Temporal distribution of the maximum gas-by-gas contributions (in absolute terms). The maximum and minimum of gas-by-gas contributions are indicated by filled and open symbols, respectively.
Energies 15 06002 g004aEnergies 15 06002 g004b
Figure 5. China’s CH4 mitigation scenarios and corresponding CO2 emissions scenarios to evaluate the effect of different GHG compositions on the global mean temperature. (a) China’s CO2 emissions and (b) China’s CH4 emissions. Across all scenarios, CO2 equivalent emissions (GWP100 basis) are hypothetically kept the same each year. In other words, the reduction of CO2 emissions relative to the level in the 1.5 °C-consistent scenario each year is equivalent in absolute magnitude (GWP100 basis) to the increase in CH4 emissions relative to that in the 1.5 °C-consistent scenario. See text for details.
Energies 15 06002 g005
Figure 6. China’s contribution to global temperature change under scenarios with varying GHG compositions. The 1.5 °C-consistent scenario (marked by black open square) is the reference scenario, from which either CO2 or CH4 emissions (or both CO2 and CH4 emissions) are hypothetically altered to the levels of the respective scenario. Markers indicate the peak temperature contribution of each scenario.
Energies 15 06002 g006
Table 1. Categories and definitions of pathways adopted from the ADVANCE project.
CategoryLabelDefinition
2020_1.5 °C-2100S1Mitigation efforts strengthened with globally uniform carbon price after 2020 to limit cumulative 2011–2100 CO2 emissions to 400 GtCO2
2030_1.5 °C-2100S2After implementing the NDCs without strengthening until 2030, the carbon budgets from the 2020_1.5 °C-2100 scenario are adopted
2030_Price1.5 °CS3After implementing the NDCs without strengthening until 2030, carbon price trajectories from the 2020_1.5 °C-2100 scenario are adopted
2030_3xPrice1.5 °CS4Implementing a 3-fold carbon price relative to the 2020_1.5 °C-2100 scenario
Table 2. Summary of the IAMs considered in our study.
ModelLabelSourcePeriodIntervalGHGs and Air Pollutants Considered for ChinaReported PathwayClimate Module
AIM/CGE V.2AIMNIES, Japan
Kyoto University, Japan
2005–21005-yearCO2, CH4, N2O, CO, HFC, NOx, PFC, SF6, SO2, VOCS1, S3, S4MAGICC
GCAM4.2_ADVANCEWP6GCAMPNNL and JGCRI, USA2005–21005-yearCO2, CH4, N2O, SO2S1, S2, S3, S4Hector v2.0
IMAGE 3.0IMAGEUU, The Netherlands
PBL, The Netherlands
2005–21005-yearCO2, CH4, N2O, CO, HFC, NOx, PFC, SF6, SO2, VOCS1, S3, S4MAGICC
MESSAGE-GLOBIOM_1.0MESSAGEIIASA, Austria2005–210010-yearCO2, CH4, N2O, CO, HFC, NOx, SF6, SO2, VOCS1, S3, S4MAGICC
POLES ADVANCEPOLESEC-JRC, Belgium2005–21005-yearCO2, CH4, N2O, HFC, PFC, SF6S1, S2, S3, S4MAGICC
REMIND V1.7REMINDPIK, Germany2005–2100Before 2050: 5-year
After 2050: 10-year
CO2, CH4, N2O, HFC, NOx, PFC, SF6, SO2S1, S2, S3, S4MAGICC
WITCHWITCHRFF-CMCC EIEE, Italy2005–21005-yearCO2, CH4, N2O, CO, HFC, NOx, PFC, SF6, SO2, VOCS1, S3, S4MAGICC/Internal climate module
Table 3. Details of China’s CH4 mitigation scenarios. Except for the 1.5 °C-consistent scenario, we linearly extrapolate the 30% CH4 and MRP scenario after 2050 until it meets the 1.5 °C-consistent scenario (Figure 5b). In other words, all scenarios other than the 1.5 °C-consistent scenario are assumed to follow the 30% CH4 and MRP scenario after 2050 until these scenarios merge with the 1.5 °C-consistent scenario.
ScenarioDefinition
1.5 °C-consistentFollowing the average emission pathway obtained from the pathways aiming at the 1.5 °C target discussed earlier (Table 1)
30% CH4 and MRPReducing CH4 emissions by 30% by 2030 relative to 2020 levels and then following the MRP until 2050
1.5 °C-consistent and MRPKeeping CH4 emissions consistent with that of the 1.5 °C-consistent pathway before 2030 and then aiming toward the MRP target by 2050
MRP-onlyMitigating CH4 emissions towards the 2050 MRP target after 2020, without considering the 2030 pledge of 30% CH4 reductions.
Constant CH4 until 2030Keeping CH4 emissions in line with 2020 levels before 2030 and then mitigating CH4 emissions toward the MRP until 2050
Table 4. Key estimates from the results shown in Figure 6. The percentage indicates the difference from the corresponding estimate in the 1.5 °C-consistent scenario.
ScenariosUnit203020502100
Both GasesCO2-OnlyCH4-OnlyBoth GasesCO2-OnlyCH4-OnlyBoth GasesCO2-OnlyCH4-Only
1.5 °C-consistent°C0.0970.1700.105
30% CH4 and MRP%1.53−0.552.084.55−2.266.81−2.93−4.421.50
1.5 °C orientation and MRP%0.000.000.003.64−1.475.11−2.10−3.361.27
MRP-only%2.69−0.953.656.07−3.339.4−4.04−5.871.83
Constant CH4 until 2030%4.43−1.576.018.35−4.9313.27−5.71−8.052.33
Publisher’s Note: MDPI stays neutral with regard to jurisdictional claims in published maps and institutional affiliations.

