Abstract
To mine the battery’s health factors more comprehensively and accurately identify the lithium battery’s State of Health (SOH), an Improved Douglas–Peucker feature extraction algorithm is proposed, and the LAOS-XGboost model is proposed to be used to predict the SOH of the battery. Firstly, to solve the problem that the traditional Douglas–Peucker algorithm has difficulties extracting curve features in a fixed dimension, the Douglas–Peucker algorithm is improved by de-thresholding. Then, the Wrapper method combined with the Improved Douglas–Peucker algorithm is used to construct the feature engineering of battery life prediction, and the optimal feature subset is obtained. Then, LAOS-XGboost is used to establish a battery SOH prediction model; finally, this model is used to predict the SOH of different batteries and the same battery, and the robustness of the model is analyzed. The experimental results show that the R2 of all XGboost models is higher than 0.97 in the prediction experiments of different batteries. The AE of the LAOS-XGboost model is 0, and the TIC index is less than 3% under 10 dB SNR. In the same battery prediction experiment, the TIC index of the model is less than 0.3%.
1. Introduction
Lithium-ion batteries have the advantages of a long service life, high energy density, low self-discharge rate, no memory effect, and a wide temperature range, and are widely used as energy storage components of various machines, such as new energy vehicles, mobile phones, laptops, and other equipment [1,2,3,4,5,6]. In the long-term use process, lithium-ion battery performance will gradually degrade and fail due to the corrosion of the external environment and internal electrode materials and the aging of the diaphragm. Sudden battery failure can easily lead to electronic equipment losing energy sources and stopping working, resulting in accidents [7,8,9]. Lithium-ion batteries’ reliability, safety, and life have become a critical issue that restricts their successful application. Therefore, accurately predicting the SOH and remaining useful life (RUL) of lithium-ion batteries is an urgent problem to be solved in lithium-ion battery research [10,11,12].
A large amount of data can be obtained from each cycle of a lithium-ion battery by using the detection instrument. However, obtaining the critical features from them and establishing the feature engineering to extract the health factors of the battery are undoubtedly significant and challenging points in predicting the SOH and RUL of the battery [13,14,15].
In recent years, with the rise of machine learning, data-driven battery life prediction methods have developed rapidly. Ezemobi et al. analyzed a method to enhance the generalization of SOH estimation using the parallel layer extreme learning machine (PL-ELM) algorithm and extended the application of a single SOH estimation model to many identical types of batteries [16]. Bao et al. studied the time dependence and correlation by analyzing the data distribution of the battery discharge voltage curve and found that this method can obtain the spatial characteristics of these data more accurately, and the established model has higher accuracy and stronger robustness [17]. Rahimifard et al. proposed a robust adaptive filter called the adaptive smooth variable structure filter (ASVSF-VBL) with a time-varying boundary layer used to estimate SOC and SOH in electric vehicles [18]. Zhang et al. extracted two health factors after analyzing the variation characteristics of current and voltage in the charging process of the lithium-ion battery, proved that the proposed factors were highly correlated with the battery capacity, and further established a two-factor linear regression model for lithium battery capacity estimation [19]. Based on the improved double least squares support vector machine method and Box-Cox transform, Shu et al. proposed a collaborative estimation method of lithium-ion battery capacity and remaining cycle life. By extracting the envelope area of the partial capacity increment curve of the aging battery as the characteristic quantity, the Box-Cox transform was used to further improve the correlation between the characteristic quantity and the target estimation [20]. Feng et al. proposed an online SOH estimation algorithm for lithium-ion batteries based on machine learning. This algorithm uses SVM as the diagnosis algorithm built by the prediction model. According to the charging characteristics of the battery, the relationship is mapped by the SVM model. The algorithm works by comparing part of the charging curve with the stored SVM [21]. Hu et al. proposed a novel double Gaussian process regression model for predicting the SOH and RUL of battery packs. The aging test adopts the multi-stage constant current charging mode. The health factors of lithium-ion batteries were extracted from the charging curve, and the capacity change trend and resistance increment were observed. The double Gaussian process regression model is designed to predict SOH and RUL near the end of the cycle life [22]. Zhang et al. proposed a new online synthesis method based on the fusion of partial incremental capacity and ANN model to estimate SOH and RUL under constant current discharge. The initial incremental capacity curve is smoothed by the filtering algorithm. Then, the battery health factors are extracted from the partial incremental curves by correlation analysis. Finally, a prediction model based on ANN model is established to estimate SOH and RUL simultaneously [23]. The estimation results were thoroughly evaluated by combining the analytic hierarchy process and entropy weight method. The above method using machine learning for SOH prediction has made outstanding contributions in the field of battery research, but there is still room for improvement in feature extraction.
In order to mine the typical characteristics of battery charge and discharge data, a new feature extraction method is proposed by analyzing the characteristics of various attribute curves of lithium battery charge and discharge. The feature engineering is established through the IDP algorithm and Wrapper method, and the LAOS-XGboost (Logistic Atomic Orbital Search, LAOS) model is used to predict the SOH of different batteries and the same battery.
The paper is organized as follows: The first part introduces the research status of researchers in the SOH prediction of lithium batteries. The second part introduces the principle of the related algorithms used in this paper, including the Improved Douglas–Peucker algorithm, LAOS algorithm, and XGboost model, and introduces the SOH prediction model of lithium batteries established in this paper. The third part establishes the characteristic engineering of lithium-ion battery. The fourth part uses the XGboost model and its optimization model to predict the SOH of lithium batteries, and analyzes the performance of the model. The last part summarizes the whole thesis.
2. Algorithm Principle
2.1. IDP Algorithm (Improved Douglas–Peucker)
For any curve, the Douglas–Peucker (D.P.) algorithm segments the curve by setting the threshold in advance and finally obtains the approximate line segment of the curve [24].
In the lithium battery’s cycle charge and discharge process, the time of each charge and discharge is not equal under the same working condition due to the aging of the battery. The attribute curves of different charge cycles measured by the instrument have time step asymmetry and time sequence length inconsistency. The extracted feature length and position may be inconsistent if the traditional D.P. algorithm is used to extract features and the determined threshold is used. The inconsistent length and position of these features will result in the inability to use them for neural network training, and the extracted features will lose their function.
In order to solve the problem of the inconsistent length and position of lithium battery charge and discharge attributes extracted by the traditional D.P. algorithm, an improved D.P. algorithm is proposed in this paper, which can extract the same dimension in different curves. The specific process is shown in Figure 1.

Figure 1.
Improved Douglas–Peucker algorithm flow chart.
The specific steps are as follows:
- (1)
- A straight line AB connected the two points A and B at the beginning and end of the curve, which is the string of the curve.
- (2)
- The distance from each point on the curve to the line segment AB is calculated, and the point C with the largest distance from the line segment on the curve is obtained.
- (3)
- The curve has been divided into N segments. According to step 2, the points of maximum distance from points on N arcs to their respective chords are calculated, and the points of maximum distance in N arcs are obtained by comparing the distances from points of maximum distance to their respective chords. The point E with the largest distance on several arc segments is obtained, which is on the curve FG.
- (4)
- Dividing curve FG into curves FE and EG.
- (5)
- Repeat steps 1–4 on two curves until the curve is segmented into the target dimension.
- (6)
- When all curves are processed, the broken lines formed by each segmentation point are connected in turn as the approximation curve.
2.2. LAOS Algorithm
2.2.1. AOS Algorithm
The atomic orbital search (AOS) algorithm is a meta-heuristic algorithm proposed by Mahdi Azizizi in 2021, which is based on the principle of quantum mechanics and the atomic model of quantum [25].
The principle of the AOS algorithm is as follows. Firstly, the volume around the atomic nucleus point can be made into a thin spherical concentric layer. Assuming that the electron is in the ground state energy, the number of particles n is a constant value, and the number is related to the radius of the electron orbit. The electrons around the nucleus can be excited by the interaction of photons and particles or magnetic fields, resulting in energy absorption or emission. The binding energy represents the energy needed to remove the atom from the shell. When the energy absorbed by an electron exceeds the binding energy, the electron will transit to the lower energy level of the inner orbit. When the energy absorbed by an electron is less than the binding energy, the electron undergoes a transition to an excitation level in the outer orbit. Each electron is represented as in the search space. The objective equation of the AOS algorithm is:
where M is the number of electrons in the search space and D is the problem dimension. represents the j-dimensional value of the i-electron.
The initial position of electrons in the search space is generated by Formula (2):
where represents the initial solution of the () dimension of the () electron, represents the lower limit of the j dimension of the i electron, represents the upper limit of the j dimension of the i electron, and represents the random number from 0 to 1.
2.2.2. LAOS Algorithm (Logistic Atomic Orbital Search)
When the atomic orbit search algorithm initializes the atomic position, the random generation method is used, which will make the atomic position distribution uneven and affect the further iterative optimization. The Logistic Atomic Orbital Search (LAOS) algorithm uses the randomness, ergodicity, and regularity of chaotic mapping to optimize the position of atoms by using logistic mapping in chaotic mapping to avoid falling into local optimum and improve the global search ability and optimization accuracy.
The logistic mapping expression is:
where is the initial value and is the value after tent mapping. is the chaotic factor.
The specific optimization steps of the LAOS algorithm are:
Step 1. Use Formula (3) to generate chaotic variables according to the initial particle .
Step 2. Carrier chaotic variables into the solution space of the problem to be solved:
where and are the maximum and minimum values of the -dimensional variable , respectively.
Step 3. Chaotic perturbation of individuals according to Formula (3):
where is the individual that needs chaotic disturbance, is the generated chaotic disturbance, and is the individual after chaotic disturbance.
2.3. Principle of XGboost
Ensemble learning (ensemble learning) is a model framework of a strong learner by constructing multiple machine learners, training and forming multiple weak learners, and combining multiple weak learners through some combination strategy [26].
The boosting algorithm improves the performance of weak learners by iterative feedback. The training effect of the previous learner is adjusted, and the next learner is trained according to the new sample distribution so that the iteration is M times. Finally, a series of weak learners are combined into strong learners. The boosting algorithm schematic diagram is shown in Figure 2.
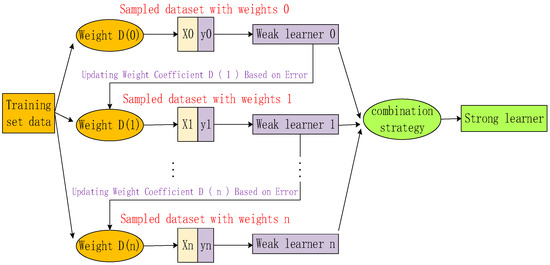
Figure 2.
Block diagram of boosting algorithm.
The gradient boosting decision tree (GBDT) is an additive model, the learning algorithm is a forward step-by-step algorithm, and the base function is the CART tree. The loss function is a quadratic loss function regression problem, exponential function classification problem, and general loss function decision problem.
The GBDT algorithm model is a combination of the boosting algorithm and decision tree.
XGboost belongs to one of the boosting methods, so the sample is not put back at sampling time, thus each round of calculation sample is not repeated. In addition, XGboost supports subsampling, and each round of calculation can use no full sample to reduce overfitting. Another point is that XGboost also supports column sampling and randomly extracts a percentage of features per round of the calculation for training, improving speed, and reducing overfitting [27,28].
The predicted value of the ith sample after the input feature vector set D is superposed by K weak classifiers is:
where represents the leaf node corresponding to the sample on the weak classifier, represents the weight of the leaf node, and the initial value represents each weak learner’s function .
The sum of the error function of all samples in the t CART tree is:
Among them:
where represents the loss function of the calculation error between the actual value and the predicted value; is a regularization term; T is the number of leaf nodes; and and are hyperparameters.
When the loss function is MSE:
where const is the complexity of the first t − 1 tree. For a general loss function, make it a Taylor second-order expansion:
Among them:
XGboost uses level-wise to generate a decision tree strategy and splits the leaves at the same layer to conduct multi-threaded optimization and prevent overfitting.
2.4. Lithium Battery Health Factors Extraction and SOH Prediction Model Based on the IDP Algorithm
For battery life prediction, the IDP algorithm is used to extract the feature of lithium battery health factors, and the LAOS-XGboost model is constructed to predict the SOH of lithium-ion batteries. The specific principle is shown in Figure 3.
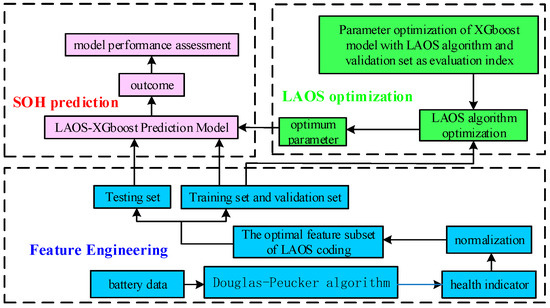
Figure 3.
IDP-based lithium battery health factor extraction and SOH prediction model.
The lithium battery health factor extraction and SOH prediction model based on IDP mainly comprise feature engineering, LAOS optimization, and SOH prediction. The data feature engineering part mainly uses the IDP algorithm to extract the health factor of each cycle data of the battery and cascades the binary LAOS encoder for feature selection. The LAOS optimization part uses the LAOS algorithm to optimize the hyper-parameters of the XGboost model and obtain the optimal parameters. The SOH prediction part is to train and test the XGboost model to predict the SOH of the battery and evaluate the model.
3. Feature Engineering Establishment and Full Information Health Factor Extraction
3.1. Feature Extraction Based on the IDP Algorithm
In this paper, the first batch of the data set of the NASA Prognostics Center of Excellence (PCoE) included battery numbers B0005, B0006, B0007, and B0018 data [29]. The battery used is the lithium cobaltate lithium-ion battery, 18650 model size, with a rated capacity of 2 Ah. The data set contains the voltage, current, impedance value, and temperature of lithium battery charging and discharging. The charging process of the experiment is as follows: charge at 1.5 A constant current and change to constant voltage charging when the voltage reaches 4.2 V, until the charging current drops to 20 mA. The discharge process is as follows: discharge at a constant current of 2.0 A, and stop discharge when the B0005, B0006, B0007, and B0018 battery voltage drops to 2.7, 2.5, 2.2 V, 2.5 V. The battery capacity under different charge-discharge cycles is shown in Figure 4.
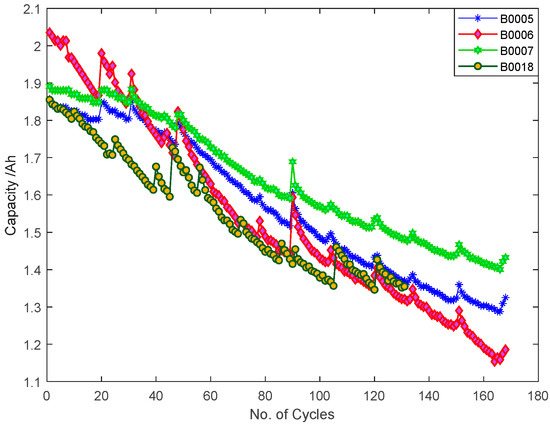
Figure 4.
Battery capacity.
Figure 4 indicates that with the increase in charge and discharge cycles, the battery capacity decreases, but the battery will form a capacity regeneration phenomenon, resulting in the battery capacity not monotonically decreasing. According to the minimum standard SOH of the automobile industry, when the battery capacity drops to 80% of the rated capacity, it is considered to be invalid. According to references [30,31], the life failure thresholds of B0005, B0006, B0007, and B0018 are set as 1.38 Ah, 1.38 Ah, 1.5 Ah, and 1.4 Ah, respectively.
Taking the B0005 battery as the research object, due to the aging of the lithium battery during charging and discharging cycles, the time steps of the measured attributes in each cycle are not aligned, and the sequence length is inconsistent. Taking the measured voltage attribute of the charge as an example, the voltage curves under different cycles are shown in Figure 5.
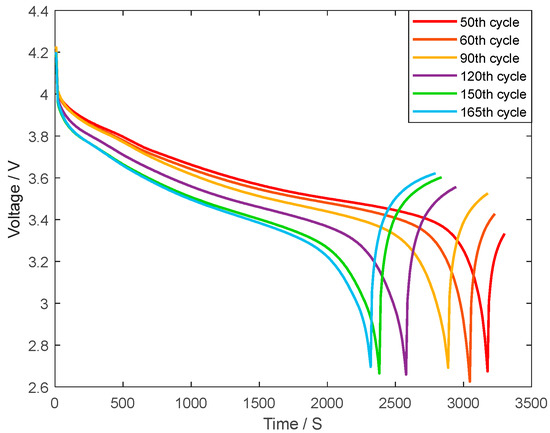
Figure 5.
Charge voltage curve of B0005 battery under different cycles.
Due to the inconsistent position of the measured attributes under the same time step of each cycle, the intelligent algorithm and machine learning method cannot be used to extract features. Therefore, the corresponding prediction curve cannot be modeled directly using the attributes measured by the battery. However, it can be observed from Figure 5 that the shapes of the curves under different cycles are similar, and the model points on the curve have typical characteristics, such as the minimum point and the time at the minimum point of the curve point. The time at the minimum point decreases with the increase in the cycle of the curve, which is obviously related to the capacity. In order to extract these representative points, this paper uses the IDP algorithm to extract the characteristics of each attribute of the battery.
The representative points have high visibility, such as the convex and convex of the curve, the highest and lowest points of the curve. According to the curve shape, there are six representative points of the curve in Figure 5, and the IDP algorithm extracts the six representative points of the curve. The results are shown in Figure 6.
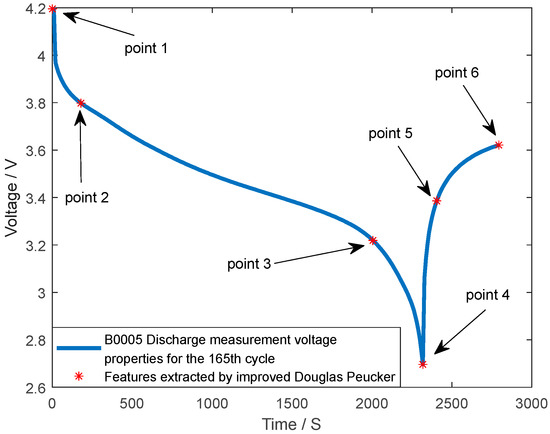
Figure 6.
Measurement voltage properties of discharge at points extracted by the Improved Douglas–Peucker algorithm.
Taking point 5 in Figure 6 as an example, the principle of extracting feature points by the IDP algorithm is shown: point 4 is the lowest point of the curve, and point 6 is the endpoint of the curve, while the line segment formed by point 4 and point 6 is A.B. The distance between all points on the curve from point 4 to point 6 to A.B. is calculated, and the corresponding point with the maximum distance is point 5. It can be observed from Figure 6 that the representative points on the curve can be well extracted by using the IDP algorithm.
Each charge and discharge cycle of the battery includes the voltage measurement, current measurement, temperature measurement, current charge, and voltage charge of the charging experiment, including voltage measurement, current measurement, temperature measurement, current load, and voltage load of the discharge experiment for a total of 10 attributes.
According to the same method, the IDP algorithm is used to extract the voltage measured, the current measured, temperature measured, current charge, and voltage charge attribute characteristics of the charging experiment, and the number of representative points is obtained as follows: 5, 6, 6, 6, and 6. The voltage measured, the current measured, temperature measured, current load, and voltage load attribute characteristics of the discharge experiment are extracted, and the number of representative points is 6, 8, 5, 4, and 8. A total of 60 representative points are obtained, and each point contains two parameters of time and attributes value, so a total of 120 features are obtained. After removing the same features (e.g., the x-axis coordinates of the last value of each curve under the charging attribute are the same) and the features with zero variance (e.g., the x-axis of the first point of each curve is 1), 81 feature vectors are finally obtained.
3.2. Health Factor Selection Based on Binary LAOS Algorithm
Adding some redundant features will cause multiple collinearity problems and increase the complexity of the prediction model. Some noise features will have a negative impact on the model. The redundant features and noise features increase the complexity of the model, resulting in over-fitting, which further affects the diagnostic effect of the model. Therefore, it is necessary to screen the input features.
This paper uses the Wrapper method to filter features, eliminate irrelevant features, and obtain the optimal feature subset. The principle is that the model is used to train and evaluate the feature subset and the target (label) set, and the binary optimization algorithm is constructed. Training accuracy is used as the standard to measure the quality of the feature subset, and the optimal algorithm is used to select the best feature subset.
In this paper, 39-dimensional features are removed by the filter filtering method and 81-dimensional features are retained. Due to the large dimension, there are possibilities for an exhaustive search with a complete search method. The computational complexity of full traversal is too large, and a heuristic search can obtain better features with fewer search times. Therefore, this paper uses a heuristic rather than a complete search method.
The training model selected in this paper is the XGboost model, and the LAOS algorithm is used as a heuristic search algorithm to construct a LAOS binary coding algorithm to select the features of the obtained feature set.
The definition of independent variables in a binary optimization algorithm is as follows: set a column length of N (N = 81) 0/1 binary column vector as the independent variables of the optimization algorithm; N is the number of features in the original data set, 0 is the not selected features, and 1 is the selected features.
The specific steps of feature selection are as follows: Firstly, the first 100 cycles of battery B0005 are divided into training samples, and the 101st to 168th cycles are divided into verification samples. Then, the input features are normalized, and the MSE (Mean Square Error) value of the predicted value and the actual value is used as the fitness function value. The training samples are used to train the XGboost model. Then, the trained XGboost model is used to predict the validation samples. The 0/1 binary column vector with length N is used as the independent variable, and the above MSE value is used as the fitness function value. The LAOS algorithm is used as the optimization algorithm. The feature subset with the minimum fitness is obtained, which is the optimal feature subset.
In Equation (12), N is the number of samples; is the true value; and is the predicted value.
The fitness function curve of the binary LAOS optimization algorithm is shown in Figure 7.
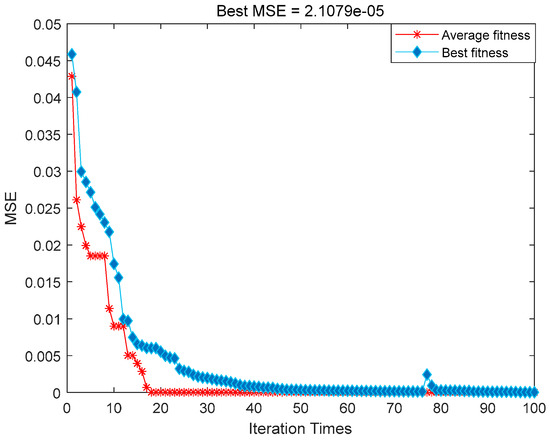
Figure 7.
The fitness curve of the LAOS optimization algorithm.
Figure 7 shows that the fitness function value does not change after 19 iterations, and the MSE value reaches the minimum value. After LAOS coding, a 12-dimensional optimal feature subset is obtained. The Pearson and Spearman values between the capacity of the 12-dimensional feature subset and the features are shown in Figure 8.
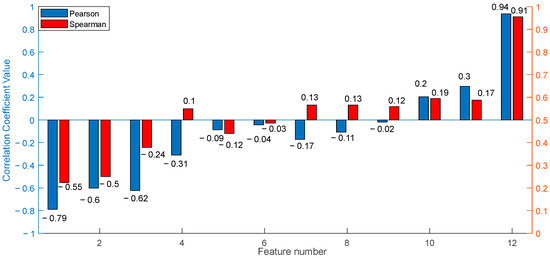
Figure 8.
Pearson and Spearman correlation coefficients between characteristics and capacity.
According to Figure 8, the Pearson and Spearman values between some features and the capacity are higher than 0.9, indicating that the features fit the capacity well.
4. The SOH Prediction of Lithium Batteries
In practical applications, we expect that the model trained by one or more batteries can accurately predict the SOH of other batteries under the same model, the same working condition, and the same environment and accurately predict the SOH of the same battery. Therefore, this paper has conducted two experiments with different battery predictions and the same battery prediction.
In this paper, the data of B0005, B0006, and B0007 are selected for the prediction between different batteries, which means the B0005 battery is chosen to be the training set to train the model, and the trained model is used to predict the SOH of the B0006 battery and B0007 battery. The B0005, B0006, B0007 and B0018 data are used to predict the same battery. In the selected battery data, since the charge and discharge cycles of the B0018 battery are different from those of the other three batteries and the data are quite different, the B0018 battery is not used to predict different batteries.
4.1. The SOH Prediction of Different Batteries
Here, the XGboost model is selected as the SOH prediction model, and the B0005 features extracted by the above method are used as input for model training. Then, the trained model predicts the SOHs of B0006 and B0007.
Because the super parameters in the XGboost model have a noticeable influence on the model, different optimization algorithms are used to optimize the super parameters of the XGboost model, and the performance of each model is compared to select an optimal model.
4.1.1. The SOH Prediction Based on the XGboost Model and Its Optimization Model
Because the super parameters of the XGboost model have an obvious influence on the model, the learning rate learning_rate makes the calculation process more conservative by reducing the weight of the feature. The maximum depth, max_depth tree is the maximum depth, and the greater the value, the easier it is to overfit. The reg_lambda is the weight coefficient of the L2 regularization term, and the greater the model is, the more conservative it is. The reg_alpha is the weight coefficient of the L1 regularization term, and the greater the model is, the more conservative it is. The n_estimators are the number of weak learners. The larger the model complexity is, the stronger the model fitting ability is, but if the model fitting ability develops too well, it will lead to the overfitting of the model [32,33].
Here, the AOS algorithm, particle swarm optimization (PSO) algorithm, and LAOS algorithm are used to optimize the parameters of learning_rate, max _ depth, reg _ lambda, reg _ alpha, and n _ estimators in the XGboost model, and the related prediction results are compared. The LAOS, AOS, and PSO algorithm population size is set to 50, and the number of iterations is set to 100. The B0005 battery is divided into a training set and a verification set. The first 100 cycles are divided into training sets, and the 101st to 168th cycles are divided into verification samples. The MSE value of the verification set is used as the fitness value to train the XGboost model and its optimization models, and then the SOH prediction of B0006 and B0007 batteries is carried out using the obtained model. The prediction results of the XGboost model and its optimization models are shown in Figure 9.
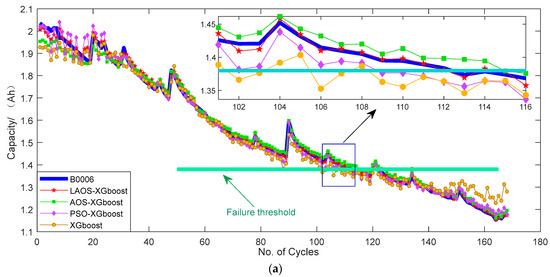
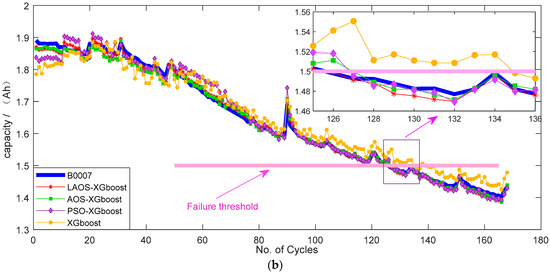
Figure 9.
Prediction results of XGboost and its optimization model. (a) SOH prediction results of B0006 battery. (b) SOH prediction results of B0007 battery.
In order to further compare the performance of the above models, this paper takes the Theil IC (TIC), the square sum of error (SSE), root mean square error (RMSE), the goodness of fit (R2), and absolute error (AE) of a residual lifetime as the evaluation indexes to evaluate the model. The hyperparametric values of each model are shown in Table 1. Detailed indicators of each model are shown in Table 2.

Table 1.
Super parameter table of optimization results of each model.
Table 2.
Evaluation indicators of various models.
Among them:
where n is the sample number; is the true value; and is the predicted value. ANL is the actual number of life cycles, and CNC is the current number of cycles.
The combination of Table 2 and Figure 9 shows that in B0006 and B0007 batteries, the goodness of fit of all XGboost models is higher than 0.95, and the battery capacity regeneration can be well predicted. Compared with other models, the TIC value and RMSE value of the LAOS-XGboost model are the lowest, and the AE is 0. The RUL prediction effect is good and the model performs best. Therefore, the model established in this paper has a good generalization ability in battery SOH prediction.
4.1.2. Model Robustness Test
This paper adds Gaussian white noise to the input features to test the robustness of the proposed Improved Douglas–Peucker LAOS-XGboost model.
Since the units of health factors are different, the variation ranges of values are also different. The influence of Gaussian noise with the same intensity directly added to each health factor on each feature is also different. In order to ensure that the added noise can simulate more real interference, Gaussian white noise is added after the normalization of each feature. The noise intensity is 10%, 1%, and 1 ‰, and the corresponding signal-to-noise ratio is 10 dB, 20 dB, and 30 dB.
Taking B0005 as the training set, the IDP algorithm extracts features and selects the optimal feature subset. Then, the LAOS-XGboost model is used to predict the SOH of B0006 and B0007 after adding Gaussian white noise. The results are shown in Figure 10.
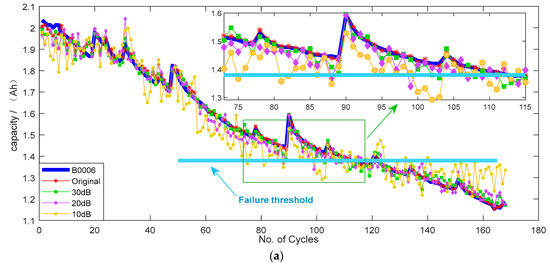
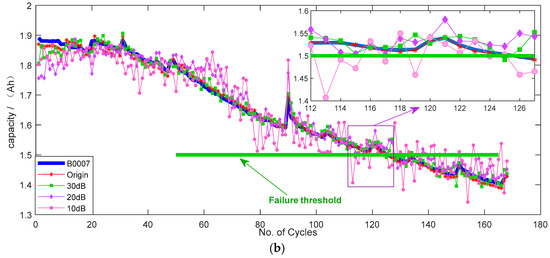
Figure 10.
Prediction results of LAOS-XGboost model after adding noise. (a) SOH prediction results of B0006 battery. (b) SOH prediction results of B0007 battery.
The detailed indicators of the model are shown in Table 3.
Table 3.
Detailed prediction results of various models.
Since the generated Gaussian noise is random, the results of each operation are slightly different. The average results are selected in Figure 10 and Table 3. Combined with Table 3 and Figure 10, it can be observed that with the decrease in SNR, the intensity of environmental noise increases and the prediction accuracy of the model decreases gradually. On the other hand, although the AE index of the B0006 battery becomes larger and the RUL prediction accuracy becomes worse after adding noise, the R2 is above 0.9, the TIC index is lower than 0.03, and the SSE value is lower than 0.5, indicating that the SOH prediction effect of the model after adding noise is still good. In summary, the feature extraction method and the LAOS-XGboost prediction model used in this paper perform high robustness.
4.2. The SOH Prediction of the Same Battery
In order to test the universality of the feature extraction method and prediction model in this paper, SOH prediction between the same battery is carried out, that is, using the data of the first n cycles of the battery to train the model, and then predict the N cycles of the battery.
After data preprocessing, 168 cycles of B0005, B0006, and B0007 batteries, and 131 cycles of B0018 batteries were obtained. The first 70 loops of B0005, B0006, and B0007 are set as the training set, 70 to 85 loops as the validation set, and 86 loops as the prediction starting point. The first 60 cycles of the B0018 battery are set as the training set, 61 to 75 cycles as the validation set, and 76 cycles as the prediction starting point. According to references [30,31], the life failure thresholds of B0005, B0006, B0007, and B0018 batteries were set as 1.38 Ah, 1.38 Ah, 1.5 Ah, and 1.4 Ah, respectively. The proposed feature extraction method is used to establish feature engineering, and the XGboost model and its optimization model are used to predict the data. The population size of each optimization algorithm is set to 50, and the number of iterations is set to 100. The prediction results are shown in Figure 11.
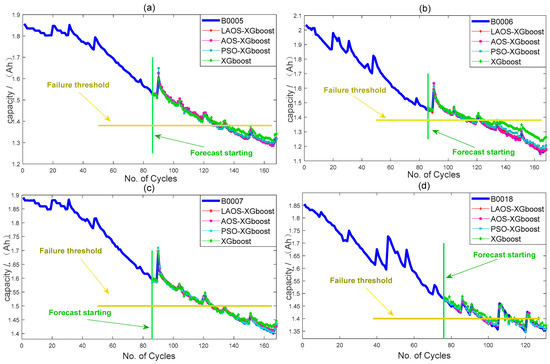
Figure 11.
The SOH prediction of the same battery. (a) SOH prediction results of B0005 battery. (b) SOH prediction results of B0006 battery. (c) SOH prediction results of B0007 battery. (d) SOH prediction results of B0008 battery.
It can be observed from Figure 11 that the optimized XGboost has a better prediction effect than the original XGboost. In order to compare the model performance in detail, the five indicators of TIC, SSE, RMSE, AE, and R2 are still used to evaluate the model performance, and the results are shown in Table 4.
Table 4.
Evaluation results of different models under the same battery.
Combined with Figure 11 and Table 4, it can be observed that the R2 of all models of B0005, B0006, and B0007 batteries was higher than 0.98, the RMSE was lower than 0.02, and the TIC was lower than 0.07, indicating that the characteristic engineering established in this paper had a good prediction effect on the XGboost model. The AEs of B0005, B0006, B0007, and B0018 batteries are 0, indicating that the feature engineering established in this paper can accurately predict battery failure in the XGboost model. The B0018 battery prediction effect is the worst because the B0018 battery data varies considerably, the capacity differs significantly, and the measured cycle number is lacking. Compared with all models, the LAOS-XGboost model performs best.
According to Table 2 and Table 4, under the same model, the TIC index predicted by the SOH of the same battery is lower, and the prediction effect in the same battery is better than that between different batteries.
In summary, whether the SOH prediction of different batteries or the SOH prediction of the same battery, the prediction effect is good by using the feature engineering combined with the LAOS-XGboost model established in this paper.
5. Conclusions and Discussion
In order to extract the health factors of lithium-ion batteries and accurately predict the SOH and RUL of batteries, a new feature processing method and SOH prediction model are proposed in this paper. The IDP algorithm is used for feature extraction and the Wrapper method is used for feature selection. Then, the LAOS-XGboost prediction model is established to predict the SOH in different batteries and the same battery. The conclusions are as follows:
- (1)
- The IDP algorithm in this paper can realize the feature extraction of fixed dimensions and has achieved good results in the feature extraction of battery data.
- (2)
- With feature engineering based on the IDP algorithm, after eliminating irrelevant features with the cascade binary coding LAOS algorithm, the SOH prediction is carried out with the XGboost model, and good results are achieved in the SOH prediction of different batteries. Among them, the LAOS-XGboost model has the best performance, and the AE index is 0.
- (3)
- After adding Gaussian white noise, the LAOS-XGboost model achieves good prediction results. Under 30% amplitude of Gaussian white noise, the TIC indexes of the LAOS-XGboost model are lower than 0.03, each index can maintain good results, and the model has strong robustness.
- (4)
- In the prediction of the same battery, under the characteristic engineering established in this paper, the goodness of fit of all XGboost models is higher than 0.88, and the RMSE is lower than 0.05. The LAOS-XGboost model performs best, and the AE values are all 0.
Discussion: In practical use, we prefer to realize the SOH prediction between different batteries (e.g., for the battery in a machine, we hope to use the model established by the battery data of the same type in the same environment and working conditions to predict the SOH and RUL of all the batteries after the machine, so as to accurately identify the failure time of the battery in the same machine in the workshop and prevent the occurrence of accidents). According to the research of this paper, it is found that the prediction between different batteries can achieve a good prediction effect. This paper proposes a feature extraction method and establishes the LAOS-XGboost model to predict between different batteries. The robustness of the proposed model is also studied in this paper and it is found that the model still achieves good prediction results under 10 dB SNR. Following the research, this paper also studies the SOH prediction under the same battery. It is found that the prediction effect of the model established under the same battery is better than that between different batteries. The SOH prediction between different batteries is more difficult, which can be achieved if the battery model, working environment, and working mode is the same.
Author Contributions
Conceptualization, W.C.; data curation, M.Z.; methodology, W.C.; project administration, M.Z.; resources, M.Z. and J.Y.; validation, J.Y.; visualization, T.F.; writing—original draft, W.C.; writing—review and editing, M.Z. and W.C. All authors have read and agreed to the published version of the manuscript.
Funding
This research was funded by the Natural Science Foundation of the Higher Education Institute of Anhui Province (KJ2020A0309), National Natural Science Foundation of China (51874010).
Institutional Review Board Statement
Not applicable.
Informed Consent Statement
Not applicable.
Data Availability Statement
The access URL for dataset A in the manuscript is: https://ti.arc.nasa.gov/tech/dash/groups/pcoe/prognostic-data-repository/ (accessed on 16 November 2021).
Acknowledgments
The authors would like to thank Natural Science Foundation of the Higher Education Institute of Anhui Province for helpful discussions on topics related to this work. The authors would like to thank Natural Science Foundation of the National Natural Science Foundation of China for helpful discussions on topics related to this work.
Conflicts of Interest
The funders had no role in the design of the study, in the collection, analysis, or interpretation of data, in the writing of the manuscript, or in the decision to publish the results.
References
- Lee, J.-H.; Lee, I.-S. Lithium Battery SOH Monitoring and an SOC Estimation Algorithm Based on the SOH Result. Energies 2021, 14, 4506. [Google Scholar] [CrossRef]
- Venugopal, P.; Vigneswaran, T. State-of-Health Estimation of Li-ion Batteries in Electric Vehicle Using IndRNN under Variable Load Condition. Energies 2019, 12, 4338. [Google Scholar] [CrossRef]
- Meng, J.; Cai, L.; Stroe, D.-I.; Ma, J.; Luo, G.; Teodorescu, R. An optimized ensemble learning framework for lithium-ion Battery State of Health estimation in energy storage system. Energy 2020, 206, 118140. [Google Scholar] [CrossRef]
- Chang, C.; Wu, Y.; Jiang, J.; Jiang, Y.; Tian, A.; Li, T.; Gao, Y. Prognostics of the state of health for lithium-ion battery packs in energy storage applications. Energy 2022, 239, 122189. [Google Scholar] [CrossRef]
- Esfandyari, M.J.; Esfahanian, V.; Yazdi, M.R.H.; Nehzati, H.; Shekoofa, O. A new approach to consider the influence of aging state on Lithium-ion battery state of power estimation for hybrid electric vehicle. Energy 2019, 176, 505–520. [Google Scholar] [CrossRef]
- Haifeng, D.; Xuezhe, W.; Zechang, S. A new SOH prediction concept for the power lithium-ion battery used on HEVs. In Proceedings of the 2009 IEEE Vehicle Power and Propulsion Conference, Dearborn, MI, USA, 7–10 September 2009; pp. 1649–1653. [Google Scholar] [CrossRef]
- Sun, H.; Sun, J.; Zhao, K.; Wang, L.; Wang, K. Data-Driven ICA-Bi-LSTM-Combined Lithium Battery SOH Estimation. Math. Probl. Eng. 2022, 2022, 9645892. [Google Scholar] [CrossRef]
- Kim, T.; Qiao, W.; Qu, L. Online SOC and SOH estimation for multicell lithium-ion batteries based on an adaptive hybrid battery model and sliding-mode observer. In Proceedings of the 2013 IEEE Energy Conversion Congress and Exposition, Denver, CO, USA, 15–19 September 2013; pp. 292–298. [Google Scholar]
- Hu, X.; Feng, F.; Liu, K.; Zhang, L.; Xie, J.; Liu, B. State estimation for advanced battery management: Key challenges and future trends. Renew. Sustain. Energy Rev. 2019, 114, 109334. [Google Scholar] [CrossRef]
- Chowdhury, S.; Shaheed, M.N.B.; Sozer, Y. An integrated state of health (SOH) balancing method for lithium-ion battery cells. In Proceedings of the 2019 IEEE Energy Conversion Congress and Exposition (ECCE), Baltimore, MD, USA, 29 September–3 October 2019; pp. 5759–5763. [Google Scholar] [CrossRef]
- Zhuang, H.M.; Xiao, J. VRLA battery SOH estimation based on WCPSO-LVSVM. Appl. Mech. Mater. 2014, 628, 396–400. [Google Scholar] [CrossRef]
- Yang, A.; Wang, Y.; Tsui, K.L.; Zi, Y. Lithium-ion battery SOH estimation and fault diagnosis with missing data. In Proceedings of the 2019 IEEE International Instrumentation and Measurement Technology Conference (I2MTC), Auckland, New Zealand, 20–23 May 2019; pp. 1–6. [Google Scholar] [CrossRef]
- Zou, Y.; Hu, X.; Ma, H.; Li, S.E. Combined State of Charge and State of Health estimation over lithium-ion battery cell cycle lifespan for electric vehicles. J. Power Sources 2015, 273, 793–803. [Google Scholar] [CrossRef]
- Zhang, X.; Wang, Y.; Liu, C.; Chen, Z. A novel approach of battery pack state of health estimation using artificial intelligence optimization algorithm. J. Power Sources 2018, 376, 191–199. [Google Scholar] [CrossRef]
- Zhang, Y.; Guo, B. Online Capacity Estimation of Lithium-Ion Batteries Based on Novel Feature Extraction and Adaptive Multi-Kernel Relevance Vector Machine. Energies 2015, 8, 12439–12457. [Google Scholar] [CrossRef]
- Ezemobi, E.; Tonoli, A.; Silvagni, M. Battery State of Health Estimation with Improved Generalization Using Parallel Layer Extreme Learning Machine. Energies 2021, 14, 2243. [Google Scholar] [CrossRef]
- Bao, Z.; Jiang, J.; Zhu, C.; Gao, M. A New Hybrid Neural Network Method for State-of-Health Estimation of Lithium-Ion Battery. Energies 2022, 15, 4399. [Google Scholar] [CrossRef]
- Rahimifard, S.; Habibi, S.; Goward, G.; Tjong, J. Adaptive Smooth Variable Structure Filter Strategy for State Estimation of Electric Vehicle Batteries. Energies 2021, 14, 8560. [Google Scholar] [CrossRef]
- Hailin, F.; Xuan, Z. Health state estimation and remaining lifetime prediction of lithium batteries based on new health factors. J. Nanjing Univ. 2021, 57, 660–670. (In Chinese) [Google Scholar] [CrossRef]
- Xing, S.; Yonggang, L.; Jiangwei, S.; Zheng, C. Li-ion battery capacity prediction based on improved least squares support vector machine and Box-Cox transform. Mech. Eng. J. 2021, 57, 118–128. [Google Scholar]
- Feng, X.; Weng, C.; He, X.; Han, X.; Lu, L.; Ren, D.; Ouyang, M. Online State-of-Health Estimation for Li-Ion Battery Using Partial Charging Segment Based on Support Vector Machine. IEEE Trans. Veh. Technol. 2019, 68, 8583–8592. [Google Scholar] [CrossRef]
- Hu, X.; Che, Y.; Lin, X.; Deng, Z. Health Prognosis for Electric Vehicle Battery Packs: A Data-Driven Approach. IEEE-ASME Trans. Mechatron. 2020, 25, 2622–2632. [Google Scholar] [CrossRef]
- Zhang, S.; Zhai, B.; Guo, X.; Wang, K.; Peng, N.; Zhang, X. Synchronous estimation of state of health and remaining useful lifetime for lithium-ion battery using the incremental capacity and artificial neural networks. J. Energy Storage 2019, 26, 100951. [Google Scholar] [CrossRef]
- Zarei, R.; He, J.; Siuly, S.; Huang, G.; Zhang, Y. Exploring Douglas-Peucker Algorithm in the Detection of Epileptic Seizure from Multicategory EEG Signals. Biomed Res. Int. 2019, 2019, 5173589. [Google Scholar] [CrossRef]
- Azizi, M. Atomic orbital search: A novel metaheuristic algorithm. Appl. Math. Model. 2021, 93, 657–683. [Google Scholar] [CrossRef]
- Wang, H.; Zhang, Y.-M.; Mao, J.-X.; Wan, H.-P. A probabilistic approach for short-term prediction of wind gust speed using ensemble learning. J. Wind. Eng. Ind. Aerodyn. 2020, 202, 104198. [Google Scholar] [CrossRef]
- Wu, S.; Yuan, Q.; Yan, Z.; Xu, Q. Analyzing Accident Injury Severity via an Extreme Gradient Boosting (XGBoost) Model. J. Adv. Transp. 2021, 2021, 3771640. [Google Scholar] [CrossRef]
- Ogunleye, A.; Wang, Q.-G. XGBoost Model for Chronic Kidney Disease Diagnosis. IEEE-ACM Trans. Comput. Biol. Bioinform. 2020, 17, 2131–2140. [Google Scholar] [CrossRef]
- Saha, B.; Goebel, K. Battery Data Set, NASA Ames Prognostics Data Repository; NASA Ames: Moffett Field, CA, USA, 2007. Available online: http://ti.arc.nasa.gov/project/prognostic-data-repository (accessed on 16 November 2021).
- Xiaoqiong, P.; Zhuqing, W.; Jianchao, Z.; Jianfang, J.; Yuanhao, S. The remaining life prediction of lithium ion batteries based on PCA-NARX. J. Beijing Univ. Technol. 2019, 39, 406–412. (In Chinese) [Google Scholar] [CrossRef]
- Haifeng, L.; Peng, Y. The remaining life prediction of lithium-ion battery based on CNN-Bi-LSTM network. Power Autom. Equip. 2021, 41, 213–219. [Google Scholar] [CrossRef]
- Jiang, Y.; Tong, G.; Yin, H.; Xiong, N. A Pedestrian Detection Method Based on Genetic Algorithm for Optimize XGBoost Training Parameters. IEEE Access 2019, 7, 118310–118321. [Google Scholar] [CrossRef]
- Song, J.; Jin, L.; Xie, Y.; Wei, C. Optimized XGBoost based sparrow search algorithm for short-term load forecasting. In Proceedings of the 2021 IEEE International Conference on Computer Science, Artificial Intelligence and Electronic Engineering (CSAIEE), Greenville, SC, USA, 20–22 August 2021; pp. 213–217. [Google Scholar]
Publisher’s Note: MDPI stays neutral with regard to jurisdictional claims in published maps and institutional affiliations. |
© 2022 by the authors. Licensee MDPI, Basel, Switzerland. This article is an open access article distributed under the terms and conditions of the Creative Commons Attribution (CC BY) license (https://creativecommons.org/licenses/by/4.0/).