Article

Sizing of an Island Standalone Hybrid System Considering Economic and Environmental Parameters: A Case Study

1
Department of Electrical and Electronic Engineering, Chittagong University of Engineering & Technology (CUET), Chattogram 4349, Bangladesh
2
Department of Mechanical Engineering, Chittagong University of Engineering & Technology (CUET), Chattogram 4349, Bangladesh
3
Institute of Energy, University of Dhaka, Dhaka 1000, Bangladesh
4
College of Engineering, IT& Environment, Charles Darwin University, Casuarina, NT 0810, Australia
5
Engineering Design Research Group (EDRG), School of Mechanical Engineering, Faculty of Engineering, Universiti Teknologi Malaysia, Johor Bahru 81310, Johor, Malaysia
6
Center for Advanced Composite Materials (CACM), Universiti Teknologi Malaysia, Johor Bahru 81310, Johor, Malaysia
7
Razak Faculty of Technology and Informatics, Universiti Teknologi Malaysia, Jalan Sultan Yahya Petra, Kuala Lumpur 54100, Malaysia
8
Center for Communications and IT Research, Research Institute, King Fahd University of Petroleum & Minerals, Dhahran 31261, Saudi Arabia
*
Author to whom correspondence should be addressed.
Energies 2022, 15(16), 5940; https://doi.org/10.3390/en15165940
Submission received: 24 July 2022 / Revised: 7 August 2022 / Accepted: 10 August 2022 / Published: 16 August 2022
(This article belongs to the Special Issue Optimal Design of Off-Grid Power Systems)

Abstract

:
Due to the significance of environmental aspects, the modeling of hybrid systems should be performed with the lowest cost and environmental pollution. Therefore, an effective and optimum sizing method can ensure acceptable performance. This paper implements a “technique for order performance by similarity to the ideal solution” (TOPSIS) method combined with the “analytic hierarchy process (AHP)” method to size a standalone system based on techno-economic parameters. For this reason, a survey was conducted to collect local load data on Monpura Island, located in Bhola, Bangladesh. Visible and design faults of the existing PV/diesel mini-grid have also been identified. Five alternative hybrid configurations have been considered as to evaluate the best optimum system. Two economic and one environmental criterion was used to size the system. Two experts specialized in energy systems evaluated the criteria and proposed the suitable system. Battery, wind and PV capital cost multipliers have been considered as to perform sensitivity analysis. According to techno-economic analysis and expert opinion, PV/biogas/wind has been found to be the most appropriate system among these configurations. The system has a cost of electricity (COE) of 0.691 (USD/kWh) and emits only 4.43 kg of CO2 per year. The net present cost of the proposed system is 18% lower than the existing microgrid, and the model has lower emissions due to high renewable penetration. It was also found that integrating wind can significantly reduce battery capacity in the mini-grid. The proposed system consumes 34% less batteries than the existing system. Implementing this optimum system can result in greater benefit to the local people.

1. Introduction

People living in remote places often are deprived of electricity. To improve rural communities’ social and economic lifestyles, access to electricity is a must. Global electrification has seen major growth in recently. Worldwide electrification reached 89% in 2017, a 6% increase from 2010 [1]. However, 840 M people still lack electricity, and the possibility of grid connection is quite low. Therefore, fulfilling their need through local resources is a feasible solution [2,3]. Many researchers have determined the benefits of the renewable powered hybrid electricity generation for remote locations. Akram et al. proposed a standalone hybrid system based on residential load for an off-grid place in Pakistan [4]. This study found that the COE can vary from 0.0895 to 0.375 USD/kWh depending upon the system configuration. Khan et al. performed a detailed study to determine the viability of powering the telecommunication systems in India [5]. This study developed six cases for different cities in India and proposed a PV/wind/diesel/battery system having a COE of 0.164 USD/kWh to satisfy the demand of a telecom tower. Das and Hasan (2021) analyzed the suitability of a PV/wind/microgas turbine/battery system to fulfil electrical and thermal demands simultaneously [6]. The optimized system had a COE of 0.207 USD/kWh during running on the load following strategy. A novel PV-sizing optimization technique was introduced by Khirennas et al. to study the impact of PV integration into existing diesel systems at a lower penetration level [7]. The proposed system's levelized cost of energy (LCOE) was 0.275 USD/kWh, which is 13.32% more cost-efficient than only a diesel-based system (0.317 USD/kWh). Makhdoomi and Askarzadeh determined the economic feasibility of integrating energy storage and a solar tracker into diesel/PV/pumped hydro storage and diesel/PV/fuel cell systems [8]. Elkadeem et al. analyzed the optimization problems and proposed a hybrid system comprising a PV/wind/fuel/battery system in Egypt. The COE was 0.150 USD/kWh, having a renewable fraction (RF) of 42% [9]. Similarly, Das et al. proposed an environmentally and financially feasible energy system comprising a PV/battery/fuel cells system for a rural community in Malaysia [10]. Salameh et al. simulated a standalone system comprising a PV/diesel generator/battery system to deliver the residential load to a remote location in the United Arab Emirates [11]. The simulated system had a COE of 0.25–0.28 USD/kWh and RF of 51–58%. Azerefegn et al. determined that a standalone PV/diesel/battery configuration has higher COE than a grid-dependent PV/diesel/battery [12]. The study also highlighted the financial benefits that could be achieved by selling surplus electricity to the grid. Das et al. simulated an environmentally and economically feasible standalone system capable of meeting both thermal and electrical loads for five different weather zones of Australia [13]. Konneh et al. developed an optimum system consisting of three generator/PV/hydro/battery systems for Sierra Leone, and the system had a COE of 0.234 USD/kWh [14]. Guerello et al. used a “combined optimization process (COP)” to study the potential impact of energy efficiency initiatives in reducing the price of hybrid energy systems [15]. Rajbongshi et al. found that an off-grid hybrid system costs more than a grid-connected system for the same load profile [16]. Halabi et al. studied the impact of parameters such as fuel and battery cost, PV penetration levels, and load profile on the applicability of decentralized power stations in Sabah, Malaysia [17]. Konneh et al. analyzed the performance of a hybrid complementary power system for Sierra Leone’s southern region. This study found that a PV/generator 1/generator 2/generator 3/battery/hydro/converter system is the most cost-effective option for Sierra Leone [18]. Abnavi et al. found that providing electricity to an Iranian community through a PV/wind/battery/converter system will cost 0.119 USD/kWh [19]. Sanni et al. developed a PV/grid/biogas system as a backup for Nigeria’s unreliable grid electricity supply system and found that it will cost 0.164 USD/kWh to provide electricity through this system [20]. However, from the reviewed literature, it was found that only one objective function (COE) was considered as to size the hybrid system. Moreover, a multicriteria decision-making analysis was not carried out in other research for sizing the standalone system. Due to the significance of environmental aspects, the modeling of hybrid systems should be performed with the lowest cost and environmental pollution. An effective sizing approach was proposed based on a multicriteria decision-making analysis (MCDA) to optimize a standalone hybrid system in this analysis. The “analytic hierarchy process (AHP)” was integrated with the “technique for order performance by similarity to the ideal solution (TOPSIS)” method to size the standalone hybrid system. AHP was utilized to designate the appropriate weights for each criterion, while the configurations were ranked by employing TOPSIS. COE, NPC, and CO2 emission per year were selected to size the proposed hybrid system.

2. Energy Condition of Bangladesh

Significant changes have been made in the energy sector of Bangladesh with 93.5% of people gaining electricity [21]. At the end of 2017, the reserve of natural gas and coal was 6.3 trillion cubic feet (TCF) and 323 million tons, respectively. Since 2007, natural gas and coal consumption have seen a growth of 0.8% and 7.35%, respectively [22]. The need for natural gas has also increased for the power generation sector, and almost 40% of the total generation is supplied to power plants [23]. The government has declared that 10% of total electricity should be generated from sustainable energy sources [24]. In 2012, the government also launched a 500 MW solar energy program [25]. This includes a solar mini-grid (SMG), solar home systems, solar irrigations, and rooftop solar programs initiated by the government. In 2010, the first solar/diesel mini-grid with a capacity of 100 kW was implemented on the Sandwip island of Bangladesh. Until June 2020, twenty-seven solar mini-grid integrated with diesel were operational in Bangladesh [26]. The government has also planned to increase SMG in the future [27]. SMG projects under consideration can be found in Table 1.
However, the status of these running solar/diesel mini-grids is unknown [28]. Therefore, a survey was conducted on a mini-grid to identify its present status. Several faults were identified, which are discussed in the next section. After that, five alternative models were developed and implemented to observe their performance. The proposed MCDA is employed to find out the optimum standalone system.

3. Methodology

HOMER Pro was used to evaluate COE from various power generation schemes. Load profile from the island, economic and technical components, natural resources, and biogas were input into HOMER Pro (Figure 1).

3.1. Site Location and Present Electricity Conditions

Monpura Island is located at 22°18″ N and 90°58″ E. This island has abundant solar and wind resources. This island has an area of 373 km², and the total population living on this island is 76,582. Facilities such as thirty-seven primary schools, eight high schools, two colleges, fifty-four madrasahs, temples and mosques, one hospital, six community clinics, two banks, six clubs, four hotels, six offices and four guest houses can be found here.

3.2. Load Design

A survey was conducted on Monpura Island to collect load data. Inquiries for the families, business companies and infrastructures were distributed over the two-week study duration. The first two questionnaires were divided into four parts to accumulate current data about the business or household, detailed information about the respondent, data about the company or household finances, and the future state. The amenities questionnaire was divided into five sections to acquire recent data about the facility and personnel, energy and water, operations, facility management, and future outlook. After that, energy consumption per appliance was developed to project load demand. Then, Equation (1) was executed to obtain the total load demand per appliance [29].
E a p p l i c a t i o n = ( N 1 * m n 1 ) * ( p * x = 1 m t x m )

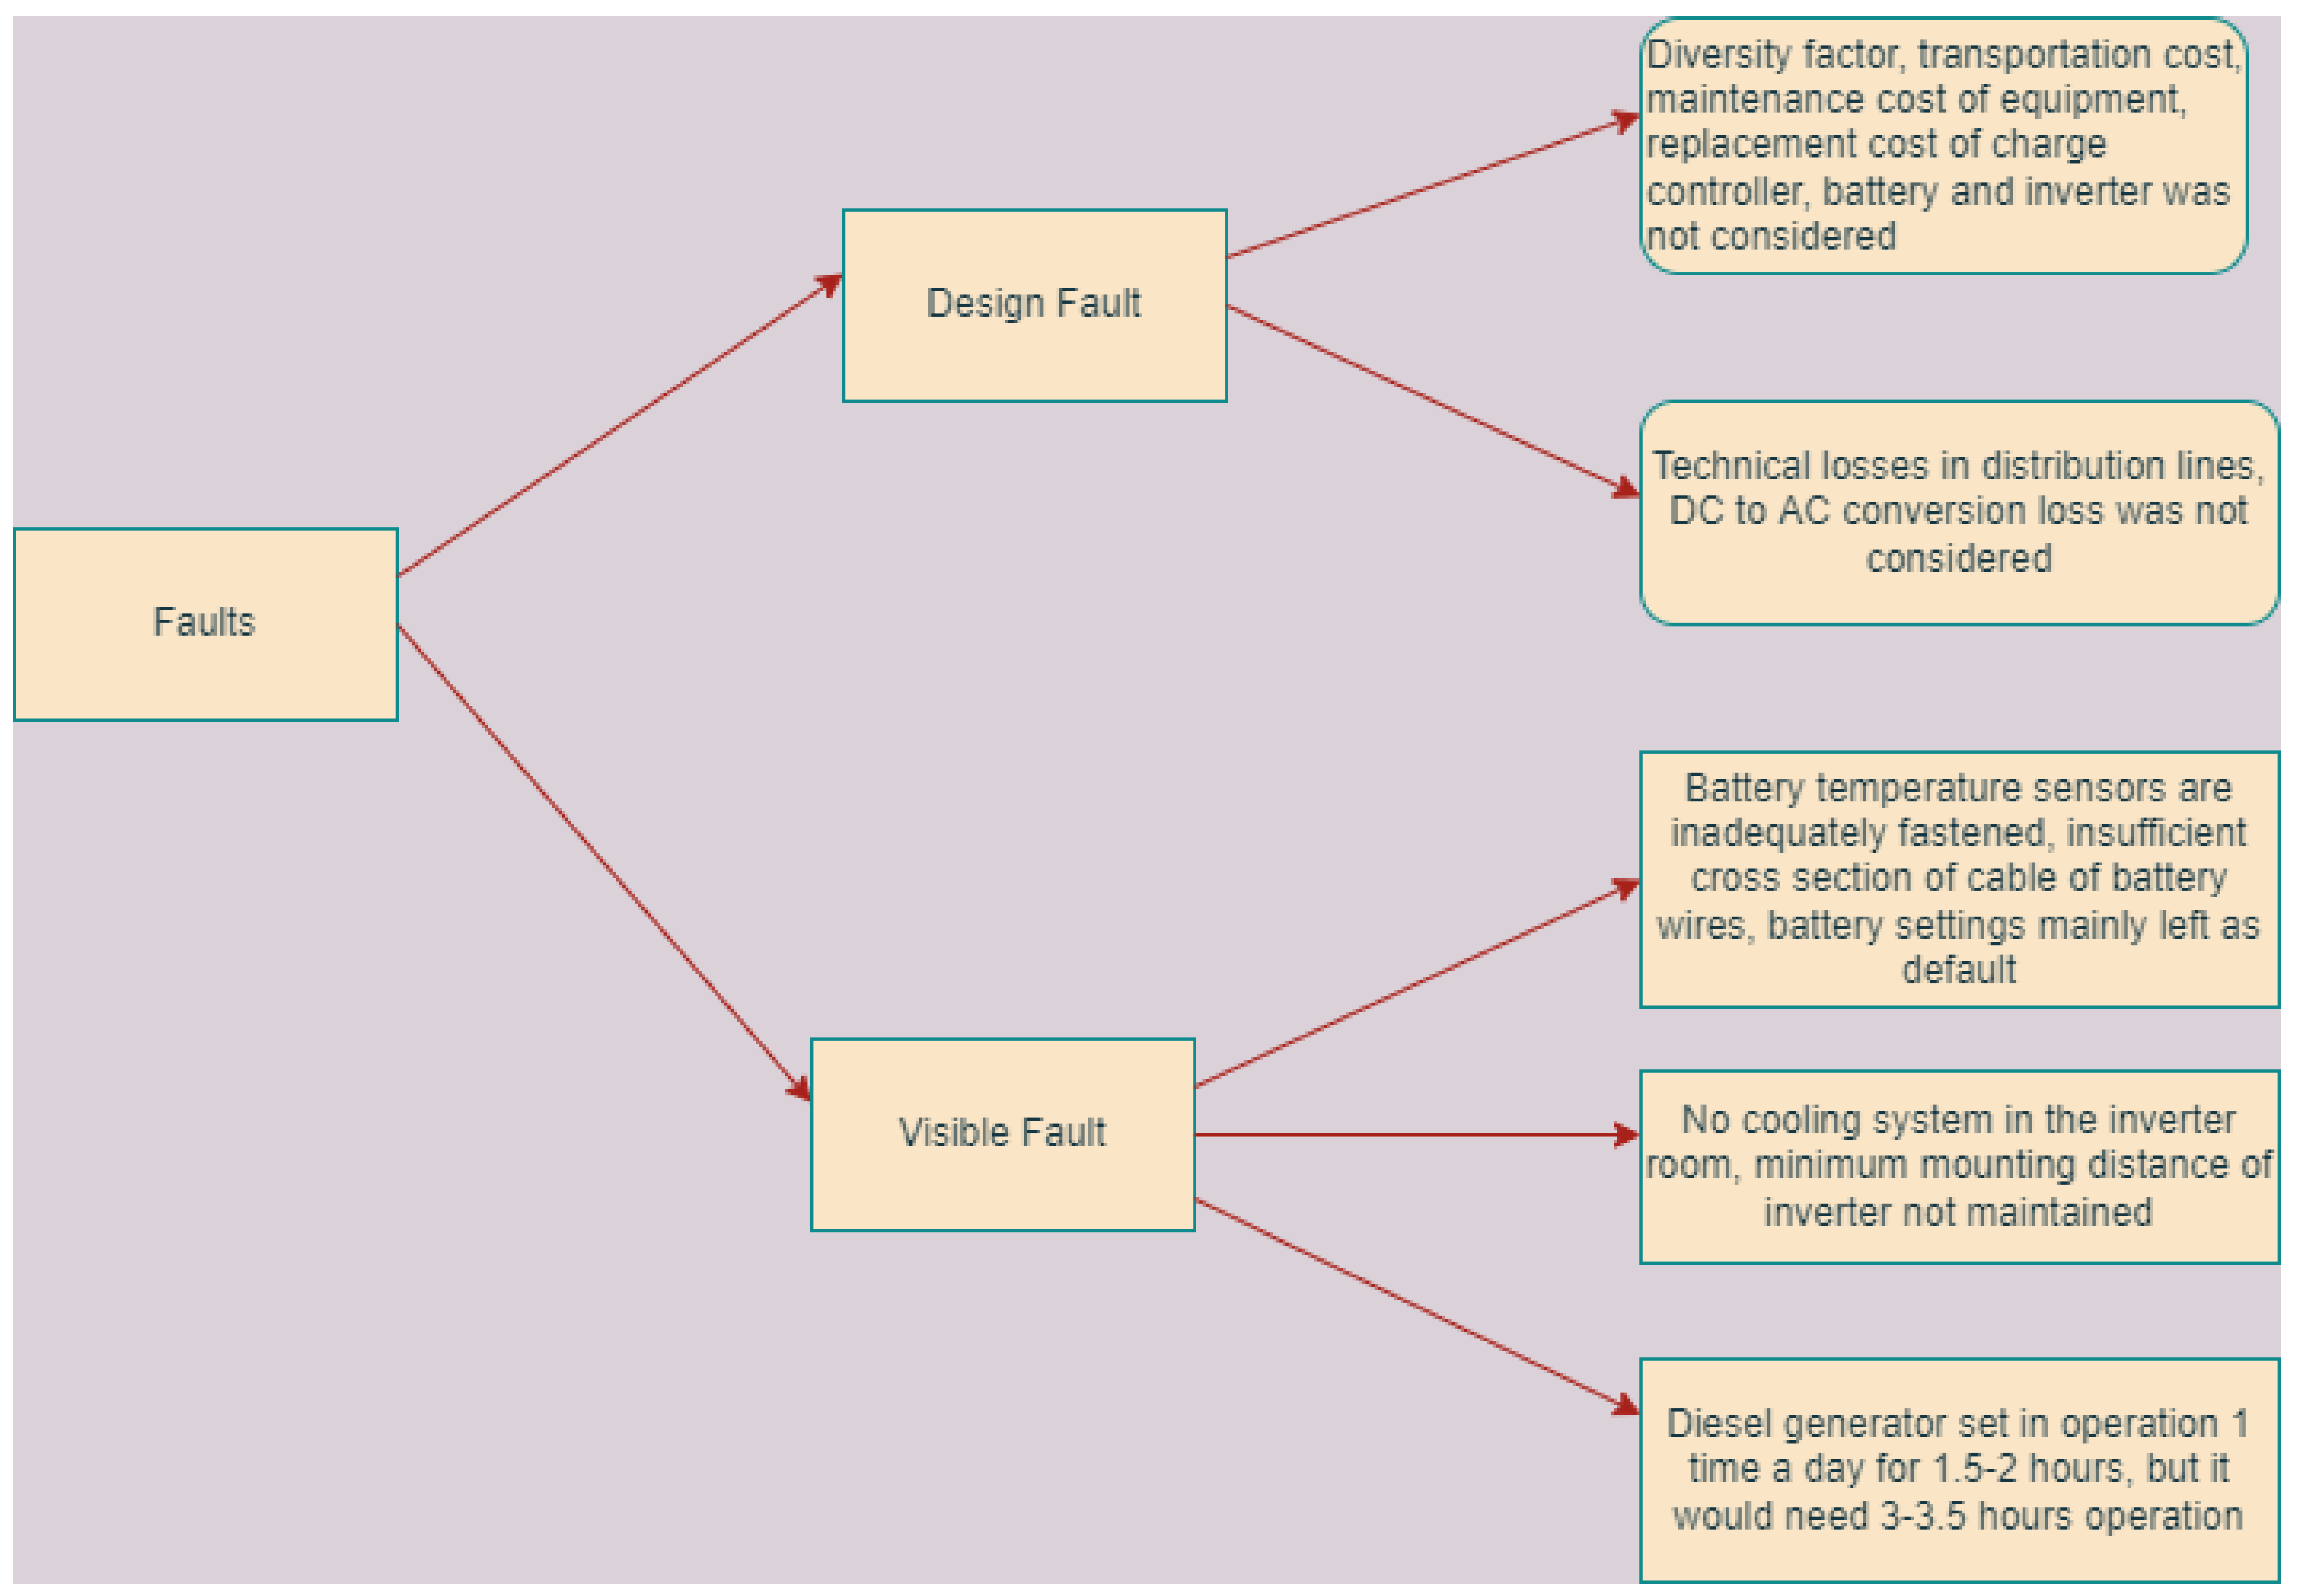
3.3. Existing Electricity Condition
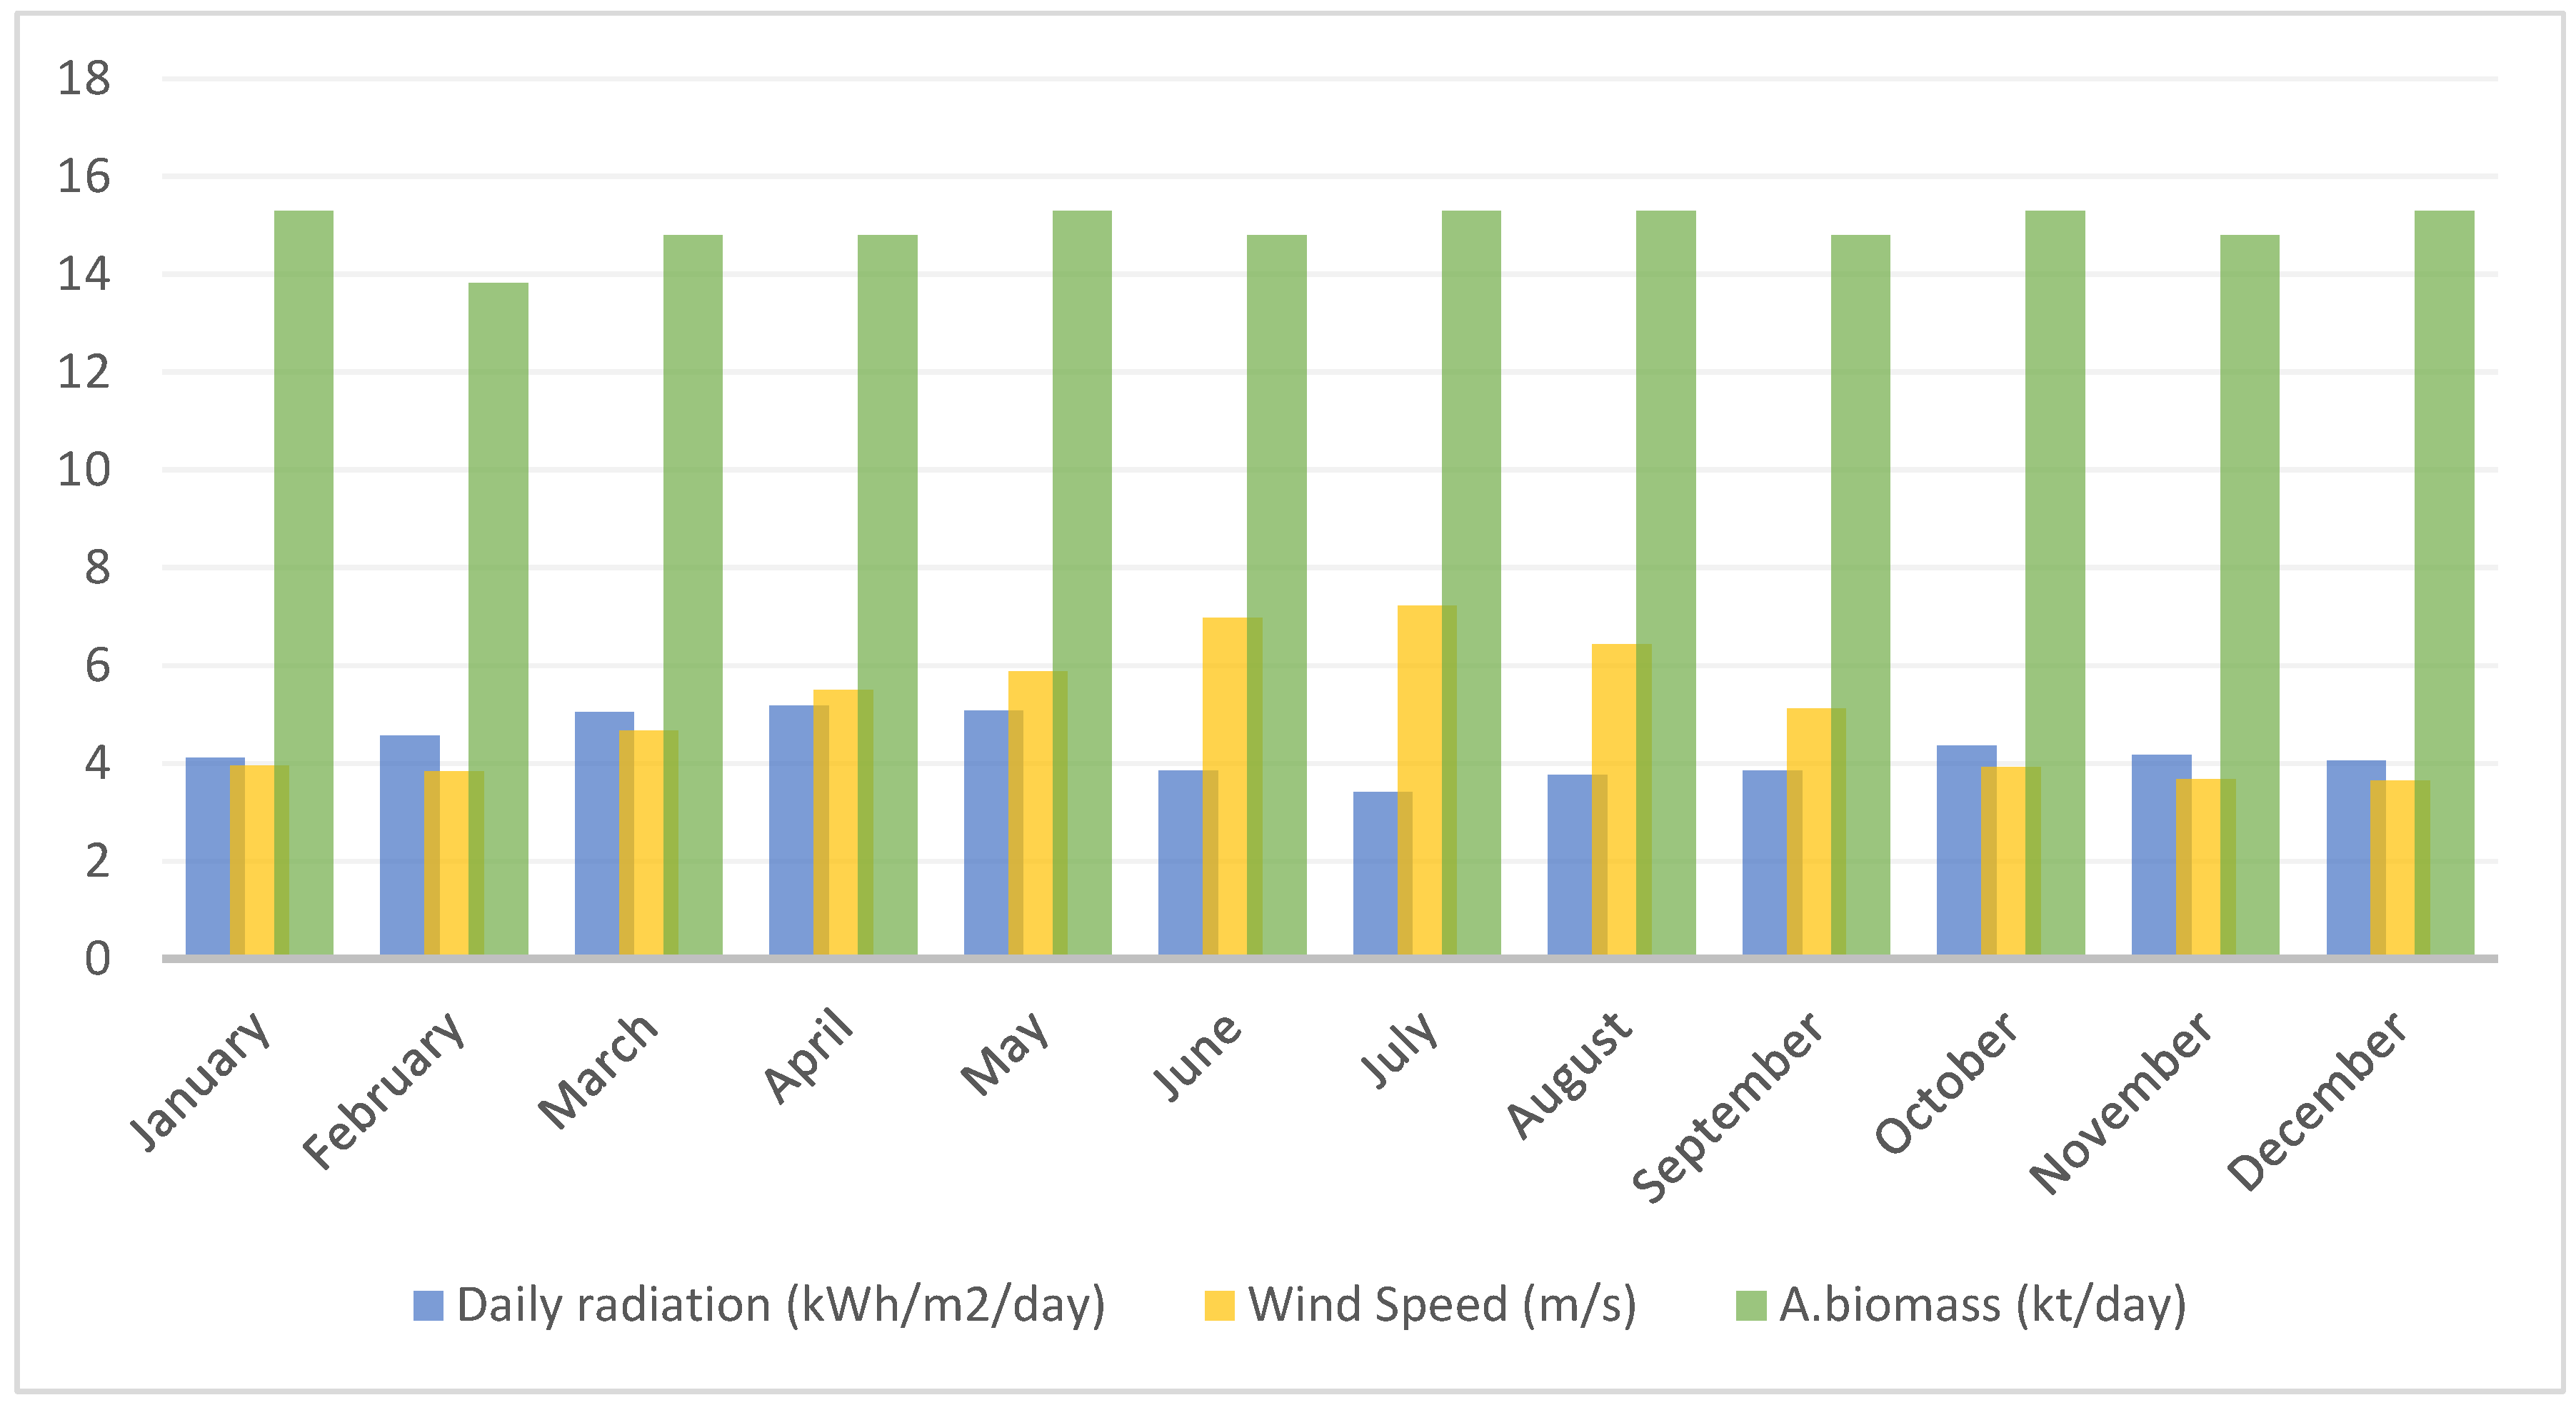
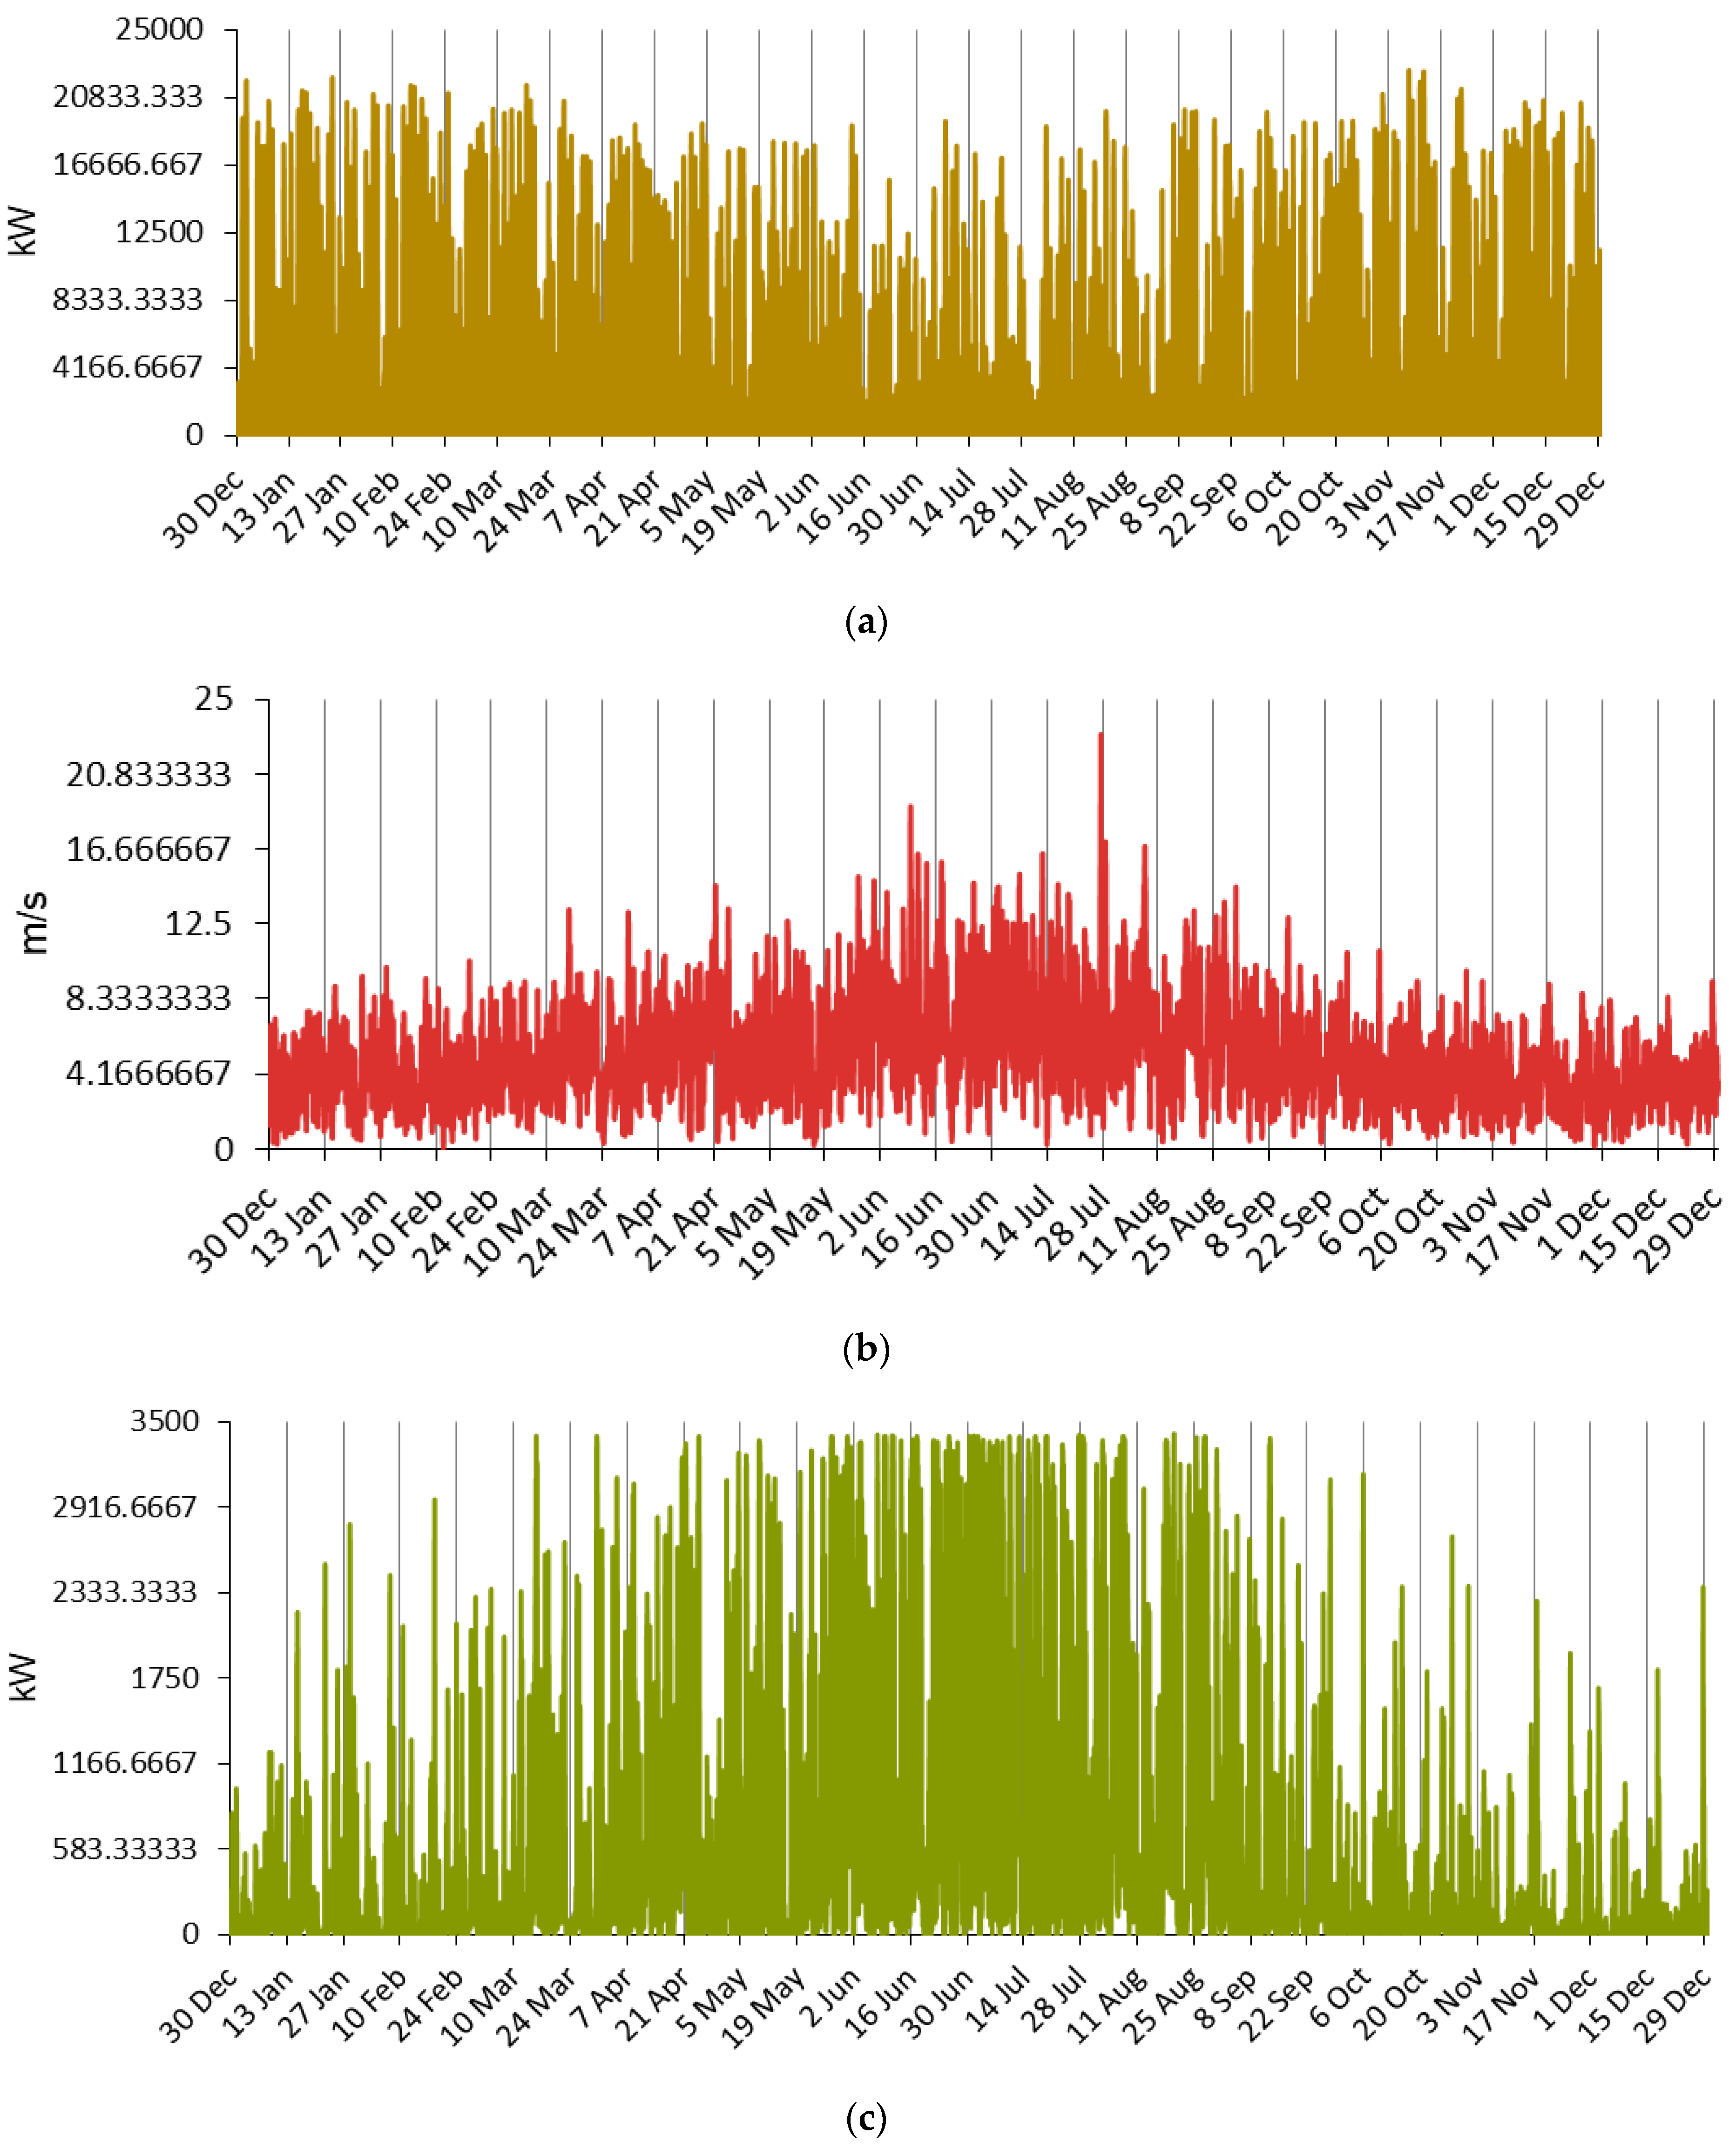
Diesel generators are employed here to satisfy electricity demand. These people are currently dependent on a 177-kW solar mini-grid for electricity. Four hundred eighty-two consumers obtain electricity from the mini-grid. Mechanical workshops use diesel generators of 10 kW to meet their electricity demand. In 2015, a 177-kW solar mini-grid was opened, and at present, more than twenty-five thousand residents are connected to the mini-grid. Solar Electro Bangladesh Limited (SEBL) constructed a 15 km distribution line to supply electricity. The life expectancy of the project is 20 years. Until 11 June 2017, it supplied electricity to 245 households, 193 shops, six workshops, one sawmill, four madrasahs, twelve auto-rickshaw charging stations, two schools, ten mosques, one furniture workshop, one brickfield, one bank, one club, and five offices. Table 2 highlights the instruments used in the solar mini-grid on Monpura Island.
During the survey, visible and design faults were observed in the mini-grid and delineated in Figure 2. In visible faults, significant damages were found in the battery. It was also found that regular maintenance was not conducted in the mini-grid. Several parameters, such as technical losses in distribution lines, inverter equipment loss, and DC to AC conversion loss, are not considered as in design fault.

3.4. Solar Resource

HOMER Pro utilizes solar radiation data to calculate the solar energy available from solar panels. Data on monthly average solar radiation were collected from the NASA website and were input into the HOMER Pro software [30]. The monthly average solar radiation data of Monpura are plotted in Figure 3. From Figure 3, it is clear that the highest solar irradiance can be observed in April and the highest clearness index in December.

3.5. Wind Resource

Based on the median wind speed data obtained from the NASA website within HOMER, it is evident that wind turbines can extract the highest energy in July. The median wind speed in Monpura is 5.07 ms−1 (Figure 3).

3.6. Biogas Resource

According to the Upazila Livestock Officer, about 21,000 cows, 10,500 buffalos, and 13,100 goats are in Monpura. The amount of manure available per day is calculated to be 274.04 t (Table 3). From this amount of manure, 9865.745 m3 of biogas can be produced daily. It has been assumed that 95% of the generated biogas will be utilized for cooking purposes. The biogas generator will use the remaining 5% to produce electricity. The per ton cost of biomass is considered as USD 16.67 [31]. Per kW, capital and replacement costs for biogas generators are taken similarly to 742 USD/kW [32,33]. The biogas fuel has a lower heating value, carbon content and gasification ratio, which are 5.50 MJ/kg, 5% and 0.70 (kg/kg), respectively.

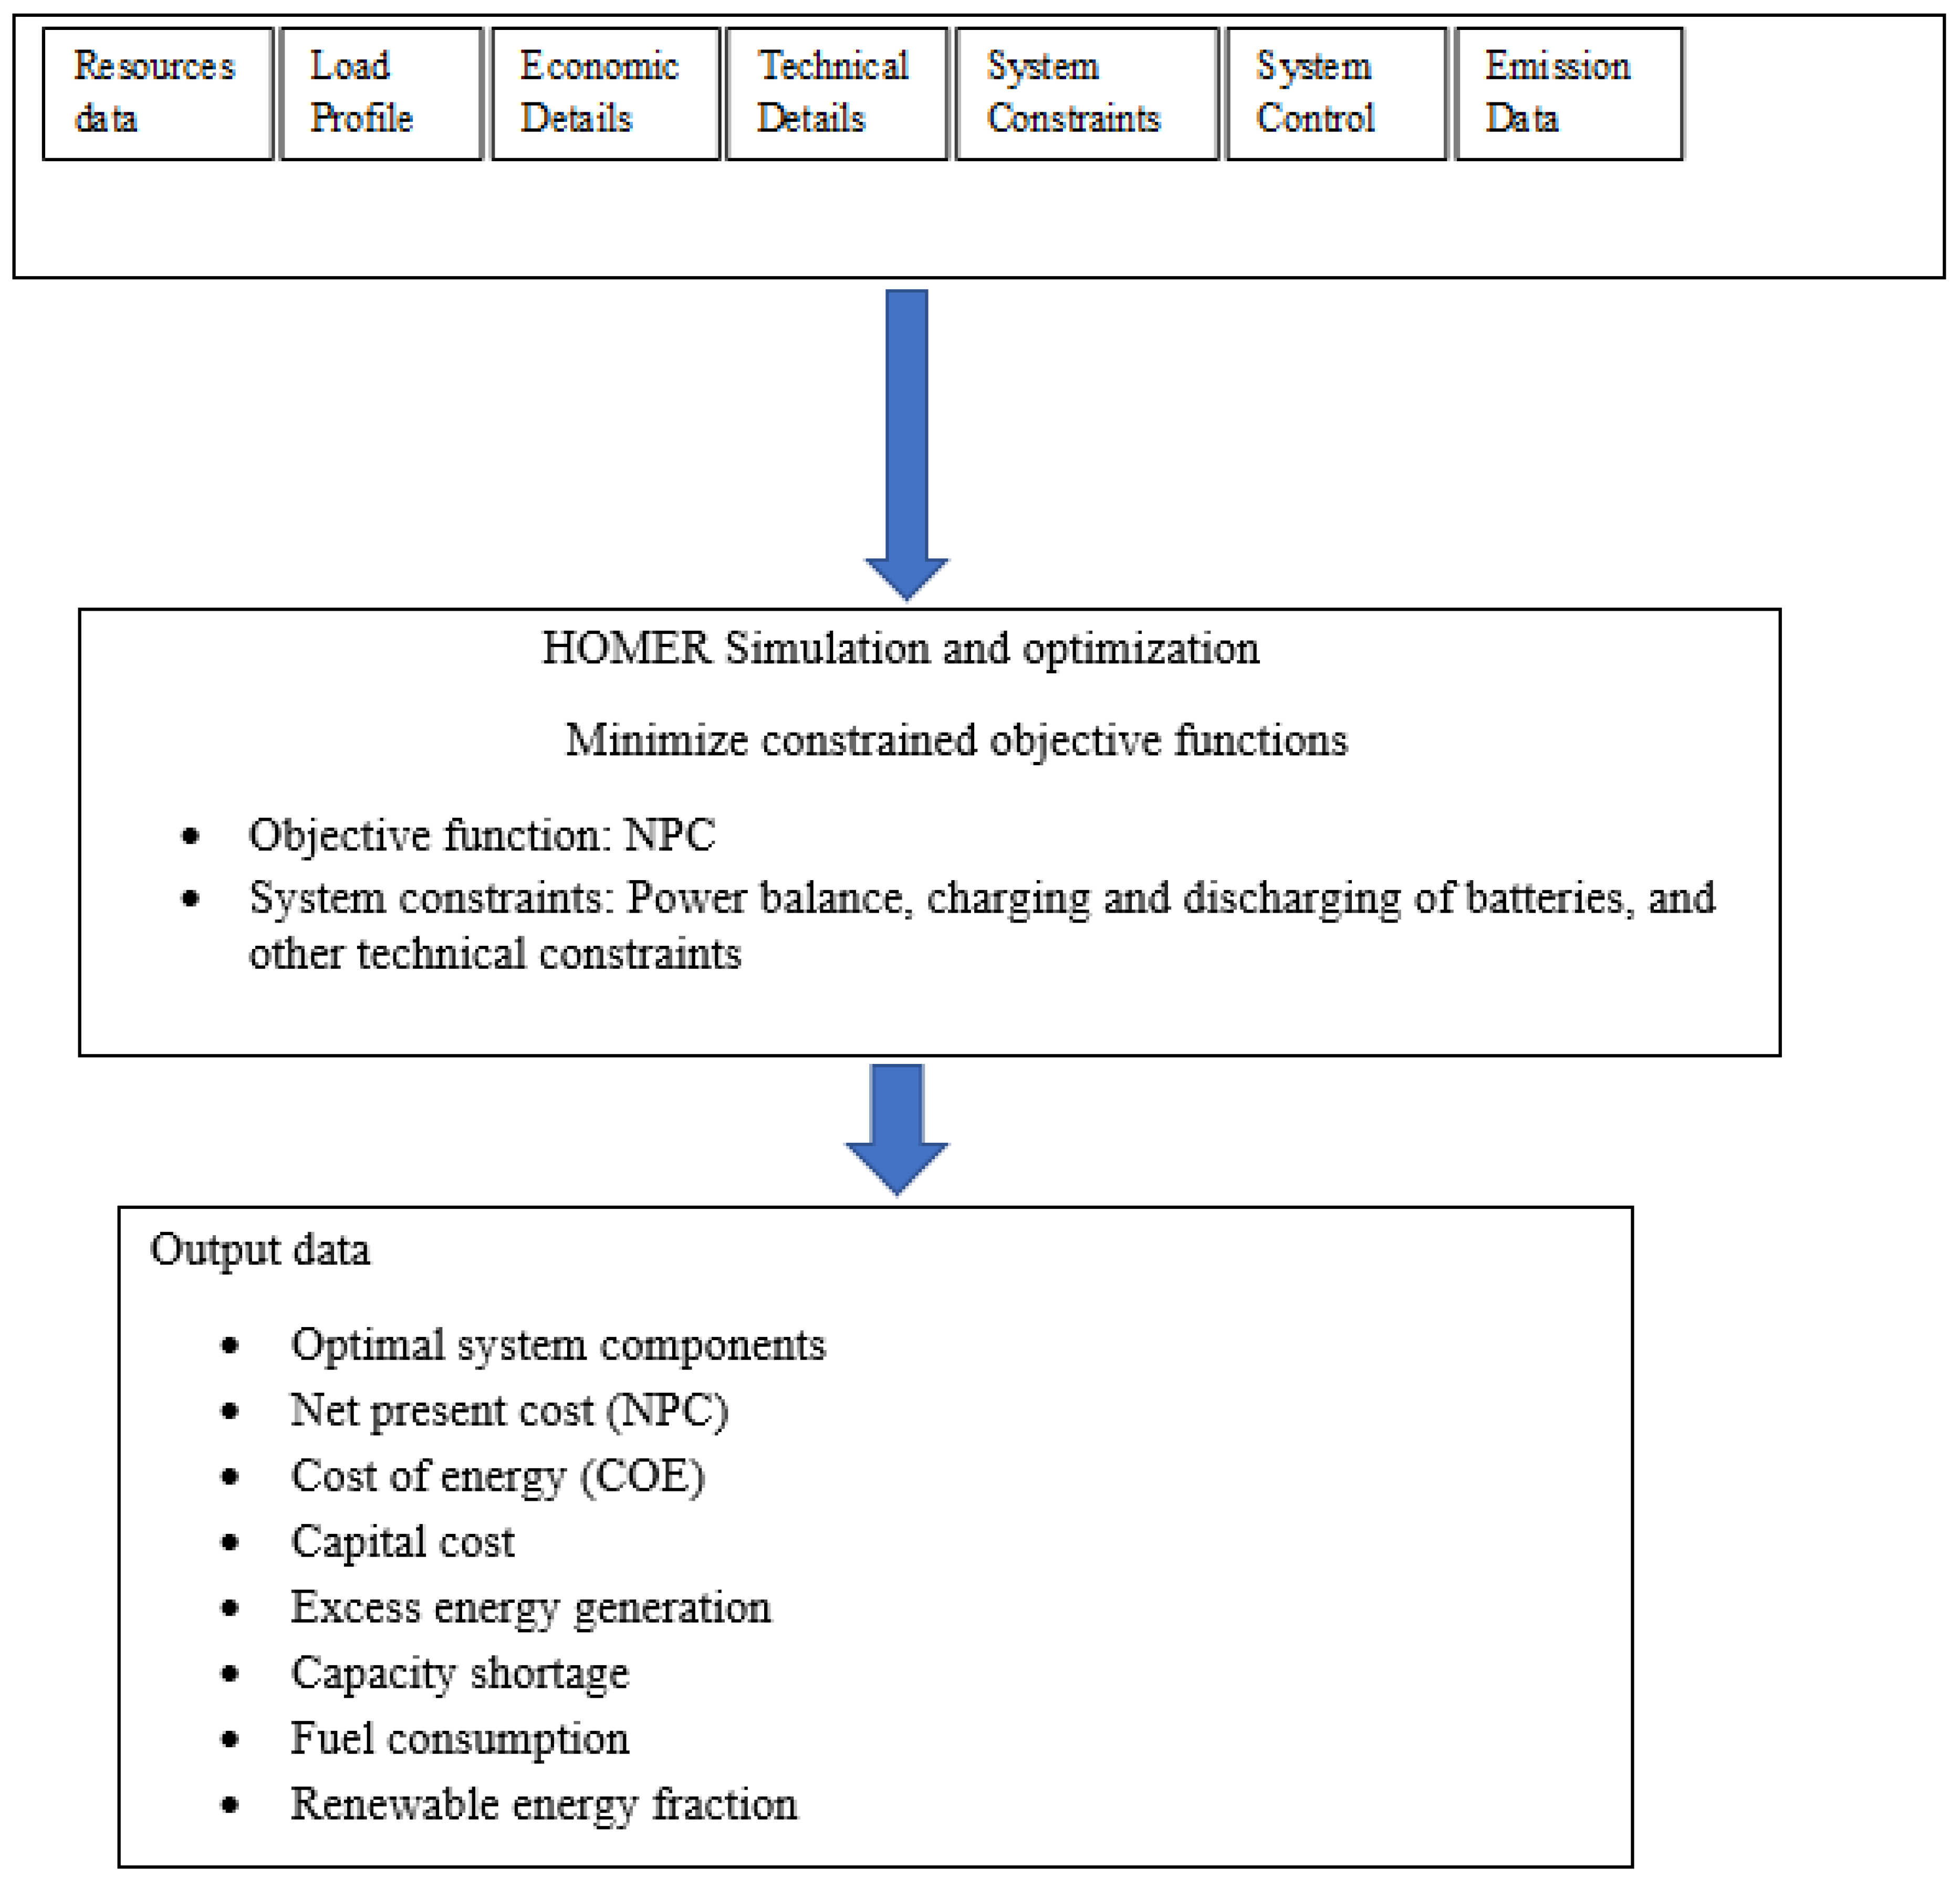
3.7. Modeling of the System

3.7.1. Diesel Generator (DG)

At a lower operating load, the generator has a fuel consumption rate. Owing to this, a minimum load ratio of 25% is considered as to run the Genset. The cost regarding capital, operation and maintenance, and replacement is considered as 370 USD/kW, 0.05 USD/kW/hour, and 296 USD/kW, respectively, for the diesel generator [6]. The fuel cost considered as here is USD 0.70 per liter [34]. The operating hour of the generator is considered as 15,000 h. The diesel fuel’s lower heating value, density, and carbon and sulfur contents are 43.2 MJ/kg, 820 kg/m3, 88% and 0.4%, respectively. The fuel consumption rate can be found in Equation (2) [32,33]
L = L 0 , dg Y dg + L 1 , dg P dg

3.7.2. Inverter

An inverter is generally employed to convert AC current into DC. The efficacy of the inverter considered as here is taken as 95%. The cost associated with capital and replacement costs is considered as USD 800 and 750, respectively [32,34]. The operation and maintenance costs are considered as USD 20 per year. The life expectancy of the inverter is input as 15 years. The efficacy of the inverter can be calculated from Equation (3) [32]:
P in = P out η

3.7.3. Lithium-Ion Battery

After fulfilling the load, the surplus electricity can be stored in the battery and supplied when renewable technologies such as wind and PV could hardly meet up the demand or other additional resources; for example, biogas when is unattainable. In this study, a generic 6 V “lithium-ion battery” with energy storage of 1 kWh is considered as for simulation purposes. The round-trip efficiency of the storage is considered as 90%. The storage's primary and minimal state of charge is considered as 100% and 20%, respectively. The life expectancy of the storage is input as 10 years. The cost of capital, operation and maintenance, and storage replacement is considered as USD 419, 11 USD/year, and USD 419 [35]. The available energy during the charging and discharging period can be measured from the below equations:
E b a t t = E b a t t ( t 1 ) × ( 1 σ ) + [ E G e n ( t ) E l o a d ( t ) η ] × η B a t t
E b a t t = E b a t t ( t 1 ) × ( 1 σ ) [ E l o a d ( t ) η E G e n ( t ) ]
E G e n = N P V × P p v + N W T × P W T

3.7.4. PV Module

A PV module aims to convert the energy available in solar irradiance into electricity. Produced power by PV cells can be calculated from the following Equations (7) and (8) [6,13]. The life span and the derating factor of PV is considered as 25 years and 80%, respectively. The solar panel’s capital and replacement costs are USD 310 and 20 USD/year [32]. In this analysis, tracking arrangement has not been considered. PV output depends mainly on the solar resource and the cell temperature. A detailed analysis of mathematical modeling can be found in [32,33]
P PV = Y PV f PV ( I T I S ) [ 1 + α P ( T C T S )
To determine the value of T C , Equation (9) can be employed. Here, τ α is defined as the “effective transmittance–absorptance, which is the ratio of the heat conveyed to the fluid to the heat generated on the absorber surface by absorbed solar radiation”, η PV is the PV panel efficiency, T a is the “ambient temperature”, U L (kW/m2 °C) is the “heat transfer coefficient”.
( τ α ) l T = η PV l T + U L ( T C T a )
Equation (8) can be rewritten as:
T C = T a + I T ( τ α U L ) ( 1 η PV τ α )
However, it is not easy to measure the value of ταUL, according to the manufacturer information on the “Nominal Operating Cell Temperature (NOCT)”, which yields at no-load condition (i.e., η PV = 0), at 20 °C ambient temperature, and at 800 W/m2 solar irradiation. Equation (9) can be written as:
( τ α ) = T c , NOCT T a , NOCT I T , NOCT
Therefore, the final temperature of the PV cell can be determined from Equation (11), in which effective transmittance–absorptance is considered as 0.90 [32].
T C = T a + I T T c , NOCT T a , NOCT I T , NOCT ( 1 η PV 0.90 )

3.7.5. Wind Turbine

A wind turbine aims to produce electric power from wind resources. Several factors, for example cut in wind speed and hub height, influence the selection of wind turbines. The power available from the wind turbine is a function of the wind speed at hub height. At a certain wind speed at a given hub height, the velocity of the wind speed can be found from Equation (12), and the output from a wind turbine at a normal temperature and pressure can be described as follows (Equation (16)) [32,33]:
V = V ref ( H Href ) γ
a = P r ( V r 3 V 1 3 )
b = V 1 3 ( V r 3 V 1 3 )
P wt = P w A w η w
P w ( V ) = | 0 for V < V 1 a V 3 for V 1 < V < V r P r for V r < V < V 2 0 for V > V 2 |
A wind turbine manufactured by the Generic is considered here. The turbine’s lifetime and hub height are considered as 20 years and 17 m, respectively. The wind turbine's capital, replacement and operation, and maintenance costs are considered as USD 4000, USD 3200 and 200 USD/year [34].

3.7.6. Dispatch Strategy

Various dispatch strategies, such as “cycle charging, load following”, etc., can be applied to determine the optimum system. This analysis executes the following load to simulate the system (Figure 4). In this technique, DG is operated without renewable energy sources. Load following is best suitable when renewable energy sources are available. The electricity generated from wind and PV is compared with electricity demand. After satisfying the demand ( P l o a d ( t ) ), the excess energy ( P n e t ( t ) > 0) usually charges the storage until BSOC,max. When the battery charge is available, and there is a lack of electricity, the battery provides energy to the load unless DG serves to entertain the load.

3.7.7. Economic Analysis

The optimal system is selected taking into account the cost of electricity (COE) and net present cost (NPC). COE is the unit price of annual energy fulfilled by the hybrid system, while to calculate NPC, the current value of all the revenues earned should be subtracted from the present value of all installing and operating costs of equipment during the project period. Equations (17) and (18) are employed to estimate the COE and NPC [6,32].
COE = C a E s
NPC = Ca CRF ( i , N )
CRF ( i , N ) = i ( 1 + i ) N ( 1 + i ) N 1
i = i f 1 + f

3.7.8. Environmental Analysis

Life cycle emission (LCE) analysis is helpful in calculating the emission over a project lifetime. Equation (21) is utilized to measure the emission from the hybrid system [6].
LCE = i = 1 x BiEl
In this investigation, life cycle emission from PV and diesel generators is taken as 0.045 and 0.88 kg CO2-eq/kWh. The life cycle emission from the battery and inverter are also considered as 0.028 kg CO2-eq/kWh and 0, respectively [6,32]. A diagram of the proposed system can be found in Figure 5.

3.8. Hybrid MCDM

A hybrid MCDM analysis chooses a configuration from worst to best. Both AHP and TOPSIS methods are integrated into this analysis. The AHP method uses Saaty’s scale to set suitable weights for each criterion, and the TOPSIS method then uses these weights to decide the optimal configuration. The following subsections define how AHP and the TOPSIS are used in this analysis.
In most decision-making methods, weights bear a significant role. Initially developed by Saaty in 1977, AHP has been implemented worldwide by many researchers [36]. In a MCDM problem, criteria control the whole problem. Using pairwise comparisons, AHP is employed to obtain preference ratings among the criteria. If the problem has “n” evaluation criteria, then the total number of required pairwise comparisons is n * ( n 1 ) 2 . A nine-point scale was developed by Saaty, which is utilized in this study to make a comparison between two criteria (Supplementary Materials). Three criteria, COE, NPC, and CO2 emission per year, are selected to size the proposed hybrid system. The contrast between the measures or criteria displays how much less or more one criterion or measure is more important than another. The two evaluator’s preferences can be found in Tables S1 and S2 of the Supplementary Materials. A comparison matrix is developed and constructed based on the evaluator. The comparison matrix can be found in the Supplementary Materials. Then, to find the elements of the normalized matrix, the sum of the element values of the column is used to divide each element of each column. By normalizing the relevant element values of the aggregate vector, the element or component is equal to the sum of the element's weight values of each criterion. Equation (22) can be used to express the entire sum of weights for all measurements or criteria:
j = 1 n w j = 1
Table S3 (Supplementary Materials) shows the different steps of AHP based on two experts’ opinions.
Yoon and Hwang developed TOPSIS in 1980. The best alternative is chosen in this method according to the farthest route or distance from the negative ideal solution and the shortest route or distance from the ideal solution. The following steps describe the TOPSIS method.
A decision matrix (DM) consisting of n criteria and m alternatives is created first. The performance of alternatives A i in terms of criteria C j is represented by the elements of DM ( a i j ), where i = 1, 2, … m and j = 1, 2, … n. Hence, the DM of an MCDM problem is given by Equation (23).
D M = A 1 . . . A m [ C 1 C n w 1 w n a 11 a m 1 a 1 n a n m ]  
Step 1: Normalized decision matrix formulation:
To acquire the normalized decision matrix R, DM is normalized, where each component or element in the DM is normalized by the following equation:
r i j = a i j k = 1 m ( a i j ) 2
The following matrix R will be obtained after Step 1.
R = [ r 11 r 1 n r m 1 r m n ]
Step 2: Weight-normalized decision matrix development:
The weight-normalized decision matrix is denoted as V, which is developed in the present step. Weights obtained from AHP analysis are used with the R matrix in this step. Each column of the R matrix is multiplied with w j to obtain the V matrix.
v i j = r i j w j   where   i = 1 , 2 , m   and   j = 1 , 2 , n .
V is the outcome of the current step that is explained below.
V = [ v 11 v 1 n v m 1 v m n ]
Step 3: Calculating the ideal and negative ideal solutions:
The next step deals with the development of ideal A * and negative ideal solutions A , and these solutions can be defined as following:
A * = { ( max i v i j | j J ) , ( min i v i j | j J ) , i = 1 , 2 , , m } = { v 1 * , v 2 * , , v n * }
A = { min i v i j | j J , ( max i v i j | j J ) ,   i = 1 , 2 , , m } = { v 1 , v 2 , , v n }
Here, J is a subset of {j = 1, 2, …, n}. It represents the benefit criteria (maximum value), while the cost criteria are represented by the complement of J ( J ). The most suitable alternative is represented by A * , while the least suitable alternative is represented by A .
Step 4: Calculating the separation measure:
The n-dimension Euclidean distance method is used in this analysis to determine each alternative’s separation distance in V. The distance of an alternative from the ideal and negative ideal solution can be determined from the following equations:
S i * = j = 1 n ( v i j v j * ) 2 ,   for   i = 1 , 2 , , m
S i = j = 1 n ( v i j v j ) 2 ,   for   i = 1 , 2 , , m
S i is the distance of ith alternative from the negative ideal solution, while S i * depicts the distance of the ith alternative from the ideal solution.
Step 5: Calculating the relative closeness to the ideal solution:
The relative proximity of the ith alternative (Ai) to the (A*) is calculated by:
C i * = S i S i + S i *   ,   i = 1 , 2 , , m   and   0 C i * 1
C i * = 1 when A i = A * , and C i * = 0 when A i = A .
Step 6: Using closeness or proximity to the perfect solution to rank alternatives:
According to the descending order of C i * , the ranking of alternatives is achieved. The shortest distance to A * and the longest distance to A are preferred to identify the best solution.

4. Results and Discussion

Different design patterns and electrification scenarios have been presented in this section. The initial simulation conditions are: residential load demand = 5119.80 kWh/day, commercial load demand = 43.577 MWh/day, PV derating factor = 80%, diesel price = 0.70 USD/L.

4.1. Definition of Optimization Patterns

Among six cases, the first case is the PV/diesel system, which is currently the existing system on this island. After that, another five alternative system patterns have been developed from the optimization process.

4.2. Optimized Result

Numerous system constraints, along with all of the input, were factored into the simulation. Various scenarios have been developed to meet the requisite load for Monpura. All system’s economic and environmental benefits have also been evaluated to find the optimum system. The best scenarios were selected regarding the lowest NPC and COE values. In Table 4, the system sizing of all the configurations is delineated, while in Table 5, all of the techno-economic and environmental results are outlined. The best case is case 4, which consists of PV/biogas/wind. The COE (USD/kWh), NPC (USD), initial capital cost (USD) and O&M cost are 0.6139, 141 M, 74.2 M and 26.82 M, respectively. NPC savings of this case compared to cases 1, 2, 3, 5 and the existing system is 25%, 25%, 16%, 72% and 18%. The optimum component capacities are 22,756 kW PV, 500 kW biogas generator, 114,280 batteries, 3400 kW wind power, and 6834 kW converter. Case 4 consumes 12%, 33%, 40% and 34% fewer batteries than cases 1, 3, 5 and the existing system. The mini-grid experience in Bangladesh has revealed a few important aspects, such as the difficulty of maintaining the battery storage, the associated expenses, the losses associated with the battery's repeated charging and discharging cycles, etc. Combining wind energy converters into the solar/diesel-powered hybrid mini-grid has the potential to address the issue of battery storage and many other benefits. Since wind and solar energy complement each other in many cases, the battery requirement will be reduced to some extent. This trend is observed and supported by our study. Based on the socio-economic condition of the electric company and local population, cases 1, 2, 3 and 5 are expensive. Cases 1, 2, and 5 are unsuitable since O&M cost is high in these cases. Due to high cost, maintaining a 24 h supply is challenging. Case 4 has a moderate initial O&M cost since this case uses a smaller number of batteries.
A high value of NPC and COE means that the case 5 system is not economically viable, although it can meet the required load. From Table 5, it is observed that all of the cases have high excess electricity and minimal unmet load. This extra electricity means that these systems are oversized. A system is only dependable when it satisfies the necessary load demand (0%). High renewable penetration causes frequent intermittencies; as a result, considerable amounts of excess electricity and unmet loads occur in the optimized system.
From an environmental perspective, cases 1, 3 and 4 are the most environmentally friendly systems since these cases emit less CO2 than other systems. In these cases, the renewable energy penetration is high as compared to other systems. The opposite scenario is observed for the existing system and the case 2 system since renewable penetration in those cases is less than or almost zero. Based on the above techno-economic analysis, cases 3 and 4 are the most cost-effective and environmentally friendly system for electrifying Monpura, although case 4 is the best of the two. These two cases are the most economical solutions, with high renewable fraction and minimum CO2 emissions compared to the others.
After the techno-economic analysis, a hybrid multicriteria analysis was applied to find the best standalone system. The result of the multicriteria analysis can be found in Table 6 and Table 7. From Table 6 and Table 7, it is clear that case 4, consisting of PV/biogas/wind, is the best system according to the multicriteria analysis.

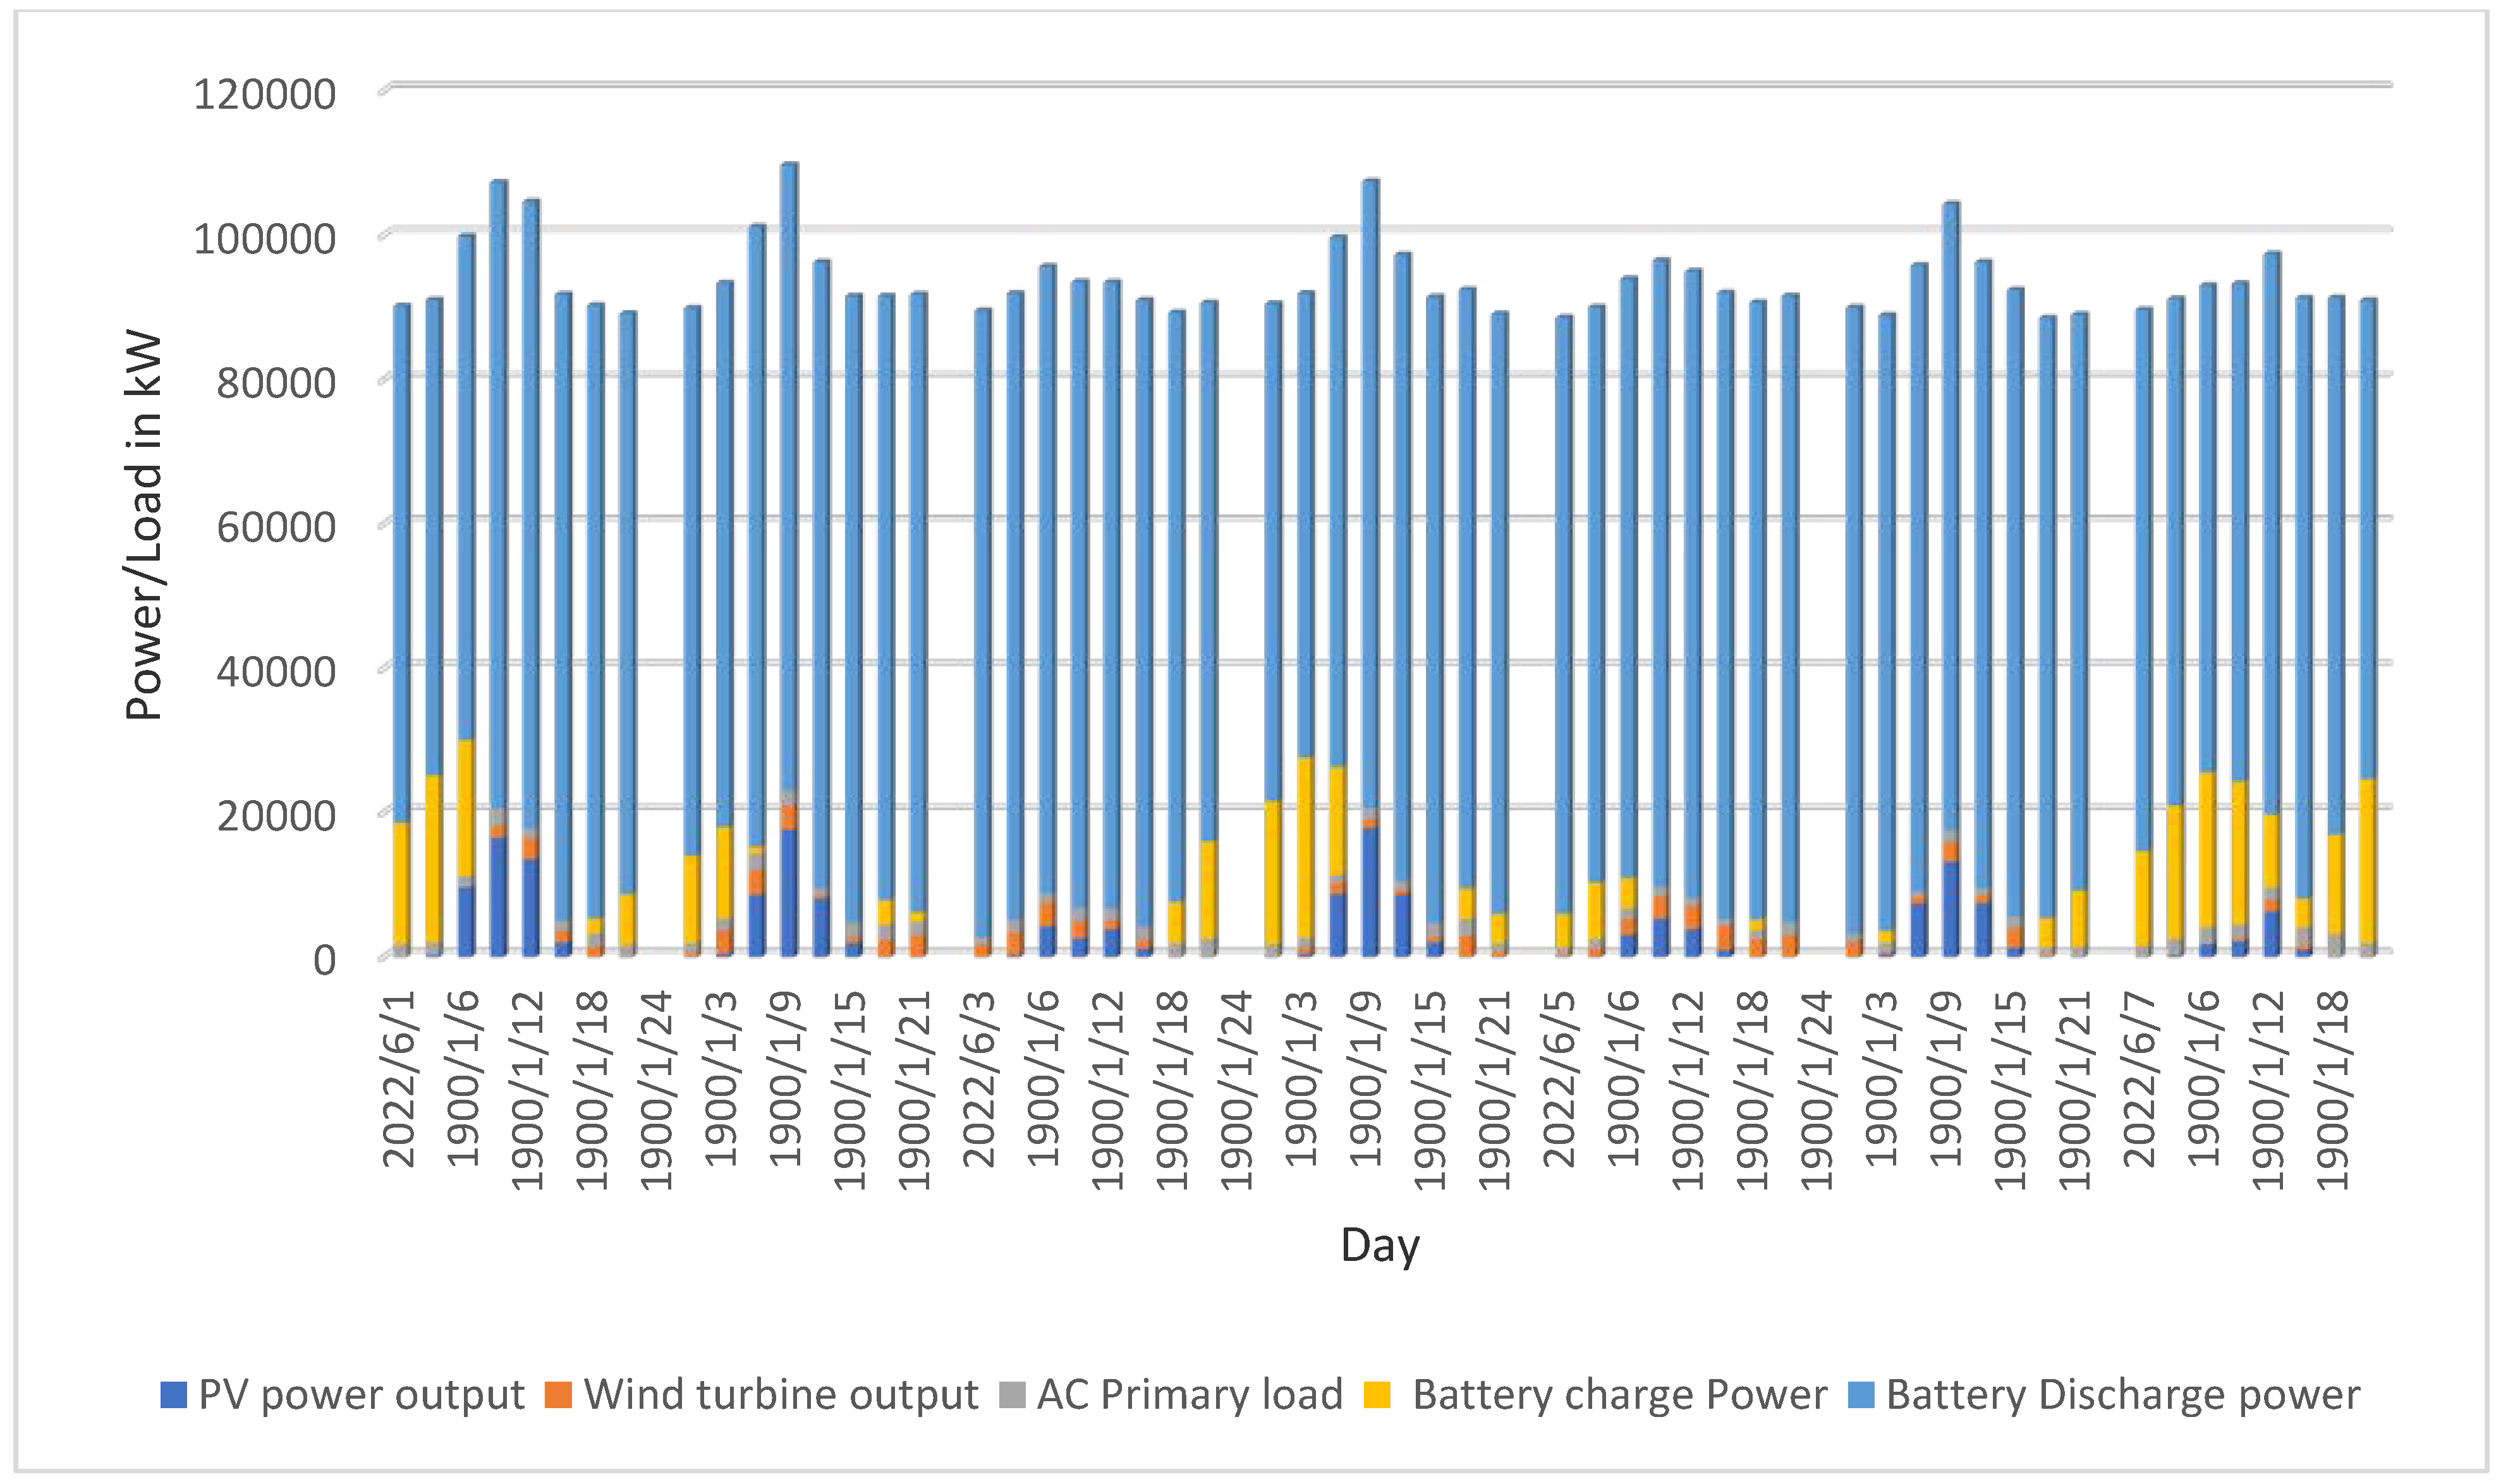
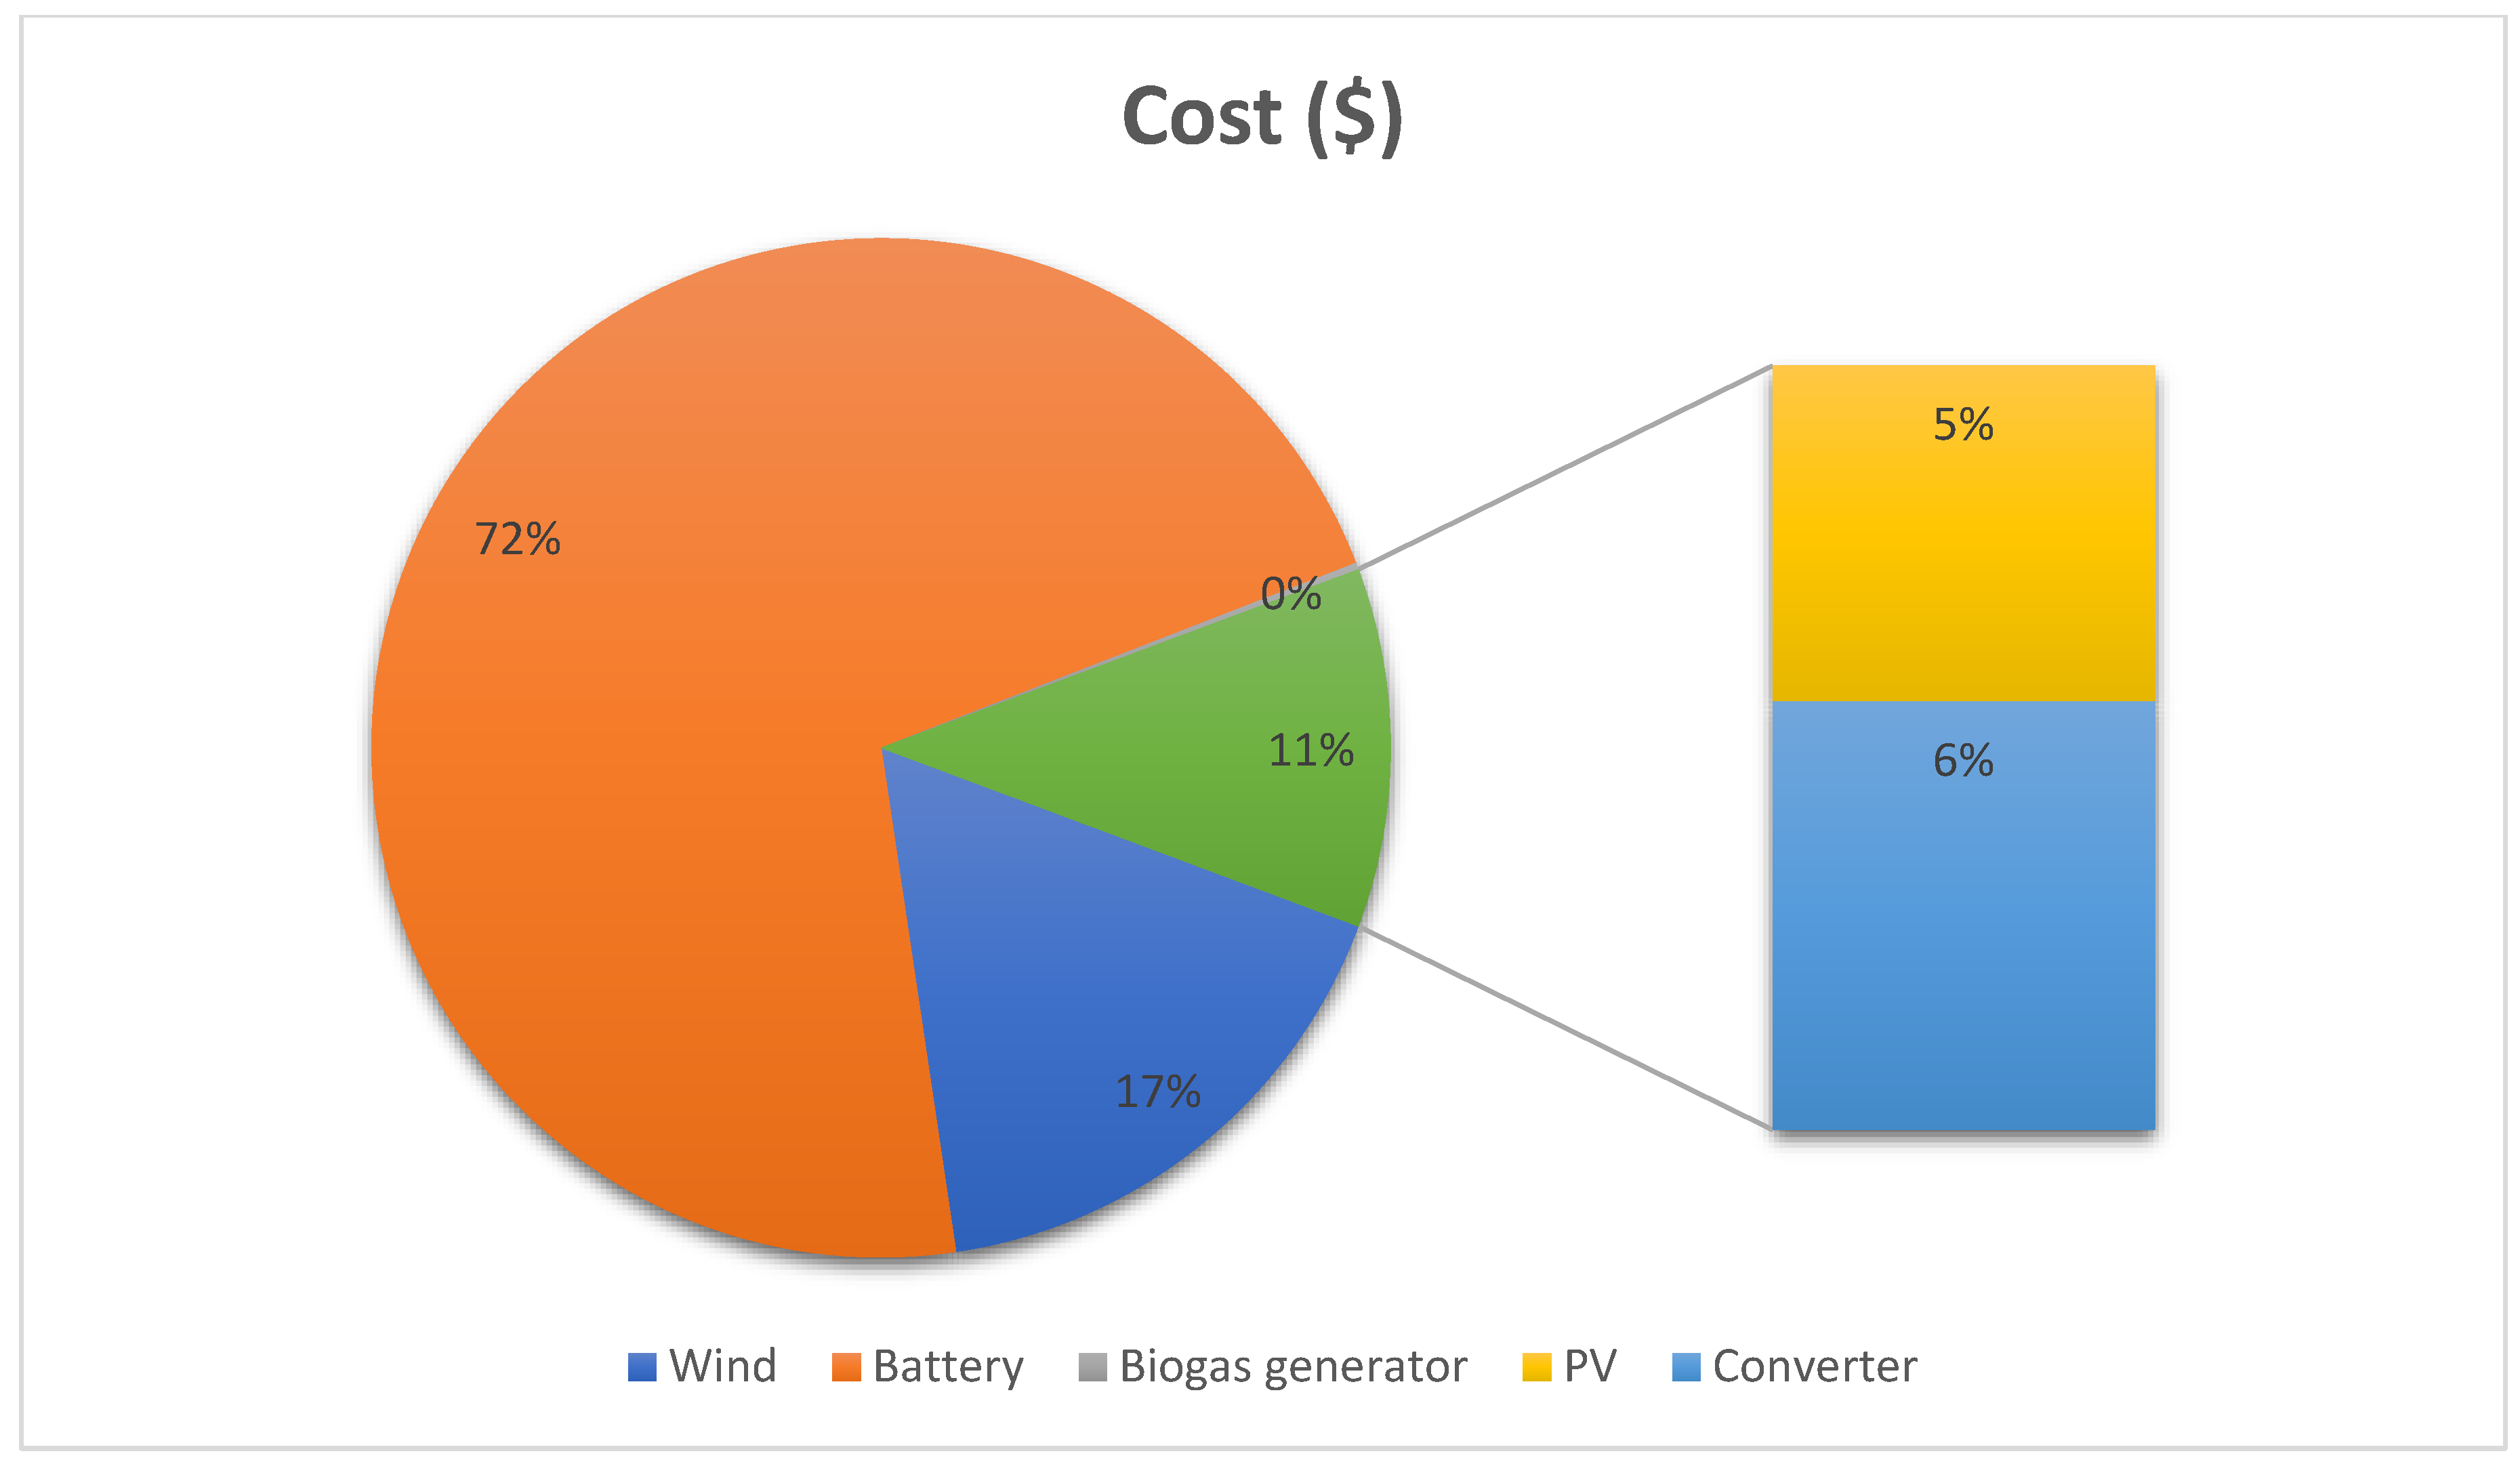
4.3. Evaluation of the Best Hybrid Scenario's Performance

Case 4 is the optimum hybrid system for supplying electricity in Monpura. The monthly electricity production of different components can be found in Figure 6. PV dominates the electricity production with 86% (30,714,549 kWh/year) of electricity provided by PV; 13% (4,971,440 kWh/year) from the wind and the biogas generator supplies the rest. PV contribution slightly decreases during the rainy season (June–August), whereas wind contributes to meeting the deficiencies of PV. Because of dark clouds and rain, there will be less energy production by PV on rainy days. The detailed contribution of PV and wind can be found in Figure 7. The weekly performance of the proposed system is presented to validate the performance of the optimum system in the peak month of June (Figure 8). PV generated power from 6 AM to 7 PM on all days (1 June–7 June), and the battery was charged using the excess energy of PV. The power from batteries and wind was used to complete the gap of PV when there was no solar resource available (8 PM to 5 AM). The excessive battery discharge from high PV output is the main reason for the generator's low or absent output. The max discharge of batteries occurs when there is the availability of solar resources. Different component cost contributions in NPC are presented in Figure 9. Battery contributes the most (USD 100,700,756.52), followed by wind (USD 23,904,543.17), converter (USD 8,999,974.04) and PV (USD 7,054,312.6). From Figure 9, it is clear that the PV and battery cost significantly impact NPC. The higher battery cost means that it may be replaced thrice during the project lifetime, as shown in Figure 10. The cost of renewable energy components has been projected to decrease soon, making the proposed system a suitable alternative. The proposed system emits 99% less CO2 emissions when compared to the existing system, which clearly outlines the environmental viability of the proposed system. The finding of this study was compared with other studies. COE is an important parameter to decide the feasibility of the project. Thus, a comparison has been made with other studies based on COE (Table 8).

4.4. Sensitivity Analysis

To determine the influence of each variable on the techno-economic project, a sensitivity analysis was carried out. Battery, wind and PV capital cost multipliers were altered for sensitivity analysis for the best-case scenario (case 4) in this analysis. A 50% decrease and increase in battery, wind, and PV cost multipliers was considered as for sensitivity analysis in this study and is presented in Figure 11 and Figure 12. The surface of both figures delineates the NPC superimposed with COE. From both figures, it is clear that increasing the battery capital cost multiplier with respect to the wind turbine and PV capital cost multiplier has a significant impact on both NPC and COE. Both NPC and COE increased after the capital cost multiplier changed from 1 to 1.5. From Figure 11, it can be seen that a 50% decrease would cause a 29% decline in COE (from 0.697 to 0.493 USD/kWh) and a 32% decrease in NPC (from 170 to 11 M). When the battery cost multiplier is at 0.5 and the wind turbine capital cost multiplier is 1.5, the NPC of the system is 124 M (Figure 12). After changing the multiplier to 1, the system will experience a 39% increase in NPC (172 M) and a 25% rise in COE (from 0.58 to 0.72 USD/kWh).

4.5. Social Benefits

Furthermore, the proposed hybrid system can help achieve sustainable development goals in rural communities. Bangladesh set some goals taking into account the proposed SDG indicators, several of which are directly adopted, and some of which are slightly altered based on the national perspective [43]. By 2030, the country plans to increase the contribution of renewables to total energy consumption by 10% as part of the energy goals (SDG-7). However, from 2015–2020, the country managed to increase the contribution of renewables from 2.79% to 3.49% [44]. This indicates significant room for improvement in the current renewable energy expansion policy. Increasing environmental concerns and prioritizing energy security are the key factors in transforming the energy sector. Additionally, creating new employment opportunities can ensure incentives for investors and policymakers. Various scholars identified the benefit of renewable energy technologies in creating job opportunities. Few standard job creation parameters are available for analyzing renewable hybrid systems and can be found in Table 9.
The country-level assessment shows that adopting renewable energy technologies results in more significant employment opportunities. For instance, the adoption of renewable energy technologies (RET) in the Czech Republic has seen the creation of 20,000 new jobs in 2010 [45]. Similarly, from 2011 to 2020, 5.7 million jobs have been created in China due to the deployment of RET [46]. Additionally, 20,958 jobs will be created in the Chilean energy sector by 2026 after the deployment of RET [47]. Bangladesh cannot overlook this positive correlation between jobs and RET since Bangladesh is facing a sharp decline in the employment sector. In 2016–2017, employment opportunities came down to 1.33% from 3.32% in 2005–2006 [44]. The job structure of Bangladesh mainly focuses on domestic job creation and its associated policies ranging from macroeconomic to trade, investment policies, industrial policies, sectoral policies and policies including technologies [48]. These policies need to be improved by giving more emphasis on RET as a way to create green jobs. It will not only help in achieving SDG-7 but will also pave the way for SDG-8 (economic development) in an environmentally friendly manner [49,50,51].

5. Conclusions

This work proposes a new sizing method to develop the optimum standalone hybrid system for a rural area. A field survey was conducted to collect local load data and resources. Several configurations were modeled, and techno-economic and environmental analyses were performed to select the optimum system. A hybrid multi-criteria analysis was developed and executed to determine the best system. Among these configurations, a PV/biogas/wind system has been found to be the most appropriate system. The COE of this system is 0.691 USD/kWh, and it emits only 4.4 kg CO2 per year. The optimum system has a 7.6% lesser cost of energy than the existing PV/diesel system and a higher renewable fraction, ensuring the system’s best environmental performance. The proposed system consumes 12%, 33%, 40% and 34% fewer batteries than cases 1, 3, 5 and the existing system. The current analysis shows that the optimized system is both environmentally friendly and economically more lucrative than the existing system. However, the implementation can be challenging for Bangladesh due to the island's economic, technical, and geographical location. Future research should simulate the cost related to battery degradation and its impact on the total cost. In addition, the soiling impact on PV modules should be investigated in the future.

Supplementary Materials

The following supporting information can be downloaded at: https://www.mdpi.com/article/10.3390/en15165940/s1, Table S1: Evaluation and preference of the expert 1. Table S2: Evaluation and preference of the expert 2. Table S3: AHP processing matrix to compute the weights of criteria based on expert 1 and 2.

Author Contributions

Conceptualization, T.C.; data curation, S.H. and A.H.; formal analysis, T.C.; funding acquisition, A.R.; investigation, S.H., H.C., and A.R.; methodology, T.C.; project administration, A.R.; resources, M.R.M.A.; software, H.C. and A.H.; supervision, A.R., M.R.M.A., M.Z.H., and S.M.S.; writing—original draft, T.C. and H.C.; writing—review and editing, A.H., M.R.M.A., M.Z.H., and S.M.S. All authors have read and agreed to the published version of the manuscript.

Funding

This research received no external funding.

Institutional Review Board Statement

Not applicable.

Informed Consent Statement

Not applicable.

Data Availability Statement

Not applicable.

Conflicts of Interest

The authors declare no conflict of interest.

Nomenclature

A_w, wind turbine swept area (m2); Bi (kg CO2, eq/kWh), life period tantamount CO2 emissions of various components; COE, cost of electricity; CRF, capital recovery factor; C_a (USD/year), summation of annual capital, replacement, operational, and maintenance cost of individual component; E_batt (t − 1) and E_batt, battery energy at time (t − 1) and (t); E_(Gen), total energy produced from the renewables; El(kWh), energy generated and reserved in each unit or components; E_s, energy served in a year; FPV (%), derating factor of PV; H, hub height; H_ref, reference height; IS (kW/m2), incident solar irradiation at standard test conditions; IT (kW/m2), solar irradiation incident on the PV array; L_(0,dg), fuel curve intercept coefficient (161 l/hr); L_(1,dg), fuel curve slope (0;236 L/hr/kW); NPC, net present cost; N_PV, number of PV; N_WT, number of wind turbines; P_r, rated power (kW); P_dg, electrical output of the generator; P_in, power input to the inverter; P_out, output from the inverter; P_PV, power produced from PV; P_wt, actual electric power of a wind turbine (kW); Ta (°C), ambient temperature; Tc (°C), PV cell temperature; Ts (°C), PV cell temperature under standard test conditions (25 °C); V_1 (m/s), cut in speed; V_r (m/s), rated speed; V_2 (m/s), cut-out speed; V (m/s), wind speed at the hub height; V_ref (m/s), wind speed at the reference height; w_j, weight of jth criteria; Y_dg, rated capacity of the generator; Y_PV (kW), rated capacity of the PV array; αP, temperature coefficient of power; η, efficacy of the inverter; η_Batt, battery efficiency; ηPV (%), PV panel efficiency; η_w, wind turbine efficiency (%); σ, self-discharge rate; I, annual real interest rate (%); i’, nominal interest rate (%); f, annual inflation rate (%); MCDA, multicriteria decision analysis; m, number of households responding to use the appliance; n, number of criteria that dominate the MCDM problem; n_1, total sample population; N, project lifetime; N_1, total population of the island; p, standard wattage of the appliance; ɣ, ground surface friction coefficient; a,b, constant; x, number of components used to model the system; (N1 * m/n1), proportion of the respondents predicted to use the device multiplied to the entire population of the island; ( x = 1 m t x m ), average number of hour usage per appliance per household.

References

  1. Castán Broto, V.; Kirshner, J. Energy Access Is Needed to Maintain Health during Pandemics. Nat. Energy 2020, 5, 419–421. [Google Scholar] [CrossRef]
  2. Li, J.; Liu, P.; Li, Z. Optimal Design of a Hybrid Renewable Energy System with Grid Connection and Comparison of Techno-Economic Performances with an off-Grid System: A Case Study of West China. Comput. Chem. Eng. 2022, 159, 107657. [Google Scholar] [CrossRef]
  3. Miskat, M.I.; Rashedi, A. Exergy Efficiency and Enviroeconomic Analysis of Solar Photovoltaic Power in Nepal. Energy Technol. 2021, 9, 100093. [Google Scholar] [CrossRef]
  4. Akram, F.; Asghar, F.; Majeed, M.A.; Amjad, W.; Manzoor, M.O.; Munir, A. Techno-Economic Optimization Analysis of Stand-Alone Renewable Energy System for Remote Areas. Sustain. Energy Technol. Assess. 2020, 38, 100673. [Google Scholar] [CrossRef]
  5. Khan, M.J.; Yadav, A.K.; Mathew, L. Techno Economic Feasibility Analysis of Different Combinations of PV-Wind-Diesel-Battery Hybrid System for Telecommunication Applications in Different Cities of Punjab, India. Renew. Sustain. Energy Rev. 2017, 76, 577–607. [Google Scholar] [CrossRef]
  6. Das, B.K.; Hasan, M. Optimal Sizing of a Stand-Alone Hybrid System for Electric and Thermal Loads Using Excess Energy and Waste Heat. Energy 2021, 214, 119036. [Google Scholar] [CrossRef]
  7. Khirennas, A.; Kaabeche, A.; Talha, A.; Bakelli, Y. A New Optimal Sizing Methodology of Storage-Less PV System for Retrofitting Existing Diesel-Based Power Generation System within Mini-Grids. Energy Convers. Manag. 2021, 250, 114854. [Google Scholar] [CrossRef]
  8. Makhdoomi, S.; Askarzadeh, A. Impact of Solar Tracker and Energy Storage System on Sizing of Hybrid Energy Systems: A Comparison between Diesel/PV/PHS and Diesel/PV/FC. Energy 2021, 231, 120920. [Google Scholar] [CrossRef]
  9. Elkadeem, M.R.; Wang, S.; Azmy, A.M.; Atiya, E.G.; Ullah, Z.; Sharshir, S.W. A Systematic Decision-Making Approach for Planning and Assessment of Hybrid Renewable Energy-Based Microgrid with Techno-Economic Optimization: A Case Study on an Urban Community in Egypt. Sustain. Cities Soc. 2020, 54, 102013. [Google Scholar] [CrossRef]
  10. Das, H.S.; Tan, C.W.; Yatim, A.H.M.; Lau, K.Y. Feasibility Analysis of Hybrid Photovoltaic/Battery/Fuel Cell Energy System for an Indigenous Residence in East Malaysia. Renew. Sustain. Energy Rev. 2017, 76, 1332–1347. [Google Scholar] [CrossRef]
  11. Salameh, T.; Ghenai, C.; Merabet, A.; Alkasrawi, M. Techno-Economical Optimization of an Integrated Stand-Alone Hybrid Solar PV Tracking and Diesel Generator Power System in Khorfakkan, United Arab Emirates. Energy 2020, 190, 116475. [Google Scholar] [CrossRef]
  12. Azerefegn, T.M.; Bhandari, R.; Ramayya, A.V. Techno-Economic Analysis of Grid-Integrated PV/Wind Systems for Electricity Reliability Enhancement in Ethiopian Industrial Park. Sustain. Cities Soc. 2020, 53, 101915. [Google Scholar] [CrossRef]
  13. Das, B.K.; Tushar, M.S.H.K.; Zaman, F. Techno-Economic Feasibility and Size Optimisation of an off-Grid Hybrid System for Supplying Electricity and Thermal Loads. Energy 2021, 215, 119141. [Google Scholar] [CrossRef]
  14. Konneh, K.V.; Masrur, H.; Konneh, D.A.; Senjyu, T. Independent or Complementary Power System Configuration: A Decision Making Approach for Sustainable Electrification of an Urban Environment in Sierra Leone. Energy 2022, 239, 122310. [Google Scholar] [CrossRef]
  15. Guerello, A.; Page, S.; Holburn, G.; Balzarova, M. Energy for Off-Grid Homes: Reducing Costs through Joint Hybrid System and Energy Efficiency Optimization. Energy Build. 2020, 207, 109478. [Google Scholar] [CrossRef]
  16. Rajbongshi, R.; Borgohain, D.; Mahapatra, S. Optimization of PV-Biomass-Diesel and Grid Base Hybrid Energy Systems for Rural Electrification by Using HOMER. Energy 2017, 126, 461–474. [Google Scholar] [CrossRef]
  17. Halabi, L.M.; Mekhilef, S.; Olatomiwa, L.; Hazelton, J. Performance Analysis of Hybrid PV/Diesel/Battery System Using HOMER: A Case Study Sabah, Malaysia. Energy Convers. Manag. 2017, 144, 322–339. [Google Scholar] [CrossRef]
  18. Konneh, K.V.; Masrur, H.; Othman, M.L.; Senjyu, T. Performance Assessment of a Hybrid Complementary Power System for Sustainable Electrification: A Case Study. Sustain. Cities Soc. 2022, 76, 103412. [Google Scholar] [CrossRef]
  19. Abnavi, M.D.; Mohammadshafie, N.; Rosen, M.A.; Dabbaghian, A.; Fazelpour, F. Techno-Economic Feasibility Analysis of Stand-Alone Hybrid Wind/Photovoltaic/Diesel/Battery System for the Electrification of Remote Rural Areas: Case Study Persian Gulf Coast-Iran. Environ. Prog. Sustain. Energy 2019, 38, 13172. [Google Scholar] [CrossRef]
  20. Sanni, S.O.; Oricha, J.Y.; Oyewole, T.O.; Bawonda, F.I. Analysis of Backup Power Supply for Unreliable Grid Using Hybrid Solar PV/Diesel/Biogas System. Energy 2021, 227, 120506. [Google Scholar] [CrossRef]
  21. 5% People Now Have Access to Electricity. Available online: https://www.tbsnews.net/bangladesh/935-people-now-have-access-electricity-100153 (accessed on 25 December 2021).
  22. Bangladesh Energy Situation-Energypedia. Available online: https://energypedia.info/wiki/Bangladesh_Energy_Situation#Natural_Gas (accessed on 26 December 2021).
  23. Abdulrazak, L.F.; Islam, A.; Hossain, M.B. Towards Energy Sustainability: Bangladesh Perspectives. Energy Strategy Rev. 2021, 38, 100738. [Google Scholar] [CrossRef]
  24. Shahriar Ahmed Chowdhury, National Solar Energy Action Plan, 2021–2041. Available online: https://climateportal.ccdbbd.org/wp-content/uploads/2021/03/National-Solar-Energy-Roadmap.pdf (accessed on 28 May 2022).
  25. Halder, P.K.; Paul, N.; Joardder, M.U.H.; Sarker, M. Energy Scarcity and Potential of Renewable Energy in Bangladesh. Renew. Sustain. Energy Rev. 2015, 51, 1636–1649. [Google Scholar] [CrossRef]
  26. Infrastructure Development Company Limited (IDCOL). Available online: https://www.idcol.org/ (accessed on 26 December 2021).
  27. Chowdhury, S.A. Feasibility and Integration of Wind Energy into Solar Mini-Grid at Monpura Island. 2018. Available online: https://www.undp.org/sites/g/files/zskgke326/files/migration/bd/2018.11.11---SREPGen-Final-Report-on-Wind-Energy-Integration-in-SMG.pdf (accessed on 28 May 2022).
  28. Aziz, S.; Chowdhury, S.A. Performance Evaluation of Solar Mini-Grids in Bangladesh: A Two-Stage Data Envelopment Analysis. Clean. Environ. Syst. 2021, 2, 100003. [Google Scholar] [CrossRef]
  29. Lozano, L.; Querikiol, E.M.; Abundo, M.L.S.; Bellotindos, L.M. Techno-Economic Analysis of a Cost-Effective Power Generation System for off-Grid Island Communities: A Case Study of Gilutongan Island, Cordova, Cebu, Philippines. Renew. Energy 2019, 140, 905–911. [Google Scholar] [CrossRef]
  30. NASA POWER. Prediction Of Worldwide Energy Resources. Available online: https://power.larc.nasa.gov/ (accessed on 26 December 2021).
  31. Bhatt, A.; Sharma, M.P.; Saini, R.P. Feasibility and Sensitivity Analysis of an Off-Grid Micro Hydro-Photovoltaic-Biomass and Biogas-Diesel-Battery Hybrid Energy System for a Remote Area in Uttarakhand State, India. Renew. Sustain. Energy Rev. 2016, 61, 53–69. [Google Scholar] [CrossRef]
  32. Das, B.K.; Hoque, N.; Mandal, S.; Pal, T.K.; Raihan, M.A. A Techno-Economic Feasibility of a Stand-Alone Hybrid Power Generation for Remote Area Application in Bangladesh. Energy 2017, 134, 775–788. [Google Scholar] [CrossRef]
  33. Das, B.K.; Hassan, R.; Tushar, M.S.H.K.; Zaman, F.; Hasan, M.; Das, P. Techno-Economic and Environmental Assessment of a Hybrid Renewable Energy System Using Multi-Objective Genetic Algorithm: A Case Study for Remote Island in Bangladesh. Energy Convers. Manag. 2021, 230, 113823. [Google Scholar] [CrossRef]
  34. Das, B.K.; Alotaibi, M.A.; Das, P.; Islam, M.S.; Das, S.K.; Hossain, M.A. Feasibility and Techno-Economic Analysis of Stand-Alone and Grid-Connected PV/Wind/Diesel/Batt Hybrid Energy System: A Case Study. Energy Strategy Rev. 2021, 37, 100673. [Google Scholar] [CrossRef]
  35. Das, B.K.; Al-Abdeli, Y.M.; Kothapalli, G. Integrating renewables into stand-alone hybrid sys-tems meeting electric, heating, and cooling loads: A case study. Renew. Energy 2021, 180, 1222–1236. [Google Scholar] [CrossRef]
  36. Muhsen, D.H.; Khatib, T.; Abdulabbas, T.E. Sizing of a Standalone Photovoltaic Water Pumping System Using Hybrid Multi-Criteria Decision Making Methods. Sol. Energy 2018, 159, 1003–1015. [Google Scholar] [CrossRef]
  37. Chauhan, A.; Khan, M.T.; Srivastava, A.; Tripathi, A.; Hussain, S.M.S.; Ustun, T.S. Techno-Economic Assessment and Environmental Analysis of an Optimal Hybrid System under Novel Demand Response Scheme for a Remote Region of India. Energy Rep. 2022, 8, 284–291. [Google Scholar] [CrossRef]
  38. El-Sattar, H.A.; Kamel, S.; Sultan, H.M.; Zawbaa, H.M.; Jurado, F. Optimal Design of Photovoltaic, Biomass, Fuel Cell, Hydrogen Tank Units and Electrolyzer Hybrid System for a Remote Area in Egypt. Energy Rep. 2022, 8, 9506–9527. [Google Scholar] [CrossRef]
  39. Vakili, S.; Schönborn, A.; Ölçer, A.I. Techno-Economic Feasibility of Photovoltaic, Wind and Hybrid Electrification Systems for Stand-Alone and Grid-Connected Shipyard Electrification in Italy. J. Clean. Prod. 2022, 366, 132945. [Google Scholar] [CrossRef]
  40. Al-Badi, A.; al Wahaibi, A.; Ahshan, R.; Malik, A. Techno-Economic Feasibility of a Solar-Wind-Fuel Cell Energy System in Duqm, Oman. Energy 2022, 15, 5379. [Google Scholar] [CrossRef]
  41. Miao, C.; Teng, K.; Wang, Y.; Jiang, L. Technoeconomic Analysis on a Hybrid Power System for the Uk Household Using Renewable Energy: A Case Study. Energy 2020, 13, 3231. [Google Scholar] [CrossRef]
  42. Akarsu, B.; Serdar Genç, M. Optimization of Electricity and Hydrogen Production with Hybrid Renewable Energy Systems. Fuel 2022, 324, 124465. [Google Scholar] [CrossRef]
  43. SDG Tracker. Available online: https://www.sdg.gov.bd/#1 (accessed on 6 August 2022).
  44. Hassan, R.; Das, B.K.; Hasan, M. Integrated Off-Grid Hybrid Renewable Energy System Optimization Based on Economic, Environmental, and Social Indicators for Sustainable Development. Energy 2022, 250, 123823. [Google Scholar] [CrossRef]
  45. Dvořák, P.; Martinát, S.; van der Horst, D.; Frantál, B.; Turečková, K. Renewable Energy Investment and Job Creation; a Cross-Sectoral Assessment for the Czech Republic with Reference to EU Benchmarks. Renew. Sustain. Energy Rev. 2017, 69, 360–368. [Google Scholar] [CrossRef]
  46. Cai, W.; Mu, Y.; Wang, C.; Chen, J. Distributional Employment Impacts of Renewable and New Energy-A Case Study of China. Renew. Sustain. Energy Rev. 2014, 39, 1155–1163. [Google Scholar] [CrossRef]
  47. Nasirov, S.; Girard, A.; Peña, C.; Salazar, F.; Simon, F. Expansion of Renewable Energy in Chile: Analysis of the Effects on Employment. Energy 2021, 226, 120410. [Google Scholar] [CrossRef]
  48. A National Jobs Strategy for Bangladesh Technical Report Ministry of Labour and Employment. 2019. Available online: https://dife.portal.gov.bd/sites/default/files/files/dife.portal.gov.bd/page/a51db80d_ca8e_4cae_9579_5f6f089d5754/2021-09-15-05-58-20b6eeb7481056b939b691d2d26a401a.pdf (accessed on 28 May 2022).
  49. Chowdhury, H.; Chowdhury, T.; Rashedi, A.; Banik, S.C.; Khanam, T.; Saidur, R.; Sait, S.M.; Rosen, M.A. Energy and Exergy Assessment with Updated Reistad Estimates: A Case Study in the Transportation Sector of Bangladesh. Energy Sci. Eng. 2021, 9, 1349–1358. [Google Scholar] [CrossRef]
  50. Rashedi, A.; Sridhar, I.; Tseng, K.J. Life Cycle Assessment of 50 MW Wind Firms and Strategies for Impact Reduction. Renew. Sustain. Energy Rev. 2013, 21, 89–101. [Google Scholar] [CrossRef]
  51. Rashedi, A.; Sridhar, I.; Tseng, K.J. Multi-Objective Material Selection for Wind Turbine Blade and Tower: Ashby’s Approach. Mater. Des. 2012, 37, 521–532. [Google Scholar] [CrossRef]
Figure 1. Framework for HOMER Pro simulation software.
Energies 15 05940 g001
Figure 2. Visible and design faults identified in the mini-grid.
Energies 15 05940 g002
Figure 3. Solar and wind resource potential on Monpura Island.
Energies 15 05940 g003
Figure 4. Adopted dispatch strategy followed in this study.
Energies 15 05940 g004
Figure 5. Block diagram of proposed hybrid system.
Energies 15 05940 g005
Figure 6. Electricity production of different components per month in the proposed system.
Energies 15 05940 g006
Figure 7. (a) PV power output; (b) wind speed on different days; (c) energy production by wind turbines with respect to wind speed.
Energies 15 05940 g007
Figure 8. Weekly performance of the proposed hybrid system.
Energies 15 05940 g008
Figure 9. NPC contribution of different components.
Energies 15 05940 g009
Figure 10. Cash flow of different components.
Energies 15 05940 g010
Figure 11. NPC and COE after changing PV and battery capital cost.
Energies 15 05940 g011
Figure 12. NPC and COE after changing wind turbine and battery capital cost.
Energies 15 05940 g012
Table 1. Mini-grid projects under consideration in Bangladesh [26].
Project LocationCapacity (kW)Project Status
Enam Nahar, Sandwip, Chittagong100Operational
Kutubdia, Cox’s Bazar100Operational
Bagha, Rajshahi141Operational
Paratoli, Raipura, Narshingdi141Operational
Narayanpur, Nageshwari, Kurigram158Operational
Godagari, Rajshahi149Operational
Monpura, Bhola177Operational
Nooner Tek, Sonargao, Narayangonj168Under construction
Rupsha Char, Sadar, Sirajganj130Under construction
Chilmari, Daulatpur, Kushtia188Under construction
Munmiar Char, Islampur, Jamalpur162Under construction
Baghutia char, Doulatpur, Manikganj228Under construction
Nijhum island, Hatiya, Noakhali200Under construction
North Channel Union, Sadar, Faridpur162Under construction
Char Kajal, Patuakhali100Under construction
Char Biswas, Patuakhali100Under construction
Ghaschapru, Belkuchi, Sirajganj218.4Under construction
Poschim Shalipur, Char Bhadrashan, Faridpur156Under construction
Table 2. Specification of equipment used in the solar mini-grid of Monpura.
InstrumentsSpecification
Solar Panels672 panels, each of 250 watt
Battery216 sets (2 V, 1540 A)
Generator60 kW
MPPT Charger4 sets (48 V, 2.5 kW)
Inverters(i) Bi-directional (12 sets, each of 6 kW),
(ii) Grid-tied (7 sets, 20 kW)
Connecting meters 661 sets
Table 3. Availability of biogas in Monpura Island.
CattlesNumber of CattlesDung Availability (kg/cattle/day) [31]Total Dung (kg/day)Available Dung (Assuming 70% Conversion Efficiency)Total Gas Yield (m3)Energy Yield (kWh/day)
Cows21,00010210,000147,00052927693
Buffalos10,50015157,500110,25039695769.81
Goats13,100113,1009170330.12479.90
Sheep50001.680005600201.6293.07
Chickens50,9000.0452290.51603.3557.7283.90
Ducks11,0000.045495.0346.512.4718.12
Pigeons25000.045112.578.752.8354.12
Total 9865.74514,341.92
Table 4. Sizing of components based on different electrification scenarios.
SystemConfigurationPV (kW)Generator (kW)Wind (kW)Battery (No)Converter (kW)
ProposedPV/Wind15,000-8475130,1368170
PV/Wind/Diesel15,0001008498130,8216850
PV/Biogas23,000500-172,2216337
PV/Biogas/Wind22,7565003400114,2806834
Wind/Biogas-220045,861191,5107902
ExistingPV/Diesel23,000100-175,2537754
Table 5. Optimized outcomes of different electrification scenarios.
SystemConfigurationCOE (USD/kWh)NPC (USD)O&M Cost (USD)Initial Cost (USD)Unmet Load (%)Excess Electricity (%)CO2 (kg/year)
ProposedPV/Wind0.8259190 M42.53 M99.6 M0.05640.2-
PV/Diesel/Wind0.8218189 M42.35 M99 M0.051340.3755
PV/Biogas0.7296168 M26.1484.7 M0.0536.16.24
PV/Biogas/Wind0.691141 M26.82 M74.4 M0.07454.43
Wind/Biogas2.19504 M148.56272 M0.049671.3228
ExistingPV/Diesel0.7481172 M26.93 M86.8 M0.0636.1683
Standard deviation = 0.5338Standard deviation = 124.7953Standard deviation = 43.6608Standard deviation = 68.7832
Table 6. Results of TOPSIS analysis to determine the optimum system according to expert 1.
AlternativeWeighted Normalized Decision Matrix S i * S i C i * Ranking
Case 10.21480.0567300.03860.39560.91113
Case 20.21480.05490.0960.10320.38420.78824
Case 30.193320.049417.91 × 10−40.01610.41740.96282
Case 40.1790.042095.61 × 10−40.05610.43280.99871
Case 50.587120.150060.0280.42300.0680.13845
Table 7. Results of TOPSIS analysis to determine the optimum system according to expert 2.
AlternativeWeighted Normalized Decision Matrix S i * S i C i * Ranking
Case 10.0960.096100.02950.43100.93593
Case 20.0960.0930.36480.36570.23160.38775
Case 30.08640.08373.0058 × 10−30.01430.43690.96832
Case 40.0800.07132.1318 × 10−32.1318 × 10−30.44520.99521
Case 50.26240.25420.10640.27930.25840.48054
Table 8. Comparison of results with other studies.
SystemLocationCOE (USD/kWh)Reference
PV/Diesel Generator/GridIndia0.127 [37]
PV/Biomass Gasifier/Electrolyzer/Hydrogen Tank units/Fuel CellEgypt0.2106[38]
PV/Wind/Grid/Diesel generatorItaly0.109[39]
PV/Wind/Fuel cellOman0.196[40]
Wind/Biogas genset/BatteryUnited Kingdom0.588[41]
PV/Wind/Diesel generator/Battery/Hydrogen StorageKayseri0.376[42]
Table 9. Job creation factors of different energy technologies [44].
Energy TechnologyJob Creation Factor (Jobs/MW)
PV2.70
Wind turbine1.10
Biogas generator0.19 jobs/GWh/yr
Battery0.01 jobs/MWh
Micro-hydro turbine1.50
Publisher’s Note: MDPI stays neutral with regard to jurisdictional claims in published maps and institutional affiliations.

